


Languages
Pages
Legal


Mertol, Rizkalla, Zia and Mirmiran 2006 CBC
1
FLEXURAL DESIGN USING HIGH-STRENGTH CONCRETE UP TO 20 KSI
H. C. Mertol, North Carolina State University, Raleigh, NC
S. Rizkalla, PhD, PEng, North Carolina State University, Raleigh, NC
P. Zia, PhD, PE, North Carolina State University, Raleigh, NC
A. Mirmiran, PhD, PE, Florida International University, Miami, FL
ABSTRACT
This paper summarizes the research findings of the fundamental
characteristics of high-strength concrete for the flexural design of bridge
girders. The main objective of the research is to provide recommended
provisions to the AASHTO-LRFD Bridge Design Specifications to extend the
use of concrete strength up to 18 ksi. A total of 15 plain concrete specimens
were tested under eccentric compression to evaluate the stress-strain
distribution of high-strength concrete in the compression zone of flexural
members. The variables considered in this investigation are the strength of
concrete (11 ksi to 16 ksi) and the age of the concrete. Two independent loads,
concentric and eccentric, were applied with a specific rate to the specimen so
as to locate neutral-axis at one face of the specimen and the maximum strain
at the opposite face. The specimens were 9 by 9 inches cross-section and 40
inches long. Stress-strain curves and stress block parameters for high-
strength concrete were obtained, evaluated and compiled with the results
available in the literature. The current equation for α1 specified by AASHTO
LRFD Bridge Design Specifications needs to be modified to show a reduction
for high-strength concrete. The current equation for β1 and current value for
ultimate concrete strain specified by AASHTO LRFD Bridge Design
Specifications is appropriate for high-strength concrete.
Keywords: Combined Compression and Flexure; High-Strength Concrete; Stress Block
Parameters; Tests
Mertol, Rizkalla, Zia and Mirmiran 2006 CBC
2
INTRODUCTION
The use of high-strength concrete (HSC) has become a common practice in recent years with
strengths ranging up to 20.0 ksi. With high-strength concrete longer distances can be spanned
by bridges with fewer beams which reduce the complexity of a project with reduced
construction time and cost. High strength concrete not only implies the increased strength but
also the increased durability which corresponds to a reduced maintenance of a bridge
structure with longer lifetime. The AASHTO LRFD Bridge Design Specifications1, first
published in 1994, limits its applicability to a maximum concrete strength of 10.0 ksi, unless
physical tests are made to establish the relationship between concrete strength and its other
properties. These limitations reflected the lack of research data at the time, rather than the
inability of the material to perform its intended function. Many design provisions stipulated
in the AASHTO LRFD Bridge Design Specifications1 are still based on test results obtained
from specimens with compressive strengths up to 6 ksi. The NCHRP has initiated separate
projects to expand the AASHTO LRFD Bridge Design Specifications1, allow broader use of
high-strength concrete, and meet the needs of the bridge design community. The objective of
this paper is to recommend revisions to the AASHTO LRFD Bridge Design Specifications1
to extend the applicability of its flexural and compression design provisions for reinforced
and prestressed concrete members to concrete strengths up to 18 ksi. The recommended
provisions are intended to be seamless and unified over the full range of concrete strengths.
When a simple reinforced concrete beam is loaded to failure, the critical section reaches its
ultimate capacity when the extreme compression fiber reaches the ultimate concrete strain.
The concrete in the compression zone has a stress distribution similar to its stress-strain
relationship which is referred to as the generalized (actual) stress block. As a part of this
research program, this paper focuses on the evaluation of the generalized stress block of
high-strength concrete ranging from 10.0 to 20.0 ksi in the compression zone of flexural
members.
Many researchers have investigated the stress-strain distribution of compression zone of
flexural concrete members. Hognestad et al.2, developed a test set-up to determine the stress-
strain distribution for concrete. Their specimens were mostly referred to as C-Shaped
Specimens or Eccentric Bracket Specimens. In their test set-up, they simulated the
compression zone of a flexural member on a rectangular cross-section by varying the axial
load and the moment on the section. In the research presented in this paper, the same method
was utilized to obtain the stress-strain distribution of high-strength concrete.
RESEARCH SIGNIFICANCE
This paper presents the research findings of 15 unreinforced high-strength concrete members
with concrete compressive strengths ranging from 11.0 to 16.0 ksi, tested under combined
axial and flexure to evaluate the stress-strain distribution of compression zone of flexural
concrete members. Stress-strain curves and stress block parameters for high strength concrete
were obtained, evaluated and compiled with the results available in the literature. The results

Mertol, Rizkalla, Zia and Mirmiran 2006 CBC
3
will serve as the basis for proposed revisions for the AASHTO LRFD Bridge Design
Specifications1 to increase the limits of the compressive strength of concrete to 18 ksi.
EXPERIMENTAL PROGRAM
TEST SPECIMENS
This test series consisted of 15 square specimens with 9x9x40 in. dimensions. A general view
of the concrete specimen is presented in Figure 1. The end sections of the eccentric bracket
specimens were heavily reinforced, while the test region in the middle of the specimens was
plain concrete. The main parameter was the concrete strength. Three different high-strength
concrete mix designs were used to cast the specimens. The target concrete compressive
strengths of these mixes at 28 days were 10.0 ksi, 14.0 ksi and 18.0 ksi. Three specimens
were tested for the target concrete compressive strength of 10.0 ksi while six specimens were
tested for each of the target concrete compressive strength of 14.0 and 18.0 ksi.
The ends sections of the specimens were reinforced with three #4 U-shaped longitudinal and
three #3 transverse reinforcement. Steel reinforcement configuration of the specimens is
shown in Figure 2. Furthermore, the ends of the specimens were confined with ½ in. thick 10
in. high rectangular steel tubes with holes on two opposite faces. The combination of the
steel tubes and heavy reinforcement ensures proper transfer of the axial load and moment and
eliminates possible localized failures at the ends of the specimens. The plain concrete test
section in the middle of the specimens is 16 in. long.
Figure 1 – General View Figure 2 – Steel Reinforcement Configuration

Mertol, Rizkalla, Zia and Mirmiran 2006 CBC
4
The reinforcement cages were assembled and placed into the top and the bottom rectangular
steel tubes. PVC pipes were placed into the holes on the steel tubes to have clearance for the
threaded rods which were used to connect the steel arms to the specimen. A picture of an
assembled steel tube is presented in Figure 3. The assembly of the formwork is presented in
Figure 4. The specimens were cast vertically. Three 4x8 in. cylinders were cast for each
specimen to be tested at the testing day.
Figure 3 – Assembled Steel Tube Figure 4 – Assembly of the Formwork
After casting the specimens the top concrete surfaces were covered with wet burlap and
plastic sheets. The cylinder molds were covered with companion lids. The specimens and the
cylinders were stripped 24 hours after casting and they were covered with wet burlap and
plastic sheets for a week. The specimens were then stored in the laboratory where the
temperature was maintained at approximately 72° F with 50 percent relative humidity until
the time of testing. The cylinders were prepared by grinding both end surfaces to remove
irregularities in the surfaces and to ensure that the ends were perpendicular to the sides of the
specimen.
MATERIAL PROPERTIES
Mix designs for three different concrete target strengths, 10.0, 14.0 and 18.0 ksi, were
developed after numerous laboratory and plant trial batches (Logan3). The mixture designs,
water to cementitious materials ratio and 28-day compressive strength of the concrete are
provided in Table 1.
Mertol, Rizkalla, Zia and Mirmiran 2006 CBC
5
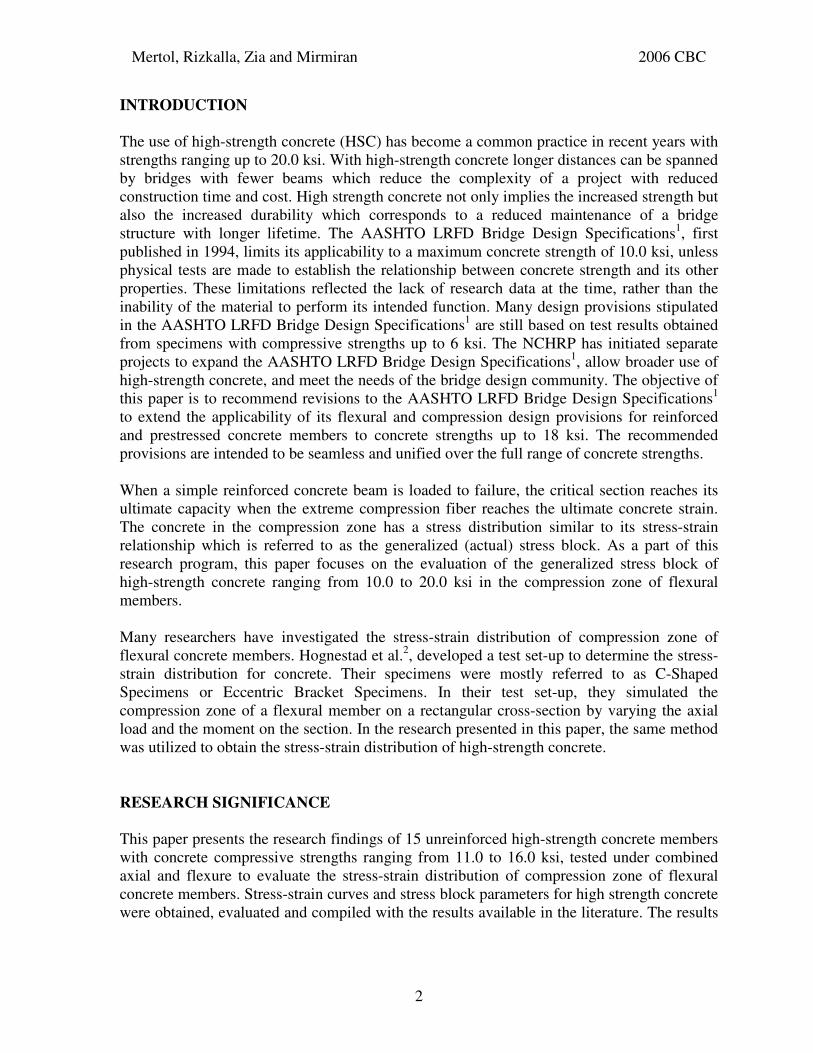
Table 1 – Three Mixture Designs for Target Concrete Strength 10.0, 14.0 and 18.0 ksi.
Target Strengths Material
10.0 ksi 14.0 ksi 18.0 ksi
Cement (lbs/yd3) 703 703 935
Microsilica Fume (lbs/yd3) 75 75 75
Fly Ash (lbs/yd3) 192 192 50
Sand (lbs/yd3) 1055 1315 1240
Rock (lbs/yd3) 1830 1830 1830
Water (lbs/yd3) 292 250 267
High Range Water-Reducing Agent (oz./cwt) 17 24 36
Retarding Agent (oz./cwt)* 3 3 3
w/cm 0.30 0.26 0.25
28-Day Compressive Strength (ksi) 11.5 14.4 17.1
* Ounces per 100 pounds of cementitious materials
The coarse aggregate was obtained from Carolina Sunrock Corporation. The aggregate
selected was #78M crushed stone with a nominal maximum size of 3/8 in.. Two types of fine
aggregate were used depending on the target compressive strength. The first type of fine
aggregate was a natural sand used by the Ready-Mixed Concrete Company in all of their
concrete mixtures. The second type of fine aggregate used was a manufactured sand known
as 2MS Concrete Sand produced by Carolina Sunrock Corporation. The cement used was a
Type I/II cement produced by Roanoke Cement Company. The fly ash producer was Boral
Material Technologies and the silica fume producer was Elkem Materials, Inc. Both the high-
range water-reducing and the retarding admixtures were manufactured by Degussa
Admixtures, Inc. The high-range water-reducing admixture (HRWRA) used was Glenium®
3030. DELVO® Stabilizer was used as the retarding admixture.
TEST METHOD AND TEST SET-UP
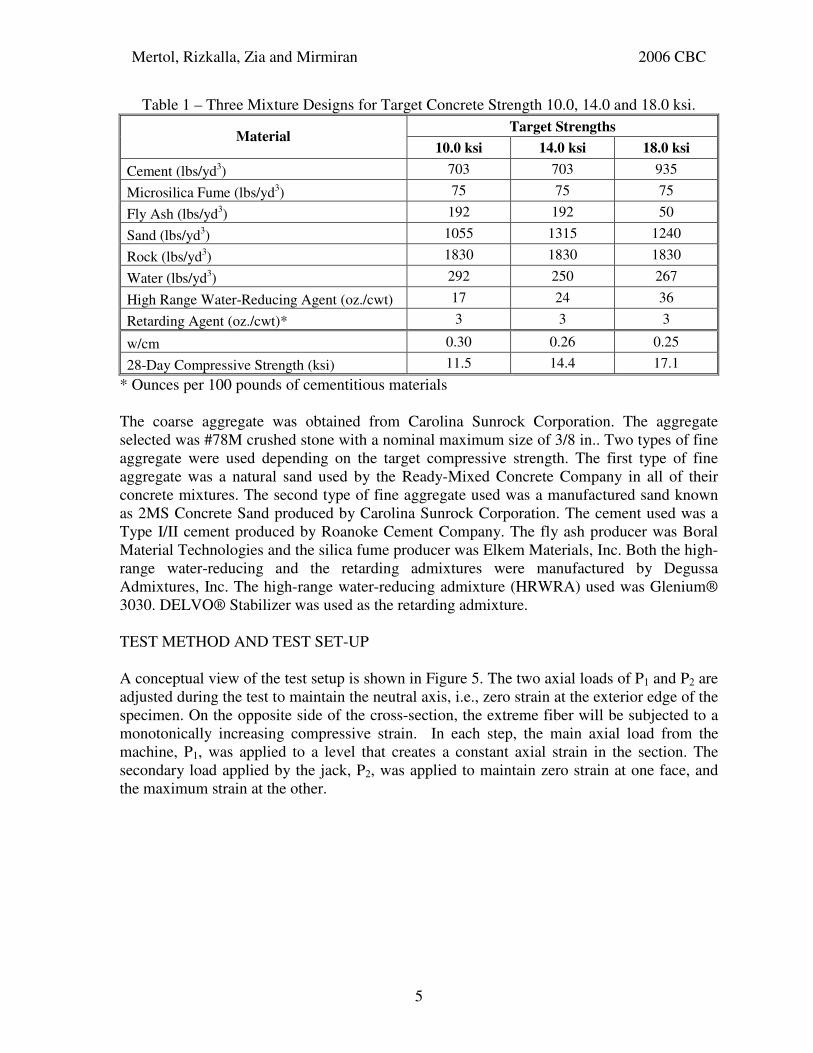
A conceptual view of the test setup is shown in Figure 5. The two axial loads of P1 and P2 are
adjusted during the test to maintain the neutral axis, i.e., zero strain at the exterior edge of the
specimen. On the opposite side of the cross-section, the extreme fiber will be subjected to a
monotonically increasing compressive strain. In each step, the main axial load from the
machine, P1, was applied to a level that creates a constant axial strain in the section. The
secondary load applied by the jack, P2, was applied to maintain zero strain at one face, and
the maximum strain at the other.
Mertol, Rizkalla, Zia and Mirmiran 2006 CBC
6
Figure 5 – Test Set-Up
The test set-up used in this research was different from the usual eccentric bracket tests. Two
steel moment arms were connected to a rectangular concrete specimen confined with
rectangular steel tubes at the ends. These steel tubes had holes which enabled the transfer of
forces from the arm to the concrete section by using threaded rods. Each steel arm consisted
of two 24 in. long C8x11.5 in. channel sections welded to two 9x1x24 in. steel plates at the
top and the bottom. ½ in. stiffeners were used along the section. Two roller connections were
constructed to eliminate the end restrictions due to the applied axial load from the machine.
Each roller connection consisted of six 1 in. diameter rollers and two curved plates, tapering
through inside and outside, respectively. The roller connection assembly was fixed to side
plates which were released at the time of testing. Both the steel arms and the roller
connections were designed to have a factor of safety at least 2.0 against yielding to ensure a
failure in the test region.
INSTRUMENTATION
The main axial load, P1, applied by the 2,000,000 lbs. Baldwin-Lima-Hamilton load
controlled hydraulic compression machine, was measured by an internal load cell which is
mounted in the machine. The secondary load, P2, was applied with a 120,000 lbs. Enerpac
manual-hydraulic jack and was measured by a 100,000 lbs. Strainsert Universal Flat Load
Cell.
Each specimen was instrumented with PL-60-3L concrete strain gages supplied by Texas
Measurements, Inc. The length of the strain gages were 2.4 in. A total of 9 strain gages were
located on each test specimen. Two of them were applied on the zero strain face. Four of
them were mounted on the two sides of the specimen. Three of them were located on the
compression side of the specimen, one of which was used to measure the transverse strain of
concrete. Three 1 in. linear variable displacement transducers (LVDT) were placed at the top,

Mertol, Rizkalla, Zia and Mirmiran 2006 CBC
7
bottom and mid-section in order to obtain the deflected shape of the specimen and to
incorporate the secondary moment effects. The location of the instrumentation for test
specimens is illustrated in Figure 6.
Figure 6 – Location of the Strain Gages for Test Specimens
The main and the secondary loads P1, P2, stroke, 3 LVDT readings and 9 strain gages were
recorded during the tests by a data acquisition system.
TEST PROCEDURE
The roller connections were placed into machine supplying the main axial load. The
specimen is positioned, aligned and leveled on the roller connection. A timber frame was
assembled around the specimen to ensure the stability of the test set-up after failure of
concrete specimen. The bottom and top arms were placed and connected to the specimen by
using threaded rods. The load cell and the jack, supplying the secondary load, were placed on
the top arm. The bottom arm and the top arm assembly were connected to each other by
using 1 in. threaded rod. The top roller connection was positioned and leveled. A thin layer
of hydrostone (gypsum cement) was placed between the roller connections and the specimen
at the top and the bottom. The instrumentation was connected to the data acquisition system.
A crane cable was attached to the top arm before releasing the roller connections. The
specimen was leveled by using the crane and the readings from the instrumentation were
balanced to zero. A very small axial load was applied on the specimen before the crane cable
was released. As the main axial load started to increase incrementally, the secondary load
was applied by a hydraulic jack and a hand-pump to maintain neutral axis on one face. The
loading rate was 2 microstrains per second on the compression face of the specimen. The
duration of each test was around 25 minutes. The tests were stopped when the concrete failed
in an explosive manner. Three cylinders were tested with each specimen in accordance with
ASTM C 39 on the same day.

Mertol, Rizkalla, Zia and Mirmiran 2006 CBC
8
TEST RESULTS AND DISCUSSIONS
A total of 15 specimens were tested with cylinder concrete strengths ranged from 10.0 to
16.0 ksi. The cylinder strength, age at testing, the loading rate and the ultimate compressive
strain achieved by the specimens are summarized in Table 2. All the specimens had similar
explosive failure mode. No cracks were observed until failure. Typical failure mode for the
eccentric brackets is shown in Figure 7.
Table 2 – Tabulated Test Results
Specimen 'cf at Testing
(ksi)
Age at Testing
(days)
Loading Rate
( / secµε )
Ultimate Strain
( µε )
10EB#1 11.0 63 12.2 3738
10EB#2 11.4 109 2.0 3138
10EB#3 11.7 111 2.4 3407
14EB#1 14.6 49 2.3 3316
14EB#2 14.3 51 1.8 3162
14EB#3 14.7 52 2.2 3177
14EB#4 15.0 57 2.3 3032
14EB#5 15.4 100 5.3 2868
14EB#6 15.2 101 4.1 2954
18EB#1 15.8 76 2.2 3684
18EB#2 16.0 77 2.3 3364
18EB#3 15.6 81 2.4 2914
18EB#4 15.8 82 2.6 3306
18EB#5 16.0 83 2.1 3144
18EB#6 15.5 84 2.1 3404
Figure 7 – Typical Failure Mode for Eccentric Bracket Specimens (10EB#3)
Mertol, Rizkalla, Zia and Mirmiran 2006 CBC
9
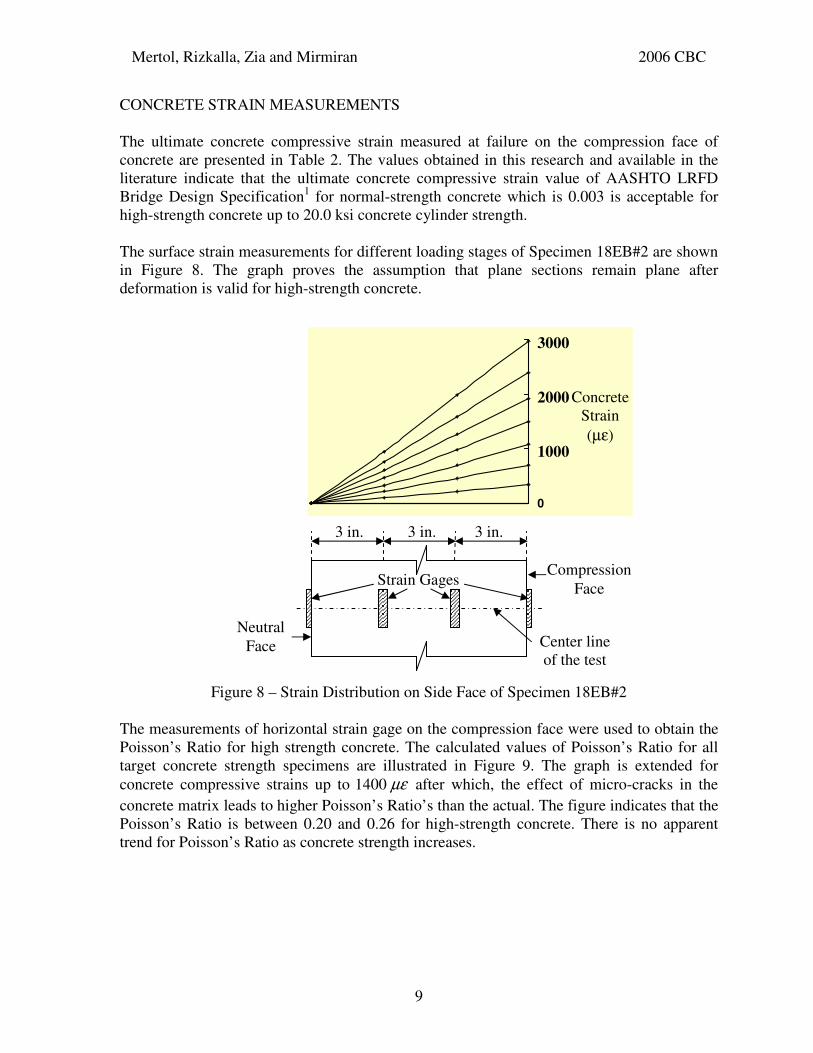
CONCRETE STRAIN MEASUREMENTS
The ultimate concrete compressive strain measured at failure on the compression face of
concrete are presented in Table 2. The values obtained in this research and available in the
literature indicate that the ultimate concrete compressive strain value of AASHTO LRFD
Bridge Design Specification1 for normal-strength concrete which is 0.003 is acceptable for
high-strength concrete up to 20.0 ksi concrete cylinder strength.
The surface strain measurements for different loading stages of Specimen 18EB#2 are shown
in Figure 8. The graph proves the assumption that plane sections remain plane after
deformation is valid for high-strength concrete.
Figure 8 – Strain Distribution on Side Face of Specimen 18EB#2
The measurements of horizontal strain gage on the compression face were used to obtain the
Poisson’s Ratio for high strength concrete. The calculated values of Poisson’s Ratio for all
target concrete strength specimens are illustrated in Figure 9. The graph is extended for
concrete compressive strains up to 1400 µε after which, the effect of micro-cracks in the
concrete matrix leads to higher Poisson’s Ratio’s than the actual. The figure indicates that the
Poisson’s Ratio is between 0.20 and 0.26 for high-strength concrete. There is no apparent
trend for Poisson’s Ratio as concrete strength increases.
0
1000
2000
3000
Concrete
Strain
(µε)
Strain Gages Compression
Face
Neutral
Face Center line
of the test
region
3 in. 3 in. 3 in.

Mertol, Rizkalla, Zia and Mirmiran 2006 CBC
10
0
0.1
0.2
0.3
0.4
0.5
0.6
0.7
0 200 400 600 800 1000 1200 1400
Average Compressive Face Strain (µεµεµεµε)
Po
iss
on
's R
ati
o
10EB#310EB#414EB#114EB#214EB#314EB#414EB#514EB#618EB#118EB#218EB#318EB#418EB#518EB#6
Figure 9 – Poisson’s Ratio for Test Specimens
STRESS BLOCK PARAMETERS
The approach presented by Hognestad et al.2 was used to determine the stress-strain
relationship for each specimen. This approach can be used to calculate the concrete stress cf
as a function of measured strain at the most compressed fiber cε and the applied stresses of
and om . The following equations were obtained from equilibrium of external and internal
loads and moments. Note that, the eccentricities due to deflection of the member were also
considered in the calculation of applied moment, M .
( )∫==+=c
xx
c
o dbc
bcfPPC
ε
εεσε
0
21 Equation 1
( )2
2
1 1 2 2 2
0
c
o x x x
c
bcM Pa P a m bc d
ε
σ ε ε εε
= + = = ∫ Equation 2
where, C is the total applied load, M is the total applied moment, 1P is the main axial load,
2P is the secondary load, 1a and 2a are the eccentricities with respect to the neutral surface,
b is the width of the section, c is the depth of neutral axis,
bc
PPfo
21 += Equation 3

Mertol, Rizkalla, Zia and Mirmiran 2006 CBC
11
and
2
2211
bc
aPaPmo
+= Equation 4
are the applied stresses. Some of these definitions are illustrated in Figure 10.
Figure 10 – Eccentric Bracket Specimen
Differentiating the last terms of the equations for C and M with respect to c
ε would yield
the following equations.
o
c
o
cc fd
df+=
εεσ Equation 5
o
c
o
cc md
dm2+=
εεσ Equation 6
Using these equations, two similar stress-strain relationships were obtained for each eccentric
bracket specimen and the average of these two was used as the stress-strain relationship of
the specimen. These stress-strain relationships were used to calculate the stress block
parameters for high-strength concrete.
A generalized (actual) stress block is defined by three parameters, 1k , 2k and 3k . The
parameter 1k is defined as the ratio of the average compressive stress to the maximum
compressive stress. The parameter 2k is the ratio of the depth of the resultant compressive
force to the depth of neutral axis. The parameter 3k is the ratio of the maximum compressive

Mertol, Rizkalla, Zia and Mirmiran 2006 CBC
12
stress ( maxσ ) to the compressive strength of concrete cylinder ( cf ' ). The design values of the
stress block parameters are determined at the ultimate strain ( cuε ), which corresponds to the
maximum moment of the section. These parameters are shown in Figure 11.
Figure 11 – Stress Block Parameters for Rectangular Sections
The 3k , 31kk , and 2k value can be obtained from the equilibrium of the external and internal
forces, as follows:
cfk
'
max3
σ= Equation 7
bcfkkC c'31= → bcf
Ckk
c'31 = Equation 8
( )ckdbcfkkM c 231 ' −= → ( )cC
Mk −= 12 Equation 9
The three-parameter generalized stress block can be reduced to a two-parameter equivalent
rectangular stress block, by keeping the resultant of the compression force at the mid-depth
of the assumed rectangular stress block. The two parameters of 1α and 1β are presented in
Figure 11 and can be defined as:
bcfC c'11βα= Equation 10
−=
2' 1
11
cdbcfM c
ββα Equation 11
where
2
31
12k
kk=α Equation 12
21 2k=β Equation 13
c
b εcu k3f’c
k2c
C = k1k3f’cbc
d
As
Section
Strain
Distribution
Generalized
Stress Block
Parameters
α1f’c
β1c
β1c/2
C = α1β1f’cbc
Rectangular
Stress Block
Parameters
Mertol, Rizkalla, Zia and Mirmiran 2006 CBC
13
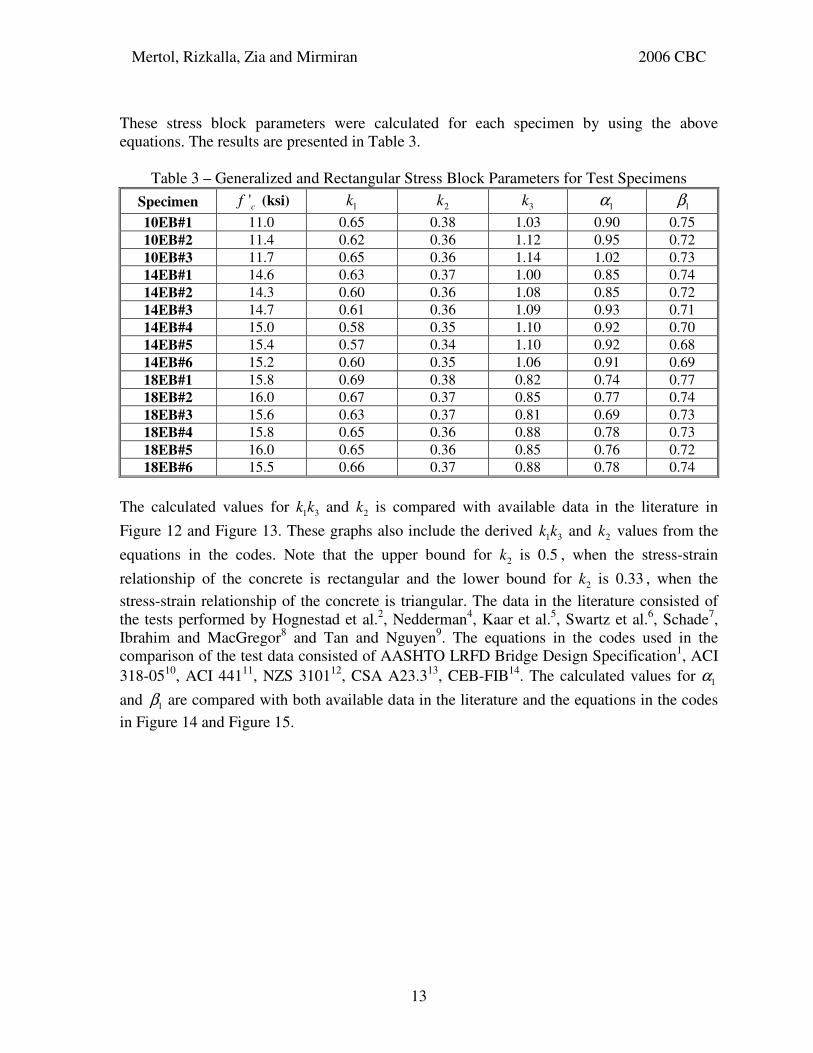
These stress block parameters were calculated for each specimen by using the above
equations. The results are presented in Table 3.
Table 3 – Generalized and Rectangular Stress Block Parameters for Test Specimens
Specimen 'c
f (ksi) 1k 2k 3k 1α 1β
10EB#1 11.0 0.65 0.38 1.03 0.90 0.75
10EB#2 11.4 0.62 0.36 1.12 0.95 0.72
10EB#3 11.7 0.65 0.36 1.14 1.02 0.73
14EB#1 14.6 0.63 0.37 1.00 0.85 0.74
14EB#2 14.3 0.60 0.36 1.08 0.85 0.72
14EB#3 14.7 0.61 0.36 1.09 0.93 0.71
14EB#4 15.0 0.58 0.35 1.10 0.92 0.70
14EB#5 15.4 0.57 0.34 1.10 0.92 0.68
14EB#6 15.2 0.60 0.35 1.06 0.91 0.69
18EB#1 15.8 0.69 0.38 0.82 0.74 0.77
18EB#2 16.0 0.67 0.37 0.85 0.77 0.74
18EB#3 15.6 0.63 0.37 0.81 0.69 0.73
18EB#4 15.8 0.65 0.36 0.88 0.78 0.73
18EB#5 16.0 0.65 0.36 0.85 0.76 0.72
18EB#6 15.5 0.66 0.37 0.88 0.78 0.74
The calculated values for 1 3k k and 2k is compared with available data in the literature in
Figure 12 and Figure 13. These graphs also include the derived 1 3k k and 2k values from the
equations in the codes. Note that the upper bound for 2k is 0.5 , when the stress-strain
relationship of the concrete is rectangular and the lower bound for 2k is 0.33 , when the
stress-strain relationship of the concrete is triangular. The data in the literature consisted of
the tests performed by Hognestad et al.2, Nedderman
4, Kaar et al.
5, Swartz et al.
6, Schade
7,
Ibrahim and MacGregor8 and Tan and Nguyen
9. The equations in the codes used in the
comparison of the test data consisted of AASHTO LRFD Bridge Design Specification1, ACI
318-0510
, ACI 44111
, NZS 310112
, CSA A23.313
, CEB-FIB14
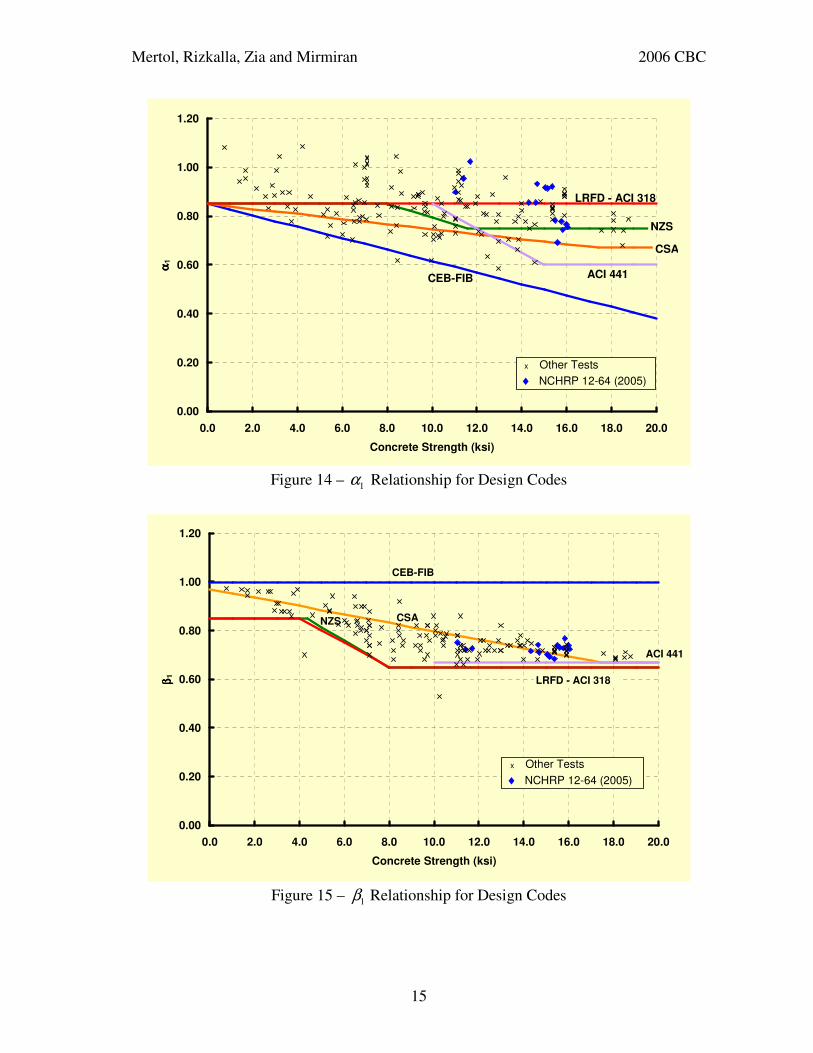
. The calculated values for 1α
and 1β are compared with both available data in the literature and the equations in the codes
in Figure 14 and Figure 15.

Mertol, Rizkalla, Zia and Mirmiran 2006 CBC
14
0.0
0.2
0.4
0.6
0.8
1.0
1.2
0.0 2.0 4.0 6.0 8.0 10.0 12.0 14.0 16.0 18.0 20.0
Concrete Strength (ksi)
k1k
3
10EB#210EB#310EB#414EB#114EB#214EB#314EB#414EB#514EB#618EB#118EB#218EB#318EB#418EB#518EB#6Other Tests
CEB-FIB
NZS
LRFD - ACI
CSA
ACI 441
Figure 12 – 1 3k k vs. '
cf for Eccentric Bracket Specimens
0
0.1
0.2
0.3
0.4
0.5
0.6
0 2 4 6 8 10 12 14 16 18 20
Concrete Strength (ksi)
k2
10EB#210EB#310EB#414EB#114EB#214EB#314EB#414EB#514EB#618EB#118EB#218EB#318EB#418EB#518EB#6Other Tests
CEB-FIB
NZS
LRFD - ACI 318
CSA
ACI 441
Figure 13 – 2k vs. '
cf for Eccentric Bracket Specimens
Mertol, Rizkalla, Zia and Mirmiran 2006 CBC
15
0.00
0.20
0.40
0.60
0.80
1.00
1.20
0.0 2.0 4.0 6.0 8.0 10.0 12.0 14.0 16.0 18.0 20.0
Concrete Strength (ksi)
αα αα1
CEB-FIB
NZS
LRFD - ACI 318
CSA
ACI 441
x Other Tests
♦ NCHRP 12-64 (2005)
Figure 14 – 1α Relationship for Design Codes
0.00
0.20
0.40
0.60
0.80
1.00
1.20
0.0 2.0 4.0 6.0 8.0 10.0 12.0 14.0 16.0 18.0 20.0
Concrete Strength (ksi)
ββ ββ1
CEB-FIB
NZS
LRFD - ACI 318
CSA
ACI 441
x Other Tests
♦ NCHRP 12-64 (2005)
Figure 15 – 1β Relationship for Design Codes
Mertol, Rizkalla, Zia and Mirmiran 2006 CBC
16
The graph for 1α indicates that as concrete strength exceeds 10.0 ksi, 1α tends to decrease
slightly. The current equation for 1α ( 1 0.85α = for all concrete strengths) specified by
AASHTO LRFD Bridge Design Specifications1
appears to overestimate the value of 1α for
high-strength concrete. An equation that represents the lower bound of the experimental data
such as that of CSA A23.313
would seem more appropriate for high-strength concrete up to
20.0 ksi.
The data for 1β obtained in this research are consistent with the data reported in the
literature. The current equation for 1β ( 1 0.65β = for ' 8c
f ksi> ) specified by AASHTO
LRFD Bridge Design Specifications1 represents well the lower bound value and should be
applicable for high-strength concrete up to 20.0 ksi.
SUMMARY AND CONCLUSION
A total of 15 unreinforced high-strength concrete columns were tested under eccentric
compression to simulate the compression zone of a flexural member by varying the axial load
and the moment at the section. The dimensions of the specimens were 9x9x40 in. and the
cylinder strength of concrete ranged from 10.0 to 16.0 ksi. The concept developed by
Hognestad et al. was adopted to accommodate largest possible specimen size. The
deflections, the strain on concrete surface, axial load and moment were monitored. Stress-
strain curves, ultimate concrete compressive strain and Poisson’s Ratio were obtained for
high strength concrete. Based on the test results and the data reported in the literature up to
20.0 ksi:
1. The ultimate concrete compressive strain value of 0.003 specified by AASHTO LRFD
Bridge Design Specifications1 is acceptable for high-strength concrete up to 20.0 ksi
cylinder concrete strength.
2. The assumption of plane sections remain plane after deformation is valid for high
strength concrete.
3. Poisson’s Ratio is between 0.20 and 0.26 for high-strength concrete. There is no apparent
trend for Poisson’s Ratio as concrete strength increases.
4. As concrete strength increases, 1α decreases. The current equation for 1α ( 1 0.85α = for
all concrete strengths) specified by AASHTO LRFD Bridge Design Specifications1 needs
to be modified to show a reduction of 1α for high-strength concrete up to 20.0 ksi
cylinder concrete strength.
5. The current equation for 1β ( 1 0.65β = for ' 8c
f ksi> ) specified by AASHTO LRFD
Bridge Design Specifications1 is appropriate for high-strength concrete up to 20.0 ksi
cylinder concrete strength.

Mertol, Rizkalla, Zia and Mirmiran 2006 CBC
17
ACKNOWLEDGEMENTS
The authors would like to acknowledge the support of the NCHRP through the project 12-64
and the Senior Program Officer, David Beal. The authors also thank the contributions of
Henry Russell of Henry Russell, Inc. and Robert Mast of Berger/ABAM Engineers, Inc. who
serve as consultants on the project. The findings and the conclusion reported here are of a
preliminary nature and are those of the authors alone, and not of the supporting agency. This
project would not be possible without the contribution of Ready Mixed Concrete Company
and the personnel of the Constructed Facilities Laboratory. The efforts by the graduate
assistants, Andrew Logan, SungJoong Kim, Zhenhua Wu and WonChang Choi are also
greatly appreciated.
REFERENCES
1. AASHTO LRFD Bridge Design Specifications, Third Edition, American Association of
State Highway and Transportation Officials, Washington DC, 2004.
2. Hognestad, E., Hanson, N. W. and McHenry, D., “Concrete Stress Distribution in
Ultimate Strength Design”, ACI Journal, Vol. 52, No. 4, Dec. 1955, pp. 455-479.
3. Logan, A. T., “Short-Term Material Properties of High-Strength Concrete”, M.S. Thesis,
Department of Civil, Construction and Environmental Engineering, North Carolina State
University, Raleigh, NC, Jun. 2005, 116 p.
4. Nedderman, H., "Flexural Stress Distribution in Very-High Strength concrete”, M.S.
Thesis, Civil Engineering Department, University of Texas at Arlington, Dec. 1973, 182
p.
5. Kaar, P. H., Hanson, N. W. and Capell, H. T., “Stress-Strain Characteristics of High
Strength Concrete”, ACI Special Publication-55, Douglas McHenry International
Symposium on Concrete and Concrete Structures, Michigan, Aug. 1978, pp. 161-185.
6. Swartz, S. E., Nikaeen, A., Narayan Babu, H. D., Periyakaruppan, N. and Refai, T. M. E.,
“Structural Bending Properties of Higher Strength Concrete”, ACI Special Publication-
87, High-Strength Concrete, Sept. 1985, pp. 145-178.
7. Schade, J. E., “Flexural Concrete Stress in High Strength Concrete Columns”, M. S.
Thesis, Civil Engineering Department, the University of Calgary, Calgary, Alberta,
Canada, Sept. 1992, 156 p.
8. Ibrahim, H. H. H. and MacGregor, G., “Modification of the ACI Rectangular Stress
Block for High-Strength Concrete”, ACI Structural Journal, Vol. 94, No. 1, Jan.-Feb.
1997, pp. 40-48.
9. Tan, T.H., Nguyen, N. B., “Flexural Behavior of Confined High Strength Concrete
Columns”, ACI Structural Journal, Vol. 102, No. 2, Mar.-Apr. 2005, pp. 198-205.
10. ACI Committee 318, “Building Code Requirements for Structural Concrete (ACI 318-05)
and Commentary (318R-05)”, American Concrete Institute, Farmington Hills, MI, 2005,
430 p.
11. ACI Committee 441, “High Strength Concrete Columns: State of the Art (ACI 441R-
96)”, American Concrete Institute, Detroit, 1996, 13 p.
12. New Zealand Concrete Structures Standards (NZS 3101), New Zealand Standards, 1995.

Mertol, Rizkalla, Zia and Mirmiran 2006 CBC
18
13. Canadian Standards Association, “Design of Concrete Structures, CSA A23.3 1994”,
Rexdale, Ontario, 1994, pp.199.
14. CEB-FIB Model Code 1990, Thomas Telford Services Ltd., London, for Comité Euro-
International du Béton, Laussane, 1993, 437 p.
Top Related