


Languages
Pages
Legal

PakistanTelecommunicationsReport Q1 2008
Published quarterly by BUSINESS MONITOR INTERNATIONAL LTD
Including 5-year industry forecasts
© 2008 Business Monitor International. All rights reserved.All information, analysis, forecasts and data provided by Business Monitor International Ltd is for the exclusive use of subscribing persons or organisations (including those using the service on a trial basis). All such content is copyrighted in the name of Business Monitor International, and as such no part of this content may be reproduced, repackaged, copied or redistributed without the express consent of Business Monitor International Ltd.
All content, including forecasts, analysis and opinion, has been based on information and sources believed to be accurate and reliable at the time of publishing. Business Monitor International Ltd makes no representation of warranty of any kind as to the accuracy or completeness of any information provided, and accepts no liability whatsoever for any loss or damage resulting from opinion, errors, inaccuracies or omissions affecting any part of the content.
Business Monitor InternationalMermaid House, 2 Puddle DockLondon EC4V 3DS UKTel: +44 (0)20 7248 0468Fax: +44 (0)20 7248 0467email: [email protected]: http://www.businessmonitor.com
ISSN: 1748-4715

Business Monitor International Mermaid House, 2 Puddle Dock, London, EC4V 3DS, UK Tel: +44 (0) 20 7248 0468 Fax: +44 (0) 20 7248 0467 Email: [email protected] Web: http://www.businessmonitor.com
© 2008 Business Monitor International. All rights reserved. All information contained in this publication is copyrighted in the name of Business Monitor International, and as such no part of this publication may be reproduced, repackaged, redistributed, resold in whole or in any part, or used in any form or by any means graphic, electronic or mechanical, including photocopying, recording, taping, or by information storage or retrieval, or by any other means, without the express written consent of the publisher.
DISCLAIMER All information contained in this publication has been researched and compiled from sources believed to be accurate and reliable at the time of publishing. However, in view of the natural scope for human and/or mechanical error, either at source or during production, Business Monitor International accepts no liability whatsoever for any loss or damage resulting from errors, inaccuracies or omissions affecting any part of the publication. All information is provided without warranty, and Business Monitor International makes no representation of warranty of any kind as to the accuracy or completeness of any information hereto contained.
Pakistan Telecommunications Report Q1 2008 Including 4-year industry forecasts by BMI
Part of BMI's Industry Report & Forecasts Series
Published by: Business Monitor International
Publication Date: January 2008

Pakistan Telecommunications Report Q1 2008
© Business Monitor International Ltd Page 2
Pakistan Telecommunications Report Q1 2008
© Business Monitor International Ltd Page 3
CONTENTS
Executive Summary .........................................................................................................................................5
Market Data Analysis .......................................................................................................................................6
Mobile......................................................................................................................................................................................................................... 6 Table: Pakistan Mobile Market, September 2007 .................................................................................................................................................. 7 Table: Mobilink Market Share 2005-07................................................................................................................................................................. 8 Table: Pakistan Mobile Market, Net Additions 9M07 – Leading Operators .......................................................................................................... 8 Table: Revenues from Data/Voice Services per Mobile Operator, 2007.............................................................................................................. 10
Fixed-Line................................................................................................................................................................................................................. 11 Table: Pakistan Fixed-Line Market, September 2007 .......................................................................................................................................... 12 Table: Pakistan Wireless Local Loop Market, October 2007 .............................................................................................................................. 13 Table: Pakistan Wireless Local Loop Market Net Additions, June 2006-October 2007 ...................................................................................... 13
Regulatory Developments ......................................................................................................................................................................................... 14
Mobile Operator Data .....................................................................................................................................16
Table: Mobilink ................................................................................................................................................................................................... 16 Table: Telenor ..................................................................................................................................................................................................... 17 Table: Ufone........................................................................................................................................................................................................ 18 Table: Warid Telecom ......................................................................................................................................................................................... 18
Industry Forecast Scenario...........................................................................................................................19
Mobile....................................................................................................................................................................................................................... 19 Table: Pakistan Telecoms Sector – Mobiles – Historical Data & Forecasts ....................................................................................................... 19
Fixed-Line................................................................................................................................................................................................................. 21 Table: Pakistan Telecoms Sector – Fixed-line/WLL – Historical Data & Forecasts ........................................................................................... 21
Internet ..................................................................................................................................................................................................................... 22 Table: Pakistan Telecoms Sector – Internet – Historical Data & Forecasts........................................................................................................ 22
Business Environment ..................................................................................................................................23
Asia...................................................................................................................................................................................................................... 23 Pakistan ............................................................................................................................................................................................................... 26 Table: Business Environment Rankings ............................................................................................................................................................... 27 Pakistan Telecoms Business Environment SWOT Analysis.................................................................................................................................. 28
Company Profiles...........................................................................................................................................29
Vendor Profile: India, China Remain Top Priorities For Ericsson...................................................................................................................... 29 Table: Top Five Mobile Phone Vendors By Shipment Q307................................................................................................................................ 29 Table: Top 10 Markets In Sale............................................................................................................................................................................. 31
Operators ........................................................................................................................................................32
Pakistan Telecommunications Company Ltd (PTCL) ............................................................................................................................................... 32 TeleCard ................................................................................................................................................................................................................... 34 Mobilink.................................................................................................................................................................................................................... 36 Telenor Pakistan....................................................................................................................................................................................................... 38
Warid Telecom..................................................................................................................................................................................................... 40
Appendix: Competitive Landscape ..............................................................................................................42
Pakistan Telecommunications Report Q1 2008
© Business Monitor International Ltd Page 4
Market Overview ...................................................................................................................................................................................................... 42 Table: Key Companies – Key Acquisitions in Pakistan Telecommunications Sector ........................................................................................... 43
Competitor Analysis ......................................................................................................................................44
Table: Key Companies – Pakistan Telecommunications Sector........................................................................................................................... 44 Key Players............................................................................................................................................................................................................... 45
Fixed-Line............................................................................................................................................................................................................ 45 Table: Regional Fixed-Line Penetration Overview.............................................................................................................................................. 45 Mobile.................................................................................................................................................................................................................. 46 Table: Regional Mobile Penetration Overview.................................................................................................................................................... 46 Internet ................................................................................................................................................................................................................ 47 Table: Regional Internet Penetration Overview................................................................................................................................................... 47
Macroeconomic Forecast Scenario..............................................................................................................48
Table: GDP And Population................................................................................................................................................................................ 50
BMI Forecast Modelling.................................................................................................................................51
How we generate our industry forecasts ................................................................................................................................................................... 51 Telecommunications Industry ................................................................................................................................................................................... 51 Sources ..................................................................................................................................................................................................................... 52

Pakistan Telecommunications Report Q1 2008
© Business Monitor International Ltd Page 5
Executive Summary
Much of the South Asia region is home to high levels of telecoms growth; but in Pakistan infrastructure
and subscriber growth patterns seem unrivalled with the telecoms sector experiencing unusually high
growth. Total teledensity of Pakistan’s telecoms sector was 46.9% in June 2007, well ahead of Sri Lanka
on 37%, India (perhaps surprisingly) on 17% and Bangladesh on 15%.
It is Pakistan’s mobile market that is driving the vibrancy of the market, and in turn it is high levels of
competition and investment, as well as low tariffs and great consumer demand that are powering mobile
growth. By the end of 2007, BMI expects there will be about 77mn mobile subscribers in Pakistan, and
this figure is likely to increase to 135mn by the end of our forecast period in 2012. This means that
approximately 80% of the population will have access to a mobile handset in five years time.
Orascom-owned Mobilink remains market leader with a 41% market share, as it continues to invest in its
network, offer attractive promotions and offer new services (such as WiMAX). However, competition is
becoming more intense, and BMI expects that sometime in 2008, Telenor will push Ufone hard for
second place in Pakistan’s mobile market. Although Ufone has a 22% market share compared with
Telenor’s 18%, the Norwegian company can boast approximately 6mn net additions during the first nine
months of the year, some 500,000 more than Ufone.
There are few growth opportunities for Pakistan’s fixed-line operators, but the increased deployment of
WLL offers a glimmer of hope – the number of subscribers grew by 80% year-on-year (y-o-y) in 2006-
2007. However, internet usage is also becoming more popular and although broadband services remain
costly, we will watch closely the effect of Pakistan Telecommunication Company Limited (PTCL)’s
privatisation, and how the operator could turn its attention towards a growing internet market in Pakistan.
Despite the rapid growth and the high levels of investment, Pakistan remains nearer the bottom than the
top of BMI’s Business Environment Rankings. Aside from the surprising hike in taxation and regulatory
fees on Pakistan’s telecoms operators (up by 32% y-o-y in 2006-07), we maintain that Pakistan’s
telecoms market has an excellent business environment. However, there are concerns that inward
investment could be moderated in the short-term at least, by political instability, which could cause
economic uncertainties. The government will do all it can to ensure that Pakistan’s telecoms sector retains
its momentum, and this it hopes to do by encouraging investment from the world’s largest handset
manufacturers. Could Pakistan become a manufacturing base for the likes of Nokia, Samsung, Sony
Ericsson and Motorola? The government points to an expectant market, highly-skilled and cheap labour
and a convenient base for other high-growth markets in the region. It will be quite something if the
Pakistani government pulls it off.

Pakistan Telecommunications Report Q1 2008
© Business Monitor International Ltd Page 6
Market Data Analysis
Mobile
Low tariffs, high consumer demand,
intense competition and a government and
regulator ready to welcome inward
investment have created a powerful
impetus for growth in Pakistan’s mobile
market. During the first nine months of
2007, there were 21.77mn net additions in
Pakistan’s wireless market, an average of
2.4mn per month. This took the aggregate
total to just over 70mn by the end of
September 2007, accounting for y-o-y
growth of 69%. However, the third quarter
of the year has witnessed a very slight
slowdown in growth, as it was the first
quarter of the year in which there were
fewer than 7mn net additions. A total of 6.85mn new subscribers in a three-month period still represent
substantial growth.
The government must take its credit for
encouraging inward investment from the
likes of Telenor and Warid Telecom that
has helped to drive mobile growth. The
Pakistan Telecommunications Authority
has also rightfully been the subject of
plaudits in helping to create a transparent
and well-regulated industry. And it has
been this investment that has been so
crucial to recent growth. Before 2005,
when Telenor and Warid Telecom first
entered Pakistan’s mobile market, there
was only one dominant operator –
Mobilink – supported by a group of also- rans including Ufone, Paktel and Instaphone. Following the
arrival of new operators in H105, Pakistan welcomed nearly 3mn new subscribers in the second quarter,
while during the remainder of 2005, there were some 9mn new mobile customers added.
Pakistan Mobile Market Growth 2005-07
0
10
20
30
40
50
60
70
80
Mar
-05
Jun-
05
Sep
-05
Dec
-05
Mar
-06
Jun-
06
Sep
-06
Dec
-06
Mar
-07
Jun-
07
Sep
-07
No of Subscribers (mn) No of Net Additions (mn)
Source: BMI
0
100
200
300
400
500
600
700
800
Tel
enor
CM
Pak
Mob
ilink
War
id
Ufo
ne
Inst
apho
ne
In v es tm en t (U S $m n ) b y Mo b ile O p erato r 2006-07
S ourc e: P T A

Pakistan Telecommunications Report Q1 2008
© Business Monitor International Ltd Page 7
Investment levels continue to impress, as Pakistan’s mobile operators now fight it out for market share
amid network enhancement projects. A total of US$2.7bn was invested in infrastructure by Pakistan’s
mobile operators in the fiscal year ending June 2007. Meanwhile, total revenues amounted to PKR133bn
over the year, accounting for 48% y-o-y growth. Low tariffs, however, did cause a fall in average revenue
per user (ARPU), which at an average of US$3.2 is very low.
Table: Pakistan Mobile Market, September 2007
Operator No. of Subscribers (mn) Market Share (%)
Mobilink 28.572 40.8
Ufone 15.421 22.0
Telenor 12.578 18.0
Warid Telecom 11.867 16.9
CMPak 1.233 1.8
Instaphone 0.337 0.5
Total 70.008 100
Source: PTA, BMI
The first nine months of 2007 have been fascinating to monitor, with Telenor trumping its competitors
during the first quarter (2.4mn net additions), only for Ufone surprisingly to come to life and add more
new subscribers during the second quarter (2.4mn net additions) than any of its rivals. In the third quarter,
the only operator to attract more than 2mn new subscribers was market leader Mobilink (2.1mn net
additions). This it did through a variety of promotions, such as additional free SMS, and it ended
September 2007 with more than 28.5mn subscribers and an approximate 41% share of the market.
However, as a result of increasing pressure from its competitors, Mobilink has faced a steady decline in
market share from the days when it boasted well over 60% of the market – the last time this happened
was June 2005.
Pakistan Telecommunications Report Q1 2008
© Business Monitor International Ltd Page 8
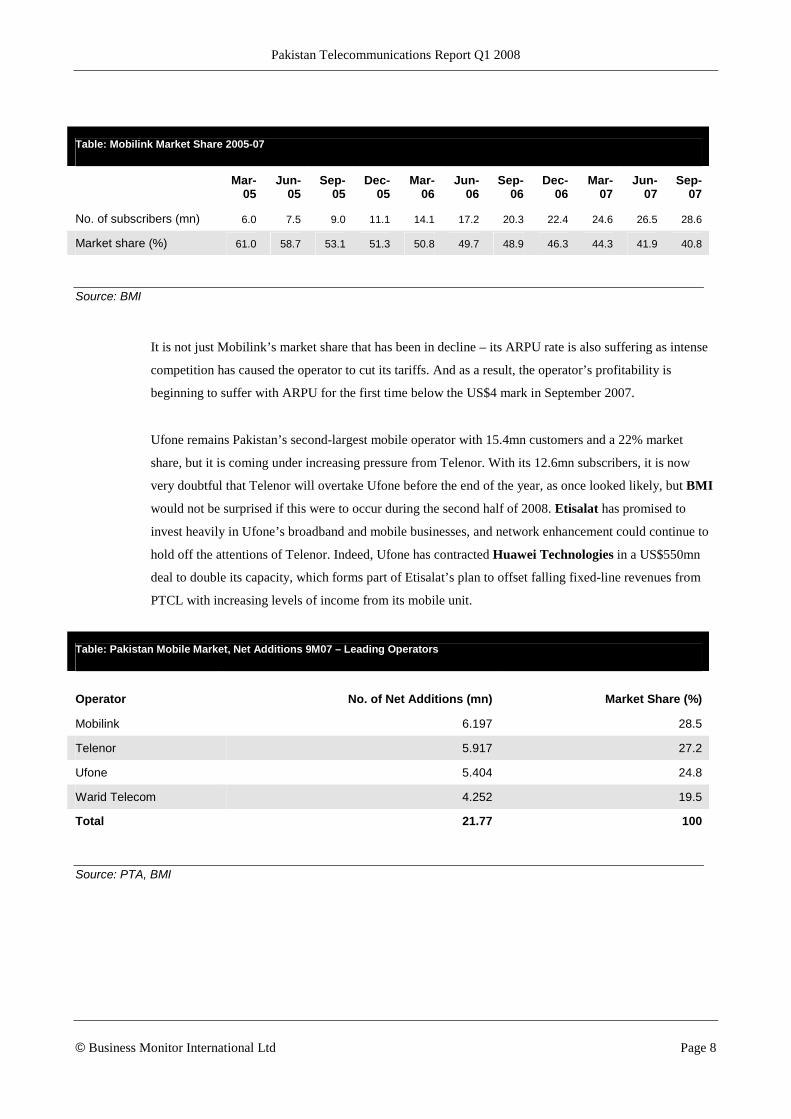
Table: Mobilink Market Share 2005-07
Mar-
05 Jun-
05 Sep-
05 Dec-
05 Mar-
06 Jun-
06 Sep-
06 Dec-
06 Mar-
07 Jun-
07 Sep-
07
No. of subscribers (mn) 6.0 7.5 9.0 11.1 14.1 17.2 20.3 22.4 24.6 26.5 28.6
Market share (%) 61.0 58.7 53.1 51.3 50.8 49.7 48.9 46.3 44.3 41.9 40.8
Source: BMI
It is not just Mobilink’s market share that has been in decline – its ARPU rate is also suffering as intense
competition has caused the operator to cut its tariffs. And as a result, the operator’s profitability is
beginning to suffer with ARPU for the first time below the US$4 mark in September 2007.
Ufone remains Pakistan’s second-largest mobile operator with 15.4mn customers and a 22% market
share, but it is coming under increasing pressure from Telenor. With its 12.6mn subscribers, it is now
very doubtful that Telenor will overtake Ufone before the end of the year, as once looked likely, but BMI
would not be surprised if this were to occur during the second half of 2008. Etisalat has promised to
invest heavily in Ufone’s broadband and mobile businesses, and network enhancement could continue to
hold off the attentions of Telenor. Indeed, Ufone has contracted Huawei Technologies in a US$550mn
deal to double its capacity, which forms part of Etisalat’s plan to offset falling fixed-line revenues from
PTCL with increasing levels of income from its mobile unit.
Table: Pakistan Mobile Market, Net Additions 9M07 – Leading Operators
Operator No. of Net Additions (mn) Market Share (%)
Mobilink 6.197 28.5
Telenor 5.917 27.2
Ufone 5.404 24.8
Warid Telecom 4.252 19.5
Total 21.77 100
Source: PTA, BMI

Pakistan Telecommunications Report Q1 2008
© Business Monitor International Ltd Page 9
BMI believes that SingTel’s purchase
of a 30% stake in Warid Telecom at the
end of June 2007 represents a hugely
important development for Pakistan’s
mobile market. The arrival of SingTel
should give the country’s fourth-largest
operator a huge boost. The company
had done remarkably well to attract
over 10.5mn subscribers in just two
years of operation, but by its own
standards had a difficult start to 2007,
criticised by the regulator for the
quality of its network, and adding just 4.2mn customers during the first nine months of the year. SingTel
has an excellent reputation in making successful telecoms investments across the region, and nowhere has
it done so more successfully than in India, where its associate Bharti Airtel controls the market. Indeed,
Warid Telecom could learn from the successes of Bharti Airtel at a time when it must look to rural parts
of the country for new subscriber growth, something that India’s leading operator has done so well. And
in order to do this, Warid must maintain its investment levels, provide extensive coverage and continue to
offer attractive promotions, otherwise it will fall behind its rivals. SingTel’s presence should ensure that
this happens.
Like Warid Telecom, Telenor has been
hugely successful ever since its launch in
early 2005, during which time it has
managed to bring on 12.6mn wireless
subscribers. What lies behind this surge
from Telenor? Investment and network
quality – Telenor has invested close to
approximately US$1bn in Pakistan
building up its network to the extent that
it is now connected to over 1,000 cities,
towns, villages and highways
countrywide. Telenor Pakistan’s CEO
Tore Johnsen commented: ‘No place [in
Pakistan] is far enough for our customers
to remain connected …[but] it is not just the pace of expansion but also the quality that matters to us’. As
if to illustrate its investment plans, in February 2007, Telenor promised to increase its network capacity,
A Study of Subscriber Growth in Pakistan's Mobile Operators
2000-2007
0
5
10
15
20
25
30
2000 2001 2002 2003 2004 2005 2006 2007
Mobilink Ufone Telenor Warid CMPak Instaphone
Source: BMI
Rise and Rise of Telenor Pakistan
0
2
4
6
8
10
12
14
Mar
-05
Jun-
05
Sep
-05
Dec
-05
Mar
-06
Jun-
06
Sep
-06
Dec
-06
Mar
-07
Jun-
07
Sep
-07
02468101214161820
Total Number of Subscribers (mn) LHSMarket Share (%) (RHS)
Source: BMI
Pakistan Telecommunications Report Q1 2008
© Business Monitor International Ltd Page 10
and extended its service contract with Nokia until the end of 2009. The Finnish company will provide
Telenor over these three years with more than 2,000 base stations, and will enhance the operator’s
network in Punjab, North-West Frontier Province, Pakistan Administered Kashmir and the northern
regions of the country. And furthermore, Telenor is working on improving its service by adding value-
added services (VAS) such as mobile TV.
Another to invest in Pakistan’s mobile market is China Mobile. It completed its 100% acquisition of
Paktel in June 2007, rebranding the failing company as CMPak. Back in 2000, Paktel had a 27% market
share of Pakistan’s then fledgling mobile market. Two years later, this had dropped significantly to 13%,
and by September 2007, its share of the market was below 2%. It has just 1.23mn customers, and as yet
China Mobile has made no progress in the revival of an ailing company.
China Mobile has, however, invested US$700mn on its Pakistani unit, and continues to expand its
network. In August 2007, the operator won the opportunity to provide services to Azad Jammu and the
Northern Areas of Pakistan for the first time. It has awarded network expansion deals to Alcatel-Lucent
and Chinese manufacturers Huawei Technologies and ZTE. One wonders why China Mobile has sought
to invest in such a competitive market. However, the company believes that if it can raise the company’s
profile, there is still the opportunity for dynamic growth. And, keen to export the Chinese home-grown
3G standard TD-SCDMA, for which it is likely to win a licence in China, China Mobile is eager to
expand in overseas markets, and Pakistan provides the operator with just such an opportunity, especially
at a time when the regulator is discussing the award of 3G licences.
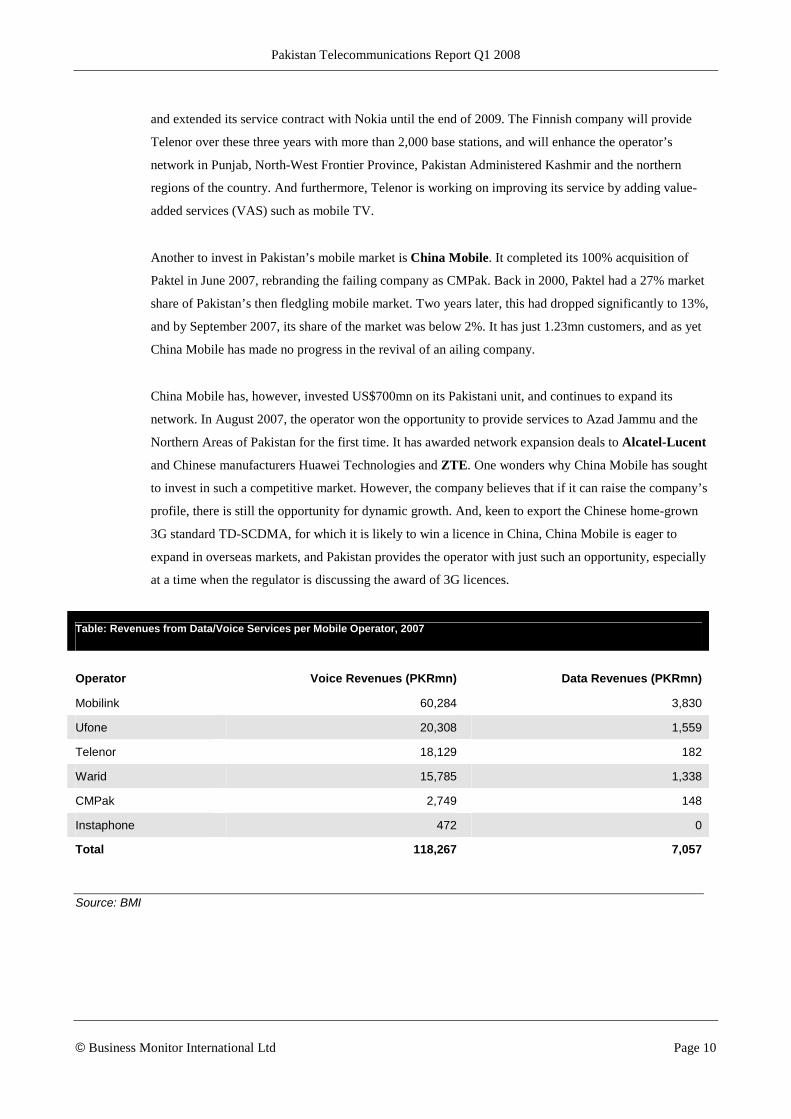
Table: Revenues from Data/Voice Services per Mobile Operator, 2007
Operator Voice Revenues (PKRmn) Data Revenues (PKRmn)
Mobilink 60,284 3,830
Ufone 20,308 1,559
Telenor 18,129 182
Warid 15,785 1,338
CMPak 2,749 148
Instaphone 472 0
Total 118,267 7,057
Source: BMI

Pakistan Telecommunications Report Q1 2008
© Business Monitor International Ltd Page 11
The Pakistan Telecommunication
Authority (PTA) did suggest that it
would auction three 3G mobile licences
by the end of 2007; this has not
happened. Indeed, the PTA has
recommended that the licensing of 3G
services be delayed and that the mobile
data market in Pakistan is insignificant
(as the table above suggests, just 5% of
mobile revenues came from data
services in 2007). However, this is
likely to remain the case until 3G
services are launched, and 3G mobile
telephony could suffer at the hands of
WiMAX, which Mobilink and Ufone are already working on launching imminently.
The growth in Pakistan’s mobile market has, of course, resulted in a vibrant handset market. While Nokia
remains market leader with 53% of the shipment market to Pakistan, Samsung on 20% and Sony Ericsson
with 15% are also performing well. And, emerging into the marketplace are China’s Huawei
Technologies and ZTE, helped by a price sensitive market. Indeed, the most popular handset models in
Pakistan do tend to be in the low-to-mid tier market with the following selling well – Nokia 1110/1112;
Samsung E250; Sony Ericsson K750i; and the Motorola RAZR V3.
Fixed-Line
By the end of 2006-2007 (June 2007) there were 4.8mn fixed-line connections in Pakistan, with
penetration dropping to just over 3%. PTCL retains its virtual monopoly of the fixed local loop in
Pakistan (approximate 95% market share), but with limited incentive to improve services, quality and
coverage remain poor. Indeed, PTCL lost over 450,000 fixed-line customers between June 2006 and June
2007 (latest data available), and a further 80,000 over the three-month period to September 2007, when it
had just below 4.6mn customers.
The growing popularity of mobile telephony, and to a lesser extent of wireless local loop (WLL), has
been the cause of this decline. Aside from the increasing popularity of mobile telephony (see above), the
number of WLL subscribers increased by 80% between June 2006 and 2007. By the end of October 2007,
there were just over 2mn subscribers to WLL networks with PTCL taking an approximate 59% market
share, followed by TeleCard on 21.6% and World Call on 17% (see table below).
Handset Manufacturer Market in Pakistan, 2006-07
Nokia53%
Samsung20%
Sony Ericsson
15%
Motorola3%
LG5%
Others4%
Source: Mob ile Zone
Pakistan Telecommunications Report Q1 2008
© Business Monitor International Ltd Page 12
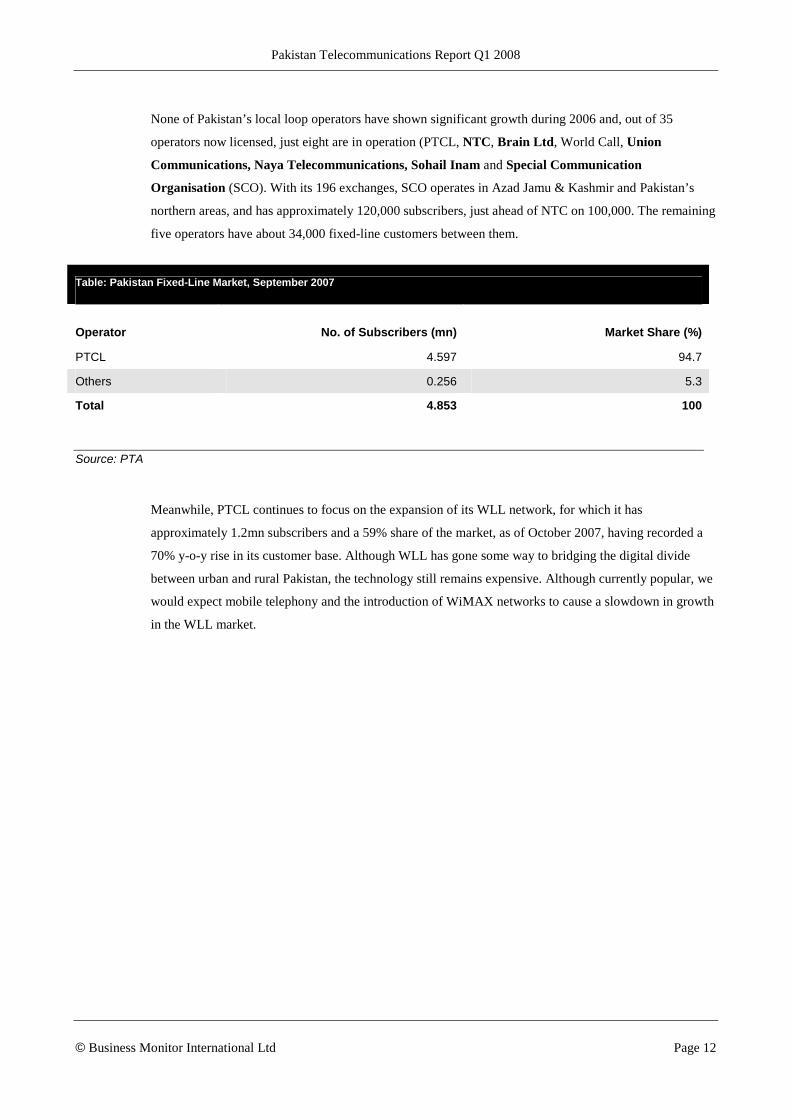
None of Pakistan’s local loop operators have shown significant growth during 2006 and, out of 35
operators now licensed, just eight are in operation (PTCL, NTC, Brain Ltd, World Call, Union
Communications, Naya Telecommunications, Sohail Inam and Special Communication
Organisation (SCO). With its 196 exchanges, SCO operates in Azad Jamu & Kashmir and Pakistan’s
northern areas, and has approximately 120,000 subscribers, just ahead of NTC on 100,000. The remaining
five operators have about 34,000 fixed-line customers between them.
Table: Pakistan Fixed-Line Market, September 2007
Operator No. of Subscribers (mn) Market Share (%)
PTCL 4.597 94.7
Others 0.256 5.3
Total 4.853 100
Source: PTA
Meanwhile, PTCL continues to focus on the expansion of its WLL network, for which it has
approximately 1.2mn subscribers and a 59% share of the market, as of October 2007, having recorded a
70% y-o-y rise in its customer base. Although WLL has gone some way to bridging the digital divide
between urban and rural Pakistan, the technology still remains expensive. Although currently popular, we
would expect mobile telephony and the introduction of WiMAX networks to cause a slowdown in growth
in the WLL market.

Pakistan Telecommunications Report Q1 2008
© Business Monitor International Ltd Page 13
Table: Pakistan Wireless Local Loop Market, October 2007
Operator No. of Subscribers (mn) Market Share (%)
PTCL 1.185 58.6
TeleCard 0.437 21.6
World Call 0.345 17.1
Great Bear 0.054 2.7
Total 2.021 100
Source: PTA
Table: Pakistan Wireless Local Loop Market Net Additions, June 2006-October 2007
Operator No. of Subscribers (mn) Market Share (%)
PTCL 0.523 52.7
World Call 0.229 23.1
TeleCard 0.208 20.9
Great Bear 0.033 3.3
Total 0.993 100
Source: PTA
In spite of what may appear to be a stagnant fixed-line market, there have been signs of inward
investment over the last few months. In November 2007, Omantel claimed that its US$204mn
acquisition of a 65% interest in World Call, which now has been approved by shareholders and regulator
alike, should boost profit in the carrier by 14% from 2009. Facing the loss of its fixed-line monopoly in
its own domestic market, this represents a significant move from Omantel.
This acquisition followed the purchase of a 75% stake in local broadband wireless access and WiMAX
operator Burraq Telecom by Qatar Telecom for US$12mn earlier in the year. Meanwhile, another
acquisition on the cards involves TeleCard, Pakistan’s largest payphone company with speculation
mounting that an Asian operator is eyeing up a majority stake in a deal that could be worth as much as
US$90mn.
Pakistan may have a thriving mobile market, but in contrast there has been very limited take-up for either
dial-up internet access or high-speed broadband connection. With a limited fixed-line infrastructure, high

Pakistan Telecommunications Report Q1 2008
© Business Monitor International Ltd Page 14
tariffs and inadequate investment in this area, low penetration rates (below 1%) are hardly surprising, and
yet broadband services have been available in Pakistan for the last five years. Aside from incumbent
operator, PTCL, the main DSL providers are Micronet, Dancom, CyberNet and MultiNet. A total of
about 70 ISPs, meanwhile, provide dial-up internet services.
The major reason behind the slow growth of broadband services (customer numbers increased by nearly
70% y-o-y in June 2007) is cost. Whilst in India, where the government is pushing for broadband growth,
broadband services are available for US$8 per month, in Pakistan high-speed services (at the same speed)
cost US$16 per month. There is some hope, however, that since the privatisation of PTCL, and now that it
is under the control of Etisalat, the incumbent has announced reductions in IP bandwidth tariffs.
Regulatory Developments
The PTA introduced mobile number portability (MNP) to Pakistan in March 2007. Initially there was a
disappointing response, with MNP attracting just 18,000 transfers in the first three months. Customers
were complaining that the system was too unwieldy to use. Nevertheless, the PTA still regards MNP as a
key element of deregulation in any telecoms market as a way of ensuring competition, and it appears to be
doing just this, with Telenor appearing to be the main beneficiary taking subscribers away from Ufone,
CMPak and Instaphone. Not only does it make the market more competitive, but it encourages operators
to improve the quality of their networks, perhaps a reason for Warid (often criticised for traffic
congestion) signing a three-year managed services deal with Ericsson. Indeed, such is the importance of
MNP that both Telenor and Warid insisted on receiving a promise from the regulator that MNP would be
introduced into Pakistan’s market before finalising their investment plans.
A key issue currently in Pakistan’s mobile market is the high level of phone activation tax being paid by
carriers. Indeed, all of the country’s wireless operators have lodged a complaint at the PKR500 tax, which
they claim is hindering growth. Trade association the GSMA is also involved in the dispute and after
discussions with the operators and the Pakistani government declared that ‘the activation tax is a
significant barrier for people looking to own a mobile phone and represents a constraint for operators
seeking to expand into rural areas.’
The operators claim that the rise in tax is unnecessary as previous reductions had actually corresponded
with a rise in handset owners and therefore an increase in taxation revenues. In the last financial year a
total of US$2bn was paid to the Pakistani exchequer through a mixture of tax payments and inward
investment. The GSMA recently commissioned a report on taxation levels on mobile phone ownership,
which claimed that in countries such as Pakistan, where tax levels have always been low, a rapid increase
in penetration has caused an increase in tax revenues. However, it is possible that the government
believes that the Pakistani mobile market has seen the best years of subscriber growth and therefore needs

Pakistan Telecommunications Report Q1 2008
© Business Monitor International Ltd Page 15
to raise tax levels. If it does believe this, it is not taking into account the huge potential remaining for
subscriber growth across rural Pakistan.
The PTA continues to take very seriously its regulation that proof of identity of a new mobile subscriber
is required before being allowed to sign up for a mobile service. This was made abundantly clear by the
decision of the PTA to force Mobilink, Ufone, Warid, Telenor and CMPak to terminate partnerships with
11 franchisees located across the country for selling mobile connections without enforcing the PTA’s
standard procedure of requiring customers to provide proof of identity.
Pakistan Telecommunications Report Q1 2008
© Business Monitor International Ltd Page 16
Mobile Operator Data
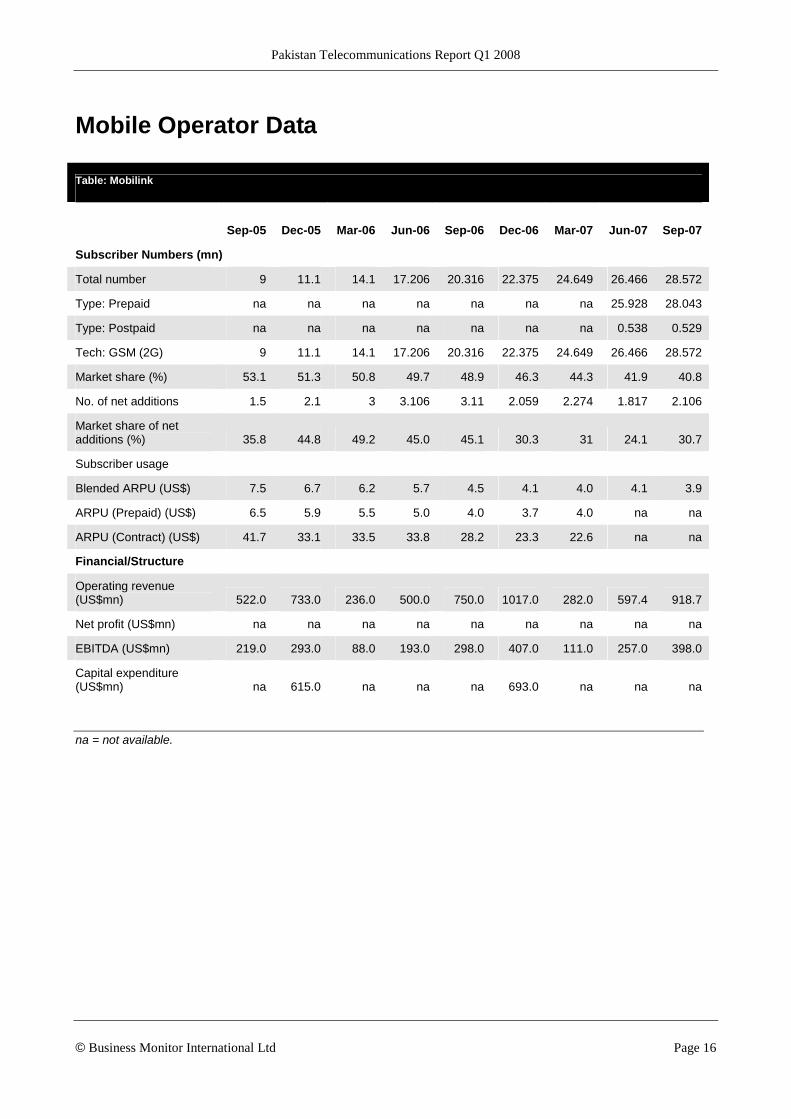
Table: Mobilink
Sep-05 Dec-05 Mar-06 Jun-06 Sep-06 Dec-06 Mar-07 Jun-07 Sep-07
Subscriber Numbers (mn)
Total number 9 11.1 14.1 17.206 20.316 22.375 24.649 26.466 28.572
Type: Prepaid na na na na na na na 25.928 28.043
Type: Postpaid na na na na na na na 0.538 0.529
Tech: GSM (2G) 9 11.1 14.1 17.206 20.316 22.375 24.649 26.466 28.572
Market share (%) 53.1 51.3 50.8 49.7 48.9 46.3 44.3 41.9 40.8
No. of net additions 1.5 2.1 3 3.106 3.11 2.059 2.274 1.817 2.106
Market share of net additions (%) 35.8 44.8 49.2 45.0 45.1 30.3 31 24.1 30.7
Subscriber usage
Blended ARPU (US$) 7.5 6.7 6.2 5.7 4.5 4.1 4.0 4.1 3.9
ARPU (Prepaid) (US$) 6.5 5.9 5.5 5.0 4.0 3.7 4.0 na na
ARPU (Contract) (US$) 41.7 33.1 33.5 33.8 28.2 23.3 22.6 na na
Financial/Structure
Operating revenue (US$mn) 522.0 733.0 236.0 500.0 750.0 1017.0 282.0 597.4 918.7
Net profit (US$mn) na na na na na na na na na
EBITDA (US$mn) 219.0 293.0 88.0 193.0 298.0 407.0 111.0 257.0 398.0
Capital expenditure (US$mn) na 615.0 na na na 693.0 na na na
na = not available.
Pakistan Telecommunications Report Q1 2008
© Business Monitor International Ltd Page 17
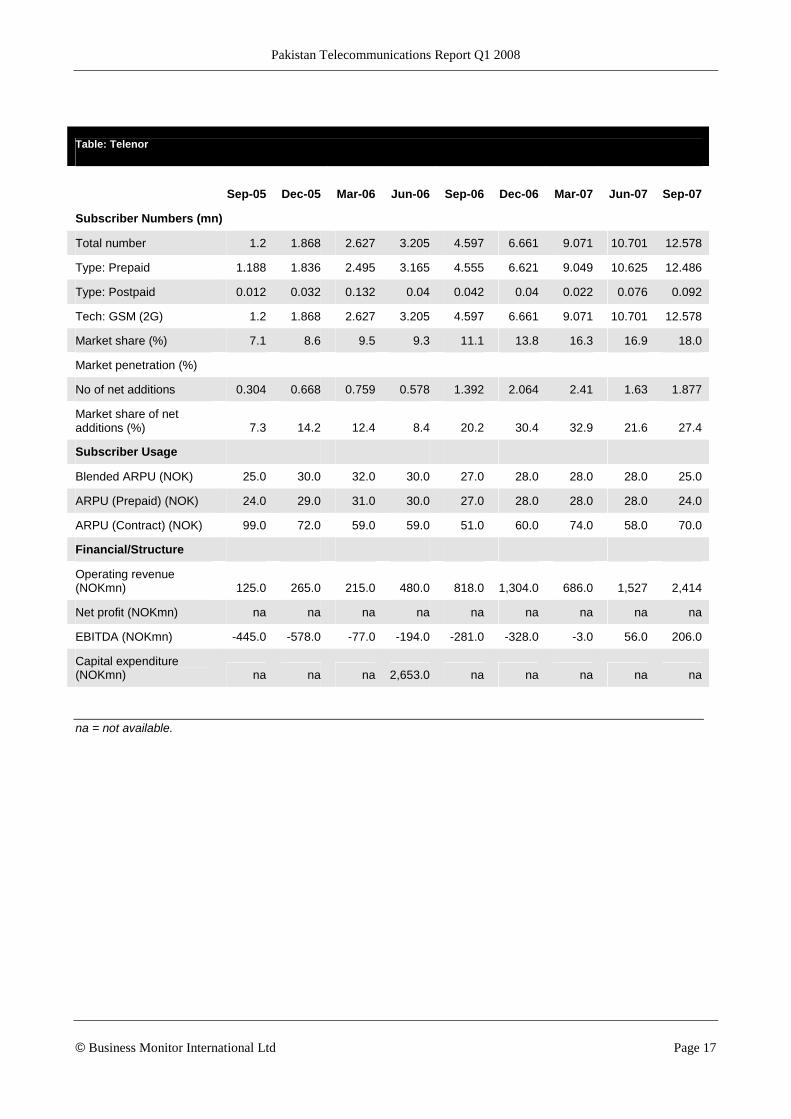
Table: Telenor
Sep-05 Dec-05 Mar-06 Jun-06 Sep-06 Dec-06 Mar-07 Jun-07 Sep-07
Subscriber Numbers (mn)
Total number 1.2 1.868 2.627 3.205 4.597 6.661 9.071 10.701 12.578
Type: Prepaid 1.188 1.836 2.495 3.165 4.555 6.621 9.049 10.625 12.486
Type: Postpaid 0.012 0.032 0.132 0.04 0.042 0.04 0.022 0.076 0.092
Tech: GSM (2G) 1.2 1.868 2.627 3.205 4.597 6.661 9.071 10.701 12.578
Market share (%) 7.1 8.6 9.5 9.3 11.1 13.8 16.3 16.9 18.0
Market penetration (%)
No of net additions 0.304 0.668 0.759 0.578 1.392 2.064 2.41 1.63 1.877
Market share of net additions (%) 7.3 14.2 12.4 8.4 20.2 30.4 32.9 21.6 27.4
Subscriber Usage
Blended ARPU (NOK) 25.0 30.0 32.0 30.0 27.0 28.0 28.0 28.0 25.0
ARPU (Prepaid) (NOK) 24.0 29.0 31.0 30.0 27.0 28.0 28.0 28.0 24.0
ARPU (Contract) (NOK) 99.0 72.0 59.0 59.0 51.0 60.0 74.0 58.0 70.0
Financial/Structure
Operating revenue (NOKmn) 125.0 265.0 215.0 480.0 818.0 1,304.0 686.0 1,527 2,414
Net profit (NOKmn) na na na na na na na na na
EBITDA (NOKmn) -445.0 -578.0 -77.0 -194.0 -281.0 -328.0 -3.0 56.0 206.0
Capital expenditure (NOKmn) na na na 2,653.0 na na na na na
na = not available.
Pakistan Telecommunications Report Q1 2008
© Business Monitor International Ltd Page 18
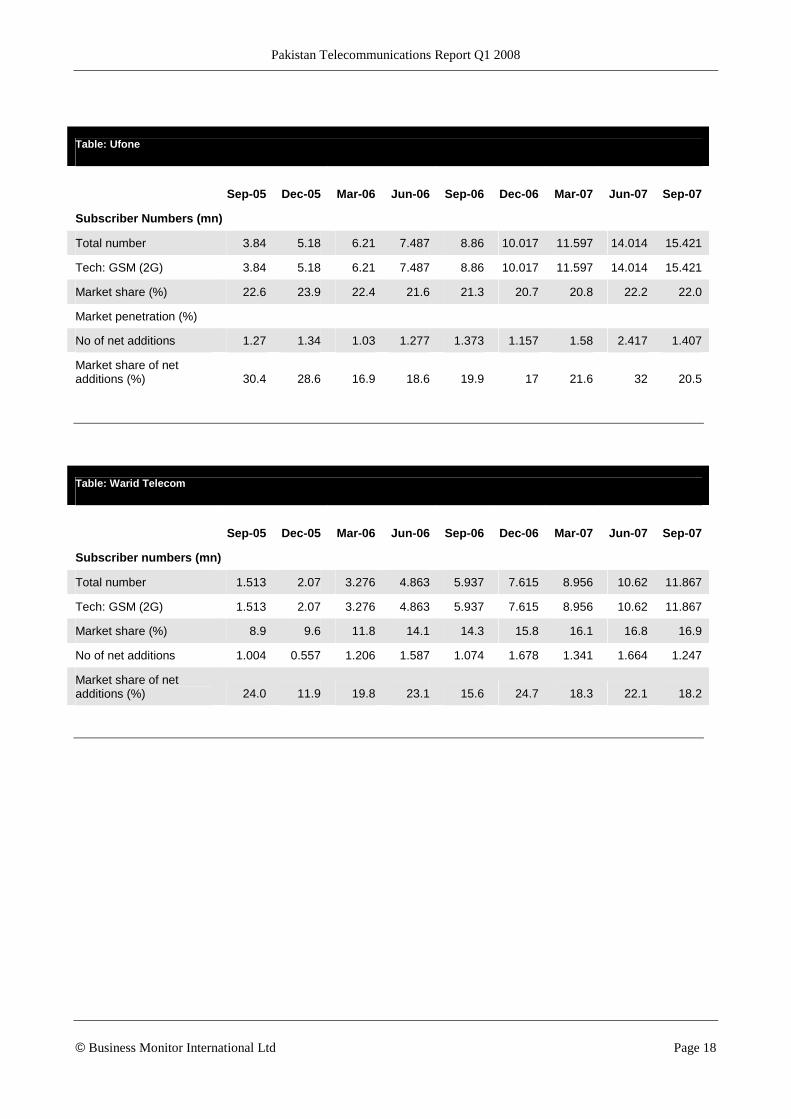
Table: Ufone
Sep-05 Dec-05 Mar-06 Jun-06 Sep-06 Dec-06 Mar-07 Jun-07 Sep-07
Subscriber Numbers (mn)
Total number 3.84 5.18 6.21 7.487 8.86 10.017 11.597 14.014 15.421
Tech: GSM (2G) 3.84 5.18 6.21 7.487 8.86 10.017 11.597 14.014 15.421
Market share (%) 22.6 23.9 22.4 21.6 21.3 20.7 20.8 22.2 22.0
Market penetration (%)
No of net additions 1.27 1.34 1.03 1.277 1.373 1.157 1.58 2.417 1.407
Market share of net additions (%) 30.4 28.6 16.9 18.6 19.9 17 21.6 32 20.5
Table: Warid Telecom
Sep-05 Dec-05 Mar-06 Jun-06 Sep-06 Dec-06 Mar-07 Jun-07 Sep-07
Subscriber numbers (mn)
Total number 1.513 2.07 3.276 4.863 5.937 7.615 8.956 10.62 11.867
Tech: GSM (2G) 1.513 2.07 3.276 4.863 5.937 7.615 8.956 10.62 11.867
Market share (%) 8.9 9.6 11.8 14.1 14.3 15.8 16.1 16.8 16.9
No of net additions 1.004 0.557 1.206 1.587 1.074 1.678 1.341 1.664 1.247
Market share of net additions (%) 24.0 11.9 19.8 23.1 15.6 24.7 18.3 22.1 18.2
Pakistan Telecommunications Report Q1 2008
© Business Monitor International Ltd Page 19
Industry Forecast Scenario
Mobile
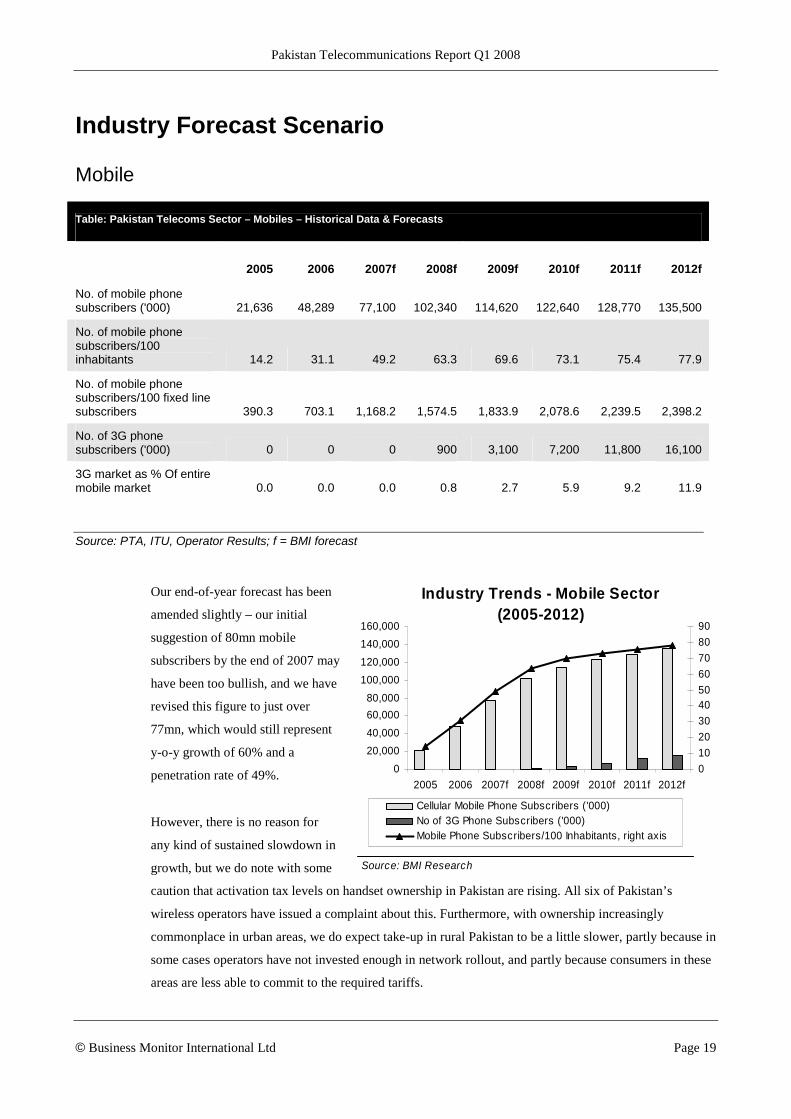
Table: Pakistan Telecoms Sector – Mobiles – Historical Data & Forecasts
2005 2006 2007f 2008f 2009f 2010f 2011f 2012f
No. of mobile phone subscribers ('000) 21,636 48,289 77,100 102,340 114,620 122,640 128,770 135,500
No. of mobile phone subscribers/100 inhabitants 14.2 31.1 49.2 63.3 69.6 73.1 75.4 77.9
No. of mobile phone subscribers/100 fixed line subscribers 390.3 703.1 1,168.2 1,574.5 1,833.9 2,078.6 2,239.5 2,398.2
No. of 3G phone subscribers ('000) 0 0 0 900 3,100 7,200 11,800 16,100
3G market as % Of entire mobile market 0.0 0.0 0.0 0.8 2.7 5.9 9.2 11.9
Source: PTA, ITU, Operator Results; f = BMI forecast
Our end-of-year forecast has been
amended slightly – our initial
suggestion of 80mn mobile
subscribers by the end of 2007 may
have been too bullish, and we have
revised this figure to just over
77mn, which would still represent
y-o-y growth of 60% and a
penetration rate of 49%.
However, there is no reason for
any kind of sustained slowdown in
growth, but we do note with some
caution that activation tax levels on handset ownership in Pakistan are rising. All six of Pakistan’s
wireless operators have issued a complaint about this. Furthermore, with ownership increasingly
commonplace in urban areas, we do expect take-up in rural Pakistan to be a little slower, partly because in
some cases operators have not invested enough in network rollout, and partly because consumers in these
areas are less able to commit to the required tariffs.
Industry Trends - Mobile Sector (2005-2012)
0
20,000
40,000
60,000
80,000
100,000
120,000
140,000
160,000
2005 2006 2007f 2008f 2009f 2010f 2011f 2012f
0
10
20
30
4050
60
70
80
90
Cellular Mobile Phone Subscribers ('000)No of 3G Phone Subscribers ('000)Mobile Phone Subscribers/100 Inhabitants, right axis
Source: BMI Research
Pakistan Telecommunications Report Q1 2008
© Business Monitor International Ltd Page 20
Nevertheless, growth in Pakistan’s mobile sector has been nothing short of extraordinary, powered by
continued expansion from the market leader Mobilink, but also by the entrance of new investors Warid
Telecom and Telenor at the beginning of 2005. Investment projects, including network builds from all
five of Pakistan’s leading mobile operators, suggests that growth will indeed continue, and implies, in
particular, real commitment to growth in rural Pakistan. The entrance of SingTel to Pakistan, via its 30%
acquisition of Warid Telecom, is particularly telling.
Growth will slow down partly as the market becomes saturated and partly as it reaches less accessible
parts of the country. BMI forecasts that there will be 100mn mobile subscribers at the end of 2008, and
that by the end of our forecast period in 2012, there should be more than 135mn customers, accounting
for a penetration rate of around 78%. This would still represent an annual average growth rate of 8%
between 2008 and 2012.
With regards to our 3G forecasts, it seems likely that the PTA will run an auction for three licences no
earlier than towards the beginning of 2008, with commercial deployment either later that year, or maybe
early in 2009. With GSM the main mobile technology in use in Pakistan, the preferred 3G technology
would be UMTS, although China Mobile may be tempted, if it were to win a licence, to usher in its home-
grown TD-SCDMA standard.
Third-generation mobile telephony is unlikely to take off in the immediate term. However, the ambition
and competition is very much present to fuel a small 3G market, and we know that Telenor’s network in
Pakistan is already W-CDMA compatible. The introduction of WiMAX services and the popularity of
WLL may hinder the development of 3G, but BMI forecasts that by the end of 2012, about 12% of all
mobile subscribers in Pakistan will have a 3G handset. This, however, remains very much in the hands of
the PTA, the operators themselves and of course Pakistan’s consumers.
Pakistan Telecommunications Report Q1 2008
© Business Monitor International Ltd Page 21
Fixed-Line
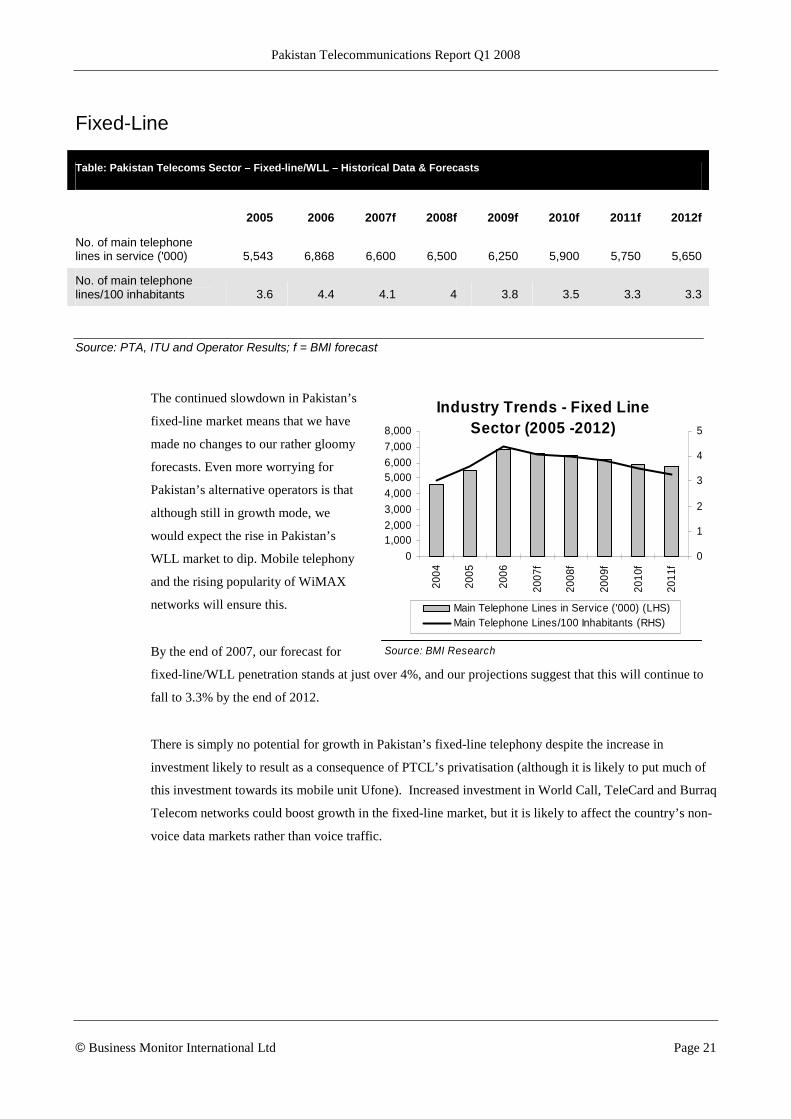
Table: Pakistan Telecoms Sector – Fixed-line/WLL – Historical Data & Forecasts
2005 2006 2007f 2008f 2009f 2010f 2011f 2012f
No. of main telephone lines in service ('000) 5,543 6,868 6,600 6,500 6,250 5,900 5,750 5,650
No. of main telephone lines/100 inhabitants 3.6 4.4 4.1 4 3.8 3.5 3.3 3.3
Source: PTA, ITU and Operator Results; f = BMI forecast
The continued slowdown in Pakistan’s
fixed-line market means that we have
made no changes to our rather gloomy
forecasts. Even more worrying for
Pakistan’s alternative operators is that
although still in growth mode, we
would expect the rise in Pakistan’s
WLL market to dip. Mobile telephony
and the rising popularity of WiMAX
networks will ensure this.
By the end of 2007, our forecast for
fixed-line/WLL penetration stands at just over 4%, and our projections suggest that this will continue to
fall to 3.3% by the end of 2012.
There is simply no potential for growth in Pakistan’s fixed-line telephony despite the increase in
investment likely to result as a consequence of PTCL’s privatisation (although it is likely to put much of
this investment towards its mobile unit Ufone). Increased investment in World Call, TeleCard and Burraq
Telecom networks could boost growth in the fixed-line market, but it is likely to affect the country’s non-
voice data markets rather than voice traffic.
Industry Trends - Fixed Line Sector (2005 -2012)
0
1,0002,000
3,000
4,000
5,0006,000
7,000
8,00020
04
2005
2006
2007
f
2008
f
2009
f
2010
f
2011
f
0
1
2
3
4
5
Main Telephone Lines in Service ('000) (LHS)Main Telephone Lines/100 Inhabitants (RHS)
Source: BMI Research
Pakistan Telecommunications Report Q1 2008
© Business Monitor International Ltd Page 22
Internet
Table: Pakistan Telecoms Sector – Internet – Historical Data & Forecasts
2005 2006 2007f 2008f 2009f 2010f 2011f 2012f
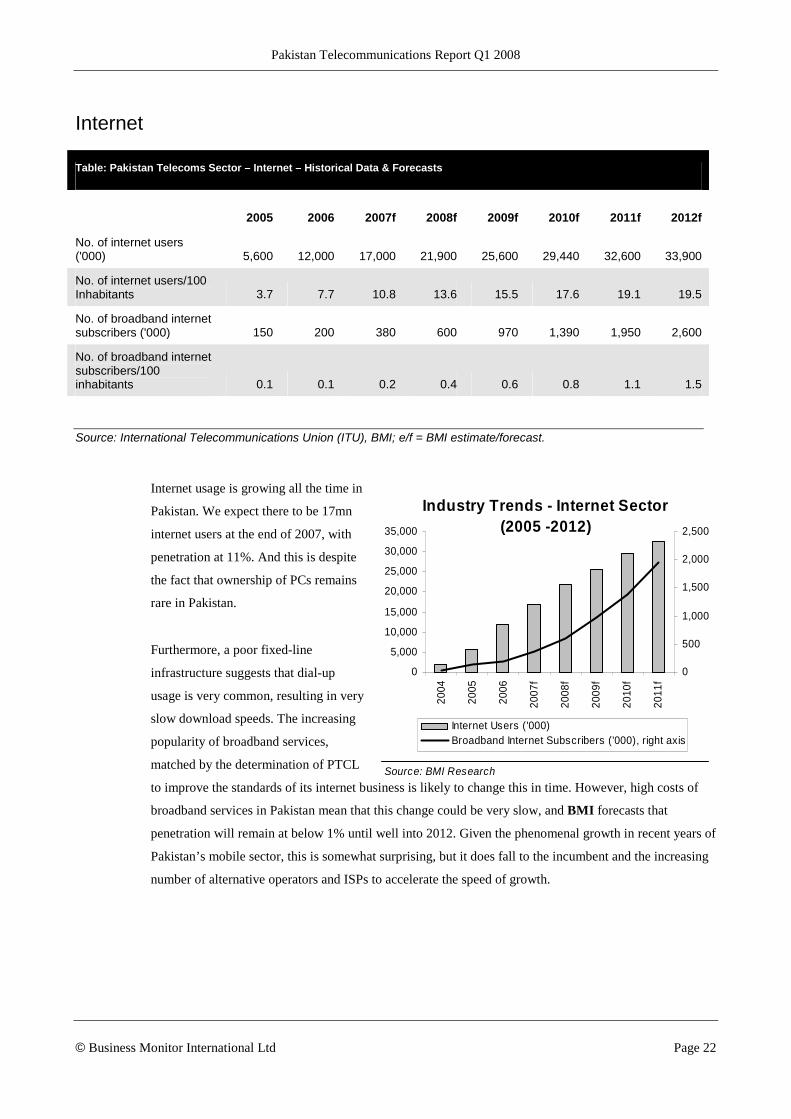
No. of internet users ('000) 5,600 12,000 17,000 21,900 25,600 29,440 32,600 33,900
No. of internet users/100 Inhabitants 3.7 7.7 10.8 13.6 15.5 17.6 19.1 19.5
No. of broadband internet subscribers ('000) 150 200 380 600 970 1,390 1,950 2,600
No. of broadband internet subscribers/100 inhabitants 0.1 0.1 0.2 0.4 0.6 0.8 1.1 1.5
Source: International Telecommunications Union (ITU), BMI; e/f = BMI estimate/forecast.
Internet usage is growing all the time in
Pakistan. We expect there to be 17mn
internet users at the end of 2007, with
penetration at 11%. And this is despite
the fact that ownership of PCs remains
rare in Pakistan.
Furthermore, a poor fixed-line
infrastructure suggests that dial-up
usage is very common, resulting in very
slow download speeds. The increasing
popularity of broadband services,
matched by the determination of PTCL
to improve the standards of its internet business is likely to change this in time. However, high costs of
broadband services in Pakistan mean that this change could be very slow, and BMI forecasts that
penetration will remain at below 1% until well into 2012. Given the phenomenal growth in recent years of
Pakistan’s mobile sector, this is somewhat surprising, but it does fall to the incumbent and the increasing
number of alternative operators and ISPs to accelerate the speed of growth.
Industry Trends - Internet Sector (2005 -2012)
0
5,000
10,000
15,000
20,000
25,000
30,000
35,000
2004
2005
2006
2007
f
2008
f
2009
f
2010
f
2011
f0
500
1,000
1,500
2,000
2,500
Internet Users ('000)Broadband Internet Subscribers ('000), right axis
Source: BMI Research

Pakistan Telecommunications Report Q1 2008
© Business Monitor International Ltd Page 23
Business Environment
Asia
This quarter sees the unveiling of BMI's new business environment rankings system. The new rankings
are based on a revised methodology, which we believe offers an industry-leading insight into the
prospects and risks for companies operating in the global telecoms market. Our approach has been
threefold. First, we have redefined the risks that we rate, in order to capture more accurately the
operational dangers to companies operating in the telecoms field. Second, we have attempted, where
possible, to identify objective indicators that may serve as proxies for issues and trends that were
previously evaluated on a subjective basis. Finally, we have used BMI's proprietary Country Risk Ratings
in a more nuanced manner to ensure that only the aspects most relevant to the telecoms industry have
been included.
The new ratings system breaks down into two distinct areas. First, the Limits of Potential Returns section
evaluates the size (in terms of subscriber numbers and revenues) and growth potential of the telecoms
sector in each country. In addition, this section looks at broader characteristics that may affect the sector's
development, such as average wealth and demographic factors. Second, Risks to Realisation of Returns
examines industry-specific dangers and those emanating from the state's political and economic profile
that could reduce the likelihood of anticipated returns being realised. In particular, we examine the
independence of the industry regulator and the transparency and efficiency of its decision-making
processes, as well as factors such as government policy continuity, the country's legal framework and the
incidence of corruption.
The most obvious change to our rankings is the emergence of India at the top. This is almost wholly due
to its high score for telecoms market structure. India, despite low penetration rates of around 20%, already
has a very large market – 185mn subscribers in June 2007 – while we project growth in 2007 to be 55%,
followed by an average growth rate of 36% over the next four years, ended 2012. This is combined with a
highly competitive market, with no fewer than nine mobile operators, while some 70% of the population
lives in rural communities; there remains plenty of opportunity for further growth. India also scores
particularly highly in the regulatory category. The TRAI is a well-developed regulator, as can be seen by
its consultative decision-making processes and its surprisingly dynamic consultations on issues such as
3G licensing, roaming and infrastructure sharing.
Next in line is Japan, formerly at the top of our rankings. Much like India, it enjoys a strong regulatory
framework. The Ministry of Information and Communications is attempting to introduce greater
competition by stipulating under the terms of its WiMAX tender that major mobile operators bid for the
licences as part of a consortium. Where Japan scores exceptionally highly compared with its regional
Pakistan Telecommunications Report Q1 2008
© Business Monitor International Ltd Page 24
peers is country risk; in particular, it remains largely unaffected by externally induced economic shock,
while corruption in terms of affecting companies' ability to compete remains intact.
Singapore and Malaysia remain toward the top half of the table. Like Japan, Malaysia retains a strong
state-run regulatory body. The Ministry of Energy, Water and Communications has sought to encourage
the four WiMAX licence holders to share infrastructure costs and deployment, which could cost up to
MYR2bn. This should enable operators to offer WiMAX services quicker to market, while the
government is also placing pressure on the incumbent Telekom Malaysia to open up its trunking fibre to
other operators. Singapore's position is buoyed by its country structure score – highest among other
countries in the table – it is supported by a wealthy population, which cannot be divided into urban and
rural, thanks to its status as an island nation.
Unmoved in mid-table is Hong Kong. The poor score it receives is for telecoms growth potential, thanks
to penetration rates in excess of 130%; this was offset by an attractive country structure profile. On a par
with Singapore, with no urban-rural split on account of its geographic layout and GDP per capita of
around US$28,000, the country scores only second to the latter in terms of country structure. Hong Kong
also scores well for country risk, aided by less corruption and policy continuity.
China finds its position much improved from our earlier ratings, although it could have seen a similar
placing to India, given the strength of its telecoms market structure. There are now over half a billion
mobile subscribers in China, representing penetration rates of just under 40%, and there is plenty of
opportunity for future growth. This is increasingly being led by the take-up of mobile services in rural
areas, although its impact on ARPU rates is negative. However, China has been prohibited from rising
further in large part due to the poor score for its regulatory body. Government-run, the state continues to
retain shares in all of the country's major telecoms operators, while there are delays relating to the highly
anticipated award of its three 3G licences.
Next in line is Australia, which is placed considerably lower down the rankings than had been the case
previously. While Australia does well in country structure and country risk, (comparable to countries such
as Taiwan, which are higher up the ratings), this is offset by limited potential growth in the telecoms
market. Here, there were just 1.249mn net additions last year, shared among four mobile operators,
culminating in the country breaking through the 100% penetration rate barrier. Subsequent growth is
expected to slow down because of this, while a weakened regulatory score relates in part to the lack of
success in relation to the deployment of a national broadband network.
Pakistan provides an impressive score for independence of regulator, better than Indonesia, despite
coming behind it in 11th place. The roles of government and regulator have been important to the
development of the Pakistani telecoms sector, and should not be underestimated. Between them, they
have created a conducive investor- and user-friendly telecoms market, one which has attracted
Pakistan Telecommunications Report Q1 2008
© Business Monitor International Ltd Page 25
considerable foreign direct investment (FDI) in the last three years. This is helping to create a situation in
which there are approximately 2-2.5mn new mobile subscribers each month, as the country's operators
offer low tariffs and quality services.
As before, the Philippines, Thailand, Bangladesh and Vietnam are at the bottom of our regional rankings.
Their low score for country structure, combined with retaining some of the poorest regulatory scores, has
led to the retention of their position. It is not surprising therefore that these countries also hold some of
the lowest scores for telecoms market. Vietnam for example, despite offering plenty of room for growth
(not to mention a large youthful population) and competitively-priced tariffs, has some of the lowest
penetration rates; expected to reach 32% by YE07, according to BMI forecasts. However, since joining
the WTO, Vietnam commands a great deal of attention from foreign investors keen on entering the
telecoms industry. Here, the government is also expected to partially sell stakes in the country's three
mobile operators, which could open the gates to greater competition.
In the case of Bangladesh, the authorities ordered all mobile network operators to shut down their
networks, albeit on a temporary basis, which is a concern for potential investors in the country's wireless
market. The government is clearly concerned at security risks encouraged by mobile telephony given its
recent order that all customers subscribing before February 2007 must now re-register their subscription,
providing further proof of identification. Having said that, independent regulator the BTRC has been
instrumental to Bangladesh's status as a high-growth market, making significant restructuring moves such
as the introduction of limited fixed-line competition, and has gone some way to encouraging further
competition, especially in the Dhaka Metropolitan region, where no fewer than 19 operators have been
granted licences.

Pakistan Telecommunications Report Q1 2008
© Business Monitor International Ltd Page 26
Pakistan
On the face of it, Pakistan has a much-improved business environment, as can be seen by the evidence of
considerable inward investment in the telecoms sector over the last few years. And yet, Pakistan still lies
nearer the bottom of our Business Environment Ranking table in 11th position. On the one hand,
Pakistan’s regulator scores very well for its role in encouraging investment, and the market is hugely
competitive, offering huge potential for growth, not only in the mobile market, but also high-speed
internet, both fixed and wireless. However, the country remains in political difficulties and does not offer
the most stable of markets, either politically or economically (as seen by very low GDP per capita, and
from the telecoms point of view, ARPU rates).
On the positive side, Pakistan’s telecoms sector currently contributes about 2% of the country’s GDP and
total revenues reached PKR236bn in 2006-2007. The sector received US$1.8bn of FDI in the last fiscal
year, accounting for 35% of total FDI in Pakistan. These are all figures that go to suggest Pakistan’s
telecoms sector is in great shape and offers the investor huge opportunities. So much so that the
government, having seen a number of carriers enter and transform Pakistan’s mobile market in recent
years, now aims to offer incentives for the manufacturers of handsets and other telecoms equipment, to
make Pakistan a popular manufacturing base. A highly competitive market could well tempt a number of
handset manufacturers to set up a base in Pakistan. And the market will continue to be competitive, as
long as the country’s carriers continue to invest in their networks and bring down their tariffs, and as long
as the regulator encourages competition through such measures as introducing MNP. The regulator does,
however, have to be careful not to allow growth to be stunted by monitoring carefully the sort of increases
in taxation on mobile operators, that has been notable in 2006-07, with the total revenue collected by the
government in the form of taxes and regulatory fees amounting to more than PKR100bn, up by 32% on
the previous fiscal year.
Pakistan’s government is watching carefully as the levels of imports to Pakistan accelerate. Import
activity was set to decline by 2% in 2006-2007, but instead, it rose by nearly 7% to US$30.5bn. The rise
of the telecoms sector, and in particular, the mobile market was partly responsible for this setback – over
the last four years, mobile handsets worth US$1.7bn have been imported, and in the last fiscal year more
than 4% of all the country’s imports came from the telecoms sector. Not only does the government want
to change this, but it believes it can force something of a turnaround by encouraging handset
manufacturers to set up manufacturing bases, on the back of a lucrative market, and of course, Pakistan’s
cheaper labour. It also hopes that the fact that about one fifth of all mobile users in Pakistan change their
handsets as often as three times a year will encourage manufacturers to take up this opportunity.
Although economic growth is likely to remain robust in the immediate term, we are concerned at
Pakistan’s growing political uncertainty along with a tighter monetary policy that is likely to constrain
growth in the current fiscal year. We forecast real GDP to grow by 6.6% this fiscal year (ending June
Pakistan Telecommunications Report Q1 2008
© Business Monitor International Ltd Page 27
2008), more conservative than the expectations of Pakistan’s government, which expects to witness GDP
growth of 7.2%. However, BMI’s view is that FDI flows will begin to moderate, remittance growth will
slow and domestic consumption will become rather more constrained. All this will have some effect on
growth in Pakistan’s telecoms sector, and indeed its business environment.
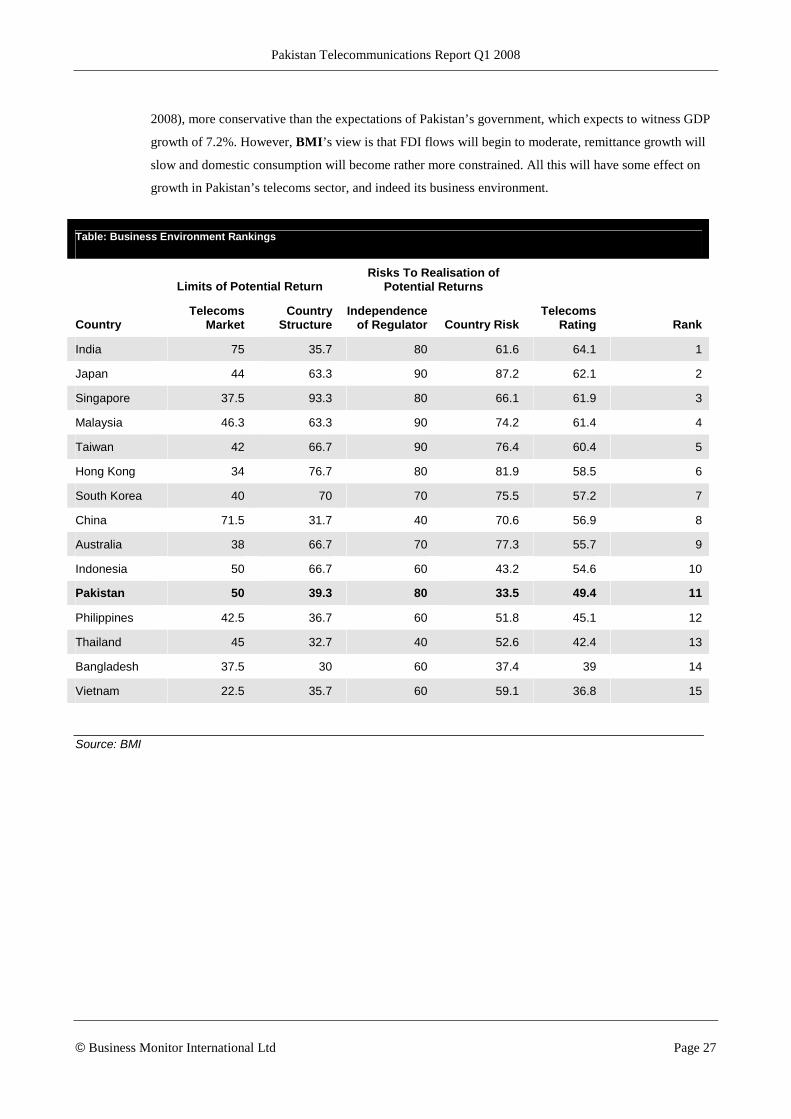
Table: Business Environment Rankings
Limits of Potential Return Risks To Realisation of
Potential Returns
Country Telecoms
Market Country
Structure Independence
of Regulator Country Risk Telecoms
Rating Rank
India 75 35.7 80 61.6 64.1 1
Japan 44 63.3 90 87.2 62.1 2
Singapore 37.5 93.3 80 66.1 61.9 3
Malaysia 46.3 63.3 90 74.2 61.4 4
Taiwan 42 66.7 90 76.4 60.4 5
Hong Kong 34 76.7 80 81.9 58.5 6
South Korea 40 70 70 75.5 57.2 7
China 71.5 31.7 40 70.6 56.9 8
Australia 38 66.7 70 77.3 55.7 9
Indonesia 50 66.7 60 43.2 54.6 10
Pakistan 50 39.3 80 33.5 49.4 11
Philippines 42.5 36.7 60 51.8 45.1 12
Thailand 45 32.7 40 52.6 42.4 13
Bangladesh 37.5 30 60 37.4 39 14
Vietnam 22.5 35.7 60 59.1 36.8 15
Source: BMI

Pakistan Telecommunications Report Q1 2008
© Business Monitor International Ltd Page 28
Pakistan Telecoms Business Environment SWOT Analysis
Strengths ! Pakistan’s fixed-line, WLL and internet markets are increasingly competitive ! Healthy competition in mobile market, with the emergence of Telenor and
Warid Telecom ! Presence of key strategic regional investors in the market – Orascom,
Telenor, Etisalat, Warid Telecom, China Mobile and most recently SingTel
Weaknesses ! Fixed-line services still unavailable in several of Pakistan's more remote areas
! Poor fixed-line infrastructure has a negative impact on the take-up of internet and broadband usage
! High levels of taxation and regulatory fees on operators, if unchecked, could lead to a stunting of mobile growth
Opportunities ! Alternative fixed-line providers are starting to offer WLL and ILD services in competition to PTCL, providing opportunities for infrastructure suppliers
! Growth in mobile market set to continue with Telenor and Warid likely to help push penetration rate to over 50% in 2007
! Growth of VAS – Mobilink and Ufone are piloting WiMAX networks, whilst Telenor and Warid Telecom are looking to launch mobile TV services
Threats ! Network capacity, particularly in mobile market, could struggle to keep up with demand
! Intense competition could have the effect of causing operators to enter into new price wars, which could in turn cause a deterioration in service quality as congestion of traffic becomes more common
! Political instability could turn into economic uncertainty, which could moderate future inward investment plans

Pakistan Telecommunications Report Q1 2008
© Business Monitor International Ltd Page 29
Company Profiles
Vendor Profile: India, China Remain Top Priorities For Ericsson
Selling just under 26mn mobile handsets during Q307, Sony Ericsson, the joint venture established
between Japan's Sony and Sweden's Ericsson in 2001 to manufacture handsets for the global market,
reported a global market share of 9%. This puts Sony Ericsson in fourth place in the market, behind
Nokia (38.6%), Samsung (14.7%) and Motorola (12.9%). Despite a substantial difference in market share
size among the top four handset vendors, Sony Ericsson has noted a significant increase in demand for its
handsets, reporting a 30.8% y-o-y increase, which led to a 1.3 percentage point (pp) gain in market share.
Table: Top Five Mobile Phone Vendors By Shipment Q307
Vendor
Q307 Shipments
(mn) Q307 Market
Share (%)
Q306 Shipments
(mn) Q306 Market
Share (%) y-o-y Chg %
Nokia 111.7 38.6 88.5 34.8 26.2
Samsung 42.6 14.7 28.9 11.4 47.4
Motorola 37.2 12.9 53.7 21.1 -30.7
Sony Ericsson 25.9 9 19.8 7.8 30.8
LG Electronics 21.9 7.6 16.6 6.5 31.9
Others 49.8 17.2 46.5 18.3 7.1
Total 289.1 100 254 100 13.8
Source: IDC Worldwide
Shipment volumes at Sony Ericsson have been on the rise since mid-2006 on account of the vendor's push
into emerging markets. It is not surprising therefore to learn that having defected from its well-known
high-end handsets, including its P1 smartphone and the W580 slider Walkman handsets to low/mid-range
priced handsets, the average selling price has taken a plunge, down by 18% y-o-y to EUR120 as of Q307.
Although Sony Ericsson continued to sell high-end handsets, this was not sufficient to offset the
imbalance with lower-priced handsets, therefore negatively impacting on net profits, which fell by 10% y-
o-y to EUR267mn in Q307.
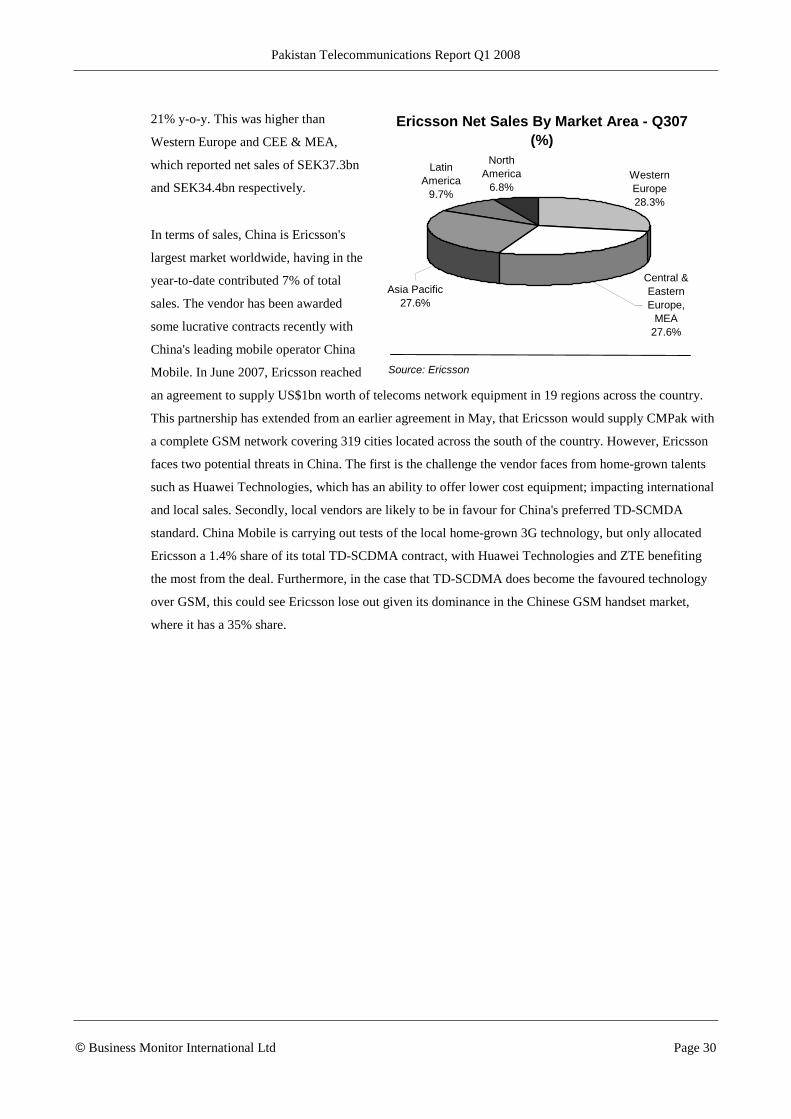
Asia Pacific continues to remain an integral part of Ericsson's sales. The region accounted for 27.6% of
total Q307 sales at SEK43.5bn – on a par with Central and Eastern Europe, and the Middle East and
Africa (CEE & MEA), but just behind Western Europe on 28.3%. Interestingly, on a nine-month basis,
Asia Pacific became Ericsson's most important revenue contributor, with sales of SEK40.9bn, rising by
Pakistan Telecommunications Report Q1 2008
© Business Monitor International Ltd Page 30
Western Europe28.3%
Latin America
9.7%
North America
6.8%
Central & Eastern Europe,
MEA27.6%
Asia Pacific27.6%
Ericsson Net Sales By Market Area - Q307 (%)
Source: Ericsson
21% y-o-y. This was higher than
Western Europe and CEE & MEA,
which reported net sales of SEK37.3bn
and SEK34.4bn respectively.
In terms of sales, China is Ericsson's
largest market worldwide, having in the
year-to-date contributed 7% of total
sales. The vendor has been awarded
some lucrative contracts recently with
China's leading mobile operator China
Mobile. In June 2007, Ericsson reached
an agreement to supply US$1bn worth of telecoms network equipment in 19 regions across the country.
This partnership has extended from an earlier agreement in May, that Ericsson would supply CMPak with
a complete GSM network covering 319 cities located across the south of the country. However, Ericsson
faces two potential threats in China. The first is the challenge the vendor faces from home-grown talents
such as Huawei Technologies, which has an ability to offer lower cost equipment; impacting international
and local sales. Secondly, local vendors are likely to be in favour for China's preferred TD-SCMDA
standard. China Mobile is carrying out tests of the local home-grown 3G technology, but only allocated
Ericsson a 1.4% share of its total TD-SCDMA contract, with Huawei Technologies and ZTE benefiting
the most from the deal. Furthermore, in the case that TD-SCDMA does become the favoured technology
over GSM, this could see Ericsson lose out given its dominance in the Chinese GSM handset market,
where it has a 35% share.

Pakistan Telecommunications Report Q1 2008
© Business Monitor International Ltd Page 31
Table: Top 10 Markets In Sale
YTD Share of Total Sales Q3 Share of Isolated Total Sales
China 7% 5%
India 6% 6%
US 5% 6%
Italy 5% 6%
Spain 5% 4%
UK 5% 4%
Sweden 4% 4%
Indonesia 3% 3%
Japan 3% 2%
Australia 3% 3%
Source: Ericsson
Next in line is India, accounting for 6% of Ericsson's total sales to date. The country has been trialling a
mobile broadband project since early September 2007, across 18 villages and 15 towns near Chennai in
Tamil Nadu. Using W-CDMA/HSPA technology, the vendor has sought to provide these rural
communities with high-speed internet so that they are able to access a range of new services including
telemedicine, e-education, e-governance, online local information, voice and video call services, as well
as live TV and entertainment. With some 70% of India's population living in rural areas, Ericsson
continues to delve deeper into such communities. Past projects have also included helping operators use
local crops such as cotton and fish oil to power phone transmitters in areas devoid of national electricity
grids. Such rural projects come in addition to contracts awarded by some of the country's largest mobile
operators. In early September, Ericsson was awarded a turnkey contract valued at US$1.3bn to supply
GSM and W-CDMA/HSPA equipment to Bharat Sanchar Nigam Ltd (BSNL), India's leading mobile
operator.

Pakistan Telecommunications Report Q1 2008
© Business Monitor International Ltd Page 32
Operators
Pakistan Telecommunications Company Ltd (PTCL)
SWOT Analysis
Strengths
! Country's leading telecoms operator with presence in fixed-line, mobile and internet sectors
! Second-ranked mobile operator (Ufone)
! Etisalat likely to increase investment funds, especially towards mobile and broadband units
Weaknesses
! PTA has ended monopoly in local, DLD and ILD sectors
! Marked fall in revenues and profit for 2006-2007, due to intense competition and tariff reductions
! Fixed-line market in decline with number of subscribers dropping to below 4.6mn (September 2007)
Opportunities
! Rise in WLL market should reduce network roll-out costs in rural areas
! Mobile market expected by BMI to grow to over 120mn overall by the end of 2010
! PTCL could take lead on Pakistan’s growing broadband market by bringing down cost of services
Threats
! Alternative operators, TeleCard and World Call encroaching in local marke
! Introduction of competition in contracting ILD/DLD markets likely to result in price war
! Ufone coming under threat from surging mobile operators Telenor and Warid Telecom
Overview Contacts
In 1990, PTC took over the operations of the Pakistan Telephone and
Telegraph Department, as legislated under the Pakistan Telecommunications
Corporation Act 1991. In 1996, PTC became PTCL following the part
privatisation of the operator. PTCL lost its monopoly status in December 2002,
with deregulation of the telecommunications sector starting in earnest in 2003.
Following the privatisation of PTCL, started in 2006, UAE-based Etisalat now
controls the largest stake in Pakistan’s incumbent operator. The carrier plans
to restructure PTCL's pricing and marketing policies so as to enhance the
operator’s competitiveness in the broadband and mobile markets, via Ufone.
Recent Financial Performance
Annual profits fell markedly to PKR15.6bn for 2006-2007 (fiscal year ending in
June), with the operator blaming this decline on the rise in competition within
Pakistan’s alternative telecoms market. Revenues for the year fell by 5.5% y-
o-y to PKR65.3bn, which was mainly due to what the operator regarded as an
Address
! PTCL HQ G-8/4 Islamabad Pakistan
! Tel: +92 (51) 225 1926
! Web: www.ptcl.com.pk
Key Statistics
! Annual Revenues (Group – FY2004-05): PKR76bn
! Annual Revenues (Group – 2005-06): PKR69bn
! Annual Revenues (Group 2006-07): PKR65.3bn
! Net Profit (Group – FY04-05): PKR26.6bn
! Net Profit (Group – FY05-06): PKR20.8bn
! Net Profit (2006-07): PKR15.6bn

Pakistan Telecommunications Report Q1 2008
© Business Monitor International Ltd Page 33
enforced reduction in tariffs. Despite these poor results, PTCL remains in
control of Pakistan’s fixed-line and WLL markets with 95% and 59% market
shares respectively.
Meanwhile, revenues for the first quarter of FY 2007-2008 showed that net
profit continued to fall (by 39% y-o-y) to PKR3.3bn.
However, PTCL can point to the fact that it remains the only unified service
provider in Pakistan’s telecoms market with a product portfolio including voice,
broadband and mobility. Indeed, the operator plans to focus much of its
attention on its broadband services, preparing to launch bundled services such
as IPTV so it can become a triple-play operator. With the operator trialling
WiMAX services, PTCL has plans also to launch wireless broadband services.
PTCL already has 25,000 broadband subscribers, and it is confident that by
the end of the year, this figure will double. The carrier’s first target, however, is
2.5mn broadband connections, and has pledged investment to increase its
network coverage.
Mobile Services
PTCL's mobile unit Ufone is the country’s No.2 cellular operator, with over
15mn subscribers at the end of September 2007, representing a 22% share of
the market. During the first nine months of 2007, Ufone picked up about 5.4mn
net additions, equating to just over below one quarter of Pakistan’s 21.8mn
new subscribers during the period.
Facing increasing amounts of pressure from Pakistan’s third and fourth largest
mobile operators Telenor and Warid Telecom, Ufone announced another
US$150mn network expansion deal with Huawei Technologies, a long-
standing partner. Under the terms of the deal, Ufone’s network will reach an
additional 1,000 cities and highways, and the operator estimates that by the
end of June 2008, its network coverage will consist of 4,500 cities, towns,
villages and all the country’s major highways.
! Revenues (Q107-08): PKR19.9bn (21.4)
! Net Profit (Q107-08): PKR3.3bn (5.8)
! No. of Fixed-Lines Subscribers (July 2006): 5.128mn
! No. of Fixed-Line Subscribers (December 2006): 5.075mn
! No. of Fixed-Line Subscribers (March 2007): 4.885mn
! No. of Fixed-Line Subscribers (June 2007): 4.676mn
! No of Fixed-Line Subscribers (September 2007): 4.597mn
! No. of WLL Subscribers (June 2006): 662,000
! No. of WLL Subscribers (December 2006): 915,000
! No of WLL Subscribers (June 2007): 1.128mn
! No of WLL Subscribers (September 2007): 1.185mn
! No. of Mobile Subscribers (June 2006): 7.487mn
! No. of Mobile Subscribers (October 2006): 9.033mn
! No. of Mobile Subscribers (December 2006): 10.017mn
! No. of Mobile Subscribers (March 2007): 11.597mn
! No. of Mobile Subscribers (June 2007): 14.014mn
! No. of Mobile Subscribers (September 2007): 15.421mn
! Year Established: 1990

Pakistan Telecommunications Report Q1 2008
© Business Monitor International Ltd Page 34
TeleCard
SWOT Analysis
Strengths
! Licences for fixed local loop, WLL and DLD/ILD services
! Existing CDMA network of wireless and wire-line payphones
Weaknesses
! Network deployment requires further substantial investment
! Recorded a net loss of PKR54mn for fiscal 2006, caused mainly by the operator’s tariff reduction
! ILD market already showing signs of contracting
Opportunities
! Potential buyout by as yet unnamed Asian telco could see a much-needed increase in investment
! Existing payphone user base provides initial market for long-distance services
Threats
! Introduction of competition in contracting ILD/DLD markets likely to result in price war
! Fast expanding mobile market will provide competition for new subscribers Overview Contacts
TeleCard is Pakistan’s leading privately-owned payphone operator, and is
publicly listed on the Karachi and Islamabad Stock Exchanges. Its WLL
payphone network currently covers 100 cities and towns, using more than 225
cell sites and three switching centres in Karachi, Islamabad and Faisalabad.
In 2004, TeleCard acquired licences to offer fixed local loop (FLL), WLL and
ILD/DLD services. In the key WLL auctions, TeleCard obtained licences in all
14 regions, including nine in the key 1.9GHz range and 3.5GHz spectrum in all
regions, at a total cost of PKR3.12bn. By the end of September 2007,
TeleCard had more than 430,000 subscribers to its WLL network, accounting
for annual growth in its customer base of 73%.
Strategy
The company’s strategy is to capitalise on existing WLL investments to
maximise its lead over other new entrants, while providing ILD services with a
focus on captive traffic generated by its payphone and WLL customers.
TeleCard hopes to enter Pakistan’s mobile market through the use of a CDMA
network. This would, however, not hinder the operator’s continued growth in
the WLL segment.
Currently providing payphone and WLL services as well as ISP services,
Address
! 3rd Floor World Trade Center 75 East Blue Area Fazal-ul-Haq Road Islamabad Pakistan
! Web: www.telecard.com.pk
Key Statistics
! Annual Revenues (YE June 2005): PKR2.416bn
! Annual Revenues (YE June 2006): PKR2.56bn
! Net Profit (YE June 2005): PKR244.34mn
! Net Loss (YE June 2006): PKR54.331mn
! No. of WLL Subscribers (June 2006): 230,000
! No. of WLL Subscribers (December 2006): 376,000
! No. of WLL Subscribers (June 2007): 397,000
! No. of WLL Subscribers (September 2007):

Pakistan Telecommunications Report Q1 2008
© Business Monitor International Ltd Page 35
TeleCard aims to become a truly integrated telecoms player. Indeed, its GO
CDMA WLL service provides voice, data and internet services.
Recent Financial Performance
For the year ended June 30 2006, TeleCard recorded revenues of
PKR2.56bn, up by 6% y-o-y. These results fell below TeleCard’s expectations
and caused a substantial fall in profits, with the operator actually recording a
net loss for the fiscal year of PKR56mn. Intense competition in Pakistan’s WLL
market forced the operator to reduce its tariff. However, TeleCard can point to
a 95% increase in network traffic growth.
Ownership Speculation
It seems likely that an unnamed Asian telco (possibly SK Telecom – the carrier
has expressed an interest in Pakistan) will buy a majority control in TeleCard
imminently. Analysts suggest that a 55% share in TeleCard would fetch
approximately US$90mn.
437,426
! Year Established: 1992
Pakistan Telecommunications Report Q1 2008
© Business Monitor International Ltd Page 36
Mobilink
SWOT Analysis
Strengths
! Pakistan’s leading mobile operator with 28.6mn subscribers in Sept 2007
! EBITDA up by 34% y-o-y during the first three quarters of the year to US$398mn
Weaknesses
! As the operator extends its reach to rural Pakistan, ARPU continues to fall to below US$4, representing 13% y-o-y fall in Q3 2007
! Although still dominant as Pakistan’s largest mobile operator, its market share has fallen by 8pp to 41% in the last 12 months
Opportunities
! With mobile penetration in Pakistan still below 50%, there remains huge potential for growth, and especially in rural parts of the country
! Deployment of 3GPP compliant mobile softswitch in conjunction with Nokia Siemens should spark movement towards more mobile data service offers
Threats
! Pakistan is an ultra competitive mobile market with Telenor and Warid Telecom pushing Ufone for second position – all three operators are making ground on Mobilink
! Mobilink needs to maintain investment programme, despite fall in capex in order to hold off rivals
Overview Contacts
Operating from its 100% digital GSM based network, Mobilink is Pakistan's
dominant mobile operator, with 28.6mn subscribers as of September 2007 and
a market share of approximately 41%. The operator’s customer base grew by
6.2mn during the first nine months of 2007, accounting for 28.5% of all net
additions during the period, more than of its rivals. As a result of Pakistan’s
increasingly competitive mobile market, Mobilink has suffered a decline in
market share, given that the operator controlled about 50% of Pakistan’s
mobile market in June 2006.
Mobilink is a wholly-owned subsidiary of Egyptian telecoms giant Orascom. In
June 2007, Orascom acquired Rayshield Investments’ 11.3% stake for
US$290mn.
Operating a GSM network, Mobilink provides a range of prepaid (Jazz) and
postpaid (Indigo) voice, data and multimedia services. As of the end of
September 2007, about 98% of Mobilink subscribers (just over 28mn) had
access to the company’s prepaid Jazz service, with its postpaid subscriber
base actually falling.
Address
! 1/F Blue Area Kulsum Plaza Islamabad Pakistan
! Tel: +92 (51) 282 6999
! Fax: +92 (51) 282 4058
! Web: www.mobilinkgsm.com
Key Statistics
! Revenues (2005): US$732.6mn
! Revenues (2006) US$1.017bn
! Revenues (Q107): US$236mn
! Revenues (H107): US$597.4mn
! Revenues (9M 2007): US$918.7mn
! EBITDA (2005):
Pakistan Telecommunications Report Q1 2008
© Business Monitor International Ltd Page 37
Recent Financial Performance
Throughout the whole of 2006, Mobilink attracted in excess of 11mn new
mobile customers to its network. During the first nine months of 2007, it has
added 6.2mn subscribers, and is therefore likely to fall short of last year’s net
addition total.
Mobilink has some 6,000 cell sites and 63 mobile switching centres, covering
over 6,000 cities, towns and villages. With these figures, it is therefore not that
surprising that capital expenditure has actually fallen by 34% y-o-y in the first
nine months of 2007 to US$353mn.
Financial results from the first nine months of the year show a 22% y-o-y
increase in Mobilink’s revenues to US$918.7mn and a 34% y-o-y rise in
EBITDA to US$398mn. Certainly, this rise in earnings has been helped by the
fall in capex. However, there is more investment required, with only 60% of the
entire population covered by Mobilink’s network, and a highly competitive
market demands a sustained investment programme. Mobilink has pledged to
spend US$700mn in network enhancements over the next 15 months.
Mobilink continues to suffer from a drop in ARPU, which fell to US$4.1 in June
2007 and then to US$3.9 in September 2007, accounting for a 13% y-o-y fall.
This will have an effect on profitability. Mobilink may have to start working on
migrating more customers away from pre-paid packages, but it is making no
progress on that front.
Mobile Services
In an effort to introduce more VAS and differentiate its services from that of its
competitors, as well as increase ARPU rates, Mobilink launched personalised
ring-tones under the Mobitunes brand, as well as a voice SMS service under
the name of Bolo SMS. These will allow the operator to increase the
proportion of its non voice revenue stream. Mobilink also became the
exclusive provider of BlackBerry services in Pakistan, giving it a distinct
advantage in selling to the corporate market. The carrier has also launched a
new mobile commerce solution Mobilink Genie, which allows subscribers to
pay their bills and make other financial transactions.
Finally, Mobilink signed a contract with Alcatel-Lucent to deploy a WiMAX
network, allowing the use of mobile broadband services.
US$297.6mn
! EBITDA (2006): US$406.5mn
! EBITDA (Q107): US$88mn
! EBITDA (H107): 257mn
! EBITDA (9M07): US$398mn
! No. of Subscribers (June 2006): 17.1mn
! No. of Subscribers (December 2006): 22.5mn
! No. of Subscribers (March 2007): 24.6mn
! No. of Subscribers (June 2007): 26.5mn
! No. of Subscribers (September 2007): 28.6mn
! Year Established: 1994

Pakistan Telecommunications Report Q1 2008
© Business Monitor International Ltd Page 38
Telenor Pakistan
SWOT Analysis
Strengths
! In just two-and-a-half years of operation, Telenor Pakistan has attracted over 12.5mn subscribers and is now a serious challenger to Ufone, the country’s second-largest mobile operator
! Revenues have nearly tripled to NOK2.4bn over the first nine months of the year, with profitability also improving
Weaknesses
! As the operator extends its reach to rural Pakistan, ARPU continues to fall to about US$4.5, hit by high numbers of prepaid customers and reduction in tariffs
! Net additions during the third quarter of the year (1.9mn), although up on the last quarter, still unable to replicate the heights of the first quarter of the year, when there were 2.4mn net additions
Opportunities
! With mobile penetration in Pakistan still below 50%, there remains huge potential for growth, and especially in rural parts of the country
! Launch of mobile TV services presents chance for operator to increase non-voice revenues
Threats
! Pakistan is an ultra-competitive mobile market, with Warid Telecom pushing Telenor for third position
! Continued high capex, as a result of the need to invest in network deployment, is still causing operating losses
Overview Contacts
Telenor launched mobile services in Pakistan in March 2005, 11 months after
winning a tender for a national mobile licence. Telenor paid US$291mn for the
licence, and has said that it aims to invest around US$1bn by 2013 towards
the development of its network. In its first two years of operation, Telenor had
managed to gain in excess of 9mn subscribers, and by the end of September
2007 had more than 12.5mn customers, reporting 173% y-o-y growth. In just
over two years, Telenor has built up a 18% share of Pakistan’s fast-growing
mobile market.
Recent Financial Performance
Announcing its Q307 financial results, Telenor was able to highlight Pakistan
as a success story. Revenues for the first nine months of the year nearly
tripled to NOK2.4bn, and this in spite of operating in an extremely competitive
market. Even more pleasing for the operator is that its EBITDA for the first
nine months of the year was NOK206mn, compared with a negative EBITDA
of NOK280mn in September 2006, caused by Telenor’s heavy investment
programme. Telenor Pakistan is still producing an operating loss, but at
NOK292mn for the year to date, it is likely to be much less than the
NOK777mn loss at the end of 2006. Capital expenditure continues to grow, as
Address
! Telenor Pakistan
! 13-K, Moais Center,
F-7/ Markaz
Islamabad, Pakistan
! Tel: +92 51 111 345 700
! Fax: +92 51 265 2832
! Web: www.telenor.com.pk
Key Statistics
! Revenues (2005): NOK265mn
! Revenues (2006): NOK1.3bn
! Revenues (Q1 2007): NOK686mn
! Revenues (H1 2007): NOK1.527bn
! Revenues (9M 2007): NOK2.414bn
! EBITDA Loss (2005):

Pakistan Telecommunications Report Q1 2008
© Business Monitor International Ltd Page 39
Telenor builds on its network, with the Norwegian telecoms company spending
NOK2.7bn in 2007, as much as the company invested in the whole of 2006.
And the operator’s monthly ARPU continues to decline to just NOK25 by
September 2007, down by 7% q-o-q. With 99% of its subscribers prepaid, this
low ARPU is hardly surprising, whilst lower prices and an increasing amount of
packages (such as Friends & Family) is also to blame.
Latest Contracts & Agreements
In February 2007, Telenor announced with Nokia the extension of their GSM
agreement so that the Finnish company will supply Telenor with over 2,000
base stations, with a new focus on extending its operations to North-West
Frontier Province, Pakistan Administered Kashmir and the country’s northern
regions, including Islamabad.
In April 2007, Telenor launched mobile TV services, enabling customers to
watch live TV including local and international channels on their handsets.
This service is delivered on the operator’s GPRS/EDGE platform.
In September 2007, Telenor announced the opening of its network operations
centre, which will enable the pinpointing of outages anywhere across the
operator’s network. Quality of services is high on the carrier’s agenda,
especially at a time when the regulator is determined to improve customer
satisfaction in Pakistan, something that appears to have slipped in general
amidst the intensification of competition.
NOK572mn
! EBITDA Loss (2006): NOK328mn
! EBITDA Loss (Q1 2007): NOK3mn
! EBITDA (H1 2007): NOK56mn
! EBITDA (9M 2007): NOK206mn
! Operating Loss (2005): NOK798mn
! Operating Loss (2006): NOK777mn
! Operating Loss (Q1 2007): NOK158mn
! Operating Loss (H1 2007): NOK264mn
! Operating Loss (9M 2007): NOK292mn
! No. of Subscribers (June 2006): 3.574mn
! No. of Subscribers (December 2006): 6.625mn
! No. of Subscribers (June 2007): 10.701mn
! No. of Subscribers (September 2007): 12.578mn
Pakistan Telecommunications Report Q1 2008
© Business Monitor International Ltd Page 40
Warid Telecom
SWOT Analysis
Strengths
! In two-and-a-half years of operation, Warid Telecom has attracted nearly 12mn subscribers
! News that SingTel is to partner Warid Telecom signifies that the operator can use the experience of a partner that has a reputation for making successful telecoms investments
Weaknesses
! PTA has been critical of Warid Telecom’s network and its quality of service at times of heavy congestion
! Net additions during the first three quarters of the year (just over 4.2mn) less than Telenor and Ufone, which both recorded more than 5mn new customers during this period, and Mobilink, which recorded 6mn
Opportunities
! With mobile penetration in Pakistan still below 50%, there remains huge potential for growth, and especially in rural parts of the country
! Mobile TV service agreement with ROK Entertainment provides the operator with an entry to WVAS market
Threats
! Pakistan is an ultra-competitive mobile market, with Telenor remaining just ahead of Warid Telecom, and the operator still well behind Mobilink and Ufone
! Continued high capex, as a result of the need to invest in network, especially in rural Pakistan Overview
Launched in May 2005, Warid Telecom has become a key part of growth in
Pakistan’s mobile market, picking up 11.9mn subscribers in its first two-and-a-
half years of operation. Until earlier in 2007, Warid Telecom was Pakistan’s
third-largest mobile carrier, but its rival Telenor has relegated it into fourth
position. Both operators have been successful in grabbing market share away
from Ufone (22%) and even dominant player Mobilink (41.5%). It is entirely
possible that both Warid and Telenor will be pushing Ufone for second place in
Pakistan’s mobile market in 2008, although Warid has started to fall a little
behind Telenor with a 17% share of the market. If so, Warid will have to
improve the quality of its network, as the PTA has suggested that there have
been an increasing number of complaints on this issue.
To this end, Warid Telecom signed a loan agreement for US$500mn to
finance its EDGE-compliant mobile network expansion. The project, estimated
to cost US$140mn, will be complete by June 2009. It is a significant deal for
the Abu Dhabi-based operator, led by HH Sheikh Nahayan Mabarak Al
Nahayan, the Minister for Higher Education and Scientific Research in the
UAE, as it needs to consolidate its position in the Pakistan market as Telenor
Pakistan Telecommunications Report Q1 2008
© Business Monitor International Ltd Page 41
looks to enhance its own investment programme. In an effort to retain its
custom in an increasingly competitive market, in February 2007, it launched its
‘Talky’ Voice SMS service.
In April 2007, Warid announced that it would almost double its texting capacity
with Intelligent SMS routing from Telsis. It hopes, as a result, to capture some
of the ever-growing TV broadcast text-voting market, as well as roll out other
advanced texting services.
The Abu Dhabi consortium has several other finance, hospitality, property, oil
exploration and automobile-related investments in Pakistan, while its telecoms
division is about to roll out other mobile networks in Bangladesh, Uganda and
the Republic of Congo.
In June 2007, SingTel acquired a 30% equity stake in Warid Telecom for over
US$750mn, valuing the company at US$2.9bn. The deal makes sense for
SingTel as it allows the operator not only to operate for the first time in the
high-growth market of Pakistan, but also to redouble its efforts in Bangladesh
as well as launch services in Africa.
In an exciting development, Warid Telecom signed an agreement with UK-
based ROK Entertainment in September 2007 to provide streamed mobile TV
over the operator’s 2.5G network. ROK already provides such services in a
number of emerging markets including Thailand, Turkey, South Africa and
indeed Pakistan (with Telenor).
Meanwhile, Ericsson has announced a new three-year managed services
agreement with Warid in addition to the existing partnership in which the
Swedish vendor manages the operation of Warid’s GSM/GPRS network. The
new agreement will include network optimisation services, to ensure the
quality of the operator’s network.
Pakistan Telecommunications Report Q1 2008
© Business Monitor International Ltd Page 42
Appendix: Competitive Landscape
Market Overview
The telecommunications sector in Pakistan is regulated by the PTA, which was established in 1996,
following the passage of the Pakistan Telecommunication (Re-organisation) Act into the statute book.
PTA’s functions include:
! To regulate establishment, operation and maintenance of telecoms systems and services in Pakistan;
! To receive and dispose of applications for the use of radio-frequency spectrum;
! To promote and protect the interests of users of telecoms services in Pakistan;
! To promote the availability of a wide range of high quality, efficient, cost effective and competitive
telecoms services in Pakistan;
! To promote the modernisation of telecoms systems and services;
! To investigate and adjudicate on complaints and claims made against licensees arising out of alleged
contravention of the provisions of the above Act;
! To make recommendations to government on policies with respect to international telecoms, the
provision of support for participation in international meetings and arrangements to be executed in
relation to the routing of international traffic and accounting settlements.
The PTA has helped Pakistan’s telecoms industry to attract rising levels of FDI both from existing
operators looking to enhance networks, and from foreign companies looking to enter Pakistan’s telecoms
market via acquisition. In the last year alone, there have been five major acquisitions, as illustrated in the
table below.
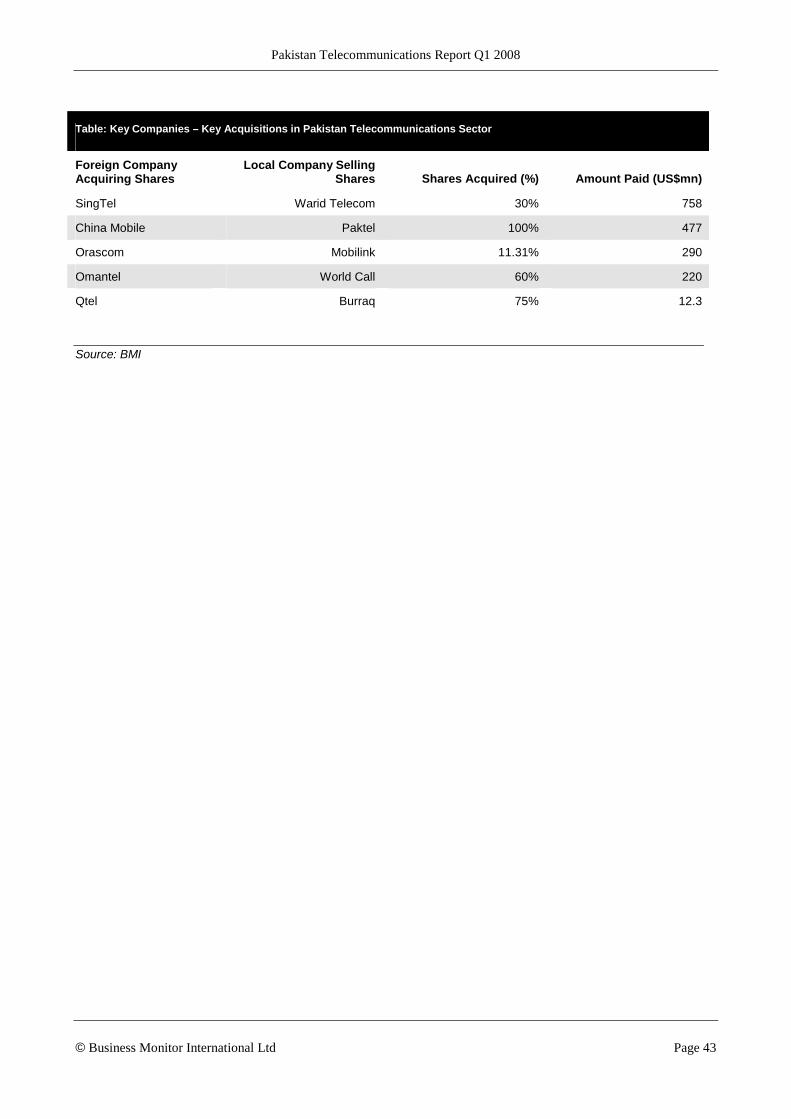
Pakistan Telecommunications Report Q1 2008
© Business Monitor International Ltd Page 43
Table: Key Companies – Key Acquisitions in Pakistan Telecommunications Sector
Foreign Company Acquiring Shares
Local Company Selling Shares Shares Acquired (%) Amount Paid (US$mn)
SingTel Warid Telecom 30% 758
China Mobile Paktel 100% 477
Orascom Mobilink 11.31% 290
Omantel World Call 60% 220
Qtel Burraq 75% 12.3
Source: BMI
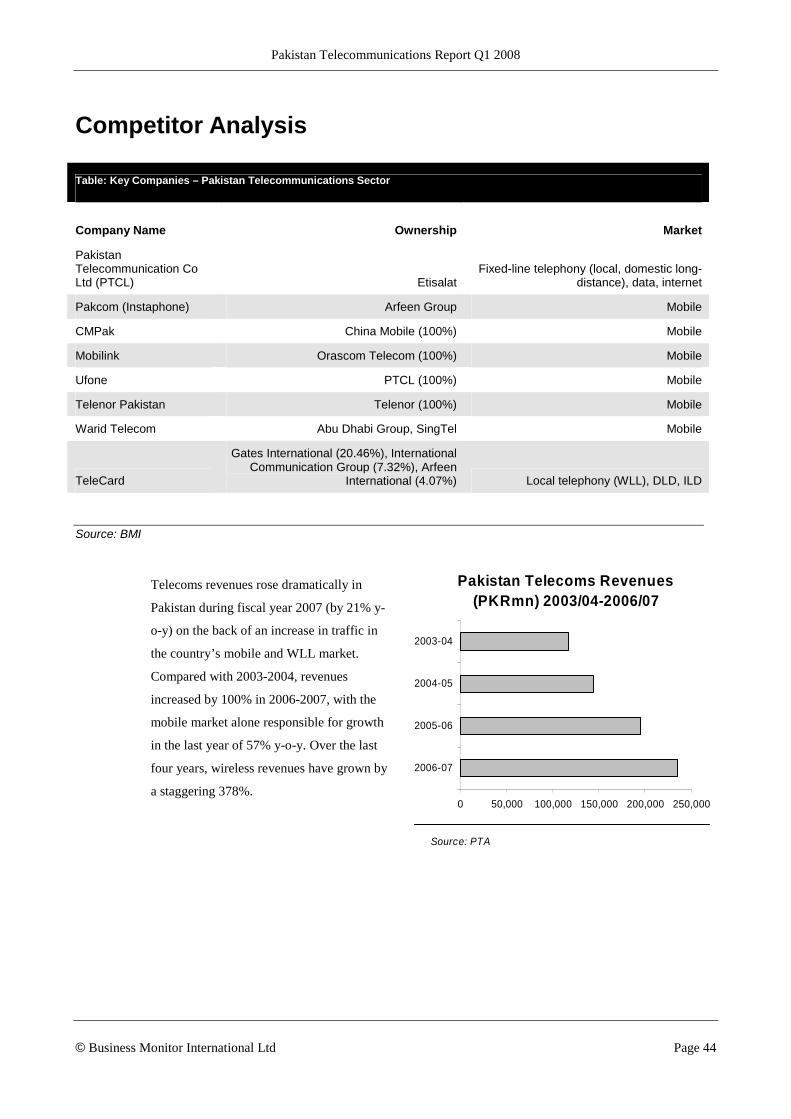
Pakistan Telecommunications Report Q1 2008
© Business Monitor International Ltd Page 44
Competitor Analysis
Table: Key Companies – Pakistan Telecommunications Sector
Company Name Ownership Market
Pakistan Telecommunication Co Ltd (PTCL) Etisalat
Fixed-line telephony (local, domestic long-distance), data, internet
Pakcom (Instaphone) Arfeen Group Mobile
CMPak China Mobile (100%) Mobile
Mobilink Orascom Telecom (100%) Mobile
Ufone PTCL (100%) Mobile
Telenor Pakistan Telenor (100%) Mobile
Warid Telecom Abu Dhabi Group, SingTel Mobile
TeleCard
Gates International (20.46%), International Communication Group (7.32%), Arfeen
International (4.07%) Local telephony (WLL), DLD, ILD
Source: BMI
Telecoms revenues rose dramatically in
Pakistan during fiscal year 2007 (by 21% y-
o-y) on the back of an increase in traffic in
the country’s mobile and WLL market.
Compared with 2003-2004, revenues
increased by 100% in 2006-2007, with the
mobile market alone responsible for growth
in the last year of 57% y-o-y. Over the last
four years, wireless revenues have grown by
a staggering 378%.
Pakistan Telecoms Revenues (PKRmn) 2003/04-2006/07
0 50,000 100,000 150,000 200,000 250,000
2006-07
2005-06
2004-05
2003-04
Source: PTA
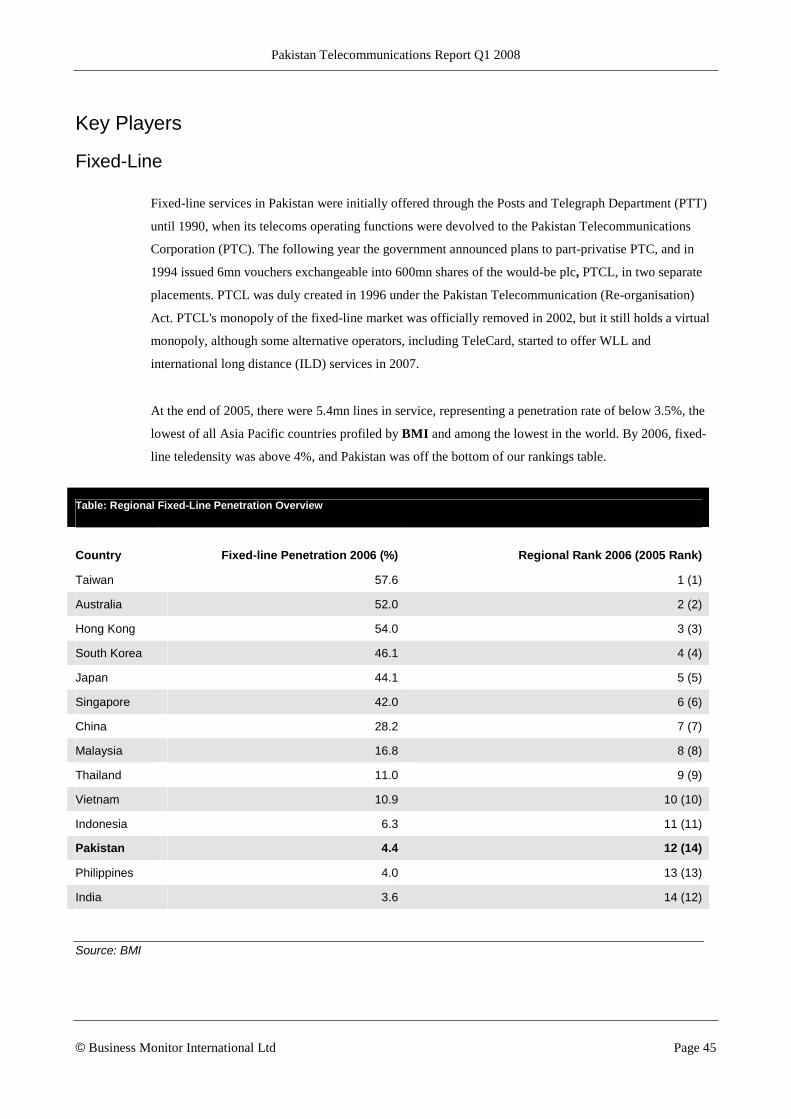
Pakistan Telecommunications Report Q1 2008
© Business Monitor International Ltd Page 45
Key Players
Fixed-Line
Fixed-line services in Pakistan were initially offered through the Posts and Telegraph Department (PTT)
until 1990, when its telecoms operating functions were devolved to the Pakistan Telecommunications
Corporation (PTC). The following year the government announced plans to part-privatise PTC, and in
1994 issued 6mn vouchers exchangeable into 600mn shares of the would-be plc, PTCL, in two separate
placements. PTCL was duly created in 1996 under the Pakistan Telecommunication (Re-organisation)
Act. PTCL's monopoly of the fixed-line market was officially removed in 2002, but it still holds a virtual
monopoly, although some alternative operators, including TeleCard, started to offer WLL and
international long distance (ILD) services in 2007.
At the end of 2005, there were 5.4mn lines in service, representing a penetration rate of below 3.5%, the
lowest of all Asia Pacific countries profiled by BMI and among the lowest in the world. By 2006, fixed-
line teledensity was above 4%, and Pakistan was off the bottom of our rankings table.
Table: Regional Fixed-Line Penetration Overview
Country Fixed-line Penetration 2006 (%) Regional Rank 2006 (2005 Rank)
Taiwan 57.6 1 (1)
Australia 52.0 2 (2)
Hong Kong 54.0 3 (3)
South Korea 46.1 4 (4)
Japan 44.1 5 (5)
Singapore 42.0 6 (6)
China 28.2 7 (7)
Malaysia 16.8 8 (8)
Thailand 11.0 9 (9)
Vietnam 10.9 10 (10)
Indonesia 6.3 11 (11)
Pakistan 4.4 12 (14)
Philippines 4.0 13 (13)
India 3.6 14 (12)
Source: BMI

Pakistan Telecommunications Report Q1 2008
© Business Monitor International Ltd Page 46
Mobile
The first mobile phone services in Pakistan were introduced in the early 1990s by Mobilink, a subsidiary
of Orascom Telecom of Egypt. Subsequently, services were introduced by Instaphone and Paktel (now
CMPak), at that time two operating subsidiaries of Millicom International Cellular (MIC), and by
Ufone, owned by PTCL. Two additional operators – Telenor and Warid Telecom – were licensed in May
2004, with both launching services in March 2005. All operators are now licensed to offer digital
services. In February 2007, China Mobile formalised the acquisition of an 88.9% stake in CMPak for
US$284mn, before extending this to 100% ownership four months later.
Despite experiencing growth of more than 100% during both 2003 and 2004, Pakistan’s mobile
penetration at the end of that year – just 3.3% – was again among the lowest in the region, marginally
higher than that of neighbouring India. This has changed, with 48mn mobile subscribers at the end of
2006 representing 124% y-o-y growth, and a penetration rate of about 31%.
Table: Regional Mobile Penetration Overview
Country Mobile Penetration 2006 (%) Regional Rank 2006 (Rank 2005)
Hong Kong 133.0 1 (1)
Singapore 105.0 2 (2)
Australia 100.1 3 (3)
Taiwan 91.5 4 (4)
Malaysia 88.0 5 (6)
South Korea 84.0 6 (5)
Japan 78.6 7 (7)
Philippines 51.1 8 (9)
Thailand 50.8 9 (8)
China 34.9 10 (10)
Pakistan 31.1 11 (12)
Indonesia 28.2 12 (11)
Vietnam 21.7 13 (13)
India 13.4 14 (14)
Source: BMI

Pakistan Telecommunications Report Q1 2008
© Business Monitor International Ltd Page 47
Internet
Despite substantial growth in Pakistan’s internet market over the past three years, the user baser of 2.4mn
in 2006 represented a penetration rate of just 1.5%, among the lowest in the world. There are around 110
ISPs in Pakistan, of which 70 are operational. However, the overwhelming majority of customers
subscribe to services offered by PTCL. Total bandwidth in the country has also increased dramatically,
from just 10 megabytes (MB) in 2000 to 230MB in 2002.
Table: Regional Internet Penetration Overview
Country Internet Penetration 2006 (%) Regional Rank 2006 (2005 Rank)
South Korea 73.3 1 (1)
Australia 68.6 2 (2)
Japan 65.1 3 (4)
Singapore 64.9 4 (5)
Taiwan 62.2 5 (4)
Hong Kong 56.0 6 (6)
Malaysia 43.8 7 (7)
Thailand 21.6 8 (8)
Vietnam 18.9 9 (9)
Indonesia 11.2 10 (11)
China 10.0 11 (12)
Philippines 9.6 =12 (10)
India 9.6 =12 (13)
Pakistan 1.5 14 (14)
Source: BMI

Pakistan Telecommunications Report Q1 2008
© Business Monitor International Ltd Page 48
Macroeconomic Forecast Scenario
Mounting Challenges To Maintaining Robust Growth
BMI View: Pakistan's economy was among the fastest growing in Asia during FY2006/07 after real GDP
expansion accelerated to 7.0% y-o-y. However, as the government strives to maximise economic growth,
the economy is coming under increasing pressure. An uncertain political outlook is another factor which
will weigh upon Pakistan's economic prospects.
Real GDP growth of 7.0% y-o-y in FY2006/07 (July-June) propelled average economic expansion in
Pakistan over the past five years to 6.9%, the highest level of sustained growth since the FY1978/79-
FY1982/83 period, according to the State Bank of Pakistan (SBP). However, while the government
remains optimistic that last year's 7.0% expansion can be bettered in FY2007/08, targeting y-o-y real
GDP growth of 7.2%, we remain much less sanguine on the prospect. Macroeconomic imbalances are
threatening to derail the economy, with Pakistan showing increasing signs of overheating. As such, we
believe that Pakistan will be forced into stepping up efforts to cool its economy in FY07/08, meaning that
growth will likely fall back towards its new higher trend path of between 6.5% and 7.0%.
We are forecasting economic growth in FY07/08 of 6.6% y-o-y, and subsequently for a gradual
acceleration towards 6.8% over the duration of our five-year forecast period. However, with Pakistan's
government intent on maximising economic growth, we recognise that there are upside risks to these
forecasts. In the SBP's annual report for FY06/07, it noted that during the five years up to and including
FY82/83, the country witnessed an appreciable reduction in poverty levels, and that there is evidence that
Pakistan's recent spell of high growth is having a similar impact. As such, the report suggests that 'it is
important to maintain the elevated growth rates in the medium to long term'.
We believe that this is an attainable goal. It appears that Pakistan has now moved onto a new, higher
growth trend, as the initial consumption-led growth boom makes way for more sustainable investment-led
growth. Gross fixed capital formation grew 20.6% y-o-y in FY06/07, having risen 17.6% and 13.5% in
the previous two years, and the ratio of investment-to-GDP reached a record 23%, according to the
central bank. While we do not expect to see these growth rates continuing to accelerate at their current
pace over the medium term, we do expect investment levels to remain robust, forecasting gross fixed
capital formation to average annual growth of around 12% throughout our forecast period.
In addition to this, private consumption looks set to remain stable throughout the duration of our forecast
period, growing at an expected average 3% y-o-y over the coming five years. This will continue to make
it a key contributor to economic growth, even as investment overtakes it as the economy's main engine.
Nevertheless, we recognise that downside risks to our consumption forecasts exist. With inflation
remaining stubbornly high, we expect to see further tightening from the SBP going forward, and
Pakistan Telecommunications Report Q1 2008
© Business Monitor International Ltd Page 49
furthermore, we believe that the bank's most recent tightening moves are still yet to fully feed into the
economy. As such, consumer spending will likely be more constrained than during previous years, going
forward.
Inflation spiked to a nine-month high of 8.37% y-o-y in September 2007, having fallen to a 15-month low
just two months previously. A slowdown in price growth witnessed in the first two months of FY07/08
(annual inflation came in at 6.37% and 6.45%, respectively, in July and August) had raised hopes that
inflation would continue to moderate throughout the current fiscal year, and that consequently the central
bank could begin to entertain the thought of ending its current tightening cycle and cut rates in 2008.
However, with food prices and money-supply growth remaining stubbornly high, we expect the SBP to
retain its tight monetary policy stance, until inflation is brought down closer to the government's 6.5%
target. This will consequently continue to negatively impact upon both consumption and investment.
Furthermore, elevated price growth continues to erode the competitiveness of the country's exports.
Pakistan recorded a current account deficit of 5.3% of GDP in FY06/07, driven largely by the country's
US$9.94bn merchandise trade deficit. While remittances and capital inflows have thus far largely been
able to cover the country's trade deficit, on a longer-term basis this will ultimately prove unsustainable,
especially given the volatile nature of capital inflows, and the susceptibility of remittances to global
economic downturns. Indeed, with US economic growth forecast to slow to 2.1% in 2008, we are
anticipating a slowdown in remittance growth in Pakistan after reaching a record US$5.49bn in FY06/07.
Failure to improve the competitiveness of Pakistani exports will increasingly weigh upon economic
activity going forward, as the current-account deficit widens towards our end-of-period forecast of 8.5%
of GDP.
Monetary Policy Suffering At The Hands Of Fiscal Policy
A key issue which must be addressed if the central bank is to be able to effectively attain its goals
however, is the country's incongruous mix of fiscal and monetary policy. While the central bank struggles
to keep inflation under control, the government is concurrently embarking on an expansionary fiscal
policy to encourage growth. This is consequently muting the impact of the central bank's monetary
tightening, which thus constrains the SBP's ability to keep a tight lid on inflation. Government spending
jumped by almost 50% y-o-y in FY2005/06, and remained at this elevated level in the following fiscal
year. However, in light of its conflicting effect upon monetary policy, and its contributory impact on
inflation, and in view of the country's poor tax-GDP ratio, we believe that this recent increase in
government spending will prove to be unsustainable. As such, our growth forecasts are based upon the
assumption that government spending will normalise to levels seen prior to FY05/06, but recognise that
this may not be the case, especially if the government opts to pursue populist policies in order to recoup
some of its lost popularity.
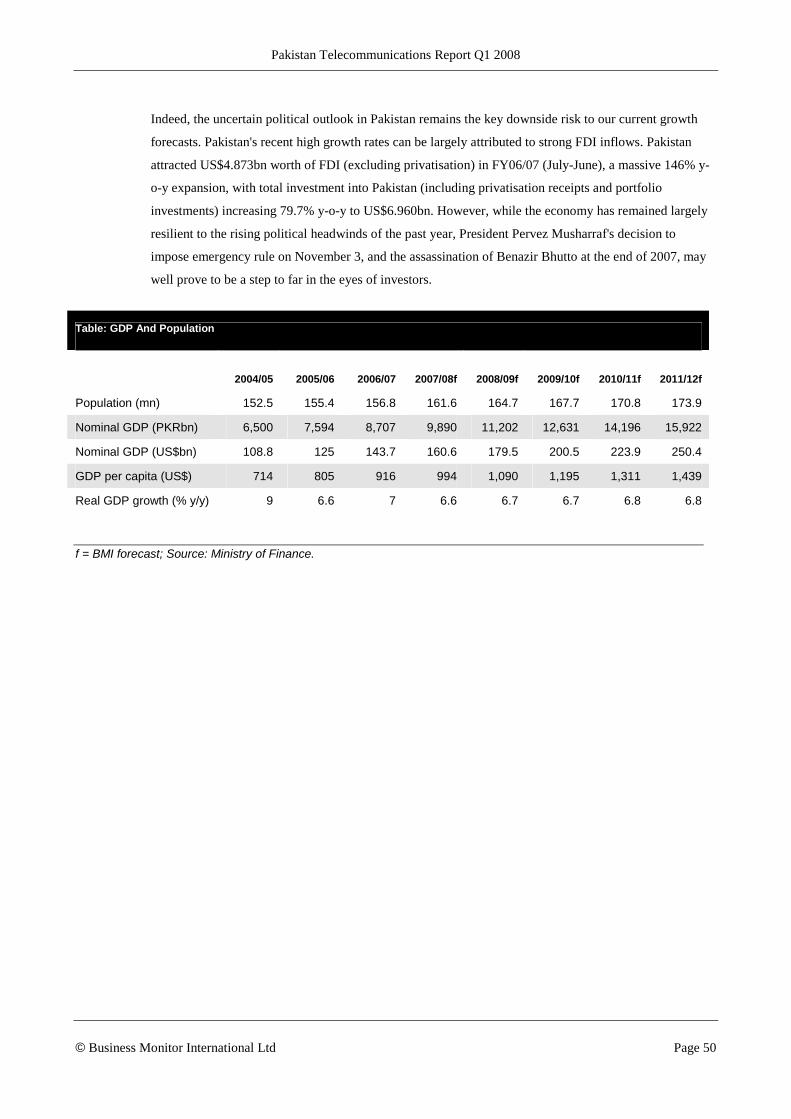
Pakistan Telecommunications Report Q1 2008
© Business Monitor International Ltd Page 50
Indeed, the uncertain political outlook in Pakistan remains the key downside risk to our current growth
forecasts. Pakistan's recent high growth rates can be largely attributed to strong FDI inflows. Pakistan
attracted US$4.873bn worth of FDI (excluding privatisation) in FY06/07 (July-June), a massive 146% y-
o-y expansion, with total investment into Pakistan (including privatisation receipts and portfolio
investments) increasing 79.7% y-o-y to US$6.960bn. However, while the economy has remained largely
resilient to the rising political headwinds of the past year, President Pervez Musharraf's decision to
impose emergency rule on November 3, and the assassination of Benazir Bhutto at the end of 2007, may
well prove to be a step to far in the eyes of investors.
Table: GDP And Population
2004/05 2005/06 2006/07 2007/08f 2008/09f 2009/10f 2010/11f 2011/12f
Population (mn) 152.5 155.4 156.8 161.6 164.7 167.7 170.8 173.9
Nominal GDP (PKRbn) 6,500 7,594 8,707 9,890 11,202 12,631 14,196 15,922
Nominal GDP (US$bn) 108.8 125 143.7 160.6 179.5 200.5 223.9 250.4
GDP per capita (US$) 714 805 916 994 1,090 1,195 1,311 1,439
Real GDP growth (% y/y) 9 6.6 7 6.6 6.7 6.7 6.8 6.8
f = BMI forecast; Source: Ministry of Finance.
Pakistan Telecommunications Report Q1 2008
© Business Monitor International Ltd Page 51
BMI Forecast Modelling
How we generate our industry forecasts
BMI's industry forecasts are generated using the best-practice techniques of time-series modelling. The
precise form of time-series model we use varies from industry to industry, in each case being determined,
as per standard practice, by the prevailing features of the industry data being examined. For example, data
for some industries may be particularly prone to seasonality, meaning seasonal trends. In other industries,
there may be pronounced non-linearity, whereby large recessions, for example, may occur more
frequently than cyclical booms.
Our approach varies from industry to industry. Common to our analysis of every industry, however, is the
use of vector autoregressions. Vector autoregressions allow us to forecast a variable using more than the
variable's own history as explanatory information. For example, when forecasting oil prices, we can
include information about oil consumption, supply and capacity.
When forecasting for some of our industry sub-component variables, however, using a variable's own
history is often the most desirable method of analysis. Such single-variable analysis is called univariate
modelling. We use the most common and versatile form of univariate models: the autoregressive moving
average model (ARMA).
In some cases, ARMA techniques are inappropriate because there is insufficient historic data or data
quality is poor. In such cases, we use either traditional decomposition methods or smoothing methods as a
basis for analysis and forecasting.
It must be remembered that human intervention plays a necessary and desirable part of all our industry
forecasting techniques. Intimate knowledge of the data and industry ensures we spot structural breaks,
anomalous data, turning points and seasonal features where a purely mechanical forecasting process
would not.
Telecommunications Industry
There are a number of principal criteria which drive our forecasts for each telecoms variable:
Subscriber numbers
Subscriber data are derived in the majority of instances from individual operators and/or national
regulators. Subscriber forecasts are then based on a range of variables including:

Pakistan Telecommunications Report Q1 2008
© Business Monitor International Ltd Page 52
! stated network rollout and capex plans;
! level of maturity of a given market;
! competition from alternative technologies (ie ADSL/wireless vs PSTN);
! potential regulatory developments (increased liberalization, etc.)
! cost of technology in relation to GDP/capita;
! and political/economic factors.
Expenditure per capita/% of GDP/% of fiscal budget are calculated using BMI’s own macroeconomic
and demographic forecasts.
Sources
Sources used in telecoms reports include national ministries and media/telecoms regulatory bodies,
officially-released company results and figures, national and international industry organisations (such as
the CTIA, the GSM Association and the ITU), and international and national news agencies.
Top Related