


Languages
Pages
Legal

March 2006
NIPPON KOEI CO.,LTD.
ALMEC CORPORATION
Ma
rch 2
006
No.
S D
0 6 013
J R
PAKISTAN TRANSPORT PLAN STUDY
IN THE ISLAMIC REPUBLIC OF
PAKISTAN
Final Report
PA
KIS
TA
N T
RA
NS
PO
RT
PLA
N S
TU
DY
IN T
HE
ISLA
MIC
RE
PU
BLIC
OF
PA
KIS
TA
N F
inal R
eport
JAPAN INTERNATIONAL COOPERATION AGENCY(JICA)
NATIONAL TRANSPORT RESEARCH CENTRE(NTRC)
MINISTRY OF COMMUNICATIONS, GOVERNMENT OF PAKISTAN

March 2006
NIPPON KOEI CO.,LTD.
ALMEC CORPORATION
PAKISTAN TRANSPORT PLAN STUDY
IN THE ISLAMIC REPUBLIC OF
PAKISTAN
Final Report
JAPAN INTERNATIONAL COOPERATION AGENCY(JICA)
NATIONAL TRANSPORT RESEARCH CENTRE(NTRC)
MINISTRY OF COMMUNICATIONS, GOVERNMENT OF PAKISTAN

PREFACE In response to a request from the Government of Pakistan, the Government of Japan decided to conduct the Pakistan Transport Plan Study in the Islamic Republic of Pakistan, and entrusted the study to the Japan International Cooperation Agency (JICA). JICA selected and dispatched a study team headed by Mr. Minoru Shibuya of Nippon Koei Co., Ltd. and consists of Nippon Koei Co., Ltd. and Almec Corporation from June 2005 to March 2006. The team held discussions with the officials concerned of the Government of Pakistan, and conducted field surveys in the study area. Upon returning to Japan, the team conducted further studies and prepared this final report. I hope that this report will contribute to the economic and social activities of Pakistan and to the enhancement of friendly relationship between our two countries. Finally, I wish to express my sincere appreciation to the officials concerned of the Government of Pakistan for their close cooperation and friendship extended to the study.
March, 2006
Kazuhisa Matsuoka Vice President Japan International Cooperation Agency

March, 2006
Letter of Transmittal
We are pleased to submit herewith the Final Report of the Pakistan Transport Plan Study in the Islamic Republic of Pakistan. This study was entrusted to Nippon Koei Co., Ltd. in association with Almec Corporation, under a contract with Japan International Cooperation Agency (JICA), during the period from June 2005 to March 2006. The report contains the advices and suggestions of the concerned authorities of the Government of Japan and your agency as well as the comments made by the concerned authorities of the Government of Pakistan. We would like to take this occasion to express our sincere gratitude to JICA and the Ministry of Communications for providing an opportunity to conduct this Study. We are also the most grateful for the cooperation, guidance and assistance of the Steering Committee, the Embassy of Japan in Pakistan and the JICA Pakistan office. We have to appreciate the Advisory Committee Members from Tokyo Institute of Technology and Ministry of Land, Infrastructure and Transportation of the Government of Japan for extending advices and comments towards the Study. We hope that this report will contribute to the economic and social activities of Pakistan. Yours Faithfully, Minoru SHIBUYA Team Leader, JICA Study Team for the Pakistan Transport Plan Study in the Islamic Republic of Pakistan

���� �� �����
� ��
�
�
�
��� ������������ ����
���� �
� � � � � ! " # �
"����������
� � � � � $ � �
%��� � $��
%��� ��$��� ��
����
&��� �� ��
'����(�(&������
( ((
����
����
"����
)�
���
*�����
����
���
&������
!���
)��
�����
����
&����� (
'���
���
����
(�+�
���(��
������
(
'�����((
'���(
(,����
(
'������
%���(� �����
$����(
&����
��� -����
-�
���(�� .���
.����
$����
/�����
$�����
0������
-���
�������
� � ���� � � ��
!"#$%� � � ��
! &'%# � � ��
( ) * +, ( -./ 012 * ( - 3 4� " ��
5� � � �
� 6 � # � � ��
� � 7 � �
��� 8����
�����
���9 ���:;
8������
� � + 1 ) ' " 0� !
" ! -
. 2 ! * � �
* � � � �
� � �
$ � � � � � �
,#-3�-& !30� ��+��#�"
,#-3)�. 0�+
0#�� 01�< "+�&���-
!1�0'(
4#"0
,�1!0 #�
����
������
�����
��5�6�
75� 8�����6��� ��� ����� �5��� ��� �5� ����9������� ������ �5�� ��: �� ��� ��: ����;�� ����6������ �6 �;;�:���;�8 �5� <����� =�������>����� ��� 6�:6������ �::6�?����� �5� ���� �� ����6��� @���� ��� ���5��6 �96��� �:�� 8 A���� ��� B�C������75� ���� ������ �� @���� ��� ���5��6 5�� ��� �� 8����96��� �:�� 8 �5� :�6�����
���� D� ����6� �� :6���9���� ���5� �EF� GA����96������
��H�6I�G5�6��
I
�6��I
�����5�6I
J5�8
>�6� �5�H��5��
>�6� A�����5�� K�����8��
L���:����
G6���9�6
��6����6
�����
L�5�� �6 �5��
G�CC�6�5�H��6
��6�8��D6��6������6
B��M9�6
N����
�5 8�6 B���
O �PO�OOPO �PO�OO QOO C�
O PO �PO�OO �OO ��
=������ ;�:���
B6�R��;�� ;�:���
7���S R��9�
��6:�6��
A���6������� 8�����6
B6�R��;�� 8�����6
���� 6���
G�;����6 6���
L��6���
.�$ "0�!
=
>?@ABC?D E?DBFGEC >H?D �CIJKAD
LM �BH?NAO "MFIPHAO GQ >?@ABC?DRGO?CAGD $?F

Pakistan Transport Plan Study in the Islamic Republic of Pakistan (PTPS)
Abbreviations /Acronyms AASHTO American Association of State Highway and Transportation Officials ADA Airport Development Authority ADB Asian Development Bank ADS Automatic Dependent System ADSB ADS Broadcast AGR Annual Growth Rate AH Asian Highway AIDS Acquired Immuno-Deficiency Syndrome AIP Aeronautical Information Publication AIS Aeronautical Information System AJK Azad Jummu and Kashmir APCC Annual Plan Coordination Committee APL American President Lines ASEAN Association of Southeast Asian Nations ASF Airport Security Force ATC Air Traffic Control ATM Air Traffic Management ATP Automatic Train Protection System BDA Balochistan Development Authority BOO Build, Operate and Own BOT Build, Operate and Transfer BPK billion passenger- km BTK billion ton-km C&W Communication and Works C&WD Communication and Works Department CAA Civil Aviation Authority CAREC Central Asian Republics Economic Cooperation CAS Compulsory Acquisition Surcharge CATC Civil Aviation Training Centre CBMs Confidence Building Measures CDLs Cash Development Loans CDWP Central Development Working Party CEO Chief Executive Officer CNG Compressed Natural Gas Cosco China Ocean Shipping Co. CSN Communication Navigation Surveillance CTC Centralized Traffic Control DE Diesel Electric DE Diesel Locomotive DFI Direct Foreign Investment DWT Deadweight Tonnage ECNEC Executive Committee of National Economic Council ECO Economic Cooperation Organization EDI Electronic Data Interchange EI Economic Indicator EIA Environmental Impact Assessment EIRR Economic Internal Rate of Return EL Electric Locomotive
Pakistan Transport Plan Study in the Islamic Republic of Pakistan (PTPS)
EMP Environmental Management Plan EP Environment Protection EPA Environmental Protection Agency EPAs Environmental Protection Acts EPZ Export Processing Zone ERP Emergency Repair Plan ESAs Equivalent Standard Axles ESCAP Economic and Social Commission for Asia and the Pacific F. Aid Foreign Aid F/S Feasibility Study Fahr. Fahrenheit FATA Federally Administered Tribal Areas FBS Federal Bureau of Statistics FC Frontier Customs FCL Full Container Load FDI Foreign Direct Investment FHA Frontier Highway Authority FOTCO Fauji Oil Terminal and Distribution Company Ltd. FWO Frontier Works Organization FY Fiscal Year GDP Gross Domestic Product GMS Greater Mekong Subregion GNP Gross National Product GOP Government of Pakistan GT road Grand Trunk Road HDM Highway Development and Management System HIES Household Integrated Survey HIV Human Immunodeficiency Virus HMM Hyundai Merchant Marine HP Horsepower HSD High Speed Diesel IAS International Accounting Standards IBRD International Bank for Reconstruction and Development ICAO International Civil Aviation Organization IEE Initial Environmental Examination ILS Instrument Landing System IOCB Iron Ore and Coal Berth IPO Initial Public Offering IRI International Roughness Index IRR Internal Rate of Return IT Information Technology ITPS Institute for Transport Policy Studies JBIC Japan Bank for International Cooperation JICA Japan International Cooperation Agency KICT Karachi International Container Terminal KKH Karakoram Highway KPT Karachi Port Trust LCL Less than Container Load LGRD Local Governmental and Rural Development Department LOA Length Overall

Pakistan Transport Plan Study in the Islamic Republic of Pakistan (PTPS)
LoC Line of Control Loco Locomotive LPG Liquefied Petroleum Gas MOC Ministry of Communications MOD Ministry of Defence MOE Ministry of Environment MOF Ministry of Finance MOIT Ministry of Information and Technology MOPS Ministry of Ports and Shipping MOR Ministry of Railways MPK Million Passenger Kilometre MTDF Medium Term Development Framework MTK Million Ton Kilometre MW Motorway NATCO Northern Area Transport Corporation NDB Non-Directional Beacon NEC National Economic Council NGO Non-Governmental Organization NH National Highway NHA National Highway Authority NHB National Highway Board NHC National Highway Council NHIP National Highway Improvement Programme Council NHMP National Highway and Motor Police NLC National Logistic Cell NM National Monument NOTAM Noticed Air Man NP National Park NPV Net Present Value NSCSA The National Shipping Company of Saudi Arabia NTPS National Transport Planning Study NTRC National Transport Research Centre NWFP North West Frontier Province O&M Operation and Maintenance OAP Open Access Policy OD Origin and Destination OECF Overseas Economic Cooperation Fund OOCL Orient Overseas Container Line OP Oil Pier OPEC Organization of Petroleum Exporting Countries P&D Planning and Development PEPA Pakistan Environmental Protection Act PFI Private Financing Initiatives PIA Pakistan International Airlines PIAC Pakistan International Airlines Corporation PICT Pakistan International Container Terminal PNSC Pakistan National Shipping Corporation POL Surcharges on Petroleum, Oil and Lubricants PONL P&O Nedlloyd PPP Public Private Partnership

Pakistan Transport Plan Study in the Islamic Republic of Pakistan (PTPS)
PQA Port Qasim Authority PR Pakistan Railways PRC Pakistan Railways Corporation PSC Pakistan State Oil PSDP Public Sector Development Program PTPS Pakistan Transport Plan Study in the Islamic Republic of Pakistan QICT Qasim International Container Terminal R&D Research & Development R/W Runway RAMD Road Asset Management Directorate RAMS Road Asset Management System RC Reinforced Concrete RDA Road Development Account RGDP Regional Gross Domestic Products RMA Road Maintenance Accounts RMU Road Management Unit ROW Right of Way Rs. Rupees SEA Strategic Environmental Assessment ST Strategic Road TA Technical Assistance TEU Twenty Feet Equivalent Unit TOR Terms of Reference TSDI Transportation Sector Development Initiative TSK Tokyo Senpaku Kaisha TTC Travel Time Cost UK United Kingdom UN United Nations USA United States of America USD US Dollars VDL VHF Data Link VHF Very High Frequency VOC Vehicle Operating Cost VOR VHF Omnidirectional Range WB World Bank WCH World Cultural Heritage WHO World Health Organization WSD Works and Services Department WTO World Trade Organization
Pakistan Transport Plan Study in the Islamic Republic of Pakistan (PTPS)
- 1 -
Executive Summary of PTPS Recommendations
1. Introduction
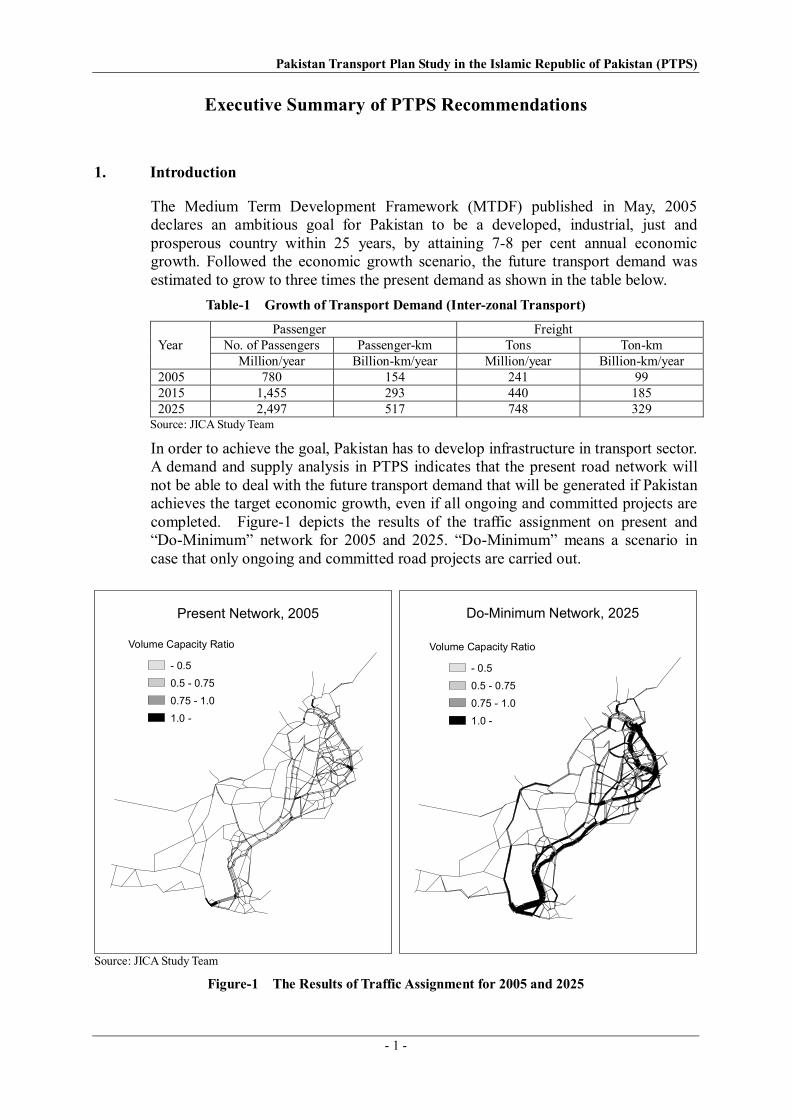
The Medium Term Development Framework (MTDF) published in May, 2005 declares an ambitious goal for Pakistan to be a developed, industrial, just and prosperous country within 25 years, by attaining 7-8 per cent annual economic growth. Followed the economic growth scenario, the future transport demand was estimated to grow to three times the present demand as shown in the table below.
Table-1 Growth of Transport Demand (Inter-zonal Transport)
Passenger Freight Year No. of Passengers Passenger-km Tons Ton-km Million/year Billion-km/year Million/year Billion-km/year 2005 780 154 241 99 2015 1,455 293 440 185 2025 2,497 517 748 329
Source: JICA Study Team
In order to achieve the goal, Pakistan has to develop infrastructure in transport sector. A demand and supply analysis in PTPS indicates that the present road network will not be able to deal with the future transport demand that will be generated if Pakistan achieves the target economic growth, even if all ongoing and committed projects are completed. Figure-1 depicts the results of the traffic assignment on present and “Do-Minimum” network for 2005 and 2025. “Do-Minimum” means a scenario in case that only ongoing and committed road projects are carried out.
Volume Capacity Ratio
- 0.5
0.5 - 0.75
0.75 - 1.0
1.0 -
Volume Capacity Ratio
- 0.5
0.5 - 0.75
0.75 - 1.0
1.0 -
Present Network, 2005 Do-Minimum Network, 2025
Source: JICA Study Team
Figure-1 The Results of Traffic Assignment for 2005 and 2025

Pakistan Transport Plan Study in the Islamic Republic of Pakistan (PTPS)
- 2 -
2. Goal, Policy and Strategy Based on the understanding of policies and strategies of the current MTDF, the Study Team set up a planning goal as: “Accomplishment of safe, stable and sustainable transport system and network with proper level of services, enough to support people’s economic and social activities”. To approach the goal, three policies and seven strategies have been selected as shown in the figure below.
Source: JICA Study Team
Figure-2 Long-Term Policies and Strategies of PTPS
Policy A: Development of transport system to support economic and social activities
• Supporting economic activities by connecting major economic centres with motorways or national highways
• Demand oriented project formation to avoid traffic congestion • Establishment of stability by providing alternative mode or route • Increase of urban bypasses • Development or improvement of inter-modal facilities • Strengthening of international routes • Management and effective utilization of existing resources
Policy B. Development of transport network to support balanced growth of regional economy
• Harmonization of transport network development with regional development policies and plans
• Network development aiming at alleviation of poverty and regional disparity • High priority setting on transport projects in poorer areas • Project implementation by utilization of local materials and procurement of local labor
force • Effective monitor of how poverty alleviation measures and projects affect
Policy C. Transport system to realize optimal modal share
• Minimization of transport cost by multi-modal transportation • Fare competition between road and rail
Policy and Strategies of MTDF
A. Transport system to support economic and social activities
B. Transport network to support balanced growth of regional economy
C. Transport system to realize optimal modal share
Planning Goal of PTPS
Long-term policies of PTPS
Strategies of PTPS
1. Financially Realizable Master Plan
4. Inter-modal Facilities Development
3. Pursuit of Road Safety
2. Transparent Prioritization
5. Cross-border Facilities Development
6. Institutional Capacity Enhancement
7. Environmental Conservation

Pakistan Transport Plan Study in the Islamic Republic of Pakistan (PTPS)
- 3 -
• Modernization of railway system through rehabilitation with improvement to railway infrastructure and facilities, renewal of rolling stock and institutional reform of management and operation
• Development and improvement of inter-modal facilities • Introduction of research works suitable for local conditions
3. Action Plan for non-Investment Projects The action plan for legislative, institutional and enforcement improvement recommended in the Master Plan is summarized as listed in Table-2. These actions are essential for developing a rational plan and effective use of infrastructure.
Table-2 Recommended non-Investment Projects
Policy Strategy
Sector Code Project Su
ppor
t eco
nom
ic &
So
cial
Act
iviti
es
Supp
ort r
egio
nal
B
alan
ced
grow
th
Rea
lize
optim
al m
odal
sh
are
Fina
ncia
lly re
aliz
able
M
aste
r Pla
n
Tran
spar
ent p
riorit
izat
ion
Purs
uit s
afet
y
Inte
r-mod
al fa
cilit
ies
Cro
ss-b
orde
r Fac
ilitie
s
Inst
itutio
nal c
apac
ity
enha
ncem
ent
Envi
ronm
enta
l co
nsid
erat
ion
General NG-01
Establishment of Transport Coordination Mechanism - Transport Policy Council - Transport Coordination Committee - Institute of Transport Policy Studies
General NG-02 Adoption of Quake resistant Design Standard
General NG-03 Review and Amendment of Cross Border Trade Agreement
General NG-04 Capacity Building of Environmental Protection Agency (EPA)
Road NR-01 Establishment of Highway Research and Training Center
Road NR-02 Implementation and Enforcement of Traffic Safety Improvement Measures
Road NR-03 Implementation and Enforcement of Anti-overloading Measures
Road NR-04 Database Building on Traffic Accident
Road NR-05 Road Development Account and Capitalization of NHA Debt
Road NR-06 Introduction of Road Tax
Rail NL-01 Reform & Restructuring of PR
Rail NL-02 Privatization of PR in long-term
Rail NL-03 Computer-aided ticketing system
Rail NL-04 Study on Conversion to Bus Transport of Less-demanded Railway Lines
Rail NL-05 Review and Revise of Rail Transport Fare
Port NP-01 Computerization of Port Cargo Statistical System
Pakistan Transport Plan Study in the Islamic Republic of Pakistan (PTPS)
- 4 -
4. Projects and Implementation Plan The Master Plan Projects The implementation plan of the Master Plan was prepared by each transport sub-sector in the period of:
• Short-Term: FY2005/06 – 2009/10
• Medium-Term: FY2010/11 – 2014/15
• Long-Term: FY2015/16 – 2024/25 The projects composing the Master Plan for the road and rail sub-sector are listed in Table-3 and Table-4, respectively. As for the port and airport sub-sectors, PTPS focused on demand forecast and review of existing plan and project. The identified projects were evaluated and prioritized primarily based on the Economic Internal Rate of Return (EIRR). Secondly, projects were examined from such viewpoints as regional balanced growth, profitability, network integration, international linkage, social equity/poverty and environmental issues. Finally, based on the comprehensive evaluation results, projects were classified into short-, medium- and long-term, also considering possible budget envelope. PTPS Priority Projects
The PTPS Priority projects have been selected for the next stage of MTDF (or in parallel with MTDF) in view of urgency from viewpoints of contribution to national economy, alleviation of traffic congestion, and safety improvement:
• Capacity Expansion of Karachi – Lahore Railway Corridor;
• The Second Khohat Tunnel;
• M-13 (Lahore – Sialkot Motorway) Construction;
• M-16 (Hyderabad –Nawabshah – Khaipur Desert Road) Construction;
• Murree – Muzaffarabad Road Improvement;
• Bridge Construction in Punjab;
• Karachi Southern Bypass ;
• Qasim Port Access;
• Lahore Strategic Peripheral Route Development;
• Lahore Multi-modal Terminal Construction;
• Bypass Construction It is recommended to carry out feasibility studies and plan the implementation program for these projects as soon as possible.

Pakistan Transport Plan Study in the Islamic Republic of Pakistan (PTPS)
- 5 -
Table-3 Master Plan Projects for Road Sector Rs. Million
PTPS Project Accumulated MTDF (2005/06 - 2009/10) Medium LongCode Project Name Cost Expenditure PSDP Short-term 2010/11- 2015/16-
Rs. M , June 05 2005/06 2006/07-09/10 2014/15 2024/25Ongoing Project
10 Marakan Coastal Road 15,010 10,153 4,366 1,500 2,866 492 020 M-1 26,862 23,882 2,980 2,370 610 0 030 M-3 6,877 6,010 611 1 610 0 040 Karachi Northan Bypass 2,928 2,704 800 800 0 0 050 Lyari Express Way 5,081 2,420 2,661 600 2,061 0 060 N75, Islamabad-Muzaffarabad Road 7,660 3,324 4,206 950 3,256 0 072 N55, Indus Highway Project (Phase III) 0 633 5,923 750 5,173 0 080 N15, Mansehra Naran Jalkhad Road 3,821 3,625 196 154 43 0 0
100 N5, Rahim Yar Khan-Bahawarpur 7,283 5,322 1,961 400 1,561 0 0110 N5, Okara-Lahore (Okara bypass) 4,462 4,405 190 190 0 0 0120 N5, Kharian-Rawalpindi 5,554 5,479 40 40 0 0 0130 N5, Chablat Nowshera (incl. flyover) 3,700 3,546 295 100 195 0 0140 Lowari Tunnel & Access Road 7,983 1,239 6,745 1,150 5,595 0 0150 Bridge on River Jhelum at Azad Pattan AJK 71 45 26 13 13 0 0160 N65, Dera Allah Yar-Nutal Section 771 979 50 50 0 0 0170 N65, Nutal-Sibi-Dhadar Section 1,710 733 977 150 827 0 0180 Improvement of KKH (N-35) NWFP 552 540 12 0 12 0 0190 N50, D.I. Khan-Mughalkot Road 1,903 1,753 350 350 0 0 0200 N70, Qila Saifullah-Loralai-Bewala 2,841 1,304 1,537 350 1,187 0 0220 M-8, Gwadar-Hoshab-Khuzdar Road 16,640 2,144 8,450 1,450 7,000 6,046 0230 M-8, Khori-Quba Saeed Khan 4,000 456 3,544 500 3,044 0 0240 N65, Realignment of N65 near Jaccobabad 478 258 220 100 120 0 0250 Bridge over River Chenab at Sharshah 1,023 393 630 370 260 0 0260 M2, Khanqah Dogran Interchange 144 43 101 100 1 0 0280 Lalamusa-Thotha Rai Bahadur 60 38 22 0 22 0 0290 N45, Noshera-Chakdara 1,620 142 1,478 1 1,477 0 0300 F/S 700 62 410 50 360 228 0470 N5 Highway Rehabilitation Project, WB 19,943 1,116 15,616 3,116 12,500 3,211 0540 N25, Kalat-Quetta-Chaman (ADB) 6,671 0 6,671 2,300 4,371 0 0551 Peshawar-Torkham Dual Carriageway 12,787 1 10,669 1,169 9,500 2,117 0552 Malana Junction- Sarai Gambia Dualization 0 0 0 0 0 0 0553 Badabher-Dara Adam Khel, Rehab of existing road 0 0 0 0 0 0 0554 Sarai Gambila-Bannu-Miran Shah-Ghulam Khan 0 0 0 0 0 0 0650 Kohat Tunnel Access Road 6,627 6,568 58 0 58 0 0670 N25, Karao-Wad Section 2,500 0 2,000 10 1,990 500 0
Ongoing Projects Sub-total 178,261 89,316 83,794 19,084 64,710 12,594 0Committed Projects
480 Rehabilitation of 518km of N5 14,610 0 6,500 0 6,500 8,110 0530 Motorway Link (Gujranwala-Pindi Bhattian) 6,000 0 0 0 0 6,000 0561 N25, Hab-Utral 3,176 0 1,003 37 966 2,173 0562 N70, Multan-Muzaffaragarh 1,352 0 426 16 410 926 0563 N50, Khanozai-Mughalkot Section 12,422 0 3,926 143 3,783 5,576 2,939564 N35, Dualization of Hassanabdal-Mansera 3,363 0 1,062 39 1,023 2,301 0565 N65, Sukker - Jacobab Bypass 2,429 0 765 28 737 1,664 0566 Tarnol-Fatejang-Kohat Road 3,848 0 1,215 44 1,171 2,633 0567 N70 (Qila Saifullah-Wiagum Rud) 4,632 0 1,463 53 1,410 3,170 0570 Malakand Tunnel/Bypass 6,000 0 500 0 500 5,500 0902 N70, Mughalkot-Zhob Road 2,100 0 0 0 0 0 0
Committed Projects Sub-total 59,932 0 16,860 360 16,500 38,053 2,939MTDF New Projects
310 Quetta Western Bypass 226 0 226 80 146 0 0335 Larkana Bridge 2,500 0 2,000 0 2,000 500 0340 Five bridges on Gilgit-Shardu Road (S-1) 215 0 215 80 135 0 0350 N40, Noshki-Dalbandin 1,986 0 2,110 129 1,981 0 0360 N15, Jalkhad-Chillas 1,827 5 1,822 1 1,821 0 0370 KKH-Skardu Road 4,000 0 1,300 0 1,300 2,700 0380 N5, Ghaggar Phatak Bridge to Kotri 2,850 0 2,850 0 2,850 0 0390 N80, Jand-Kohat Road 1,000 0 1,000 0 1,000 0 0400 Hassan Abdal Bypass 500 0 0 0 0 500 0410 Dhakpattan Bridge 520 0 520 50 470 0 0415 N55 Dadu Ratodero Fence+Ser. Rd. 3,750 0 0 0 0 3,750 0420 Other Projects 1,214 0 1,000 0 1,000 214 0421 Interchange at Kot Sarwar for Hafizabad 86 0 0 0 0 86 0422 Roads in Rawalpindi 1,000 0 0 0 0 1,000 0450 Hoshab-Srab 12,100 0 10,500 0 10,500 1,600 0460 M-7 18,000 0 15,000 0 15,000 3,000 0491 Bridge (Kotri-Sajjawal bridge), jerruk 2,500 0 0 0 0 0 2,500492 Bridge (Kotri-Dadu Moro bridge),San-Sakar 2,500 0 0 0 0 2,000 500493 Bridge (Kahndhkot-Ghotki) 2,500 0 0 0 0 0 2,500494 Rail cum Road Bridge, Chachran-Mithankot 2,500 0 0 0 0 2,000 500495 Bridge (Taunsa-Leiah) 2,500 0 0 0 0 2,000 500496 Bridge over River Indus at Kalur Kot 2,500 0 0 0 0 0 2,500497 Bridge over River Indus (Mianwali-Isa Khel) 2,500 0 0 0 0 0 2,500
Source: JICA Study Team

Pakistan Transport Plan Study in the Islamic Republic of Pakistan (PTPS)
- 6 -
cont. of Table-3 Rs. Million
PTPS Project Accumulated MTDF (2005/06 - 2009/10) Medium LongCode Project Name Cost Expenditure PSDP Short-term 2010/11- 2015/16-
Rs. M , June 05 2005/06 2006/07-09/10 2014/15 2024/25500 ITS Corridor 6,000 0 2,200 0 2,200 3,800 0510 M5, Khanewal-Rajanpur 42,000 0 2,000 0 2,000 22,000 18,000520 N5, Service Road along with Fence, WB 4,200 0 0 0 0 4,200 0580 N45 6,000 0 200 0 200 5,800 0590 Kohala-Muzafarabad Road 3,000 0 250 0 250 2,750 0591 Murree-Kohala Road 3,000 0 250 0 250 2,750 0600 N40, Lakpass-Noshki 3,600 0 450 0 450 3,150 0610 Hyderabad-Mirpurkhas-Khokhropar Road 8,880 0 700 0 700 8,180 0620 Chakdara - Kalam Road 6,500 0 500 0 500 6,000 0630 Khawaza Khala-Besham Road 3,300 0 350 0 350 2,950 0640 N65, Sibi-Quetta 6,350 0 3,200 0 3,200 3,150 0660 N70, D.G.Khan-Sakhi Sarawar-Bewala 6,200 0 2,810 10 2,800 3,390 0661 2nd Bridge on Indus at Gazi Ghat (N70) 500 0 0 0 0 495 0680 Khushalgar Birdge(N80) 3,500 0 2,100 100 2,000 1,400 0690 N55, Indus Highway Project (Phase III-a) 6,000 0 4,000 0 4,000 2,000 0700 KKH 18,500 0 3,000 0 3,000 10,000 5,500810 M-4, Faisalabad-Multan 22,080 0 8,832 0 8,832 13,248 0820 Periodic Overlay on M2 & Realignment of Salt Range 8,000 0 2,400 0 2,400 5,600 0830 M-6, Ratodero-Rajanpur 21,600 0 8,000 0 8,000 13,600 0840 M-9, Karachi-Hyderabad 6,000 0 6,000 0 6,000 0 0850 Peshawar Northan Bypass 3,078 0 3,173 100 3,073 0 0860 Rawalpindi Bypass 3,489 0 3,489 45 3,444 0 0870 N25, Lakpass Tunnel 570 3 567 1 566 0 0890 N-5, Shahdara Flyover 4,500 0 3,746 146 3,600 900 0
MTDF New Projects Sub-total 266,121 8 96,760 742 96,018 134,713 35,000PTPS New Projects
330 Bridge over Chenab at Riwaz 700 0 0 0 0 700 0655 Second Kohat Tunnel 6,000 0 0 0 0 6,000 0900 Panjub East-West Corridor-1 55,068 0 2,203 0 2,203 17,071 35,794901 Mianwali-Lakki Road 5,378 0 807 0 807 4,302 269905 Panjab East-West Corridor-2 60,618 0 2,425 0 2,425 15,761 42,433910 Panjab East-West Corridor-3 69,420 0 2,083 0 2,083 20,826 46,511915 Panjub North-South Corridor-1 70,122 0 0 0 0 10,518 59,604920 Bahawalpur, Bahawal Nagar, Sulemanki Road 34,722 0 1,736 0 1,736 12,153 20,833925 Panjub North-South Corridor-2 11,232 0 1,685 0 1,685 3,931 5,616930 Sialkot, Wazirabad, Pindi Bhattian Road 24,648 0 0 0 0 0 24,648935 Sialkot, Gujranwala, Sheikhpura Road 14,838 0 0 0 0 0 14,838940 Faisalabad, Samundari, Kacha Khu Road 22,818 0 0 0 0 5,705 17,114945 Lahore, Jaranwala, Faisalabad, Jhang Road 31,770 0 0 0 0 15,885 15,885951 M11 29,645 0 0 0 0 0 29,645952 M12 8,673 0 0 0 0 0 8,673953 M13 12,575 0 0 0 0 10,060 2,515954 M14 11,395 0 0 0 0 0 11,395955 M15&M19 51,230 0 0 0 0 0 0956 M16 29,336 0 0 0 0 7,334 22,002957 M17 20,526 0 0 0 0 0 0958 M18 20,273 0 0 0 0 0 0959 N55 (Dadu-Kotri) 4-Lane 10,000 0 0 0 0 10,000 0961 Garh Maharaja Bridge 1,000 0 0 0 0 1,000 0962 Chistian-Burewala Bridge 500 0 0 0 0 500 0963 Mohammadwala Bridge 600 0 0 0 0 600 0964 Jhelum, Gatalian Mirpur Bridge 1,250 0 0 0 0 1,250 0966 Samundari-Shahiwal Road 2,660 0 0 0 0 1,862 798967 Jaranwala-Okara Road 2,700 0 0 0 0 1,890 810968 Lahore Bridge 950 0 0 0 0 475 475969 Victoria Bridge 1,000 0 0 0 0 1,000 0971 Pind D. Khan-Jhelum Road 4,462 0 892 0 892 3,570 0972 Hyderabad-Bidin-Thata Road 11,048 0 0 0 0 0 11,048973 Mianwali-Shakardarra-Lachi Road 6,517 0 652 0 652 5,865 0974 N65 Dualization 23,645 0 0 0 0 0 23,645975 Lower Topa – Mansehra Road 11,616 0 2,323 0 2,323 9,293 0980 Qasim Port Access 3,878 0 3,878 0 3,878 0 0981 Karachi Port Access 15,000 0 0 0 0 15,000 0982 Bridge on River Indus (Khanote-Hala old) 2,500 0 0 0 0 2,500 0983 Bridge on River Indus (Daultpur-Shehwan) 2,500 0 0 0 0 2,500 0985 N55 Dualization (Kohat-D.I.Khan) 14,230 0 0 0 0 14,230 0986 N55 Dualization (D.I.Khan-D.G.Khan) 9,600 0 0 0 0 9,600 0987 N55 Dualization (Rajanpur-Ratodero) 11,630 0 0 0 0 5,815 5,815990 Sindh Coastal Highway 20,309 0 2,031 0 2,031 16,247 2,031
1000 Urban Bypass 45,536 0 3,188 0 3,188 10,929 31,4201002 Lahore Peripheral Road 24,299 0 2,430 0 2,430 21,869 0
PTPS New Projects Sub-total 818,417 0 26,331 0 26,331 266,241 433,816Grand Total 1,322,731 89,325 223,745 20,186 203,559 451,601 471,755
Source: JICA Study Team

Pakistan Transport Plan Study in the Islamic Republic of Pakistan (PTPS)
- 7 -
Table-4 Master Plan Projects for Railway Sector Rs. Million
PTPS Project Accumulated MTDF (2005/06 - 2009/10) Medium LongCode Project Name Cost Expenditure PSDP Short-term 2010/11- 2015/16-
Rs. M , June 05 2005/06 2006/07-09/10 2014/15 2024/25Ongoing Project
1 Procurement/manufacture of 175 passengercoaches
7,776 5,953 1,823 1,401 422 0 0
2 Procurement of 69 DE locos 11,151 4,188 6,963 2,234 4,729 0 03 Track rehabilitation and modernization of sleeper
factory11,192 5,686 5,506 2,000 3,506 0 0
4 Recommissioning of 55 DE locos 879 232 647 500 147 0 05 Replacement of breakdown cranes and
procurement of relief train407 286 121 63 58 0 0
6 1,300 high capacity wagons 5,870 1,727 4,143 1,500 2,643 0 07 Doubling of track Lodhran-Multan-Khanewal 3,297 433 2,864 750 2,114 0 08 Rehabilitation of 450 passenger coaches 2,145 1,300 845 575 270 0 09 Other projects 148 122 26 26 0 0 0
Ongoing Projects Sub-total 42,865 19,927 22,938 9,049 13,889 0 0MTDF New Projects 0
10 Conversion of Mirpur Khas - Khokhropar section tobroad gauge
700 300 400 400 0 0 0
11 Dualization of track from Khanewal to Raiwind 5,712 0 5,712 400 5,312 0 012 Dualization of track from Shahdara Bagh to Lala
Musa3,600 0 1,288 0 1,288 2,312 0
13 Upgrading and improvement of track from Khampurto Lala Musa
3,500 0 3,500 0 3,500 0 0
14 Doubling of track from Lahore to Faisalabadsection
3,840 0 2,940 0 2,940 900 0
15 Procurement/manufacture and assembling of 75diesel locomotives
12,700 0 12,700 0 12,700 0 0
16 Procurement/manufacture and assembly of 1,000freight wagons
4,800 0 3,600 0 3,600 1,200 0
17 Procurement/manufacture and assembly of 150passenger coaches
5,977 0 5,977 0 5,977 0 0
18 Railway yard and railway linkage from Gwadar Portto container yard
2,500 0 2,500 0 2,500 0 0
19 Rail link to Gwadar Port 12,000 0 6,500 0 6,500 5,500 020 Up-gradation Rohri - Quetta - Taftan 15,000 0 0 0 0 4,450 10,55021 Feasibility study for rail link from Kundian to
Peshawar10 0 10 0 10 0 0
22 Feasibility study for rail link from Bostan toPeshawar
10 0 10 0 10 0 0
23 Provision of road over bridge at Chowrangi ChowkEPZ (50%)
250 0 250 0 250 0 0
MTDF New Projects Sub-total 70,599 300 45,387 800 44,587 14,362 10,550PTPS New Projects 0
24Improvement of signalling system Karachi - Lahore
15,000 0 15,000 0 15,000 0 0
25 Improvement of signalling system Lahore -Rawalpindi
2,900 0 900 0 900 2,000 0
26 Improvement of signalling system Rawalpindi -Peshawar
1,300 0 0 0 0 1,300 0
27 Improvement of signalling system Faisalabad -Lahore
1,700 0 1,000 0 1,000 700 0
28 Improvement of signalling system Khanewal -Wazirabad
2,100 0 0 0 0 2,100 0
29Improvement of signalling system Rohri - Quetta
2,900 0 0 0 0 2,900 0
30 Improvement/rehabilitation of telecommunicationsystem (1st phase)
5,000 0 5,000 0 5,000 0 0
31 Improvement/rehabilitation of telecommunicationsystem (2nd phase)
3,000 0 0 0 0 3,000 0
32 Improvement of signalling system Multan - AttockCity
2,500 0 0 0 0 2,500 0
33Improvement of signalling system Kotri - Habib Kot
1,700 0 0 0 0 1,700 0
34 Improvement of signalling system Jacobabad - KotAdu
2,100 0 0 0 0 2,100 0
35 Improvement of signalling system other linescontinued
9,000 0 0 0 0 0 9,000
36 Improvement/rehabilitation of telecommunicationsystem (3rd phase)
2,000 0 0 0 0 0 2,000
37 Urgent rehabilitation of signalling andtelecommunication systems
1,000 0 1,000 0 1,000 0 0
38 Doubling of track Lala Musa - Rawalpindi 7,100 0 0 0 0 7,100 039
Doubling of track Lodhran - Khanewal (Via Chord)2,100 0 0 0 0 2,100 0
Source: JICA Study Team

Pakistan Transport Plan Study in the Islamic Republic of Pakistan (PTPS)
- 8 -
cont. of Table-4 Rs. Million
PTPS Project Accumulated MTDF (2005/06 - 2009/10) Medium LongCode Project Name Cost Expenditure PSDP Short-term 2010/11- 2015/16-
Rs. M , June 05 2005/06 2006/07-09/10 2014/15 2024/25PR40 Rehabilitation of track Rawalpindi - Peshawar 700 0 0 0 0 700 0PR41 Rehabilitation of track Multan - Attock City 2,000 0 0 0 0 2,000 0PR42 Rehabilitation of track Kotri - Habib Kot 1,400 0 0 0 0 1,400 0PR43 Rehabilitation of track Jacobabad - Kot Adu 1,700 0 0 0 0 1,700 0PR44 Rehabilitation of track other lines continued 6,000 0 0 0 0 0 6,000PR45 Planning investigation and rehabilitation of
structures200 0 200 0 200 0 0
PR46 Rehabilitation/replacement of structures Karachi -Lahore (1st phase)
5,000 0 2,000 0 2,000 3,000 0
PR47 Rehabilitation/replacement of structures Karachi -Lahore (2nd phase)
5,000 0 0 0 0 0 5,000
PR48 Urgent rehabilitation of structures of other lines 2,000 0 2,000 0 2,000 0 0PR49 Rehabilitation/replacement of structures of other
lines10,000 0 0 0 0 0 10,000
PR50 Improvement of passenger station and ticketingsystem
3,000 0 2,000 0 2,000 1,000 0
PR51 Improvement of freight stations in Karachi forcontainer/bulk transport
3,000 0 3,000 0 3,000 0 0
PR52 Expansion/improvement of container stations in up-country area
5,000 0 5,000 0 5,000 0 0
PR53 Expansion of freight stations in Karachi forcontainer/bulk transport
5,000 0 0 0 0 0 5,000
PR54 Expansion/improvement of container stations in up-country area (2)
7,000 0 0 0 0 0 7,000
PR55 Procurement/manufacture/assembling of 120diesel locomotives (3000HP)
22,000 0 3,000 0 3,000 19,000 0
PR56 Procurement/manufacture/assembling of 180diesel locomotives (2000HP)
27,000 0 3,000 0 3,000 24,000 0
PR57 Procurement/manufacture/assembly of 150 electriclocomotives (Passenger)
30,000 0 0 0 0 0 30,000
PR58 Procurement/manufacture/assembly of 180 electriclocomotives (Freight)
50,000 0 0 0 0 0 50,000
PR59 Procurement/manufacture/assembly of 550passenger coaches
25,000 0 0 0 0 25,000 0
PR60 Heavy rehabilitation/modification of 530 passengercoaches
11,000 0 5,000 0 5,000 6,000 0
PR61 Procurement/manufacture/assembly of 1,230passenger coaches
56,000 0 0 0 0 0 56,000
PR62 Procurement/manufacture/assembly of 1,050freight wagons
5,800 0 0 0 0 5,800 0
PR63 Procurement/manufacture/assembly of 7,600freight wagons
25,000 0 0 0 0 0 25,000
PR64 Expansion and modernisation of locomotives/rollingstock repair shops
15,000 0 0 0 0 0 15,000
PR65 Expansion and modernisation of locomotives/rollingstock depot
15,000 0 0 0 0 0 15,000
PR66Feasibility study of electrification Karachi - Lahore
50 0 50 0 50 0 0
PR67 Construction/rehabilitation of electrification Karachi- Lahore
27,000 0 0 0 0 7,000 20,000
PR68 Increase of transport capacity Karachi - Lahore inaddition to electrification
3,800 0 0 0 0 1,200 2,600
PR69 New link Bostan - Zhob - D.I.Khan - Kohat -Peshawar
20,000 0 0 0 0 7,000 13,000
PTPS New Projects Sub-total 451,050 0 48,150 0 48,150 132,300 270,600Grand Total 564,514 20,227 116,475 9,849 106,626 146,662 281,150
Source: JICA Study Team

Pakistan Transport Plan Study in the Islamic Republic of Pakistan (PTPS)
- 9 -
M-9M-9M-9M-9M-9M-9M-9M-9M-9M-10M-10M-10M-10M-10M-10M-10M-10M-10
M-1
8M
-18
M-1
8M
-18
M-1
8M
-18
M-1
8M
-18
M-1
8
M-7
M-7
M-7M-7
M-7M-7
M-7
M-7
M-7
M-8M-8M-8M-8M-8M-8M-8M-8M-8
M-17M-17M-17M-17M-17M-17M-17M-17M-17
M-6M-6M-6M-6M-6M-6M-6M-6M-6
M-5
M-5
M-5M-5
M-5M-5
M-5
M-5M-5
M-4M-4M-4M-4M-4M-4M-4M-4M-4
M-1M-1M-1M-1M-1M-1M-1M-1M-1
M-15M-15M-15M-15M-15M-15M-15M-15M-15
M-1
1M
-11
M-1
1M
-11
M-1
1M
-11
M-1
1M
-11
M-1
1
M-1
3M
-13
M-1
3M
-13
M-1
3M
-13
M-1
3M
-13
M-1
3
M-2
M-2
M-2
M-2
M-2
M-2
M-2
M-2
M-2
M-12M-12M-12M-12M-12M-12M-12M-12M-12ShahdaraLahore
Talagang
Karachi
M-3
M-3
M-3M-3
M-3M-3
M-3
M-3
M-3
M-14M-14M-14M-14M-14M-14M-14M-14M-14
M- 1
6M
- 16
M- 1
6M
-16
M-1
6M
- 16
M- 1
6M
- 16
M-1
6
M-1
9M
-19
M-1
9M
- 19
M- 1
9M
-19
M-1
9M
-19
M- 1
9
Islamabad
Peshawar
Quetta
Chitral
Dir
saidu
Dasu
Manasehra
HavelianParachinar
ThalKohat
DadarKagan
Madyan
Kalam
Barenis
Gujar Khan
J helum
SialkotShakarga
J and
Miran Shah
Wana TankKulachi
Lakki
Karak
MianwaliKhushab
KasurZhob
Musa Khel Bazar Okara
Pakpattan
BahawalnagarVihari
KhanewalMultan
Fort AbbasBahawalpur
KhanpurChachran
Mailsi
Kot Addu
Qamr ud Dim Kerez
Qila Saifullah
LoralaiZiaratPishin
Marnai DukiKohlu
MawandTalhKahan
Dera Bugti
Sibi
Panjpai
Nushki
Khuzdar
Wad
Besima
Kharan
DalbadinNok KundiKuh i Taftan
Surab
Nag
WashukQila Ladgashi
PnajgurParom
MandTurbat
J iwaniGwadar Pasni Ormara
Awaran
Uthal
Bela
J acobabadShuikarpurSukkarKhairpurlarkana
SarahNaushehro FirozDadu
J amao head
SangharTandu Adam
Hyderabad PithoroKhokhropar
ThattaMirpur Sakro
J atiBadin Mithi
Diplo Nagar Parkar
Umarkot
Drosh
Chaman
Chilas
Pidi Bhatt
Samundari
Kalabagh
Kati Bandar
Hoshab
Lachi Is lamabad
Lahore
Peshawar
Quetta
Karachi
Chitral
Dir
saidu
Mardan
Dasu
ManasehraAbbottabad
Parachinar
ThalKohat
Attock Cit
Dadar
Kagan
Madyan
Kalam
Barenis
Gujar Khan
Jhelum
Gujrat
Gujr anwala
SialkotShaka
Phalia
Chakwar
Jand
Miran Shah
W anaTank
Kulachi
Lakk i
Kar ak
Mianwali
Jauhar abadSargodha
Chiniot
Faisalabad
KasurJhang
BhakkarDer a Ismail Khan
Zhob
Musa Khel BazarShorkot
Okara
Pakpattan
BahawalnagarVihari
KhanewalMultan
For t AbbasBahawalpur
Ahmadpur EastLiaquatpur
Khanpur
Raimyar Khan
Mails i
Kot Addu
Qamr ud Dim Kerez
Qila Saifullah
LoralaiZiaratPishin
MarnaiDuki
Kohlu
MawandTalh
Kahan
Der a Bugti
Dera Murad Jamali
Sibi
SpezardPanjpai
Kalat
Nushki
Khuzdar
Wad
Besima
Kharan
DalbadinNok KundiKuh i Taftan
Surab
Nag
WashukQila Ladgashi
Pnajgur
Parom
MandTurbat
J iwani GwadarPasni
Ormara
Awar an
Uthal
Bela
Jacobabad
ShuikarpurSukkar
Khair purlar kana
Sarah
Naushehro FirozDadu
NawabshahSanghar
Tandu Adam
Hyderabad PithoroKhokhropar
Thatta
Sonmiami
Mirpur SakroJati
BadinMithi
D iploNagar Parkar
Umar kot
Drosh
Chaman
Chilas
Pidi Bhatt
Samundari
Kalabagh
Kati Bandar
Hoshab
Lachi
Figure-3 Proposed Motorway Network Figure-4 Highway Improvement and Widening
Islamabad
Lahore
Peshawar
Quetta
Karachi
Chitral
Dir
saidu
Mardan
Dasu
ManasehraHavelianParachinar
ThalKohat
DadarKagan
Madyan
Kalam
Barenis
Gujar Khan
J helum
Gujrat
Gujranwala
SialkotShakar
Phalia
Chakwar
J and
Miran Shah
Wana TankKulachi
Lakki
Karak
MianwaliJ auharabad
Sargodha
ChiniotFaisalabad
KasurJ hang
BhakkarDera Ismail Khan
Zhob
Musa Khel BazarShorkot Okara
Pakpattan
BahawalnagarVihari
KhanewalMultan
Fort AbbasBahawalpur
Ahmadpur EastLiaquatpur
KhanpurRaimyar Khan
Mailsi
Kot Addu
Qamr ud Dim Kerez
Qila Saifullah
LoralaiZiaratPishin
Marnai DukiKohlu
MawandTalhKahan
Dera Bugti
Dera Murad J amali
Sibi
Panjpai
Kalat
Nushki
Khuzdar
Wad
Besima
Kharan
DalbadinNok KundiKuh i Taftan
Surab
Nag
WashukQila Ladgashi
PnajgurParom
MandTurbat
J iwaniGwadar Pasni Ormara
Awaran
Uthal
Bela
J acobabadShuikarpurSukkarKhairpurlarkana
SarahNaushehro FirozDadu
NawabshahSanghar
Tandu Adam
Hyderabad PithoroKhokhropar
Thatta
Sonmiami
J atiBadin Mithi
Diplo Nagar Parkar
Umarkot
Drosh
Chaman
Chilas
Samundari
Kalabagh
Kati Bandar
Hoshab
Lachi
Proposed by PTPSExisting as of Dec. 2005
Islamabad
Lahore
Peshawar
Quetta
Karachi
Chitral
Dir
saidu
Mardan
Dasu
ManasehraHavelianParachinar
ThalKohat
DadarKagan
Madyan
Kalam
Barenis
Gujar Khan
J helum
Gujrat
Gujranwala
SialkotShaka
Phalia
Chakwar
J and
Miran Shah
Wana TankKulachi
Lakki
Karak
MianwaliJ auharabad
Sargodha
ChiniotFaisalabad
KasurJ hang
BhakkarDera Ismail Khan
Zhob
Musa Khel BazarShorkot Okara
Pakpattan
BahawalnagarVihari
KhanewalMultan
Fort AbbasBahawalpur
Ahmadpur EastLiaquatpur
KhanpurRaimyar Khan
Mailsi
Kot Addu
Qamr ud Dim Kerez
Qila Saifullah
LoralaiZiaratPishin
Marnai DukiKohlu
MawandTalhKahan
Dera Bugti
Dera Murad J amali
Sibi
Panjpai
Kalat
Nushki
Khuzdar
Wad
Besima
Kharan
DalbadinNok KundiKuh i Taftan
Surab
Nag
WashukQila Ladgashi
PnajgurParom
MandTurbat
J iwaniGwadar Pasni Ormara
Awaran
Uthal
Bela
J acobabadShuikarpurSukkarKhairpurlarkana
SarahNaushehro FirozDadu
NawabshahSanghar
Tandu Adam
Hyderabad PithoroKhokhropar
Thatta
Sonmiami
J atiBadin Mithi
DiploNagar Parkar
Umarkot
Drosh
Chaman
Chilas
Samundari
Kalabagh
Kati Bandar
Hoshab
Lachi
Figure-5 Proposed Bridges Figure-6 Proposed Bypasses
Figure-7 Railway Plan
LodhranSamasata
Multan
Khanpur
Kot AdduShorkot Cant
D.G.Khan
Faisalabad
Attok City Rawalpindi
Peshawar
HyderabadKotri
Karachi
Lala Musa
Lahore
B ahawalnagarKhanewalQuetta
Chaman
S ibi
J acobabad
Rohri
Khokhropar
Kuh-i-Taftan
Badin
Kolpur
: First Stage (2006-2010)
: Second Stage (2010-2015)
: Third Stage (2015-2025)
: Container Terminal
Source: JICA Study Team
Gwadar
Currently, 10 motorways (M1-M10) of 2,667 km are operated or planned already. In addition to these, nine motorways of 2,140 km were proposed by PTPS.
As the highway network configuration has almost completed, main stream of road investment is “widening and improvement” rather than “new construction”.
In connection with the highway development, 17 new bridges were proposed over the Indus river and its tributaries in addition to the existing 48 bridges. Urban bypasses are also proposed for 37 cities, additionally to the 65 existing bypasses.
The railway networks were classified into three categories according to their importance and the period of improvement stages, together with the development of container terminals.

Pakistan Transport Plan Study in the Islamic Republic of Pakistan (PTPS)
- 10 -
5. Cost and Budget Based on the implementation schedule, the required investment over the next 20 years was calculated at Rs. 2.06 trillion in total, of which the road sector accounted for 1.13 trillion (54.7%) and the railway sector Rs. 537 billion (26.1%).
2005/06-2009/10 2010/11-
2015/16 2015/16-2024/25
Airport
Port
RailwayRoad
050
100150200250300350
400
450
500
Note: Purchase and lease of new aircrafts are excluded from projects in “Airport” Sector after 2010/11. Source: JICA Study Team
Figure 8 Required Investment in Transport Sector over the next 20 years
In addition to the project costs in the Master Plan, the private sector is expected to play an important role to make investments in transport services in Pakistan. For example, the total procurement cost for new motor vehicles over the next 20 years was estimated at approximately Rs. 5.5 billion.
Including the private sector investments, about 2% of GDP should be allocated for the transport sector. In this case, the total investments will amount to Rs. 5.1 trillion over the next 20 years as shown in the table below.
Table-3 Investment Allocation for Transport Sector Rs. Billion
Road Railway Port & Shipping
Airport Total
2005-2010 453.7 129.0 94.5 77.2 754.4 2010-2015 630.1 179.1 131.2 107.2 1,047.6 2015-2020 854.7 242.9 178.0 145.4 1,421.0 2020-2025 1,132.4 321.8 235.9 192.7 1,882.7
Total 3,070.8 872.8 639.6 522.4 5,105.7 Source: JICA Study Team

Pakistan Transport Plan Study in the Islamic Republic of Pakistan (PTPS)
- 11 -
6. Recommendation
(1) Private Sector Involvement The private sector involvement in transport development in Pakistan is an important mechanism for the Master Plan to implement the projects. Particularly, private financing is essential to the development of the Motorway Network. Private sector investments in airport and port development should be farther promoted. The railway system should be improved to the extent that private forwarders willingly choose the railway. Privatization of PR is a long-term target. It is necessary to evaluate any candidate project for BOT/PPP carefully, because the failure in private sector investment will significantly increase the burden of the public sector. Capacity building and transparent prioritization are important for the success of the private sector participants.
(2) Establishment of Transport Coordination Mechanism Efficient transport sector development involves intra-sectoral coordination; however, the current system for project prioritization does not necessarily work adequately. In order to remedy the current status of transport system and create a sustainable planning and implementation of sector development programs a three-tiered coordination mechanisms consisting of (i) high level transport policy council, (ii) a working level transport coordination committee, and (iii) institute for transport policy studies should be established.
(3) Improvement of Data Collection and Management for Transport Planning Reliable traffic data are the basis for formulating objectives of transport development and action plans. Particularly, road accident data should be systematically collected, managed and analyzed in order to set priorities for road traffic safety. Without reliable traffic accident data, it is difficult to establish policies to reduce traffic accidents. PTPS carried out a nation-wide O/D survey in 2005, and compiled O/D matrices and relevant traffic data that are useful for transport planning. The National Transport Research Centre should maintain and make full use of the database.

Pakistan Transport Plan Study in the Islamic Republic of Pakistan (PTPS)
PAKISTAN TRANSPORT PLAN STUDY IN THE ISLAMIC REPUBLIC OF PAKISTAN
Final Report - Table of Contents
Preface
Letter of Transmitted
Location Map
Abbreviations/Acronyms
Executive Summary
Chapter 1. INTRODUCTION............................................................................................................ 1-1
1.1 Outline of the Study.......................................................................................................... 1-1
1.1.1 Background of the Study .................................................................................................. 1-1
1.1.2 Objectives of the Study .................................................................................................... 1-1
1.1.3 Study Area ........................................................................................................................ 1-1
1.1.4 Flow and Contents of the Study ....................................................................................... 1-2
1.2 Output of the Study .......................................................................................................... 1-4
1.2.1 Reporting.......................................................................................................................... 1-4
1.2.2 Seminars ........................................................................................................................... 1-4
1.3 Organization and Participants of the Study ...................................................................... 1-5
1.3.1 Organization of the Study................................................................................................. 1-5
1.3.2 Member of Counterpart .................................................................................................... 1-5
1.3.3 Study Team....................................................................................................................... 1-5
1.3.4 JICA Advisory Committee ............................................................................................... 1-6
1.3.5 Steering Committee .......................................................................................................... 1-6
1.4 Components and Structure of this Report......................................................................... 1-7
Chapter 2. PRESENT TRANSPORT SITUATION AND ISSUES ................................................... 2-1
2.1 Overview of Transport Sector .......................................................................................... 2-1
2.2 Road ................................................................................................................................. 2-3
2.2.1 Road Network................................................................................................................... 2-3
2.2.2 Road Transport ................................................................................................................. 2-11
2.2.3 Administration of Road Sector ......................................................................................... 2-19
2.2.4 Financial Situation............................................................................................................ 2-21
2.2.5 Issues and Problems ......................................................................................................... 2-28
2.3 Railway............................................................................................................................. 2-31
2.3.1 Infrastructure .................................................................................................................... 2-31
2.3.2 Rolling Stock.................................................................................................................... 2-35

Pakistan Transport Plan Study in the Islamic Republic of Pakistan (PTPS)
2.3.3 Achievements of the Previous Master Plan, JICA Study 1995......................................... 2-37
2.3.4 Railway Transport ............................................................................................................ 2-39
2.3.5 Administration of Railway Sector .................................................................................... 2-44
2.3.6 Financial Situation............................................................................................................ 2-46
2.3.7 Issues and Problems ......................................................................................................... 2-48
2.4 Port ................................................................................................................................... 2-55
2.4.1 Ports.................................................................................................................................. 2-55
2.4.2 Port Transport ................................................................................................................... 2-62
2.4.3 Administration of Port and Shipping Sector..................................................................... 2-74
2.4.4 Financial Situation............................................................................................................ 2-76
2.4.5 Issues and Problems ......................................................................................................... 2-79
2.5 Airport .............................................................................................................................. 2-80
2.5.1 Airports and Air Traffic Control....................................................................................... 2-80
2.5.2 Air Transport .................................................................................................................... 2-83
2.5.3 Administration of Aviation Sector .................................................................................... 2-87
2.5.4 Financial Situation............................................................................................................ 2-88
2.5.5 Issue and Problems........................................................................................................... 2-91
Chapter 3. SOCIO-ECONOMIC FRAMEWORK............................................................................. 3-1
3.1 Regional Structure and Transport ..................................................................................... 3-1
3.2 Population and Labour Force ........................................................................................... 3-2
3.2.1 Population......................................................................................................................... 3-2
3.2.2 Labour Force and Employment ........................................................................................ 3-10
3.3 Economic Growth............................................................................................................. 3-13
3.3.1 Past and Recent GDP Growth .......................................................................................... 3-13
3.3.2 Projection of Economic Growth....................................................................................... 3-13
3.4 Freight Transport Demand................................................................................................ 3-15
3.4.1 Analysis of Major Commodities ...................................................................................... 3-15
3.4.2 Suggested Growth of Freight Transport Demand up to 2025........................................... 3-18
3.5 Future Motorization.......................................................................................................... 3-20
3.5.1 Increase of Vehicles .......................................................................................................... 3-20
3.5.2 Investment in Truck Fleet and Bus Fleet .......................................................................... 3-21
Chapter 4. TRANSPORT DEMAND PROJECTION........................................................................ 4-1
4.1 Demand Forecast Methodology ....................................................................................... 4-1
4.1.1 Process of Demand Forecast ............................................................................................ 4-1
4.1.2 Traffic Survey................................................................................................................... 4-2
4.1.3 Zoning System.................................................................................................................. 4-2
4.1.4 Making the Present O/D Matrices .................................................................................... 4-4

Pakistan Transport Plan Study in the Islamic Republic of Pakistan (PTPS)
4.1.5 Comparison of O/D data................................................................................................... 4-6
4.2 Projection of Transport Volume Indicators....................................................................... 4-7
4.2.1 Overall Land Transport Demand...................................................................................... 4-7
4.2.2 Inter-zonal Transport Volume ........................................................................................... 4-8
4.3 Future O/D Table .............................................................................................................. 4-9
4.3.1 Trip Generation and Attraction......................................................................................... 4-9
4.3.2 Trip Distribution............................................................................................................... 4-9
4.3.3 Modal Share between Road and Rail ............................................................................... 4-11
4.3.4 Summary of Demand Forecast for Land Transport .......................................................... 4-18
4.3.5 Traffic Forecast in MTDF ................................................................................................ 4-19
4.4 Traffic Assignment Model................................................................................................ 4-20
Chapter 5. OVERALL TRANSPORT POLICY ................................................................................ 5-1
5.1 Review of Existing Development Plan............................................................................. 5-1
5.1.1 Overall Policy and Strategy of MTDF ............................................................................. 5-1
5.1.2 Policy and Strategy of Transport Sub-Sectors of MTDF.................................................. 5-1
5.2 Planning Goal ................................................................................................................... 5-3
5.3 Long-Term Policies of PTPS............................................................................................ 5-4
5.3.1 Policy A. Development of transport system to support economic and social activities ... 5-4
5.3.2 Policy B. Development of transport network to support balanced
growth of regional economy............................................................................................. 5-4
5.3.3 Policy C. Transport system to realize optimal modal share.............................................. 5-7
5.4 Development Strategy of PTPS........................................................................................ 5-7
5.4.1 Development of Financially Realizable Master Plan ....................................................... 5-8
5.4.2 Transparent Prioritization ................................................................................................. 5-8
5.4.3 Pursuit of Road Safety...................................................................................................... 5-9
5.4.4 Inter-modal Facilities Development ................................................................................. 5-9
5.4.5 Cross-border Facilities Development ............................................................................... 5-10
5.4.6 Institutional Capacity Enhancement................................................................................. 5-11
5.4.7 Environmental Consideration........................................................................................... 5-11
Chapter 6. DEVELOPMENT STRATEGY ....................................................................................... 6-1
6.1 Development of Financially Realizable Master Plan ....................................................... 6-1
6.1.1 Analysis of Financial Situation of Pakistan...................................................................... 6-1
6.1.2 Possible Investment Budget for the Master Plan.............................................................. 6-7
6.1.3 Financial Reform of Road and Rail Sectors ..................................................................... 6-11
6.1.4 Private Sector Involvement in Transport Sector ............................................................... 6-15
6.2 Transparent Prioritization ................................................................................................. 6-19
6.2.1 Administrative Framework............................................................................................... 6-19

Pakistan Transport Plan Study in the Islamic Republic of Pakistan (PTPS)
6.2.2 Decision-Making Regarding PSDP.................................................................................. 6-20
6.2.3 Decision Making Regarding Projects ............................................................................... 6-21
6.2.4 Issues for Decision-Making on Transport Sector ............................................................. 6-25
6.2.5 Institutional Reform ......................................................................................................... 6-26
6.3 Pursuit of Road Safety...................................................................................................... 6-30
6.3.1 Current Situation .............................................................................................................. 6-30
6.3.2 Policies for Road Safety ................................................................................................... 6-31
6.4 Intermodal Facilities Development .................................................................................. 6-34
6.4.1 Current Situation .............................................................................................................. 6-34
6.4.2 Policies for Intermodal Facility Development.................................................................. 6-36
6.5 Cross Border Facilities Development............................................................................... 6-37
6.5.1 Current Situation .............................................................................................................. 6-37
6.5.2 Policies for Cross Border Facility Development .............................................................. 6-44
6.5.3 Recommendations ............................................................................................................ 6-47
6.6 Institutional Capacity Enhancement................................................................................. 6-49
6.6.1 Institutional Capacity of Road Administration................................................................. 6-49
6.6.2 Institutional Reform of Road Administration................................................................... 6-51
6.6.3 Railway Administration.................................................................................................... 6-52
6.7 Environmental Consideration........................................................................................... 6-53
6.7.1 EIA Regulations ............................................................................................................... 6-53
6.7.2 EIA Procedure .................................................................................................................. 6-53
6.7.3 Environmental Management Plan .................................................................................... 6-54
6.7.4 JICA and Pakistan EPA Guidelines .................................................................................. 6-54
6.7.5 Current EIA Issues............................................................................................................ 6-55
Chapter 7. ROAD PLAN ................................................................................................................... 7-1
7.1 Planning Approach ........................................................................................................... 7-1
7.1.1 Introduction ...................................................................................................................... 7-1
7.1.2 Planning Process............................................................................................................... 7-1
7.1.3 Ongoing and Committed Projects .................................................................................... 7-2
7.2 Demand- Supply Analysis ................................................................................................ 7-4
7.2.1 Growth in Travel Demand................................................................................................ 7-4
7.2.2 Scenario Analysis ............................................................................................................. 7-5
7.2.3 Desired Route Analysis .................................................................................................... 7-7
7.2.4 Corridor Analysis ............................................................................................................. 7-8
7.2.5 Detour Rate Analysis........................................................................................................ 7-9
7.2.6 Implications of the Analyses on Road Planning............................................................... 7-10
7.3 Development Plan ............................................................................................................ 7-11
7.3.1 Pakistan Motorway Network............................................................................................ 7-11

Pakistan Transport Plan Study in the Islamic Republic of Pakistan (PTPS)
7.3.2 Highway Network ............................................................................................................ 7-13
7.3.3 Cross River Development................................................................................................. 7-14
7.3.4 Bypass Schemes ............................................................................................................... 7-15
7.3.5 Road Maintenance............................................................................................................ 7-19
7.3.6 Cost Estimation Design Standard ..................................................................................... 7-25
7.3.7 Cost Estimation ................................................................................................................ 7-26
7.4 Master Plan Projects ......................................................................................................... 7-29
7.4.1 Candidate Projects ............................................................................................................ 7-29
7.4.2 Project Evaluation ............................................................................................................ 7-34
7.4.3 Implementation Schedule ................................................................................................. 7-44
Chapter 8. RAILWAY PLAN............................................................................................................. 8-1
8.1 Planning Approach ........................................................................................................... 8-1
8.1.1 Role of Railway Transport at Present ............................................................................... 8-1
8.1.2 Profitable Market.............................................................................................................. 8-2
8.1.3 Target Market ................................................................................................................... 8-4
8.1.4 Improvement of Management .......................................................................................... 8-5
8.1.5 Development of the Corridor and a High-Speed Freight Transport System..................... 8-6
8.1.6 On-going and Proposed Projects ...................................................................................... 8-6
8.2 Demand- Supply Analysis ................................................................................................ 8-8
8.2.1 Target Demand for Passenger Transport........................................................................... 8-8
8.2.2 Target Demand for Freight Transport ............................................................................... 8-8
8.3 Development Plan ............................................................................................................ 8-11
8.3.1 General ............................................................................................................................. 8-11
8.3.2 Short-term Plan (First Stage) ............................................................................................ 8-13
8.3.3 Medium-term Plan (Second Stage)................................................................................... 8-22
8.3.4 Long-term Plan (Third Stage)........................................................................................... 8-23
8.3.5 Curtailment of Light Traffic Lines ................................................................................... 8-24
8.4 Master Plan Projects ......................................................................................................... 8-25
8.4.1 Railway Infrastructure ...................................................................................................... 8-25
8.4.2 Rolling Stock Fleet ........................................................................................................... 8-26
8.4.3 Project Evaluation ............................................................................................................ 8-26
8.4.4 Schedule and Cost ............................................................................................................ 8-31
8.5 Reform of Pakistan Railways ........................................................................................... 8-34
8.5.1 Overview .......................................................................................................................... 8-34
8.5.2 Historical Perspective of PR Privatization ....................................................................... 8-34
8.5.3 Proposed Institutional Reform.......................................................................................... 8-35
8.5.4 The Overall Effects of the Corporatization ...................................................................... 8-36
8.5.5 The Steps towards the Ultimate Privatization .................................................................. 8-37
Pakistan Transport Plan Study in the Islamic Republic of Pakistan (PTPS)
Chapter 9. PORT PLAN..................................................................................................................... 9-1
9.1 Planning Approach ........................................................................................................... 9-1
9.1.1 Function Allotment of Port Activities between Karachi and Qasim Port ......................... 9-1
9.1.2 Gwadar Port...................................................................................................................... 9-1
9.2 Demand - Supply Analysis ............................................................................................... 9-3
9.2.1 Seaborne Throughput ....................................................................................................... 9-3
9.2.2 Required Scale of Port Facilities ...................................................................................... 9-8
9.3 Development Plan ............................................................................................................ 9-15
9.3.1 Effective Utilization of the Existing Facilities ................................................................. 9-15
9.3.2 Strengthening of the Container Terminal.......................................................................... 9-15
9.3.3 Modernization of the Dry Bulk Terminal ......................................................................... 9-15
9.3.4 Establishment of Additional Liquid Terminal .................................................................. 9-15
9.3.5 Layout Plan ...................................................................................................................... 9-15
9.3.6 Public and Private Partnership.......................................................................................... 9-18
9.4 Master Plan Projects ......................................................................................................... 9-19
9.4.1 MTDF Projects ................................................................................................................. 9-19
9.4.2 Projects for the Master Plan ............................................................................................. 9-20
9.4.3 Implementation Schedule ................................................................................................. 9-20
Chapter 10. AIRPORT PLAN.............................................................................................................. 10-1
10.1 Planning Approach ........................................................................................................... 10-1
10.1.1 Introduction ...................................................................................................................... 10-1
10.1.2 Planning Process............................................................................................................... 10-1
10.2 Demand- Supply Analysis ................................................................................................ 10-1
10.2.1 Analysis of the Past Trend................................................................................................ 10-1
10.2.2 Projection of Air Transport Demand in Pakistan.............................................................. 10-2
10.3 Development Plan ............................................................................................................ 10-3
10.3.1 ASF (Airport Security Force) ........................................................................................... 10-3
10.3.2 CAA (Civil Aviation Authority) ....................................................................................... 10-3
10.3.3 PIA (Pakistan International Airline) ................................................................................. 10-3
10.4 Master Plan Projects ......................................................................................................... 10-4
10.4.1 Existing Projects............................................................................................................... 10-4
10.4.2 Proposed Projects ............................................................................................................. 10-5
Chapter 11. IMPLEMENTATION PROGRAM .................................................................................. 11-1
11.1 Implementation Schedule ................................................................................................. 11-1
11.2 Short-Term Plan ............................................................................................................... 11-6
11.2.1 Infrastructure Development.............................................................................................. 11-6
11.2.2 Institutional & Financial Reform...................................................................................... 11-6

Pakistan Transport Plan Study in the Islamic Republic of Pakistan (PTPS)
11.2.3 PTPS Priority Projects...................................................................................................... 11-10
Chapter 12. ROAD RESTORATION IN AJK AND NWFP................................................................ 12-1
12.1 Earthquake........................................................................................................................ 12-1
12.2 Damages on the Jhelum Valley Road ............................................................................... 12-3
12.3 Guideline for Restoration of the Jhelum Valley Road ...................................................... 12-7
12.4 Related Recommendations for Road Network Development........................................... 12-8
12.5 Restoration of Bridges on the Jhelum Valley Road as a Pilot Project .............................. 12-9
Annex A. Traffic Survey
Annex B. Statistics of Railway Sector
Annex C. Review of Past Studies on Overloading Problem
Annex D. Calculation of Railway Capacity
Annex E. Environmental Criteria
Annex F. Preliminary Study of Environmental Assessment Process
Annex G. Vehicle Operating Cost and Time Value

Pakistan Transport Plan Study in the Islamic Republic of Pakistan (PTPS)
List of Figures and Tables
Figures
Figure 1.1.1 Overall Flow of the Study (Master Plan) ...................................................................... 1-3
Figure 1.3.1 Organization of the Study ............................................................................................. 1-5
Figure 1.4.1 Structure of this Report ................................................................................................. 1-7
Figure 2.2.1 Length of Roads in Pakistan ......................................................................................... 2-3
Figure 2.2.2 National Highways and Motorways.............................................................................. 2-6
Figure 2.2.3 Bypasses along N-5....................................................................................................... 2-10
Figure 2.2.4 Past Trend in Freight and Passenger Transport ............................................................. 2-11
Figure 2.2.5 Past Trend in the Number of Registered Vehicles......................................................... 2-11
Figure 2.2.6 Vehicle Composition..................................................................................................... 2-12
Figure 2.2.7 Daily Traffic Volume of Motorway (July, 2004)........................................................... 2-13
Figure 2.2.8 Top 10 Commodities Carried by Truck ....................................................................... 2-14
Figure 2.2.9 Transport Distance of Perishable Goods ....................................................................... 2-14
Figure 2.2.10 Number of Casualties.................................................................................................. 2-15
Figure 2.2.11 Numbers of Accidents reported in Newspapers .......................................................... 2-16
Figure 2.2.12 Organization of NHA.................................................................................................. 2-19
Figure 2.2.13 Flow of Funds for the NHA ........................................................................................ 2-21
Figure 2.2.14 Demand and Allocation of PSDP................................................................................ 2-24
Figure 2.3.1 Pakistan Railway Network............................................................................................ 2-31
Figure 2.3.2 Change in Average Distance Travelled ......................................................................... 2-40
Figure 2.3.3 Daily Operation of Passenger Trains............................................................................. 2-40
Figure 2.3.4 Flow of Funds for the PR.............................................................................................. 2-46
Figure 2.3.5 Example of Long Waiting Time of Freight Train.......................................................... 2-52
Figure 2.3.6 Example of Long Waiting Time on Single Track Line ................................................. 2-52
Figure 2.4.1 Karachi and Qasim Ports Area ...................................................................................... 2-56
Figure 2.4.2 Port of Karachi.............................................................................................................. 2-59
Figure 2.4.3 Port of Qasim................................................................................................................ 2-61
Figure 2.4.4 Cargo Handled at the Port of Karachi ........................................................................... 2-63
Figure 2.4.5 Cargo Handled at the Port of Qasim ............................................................................. 2-64
Figure 2.4.6 Number of Vessels Calling at the Port of Karachi......................................................... 2-69
Figure 2.4.7 Number of Vessels Calling at the Port of Qasim........................................................... 2-69
Figure 2.4.8 Vessel Waiting Time at the Port of Karachi (per ship) .................................................. 2-70
Figure 2.4.9 Vessel Waiting Time at the Port of Qasim (per ship) .................................................... 2-70
Figure 2.4.10 Organization Chart of KPT ......................................................................................... 2-74
Figure 2.4.11 Organization Chart of PQA......................................................................................... 2-75
Figure 2.5.1 Airport Locations .......................................................................................................... 2-80
Figure 2.5.2 CAA Radar Coverage Chart.......................................................................................... 2-82

Pakistan Transport Plan Study in the Islamic Republic of Pakistan (PTPS)
Figure 2.5.3 Domestic Flight Network and Number of Flight .......................................................... 2-83
Figure 2.5.4 PIA International Flight Route 2005 ............................................................................. 2-83
Figure 2.5.5 Time Line of the Commercial Airline Activity ............................................................. 2-84
Figure 2.5.6 Air Passenger Traffic by Airline (Domestic)................................................................. 2-84
Figure 2.5.7 Air Passenger Traffic in Pakistan.................................................................................. 2-85
Figure 2.5.8 International Passengers by Airport .............................................................................. 2-85
Figure 2.5.9 Domestic Passengers at Four Major Airports................................................................ 2-86
Figure 2.5.10 International Passenger at Four Major Airports .......................................................... 2-86
Figure 2.5.11 Total Cargo at all Airports ........................................................................................... 2-87
Figure 3.1.1 Major Cities and Corridors ........................................................................................... 3-1
Figure 3.1.2 Transportation Flow in Pakistan, 2005 ......................................................................... 3-2
Figure 3.2.1 Linear Regression on Annual Population Growth Rate ................................................ 3-4
Figure 3.2.2 Future Population Growth Rate and Population, 2005-2030 ........................................ 3-5
Figure 3.2.3 Population Distributions and Density, 1998.................................................................. 3-7
Figure 3.2.4 Future population Increase by Province and Traffic Zone ............................................ 3-9
Figure 3.2.5 Employment Composition by Industrial Sectors in 2025 ............................................. 3-12
Figure 3.3.1 Trend of GDP Growth by Sector................................................................................... 3-13
Figure 3.3.2 Economic Growth Scenario .......................................................................................... 3-14
Figure 3.3.3 Projection of GDP by Scenario ..................................................................................... 3-15
Figure 3.4.1 Consumption of oil products in Pakistan (tonnes/year) ................................................ 3-15
Figure 3.4.2 Production of Cement in Pakistan................................................................................. 3-17
Figure 3.5.1 Correlation between Number of Vehicles and GDP...................................................... 3-20
Figure 3.5.2 Future Increase of Vehicle Fleet in Pakistan ................................................................. 3-20
Figure 4.1.1 Process followed for the Demand Forecast................................................................... 4-1
Figure 4.1.2 PTPS Zoning................................................................................................................. 4-2
Figure 4.1.3 Overall Steps for Creating O/D Matrices...................................................................... 4-4
Figure 4.1.4 Example for O/D Pair Calculation ................................................................................ 4-5
Figure 4.1.5 Vehicle Trip Distribution (2005) ................................................................................... 4-5
Figure 4.1.6 Vehicle Trips ................................................................................................................. 4-6
Figure 4.1.7 Passenger Trips and Freight Trips (Road) ..................................................................... 4-6
Figure 4.2.1 Increase in Land Transport Volume and GDP (1.0 in FY94-95)................................... 4-7
Figure 4.2.2 Regression Analysis for Passenger-Kms....................................................................... 4-7
Figure 4.2.3 Regression Analysis for Ton-Kms................................................................................. 4-8
Figure 4.3.1 Desired Line of Road Transport (Projection)................................................................ 4-10
Figure 4.3.2 Increase in Transport Volume by Rail (1.0 in 1993-94) ................................................ 4-11
Figure 4.3.3 Comparison of Economic Cost between Truck and Railway........................................ 4-13
Figure 4.3.4 Comparison between truck tariff and railway tariff ...................................................... 4-14
Figure 4.3.5 Proportion of Freight Transport Volume by Road by Distance..................................... 4-14
Figure 4.3.6 Conversion Curve of Railway....................................................................................... 4-16
Pakistan Transport Plan Study in the Islamic Republic of Pakistan (PTPS)
Figure 4.3.7 Regression Analysis of Passenger Demand for Railway Passenger.............................. 4-17
Figure 4.4.1 Daily Speed-Flow Relationships for Traffic Assignment.............................................. 4-20
Figure 5.2.1 Long-term Policies and Strategies of PTPS .................................................................. 5-3
Figure 5.3.1 Correlation of actual monthly income and estimate...................................................... 5-5
Figure 5.3.2 District-wise Social Indicators as Proxy Variables of Poverty...................................... 5-6
Figure 5.3.3 Breakeven Point of Transport Cost by Road and Railway............................................ 5-7
Figure 5.4.1 PTPS Procedure of Project Prioritization...................................................................... 5-8
Figure 6.1.1 Introduction of Road Development Account for the NHA ........................................... 6-11
Figure 6.1.2 Flow of Funds for the NHA after the Financial Reform ............................................... 6-12
Figure 6.1.3 Concept for New Accounting System........................................................................... 6-13
Figure 6.1.4 Business Structure of the Railway Sector after Privatization of Operators................... 6-15
Figure 6.2.1 Approval Process Regarding PSDP .............................................................................. 6-21
Figure 6.2.2 Approval Process and Procedures of PTPS Projects..................................................... 6-23
Figure 6.2.3 Approval Process Regarding Provincial Projects up to Rs. 5 billion............................ 6-24
Figure 6.2.4 Approval Process Regarding Provincial Projects above Rs.5 billion ........................... 6-25
Figure 6.2.5 Transport Policy and Coordination Mechanisms .......................................................... 6-29
Figure 6.3.1 Traffic Accidents Death Rate in the World ................................................................... 6-30
Figure 6.5.1 Proposed Corridor Development of Cross Border Route.............................................. 6-48
Figure 7.1.1 Procedure for Road Network Planning ......................................................................... 7-1
Figure 7.1.2 Location of Ongoing/Committed Projects .................................................................... 7-3
Figure 7.2.1 Road Network after current projects ............................................................................. 7-4
Figure 7.2.2 Traffic Assignment for Do-Minimum and MTDF Scenario (2010).............................. 7-5
Figure 7.2.3 Traffic Assignment for MTDF Scenario (2015, 2025).................................................. 7-6
Figure 7.2.4 Traffic Assignment for Modal Shift Scenario ............................................................... 7-6
Figure 7.2.5 Assigned Traffic of 2025 Demand on Current Network ............................................... 7-7
Figure 7.2.6 Demand and Supply Gap on Screen Lines.................................................................... 7-8
Figure 7.2.7 Geographical Distribution of High Detour Rates.......................................................... 7-9
Figure 7.3.1 Location of Proposed Motorway Network.................................................................... 7-11
Figure 7.3.2 Highway Improvement and Widening Plan .................................................................. 7-13
Figure 7.3.3 Existing and Proposed Bridges ..................................................................................... 7-14
Figure 7.3.4 Location of Existing and Proposed Bypasses ............................................................... 7-15
Figure 7.3.5 Karachi Access Road .................................................................................................... 7-16
Figure 7.3.6 Location Map of Lahore Strategic Peripheral Route..................................................... 7-17
Figure 7.3.7 Overloading Vicious Circle........................................................................................... 7-21
Figure 7.3.8 Typical Cross Sections .................................................................................................. 7-26
Figure 7.4.1 Location of New Projects in the MTDF........................................................................ 7-29
Figure 7.4.2 Location of Proposed Projects in PTPS ........................................................................ 7-31
Figure 7.4.3 Traffic Assignment for PTPS Network ......................................................................... 7-33
Figure 7.4.4 Vehicle Operating Cost (Economic) by Vehicle Type by Road Condition.................... 7-35
Pakistan Transport Plan Study in the Islamic Republic of Pakistan (PTPS)
Figure 7.4.5 Criteria for Economic Evaluation ................................................................................. 7-40
Figure 7.4.6 Accumulated Project Cost by Ranking ......................................................................... 7-44
Figure 8.2.1 Possible Demand in Freight Transport by Rail (Tonnage) ............................................ 8-8
Figure 8.3.1 Relationships between Management Reform and Investments..................................... 8-12
Figure 8.3.2 Development Plan of Railway System and Container Terminals ................................. 8-13
Figure 8.3.3 Effects of Project........................................................................................................... 8-15
Figure 8.5.1 Outline of Time Table for Pakistan Railways Privatization .......................................... 8-39
Figure 9.1.1 Master Plan of the Gwadar Port .................................................................................... 9-2
Figure 9.2.1 Correlation between GDP and Trade Volume ............................................................... 9-3
Figure 9.2.2 Logistic Curve for Estimation of Containerization ....................................................... 9-6
Figure 9.3.1 Layout Plan at Karachi Port (Master Plan) ................................................................... 9-16
Figure 9.3.2 Layout Plan at Qasim Port (Master Plan) ..................................................................... 9-17
Figure 9.3.3 Roles Sharing of Public and Private Sector in PPP Port Projects (%) .......................... 9-18
Figure 10.2.1 Air Passenger Demand Analysis ................................................................................. 10-2
Tables
Table 2.1.1 Past Trend of Railway and Road Transport Shares......................................................... 2-2
Table 2.2.1 Road Length and Density ............................................................................................... 2-3
Table 2.2.2 Administrative Classification of Roads .......................................................................... 2-4
Table 2.2.3 Current Road Network Length in Four Provinces .......................................................... 2-4
Table 2.2.4 National Highways and Motorways ............................................................................... 2-5
Table 2.2.5 Present Status of Motorways .......................................................................................... 2-8
Table 2.2.6 Traffic Volume Data from the PTPS Traffic Survey....................................................... 2-13
Table 2.2.7 Accident Statistics .......................................................................................................... 2-15
Table 2.2.8 Average ESAs of Trucks................................................................................................. 2-17
Table 2.2.9 Trends in Surcharges on POL from Road Users ............................................................. 2-21
Table 2.2.10 Trends in Funding to the NHA ..................................................................................... 2-22
Table 2.2.11 Financial Status of NHA*............................................................................................. 2-23
Table 2.2.12 Loans at the End of FY 2002/03 ................................................................................... 2-24
Table 2.2.13 Maintenance Fund and Expenditure ............................................................................. 2-25
Table 2.2.14 NHA Financial Plan for Maintenance in 2005-06 ........................................................ 2-25
Table 2.2.15 Financing for Development and Maintenance of Provincial Roads
in the NWFP Province.................................................................................................. 2-27
Table 2.3.1 Route and Track Length by Gauge ................................................................................. 2-32
Table 2.3.2 Classification of the Lines in 2004/05 ............................................................................ 2-32
Table 2.3.3 Progress of Track Strengthening and Rehabilitation Work............................................. 2-33
Table 2.3.4 Structural Standard ......................................................................................................... 2-33
Table 2.3.5 Existing Interlocking Systems ........................................................................................ 2-33
Table 2.3.6 Existing Block System.................................................................................................... 2-34

Pakistan Transport Plan Study in the Islamic Republic of Pakistan (PTPS)
Table 2.3.7 Number of Over-aged Locomotives over 20 years old................................................... 2-35
Table 2.3.8 Locomotives under 20 years old or Recently Rehabilitated ........................................... 2-35
Table 2.3.9 Proposed railway project for the Master Plan in 1995.................................................... 2-38
Table 2.3.10 Railway Passenger Data ............................................................................................... 2-39
Table 2.3.11 Pakistan Railways: Classification of Passenger Services ............................................. 2-41
Table 2.3.12 Passenger Fares............................................................................................................. 2-41
Table 2.3.13 Fare for the Class of Air-conditioned lower special class............................................. 2-41
Table 2.3.14 Pakistan Railways: Freight Data................................................................................... 2-42
Table 2.3.15 Commodity Volume Carried......................................................................................... 2-43
Table 2.3.16 Change in Transport Volume for Main Commodities ................................................... 2-43
Table 2.3.17 Pakistan Railways: Basic Rate Scale ............................................................................ 2-44
Table 2.3.18 Revenue and Expenditure of the PR............................................................................. 2-47
Table 2.3.19 Problems with the Existing Signalling System............................................................. 2-48
Table 2.3.20 Actual Delays Observed ............................................................................................... 2-51
Table 2.4.1 Tidal Levels .................................................................................................................... 2-55
Table 2.4.2 Navigation Channels at the Port of Karachi ................................................................... 2-58
Table 2.4.3 Berth Facilities at the Port of Karachi ............................................................................ 2-58
Table 2.4.4 Storage Facilities at the Port of Karachi ......................................................................... 2-60
Table 2.4.5 Navigation Channels at the Port of Qasim...................................................................... 2-60
Table 2.4.6 Berth Facilities at the Port of Qasim............................................................................... 2-60
Table 2.4.7 Cargo Handling Volume at the Ports of Karachi and Qasim .......................................... 2-62
Table 2.4.8 Cargo Handled at the Port of Karachi............................................................................. 2-65
Table 2.4.9 Cargo Handled at the Port of Qasim............................................................................... 2-66
Table 2.4.10 Container Traffic at the Port of Karachi ....................................................................... 2-67
Table 2.4.11 Container Traffic at the Port of Qasim.......................................................................... 2-68
Table 2.4.12 Containerized Ratio at Karachi Port (Million Tons/Year) ............................................ 2-68
Table 2.4.13 Utilization of Berths at the Port of Karachi .................................................................. 2-71
Table 2.4.14 Utilization of Berths at the Port of Qasim .................................................................... 2-72
Table 2.4.15 Main Tariff of KPT and PQA ....................................................................................... 2-73
Table 2.4.16 Trend in the Financial Status of the KPT...................................................................... 2-76
Table 2.4.17 List of Investments of the KPT..................................................................................... 2-77
Table 2.4.18 Budget of the KPT (2004/05) ....................................................................................... 2-77
Table 2.4.19 Trend in Financial Status of the PQA ........................................................................... 2-78
Table 2.4.20 Trend in the Financial Status of the PNSC ................................................................... 2-78
Table 2.5.1 Airport Condition and Facilities in Pakistan................................................................... 2-81
Table 2.5.2 Trend in the Financial Status of the CAA....................................................................... 2-88
Table 2.5.3 Navigation Charge for Over Flight in Pakistan .............................................................. 2-89
Table 2.5.4 Landing Charge .............................................................................................................. 2-89
Table 2.5.5 Aircraft Housing Charge................................................................................................. 2-89

Pakistan Transport Plan Study in the Islamic Republic of Pakistan (PTPS)
Table 2.5.6 Passenger Service Charge............................................................................................... 2-89
Table 2.5.7 Trend in the Financial Status of the PIAC ...................................................................... 2-90
Table 2.5.8 Details of Investment Financed by the PIAC ................................................................. 2-91
Table 3.2.1 Population and Rate of Birth, Death and Increase.......................................................... 3-3
Table 3.2.2 Change in population and Growth Rate in Pakistan ....................................................... 3-3
Table 3.2.3 MTDF Demographic Targets.......................................................................................... 3-4
Table 3.2.4 Projected Population of Pakistan, 2005-2030................................................................. 3-5
Table 3.2.5 Population Projection by US Census Bureau ................................................................. 3-5
Table 3.2.6 Regional Population in Census Year............................................................................... 3-6
Table 3.2.7 Projection of Provincial Population, 2005 – 2030.......................................................... 3-6
Table 3.2.8 Future Population by Traffic zone .................................................................................. 3-8
Table 3.2.9 Trends of Labour Force and Employment ...................................................................... 3-10
Table 3.2.10 Future Labour Force and Employment......................................................................... 3-10
Table 3.2.11 Industry Classification in Pakistan................................................................................ 3-11
Table 3.2.12 Employment Composition by Province in 2002........................................................... 3-11
Table 3.2.13 Change in Employment Composition by Industrial Sector .......................................... 3-11
Table 3.2.14 Employment by Industrial Sector and by Province ...................................................... 3-12
Table 3.3.1 Past Performance of Economic Growth.......................................................................... 3-13
Table 3.3.2 Economic Growth Scenarios .......................................................................................... 3-14
Table 3.3.3 Projection of GDP and GDP per Capita by Scenario...................................................... 3-14
Table 3.4.1 Production of Crops (2000 – 04) .................................................................................... 3-16
Table 3.4.2 Production of Meat, Milk and Fish................................................................................. 3-17
Table 3.4.3 Export Trends for Major Industrial Products .................................................................. 3-18
Table 3.4.4 Growth of Production, Consumption and Export assumed for
Selected Goods in MTDF, 2004/05-2009/10.................................................................. 3-19
Table 3.4.5 Freight Traffic Growth Assumed in MTDF.................................................................... 3-19
Table 3.4.6 Likely Growth of Land Freight Transport Demand........................................................ 3-19
Table 3.5.1 Regression Equation of Number of Vehicles on GDP .................................................... 3-20
Table 3.5.2 Future Vehicle Fleet in Pakistan ..................................................................................... 3-21
Table 3.5.3 Average Price of Truck and Bus ..................................................................................... 3-21
Table 3.5.4 Required Fleet and Investment in Trucks and Buses ...................................................... 3-21
Table 4.1.1 Traffic Analysis Zone and District.................................................................................. 4-3
Table 4.1.2 Comparison of Vehicle OD Tables ................................................................................. 4-6
Table 4.2.1 Projection of Land Transport Demand............................................................................ 4-8
Table 4.2.2 Share of Interzonal Traffic.............................................................................................. 4-9
Table 4.2.3 Projection of the Future Interzonal Transport................................................................. 4-9
Table 4.3.1 Unit Costs of PR ............................................................................................................. 4-12
Table 4.3.2 Unit Costs of Road Transport ......................................................................................... 4-12
Table 4.3.3 Calculation of Transport Cost per Kilometre by Rail ..................................................... 4-13

Pakistan Transport Plan Study in the Islamic Republic of Pakistan (PTPS)
Table 4.3.4 Target Railway Share of Freight Transport by Transport Distance................................. 4-15
Table 4.3.5 The Model Parameters for the Modal Share Calucation................................................. 4-15
Table 4.3.6 Future Potential Demand of Railway (Interzonal).......................................................... 4-16
Table 4.3.7 Projection of Railway Passenger Demand...................................................................... 4-17
Table 4.3.8 Projection of Passenger Transport Demand.................................................................... 4-18
Table 4.3.9 Projection of Freight Transport Demand (Million Ton-kms).......................................... 4-18
Table 4.3.10 Passenger Traffic Forecast in MTDF and PTPS ........................................................... 4-19
Table 4.3.11 Freight Traffic Forecast by MTDF and PTPS............................................................... 4-19
Table 5.1.1 Overview of MTDF Policy and Strategy for Transport Sector ....................................... 5-1
Table 5.1.2 Policy and Strategy of Transport Sub-Sectors of MTDF................................................ 5-2
Table 5.3.1 Regional Disparity in Pakistan, 1998/99 ........................................................................ 5-5
Table 6.1.1 Proportion of Deficit of GDP ......................................................................................... 6-1
Table 6.1.2 Trends in Public Debt ..................................................................................................... 6-1
Table 6.1.3 Details of Budgetary Expenditures ................................................................................. 6-2
Table 6.1.4 Details of Development Expenditures (2001/02-2004/05) ............................................. 6-2
Table 6.1.5 Investment Plans for Transport Sector (2005/06 – 2009/10) .......................................... 6-3
Table 6.1.6 Allocation of Funds of Government (2005/06 – 2009/10) ............................................. 6-3
Table 6.1.7 Trends of Foreign Investment......................................................................................... 6-4
Table 6.1.8 Trends of FDI in Main Economic Groups ...................................................................... 6-4
Table 6.1.9 List of Financial Assistance of World Bank.................................................................... 6-5
Table 6.1.10 List of Financial Assistance of ADB ............................................................................ 6-6
Table 6.1.11 Case of “2.5% of GDP” Investment (2005/06-2024/25) .............................................. 6-7
Table 6.1.12 Investment Level under MTDF (2005/06-2024/25) ..................................................... 6-7
Table 6.1.13 Investment Level under MTDF (2005/06-2024/25) ..................................................... 6-8
Table 6.1.14 Target Investment Level at 2.0% of GDP..................................................................... 6-8
Table 6.1.15 Relationship between GDP and Road Taxes................................................................. 6-9
Table 6.1.16 Road Tax Estimation..................................................................................................... 6-10
Table 6.1.17 Comparison between Estimated Revenues and Financing from Budget ...................... 6-10
Table 6.1.18 Resource Allocation under Proposed Investment Level ............................................... 6-10
Table 6.1.19 Estimation of Revenue Surplus .................................................................................... 6-12
Table 6.4.1 Summary of Dry Port Traffic Survey Results................................................................. 6-35
Table 6.5.1 No. of Vehicles Counted and Goods Tonnage Estimated Across Border Posts, 2005 . 6-40
Table 6.5.2 Commodity trade between countries of the Region, 2003.............................................. 6-41
Table 6.5.3 Comparison of GDP and Trade Volume with Pakistan of Neighboring Countries ...... 6-45
Table 6.5.4 Comparison of Cross-border Trade ................................................................................ 6-46
Table 6.7.1 Mandatory List for EIA / IEE ......................................................................................... 6-53
Table 6.7.2 Comparisons of Requirements of JICA and Pak-EPA Environmental Guidelines ......... 6-55
Table 7.1.1 List of Ongoing and Committed Projects ....................................................................... 7-3
Table 7.2.1 Growth of Transport Demand (Interzonal Transport) ..................................................... 7-4

Pakistan Transport Plan Study in the Islamic Republic of Pakistan (PTPS)
Table 7.2.2 Distance and Detour Rate among Major Cities .............................................................. 7-9
Table 7.3.1 List of Proposed Motorway Network ............................................................................. 7-12
Table 7.3.2 Lahore Strategic Peripheral Route Development Plan ................................................... 7-18
Table 7.3.3 Worldwide Road Maintenance Cost Data – ROCKS...................................................... 7-20
Table 7.3.4 Overloading Vicious Circle ............................................................................................ 7-22
Table 7.3.5 Road Standards ............................................................................................................... 7-25
Table 7.3.6 Category of Cumulative Standard Axles ........................................................................ 7-27
Table 7.3.7 Comparison of Unit Rates .............................................................................................. 7-27
Table 7.3.8 Per Kilometer Construction Cost for New Roads........................................................... 7-28
Table 7.3.9 Construction Cost per Kilometre for Road Improvement............................................... 7-28
Table 7.4.1 List of New Projects in MTDF ....................................................................................... 7-30
Table 7.4.2 List of Proposed Projects in PTPS.................................................................................. 7-32
Table 7.4.3 Passenger Time Value ..................................................................................................... 7-34
Table 7.4.4 Setting of With -Without Case........................................................................................ 7-34
Table 7.4.5 List of Road Projects for Traffic Assignment ................................................................. 7-37
Table 7.4.6 Calculation of Economic Indicators ............................................................................... 7-39
Table 7.4.7 Rating of Criteria for Project Evaluation........................................................................ 7-41
Table 7.4.8 Evaluation of MTDF New Road Projects....................................................................... 7-42
Table 7.4.9 Evaluation of PTPS Road Projects in Order of Total Score............................................ 7-43
Table 7.4.10 Implementation Schedule ............................................................................................. 7-45
Table 8.1.1 Unit Profits of PR by Business Units ............................................................................. 8-2
Table 8.1.2 Calculation of Necessary Number of Passengers per Train............................................ 8-3
Table 8.1.3 Comparison of Basic Data of Passenger Services .......................................................... 8-3
Table 8.1.4 Current Investment Projects ........................................................................................... 8-7
Table 8.2.1 Target Demand for Railway Passenger Transport........................................................... 8-8
Table 8.2.2 Estimated Passenger Traffic Density of Each Lime........................................................ 8-9
Table 8.2.3 Target Demand for Railway Freight Transport............................................................... 8-10
Table 8.2.4 Rolling Stock Procurement Plan..................................................................................... 8-10
Table 8.4.1 Estimated Line Capacity of Double-track in Karachi - Lahore for Each Stage.............. 8-28
Table 8.4.2 Estimated Transport Capacity of a Freight Train............................................................ 8-29
Table 8.4.3 Estimated Line Capacity of Single track in Primary A Lines for Each Stage................. 8-29
Table 8.4.4 Estimated Line Capacity of Single-track in Other Lines on Each Stage ........................ 8-30
Table 8.4.5 Cost Allocation for Economic Evaluation ...................................................................... 8-30
Table 8.4.6 Travel Time Saving and VOC Saving ............................................................................ 8-31
Table 8.4.7 Schedule and Estimated Cost of the Project ................................................................... 8-31
Table 9.1.1 Development of Gwadar Port (Phase I and II) ............................................................... 9-2
Table 9.2.1 Trade Volume Forecast Model........................................................................................ 9-3
Table 9.2.2 Forecast of Future Trade Volume.................................................................................... 9-4
Table 9.2.3 Demand Forecast for Import/Export Cargo .................................................................... 9-5

Pakistan Transport Plan Study in the Islamic Republic of Pakistan (PTPS)
Table 9.2.4 Percentage of Containerization....................................................................................... 9-6
Table 9.2.5 Ratio of Containerization................................................................................................ 9-6
Table 9.2.6 Container Cargo Volume and Number of Containers ..................................................... 9-7
Table 9.2.7 Cargo Classification and Allocation at Each Port........................................................... 9-7
Table 9.2.8 Required Number of General Cargo Berths.................................................................... 9-8
Table 9.2.9 Required Number of Dry Cargo Berths .......................................................................... 9-9
Table 9.2.10 Required Number of Container Cargo Berths .............................................................. 9-9
Table 9.2.11 Required Number of Liquid Bulk Cargo Berths ........................................................... 9-10
Table 9.2.12 Required Number of General Cargo Berths.................................................................. 9-10
Table 9.2.13 Required Number of Dry Bulk Cargo Berths ............................................................... 9-11
Table 9.2.14 Required Number of Liquid Cargo Oil Berths ............................................................. 9-11
Table 9.2.15 Required Number of Container Cargo Berths .............................................................. 9-12
Table 9.2.16 Required Number of Iron Ore and Coal Berths ............................................................ 9-12
Table 9.2.17 Required Number of Crude Oil and Others Berths....................................................... 9-13
Table 9.2.18 Required Number of Chemical Berths.......................................................................... 9-13
Table 9.2.19 Berth Requirements at the Two Ports ........................................................................... 9-14
Table 9.4.1 Development Plan for the Ports ...................................................................................... 9-19
Table 9.4.2 List of Port Projects (Master Plan) ................................................................................. 9-20
Table 9.4.3 Stage Plan for Construction of the Master Plan.............................................................. 9-21
Table 10.2.1 Projection of Air Passenger Traffic by Trend Method .................................................. 10-2
Table 10.2.2 Projection of Air Passenger Demand (Target) .............................................................. 10-2
Table 10.4.1 Current Aviation-Related Projects by ASF ................................................................... 10-4
Table 10.4.2 Current Aviation-Related Projects ................................................................................ 10-4
Table 10.4.3 Current Aviation-Related Projects by PIA.................................................................... 10-5
Table 10.4.4 Proposed Projects of Airport Development .................................................................. 10-5
Table 11.1.1 Investment Requirement ............................................................................................... 11-1
Table 11.1.2 Proposed Cost Allocation of the Master Plan Projects (Road) ..................................... 11-2
Table 11.1.3 Proposed Cost Allocation of the Master Plan Projects (Rail) ....................................... 11-4
Table 11.2.1 List of Short-Term Projects (Road)............................................................................... 11-7
Table 11.2.2 List of Short-Term Projects (Railway).......................................................................... 11-8
Table 11.2.3 List of Short-Term Projects (Port) ................................................................................ 11-9
Table 11.2.4 List of Short-Term Projects (Air).................................................................................. 11-9
Table 12.5.1 Road Damages.............................................................................................................. 12-11

Pakistan Transport Plan Study in the Islamic Republic of Pakistan (PTPS)
1-1
Chapter 1. INTRODUCTION
1.1 Outline of the Study 1.1.1 Background of the Study
The Islamic Republic of Pakistan is a large territory (land area of 796,000km2) located north-east of the Arabian Sea and extending towards the Himalayas on the border of China. The country has four provinces (Punjab, Sindh, Balochistan, and North-West Frontier Province), two territories (Islamabad Capital Territory and Federally Administrated Tribal Area), and the Pakistan parts of Kashmir. The distance between Islamabad (the capital of Pakistan) and Karachi (the provincial capital of Sindh having two important international ports) is about 1,200km in a straight line. The transport system in Pakistan plays an important role in unification of these regions in terms of political and economic activities.
In order to realize efficient and effective investment with limited resources, it is necessary to develop a comprehensive transport plan. At present, the Medium Term Development Framework covers projects up to the year 2010. However, the socio-economic situation in Pakistan has drastically changed due to globalization and political and economical changes in surrounding countries such as Afghanistan. An extensive review of the present development strategies for the transport sector is urgently required in order to reflect recent trends in the socio-economic conditions.
The Government of the Islamic Republic of Pakistan has requested the Government of Japan to provide technical assistance in carrying out a comprehensive transport development study titled “the Pakistan Transport Plan Study in the Islamic Republic of Pakistan” (hereinafter referred to as “the Study” or “PTPS”). In response to this request, the Government of Japan agreed to conduct the Study and has entrusted its execution to the Japan International Cooperation Agency (hereinafter referred to as “JICA”), the official agency responsible for implementing technical cooperation programs for the Government of Japan.
Northern Pakistan Earthquake, October 8, 2005
On October 8 in 2005, the M7.6 Earthquake hit the northern Pakistan and left the devastating damage on infrastructure in AJK and NWFP. The emergency repair works were required for the reconstruction of the area, and JICA decided to rearrange of the Study to investigate the urgent works of road sector in accordance with a request from the Government of Pakistan. In the beginning of the Study, AJK was excluded from the Study but a series of field surveys along Murry - Muzaffarabad Road and Jhelum Varry were carried out. The results of the field survey are described in Chapter 12 of this report.
1.1.2 Objectives of the Study
The major objectives of the Study are:
• To formulate a short term plan (2005/6~2009/10) and a master plan (2005/6~2024/25) for the development strategy of the national transport system of Pakistan covering all transport modes.
• To identify priority projects and carry out feasibility studies (F/S) for selected projects.
• To promote the transfer of knowledge and technology so that the counterparts in the transport sector of the Pakistan authorities are able to modify, revise and update the master plan after the Study is completed.
1.1.3 Study Area
• The study area is the entire territory of Pakistan.
Pakistan Transport Plan Study in the Islamic Republic of Pakistan (PTPS)
1-2
• International cargo traffic to and from neighbouring countries (i.e. Afghanistan, India and China) is included in the Study.
• The Study covers all transport modes, i.e. land transport (roads and railways), sea transport and civil aviation except inland water transport. As land transport is dominant in Pakistan, the Study paid special attention to this transport mode.
The Study Team concentrated on the land transport sector, especially the road sector. Judging from the density of the transport network, the transport capacity and the size of investments, the importance of the road sector is apparent. With respect to the railway, the Study Team considered the role of railway from the viewpoint of the national economy. The private sector takes the initiative in business activities for the marine transport/port sector and aviation/airport sector in the PTPS and consequently studies are confined to the consideration of the validity of existing projects based on demand forecasts.
1.1.4 Flow and Contents of the Study
The overall work flow is shown in Figure 1.1.1 and the contents of each phase of PTPS were:
(1) Preparatory Work
The Study Team collected and analyzed relevant information and materials, and established a basic policy for the Study. Based on this information, the Study Team prepared the Inception Report.
(2) First Stage Field Work
The Study Team submitted and explained the policy and the contents of the Inception report to the Pakistani counterpart. After the consensus of both sides, the Study Team prepared the Progress Report based on the information and results obtained through following activites: analysis of present condition; review of previous studies on transport in Pakistan; identification of problems; and field reconnaissance.
In addition, the Study Team commenced the following works for the formulation of the draft final report (Master Plan):
• Setting up socio-economic framework; • Traffic survey and analysis; • Forecast of traffic demand; • Listing of priority projects and analysis of present situation
(3) Second Stage Field Work
The Study Team submitted and explained the contents of the Progress Report to the Pakistani side, and a consensus was reached between both sides.
Based on the result of discussions on the Progress Report and the results of the First Stage, the Study Team formulated the Pakistan Transport Master Plan for the year 2025 as the draft final report.
(4) Third Stage Field Work
The Study Team held a seminar on the Study and explained the contents of the draft final report (Master Plan) to the Pakistani and Japanese sides.
Based on the comments on the draft final report, the Study Team finalized the Master Plan and submitted it to Pakistani side.

Pakistan Transport Plan Study in the Islamic Republic of Pakistan (PTPS)
1-3
Year/Month Study Item and Flow Reports/
Seminar-2005-
June PreparationWork
July
FirstStage
August FieldWork
September
October
SecondStage
November FieldWork
December
- 2006 -
January
ThirdStage
February FieldWork
March
Submission and discussion of Inception Report
Submission and Discussion of Progress Report
Formation of Pakistan Transport Master Planfor the year 2025
Submission of Final Report (Master Plan)
Selection of the Priority Development Projects.
Preparation of Inception Report
Analysis of present condition of the study areaand problem identification
Setting up socio-economic framework reflectingregional, international conditions surrounding Pakistan
(year 2010, 2025)
Preparation of implementation planby transport mode.
Traf
fic S
urve
y an
d an
alys
is
Preparation of Draft Final Report (Master Plan)
Preparation of Final Report (Master Plan)
Explanation of Draft Final Report (Master Plan)
Establishment of the basic policy of the Study
Collection of relevant data
IC/R
P/R
Seminar
F/R
Draft F/R
Draft P/R
S/C
S/C
S/C
S/C
Future traffic demand forecast
Establishment of Development Strategy
Figure 1.1.1 Overall Flow of the Study (Master Plan)

Pakistan Transport Plan Study in the Islamic Republic of Pakistan (PTPS)
1-4
1.2 Output of the Study 1.2.1 Reporting
The Study team completed and submitted the following reports in English. Name of report Submission date Inception Report End of June 2005 Progress Report End of September 2005 Draft Final Report End of January 2005 Final Report End of March 2006
In addition to the reports above, an annex volume was submitted, reporting the results of analysis on present conditions of transport demand and future demand forecast, in the form of database. Those results were transferred to the Pakistani side through joint-works, seminars and workshops, in order to make effective utilization possible after the PTPS.
1.2.2 Seminars
The Study Team held two seminars for NTRC and other stakeholders on the subjects of traffic study, demand forecast and the Master Plan as follows:
1st Seminar 2nd Seminar 3rd Seminar Date August 17, 2005 December 22, 2005 February 16, 2006 Venue NTRC Auditorium NTRC Auditorium Marriott Hotel Subjects - Traffic Survey Contents
- Methodology of Demand Forecast
- Database
- Traffic Survey Results - Transport Analysis - Demand Forecast - VOC and TTC
- Master Plan
Photo: 1st Seminar
Photo: 1st Seminar, NTRC Auditorium
Photo: 3rd Seminar, Marriott Hotel
Photo: 3rd Seminar, Marriott Hotel

Pakistan Transport Plan Study in the Islamic Republic of Pakistan (PTPS)
1-5
1.3 Organization and Participants of the Study 1.3.1 Organization of the Study
The organization is shown in Figure 1.3.1.
Study Executing Body
Ministry ofCommunication
Japan InternationalCooperatin Agency
National TransportReserch Centre JICA Study Team
Government ofPaksitan
Government ofJapan
SteeriingCommittee
JICA AdvidoryCommittee
Figure 1.3.1 Organization of the Study
1.3.2 Member of Counterpart
The Government of Pakistan nominated the National Transport Research Centre (NTRC) as the Pakistani counterpart for the Study.
The Study Team collaborated closely with the NTRC personnel and conducted many works and investigations with the assistance of relating Ministries, agencies and entities of Pakistan.
The members of the counterpart are as follows; Mr. Muhammad Kazim Idris Chief of NTRC
Comprehensive transport planning Mr. Bashir Ahmed Deputy Chief of NTRC
Roads, airports and aviation planning (1) Mr. Sajid Mansoor International trade and multi-modal transport (1)/
Transport statistics Mr. Muhammad Naeem Road planning / Transport design, evaluation and
Appraisal (1) Mr. Masoud Bakht Economic, financial planning / Traffic surveys and
analysis Mrs. Fouzia Sultana Demand forecast / Women mobility and gender issues Mr. Mumtaz Hussain Malik Highway safety and road transport planning Mr. Hameed Akhter Transport research and planning Mr. Tariq Aleem International trade and multi-modal transport (2) Mr. Khizer Javed Railway planning / Port / Shipping and IWT (1) Mr. Shahzad Ahmed Mirza Transport statistics (2) Mr. Tanseer Ahmed Khan Railway planning / Port/Shipping and IWT (2) Mr. Shahbaz Latif Mirza Environmental planning
1.3.3 Study Team
The members of the Study Team are as follows;
Mr. Minoru Shibuya Team Leader / Comprehensive transport planning Mr. Tetsuo Wakui Deputy team leader /Road planning (1) /Transport planning Mr. Koichi Tanuma Deputy team leader /Road planning (2) /Road facility planningMr. Hiroshi Hotta Social economic / Industrial development
Pakistan Transport Plan Study in the Islamic Republic of Pakistan (PTPS)
1-6
Mr. Haruhiko Imai Development strategy / Regional planning Mr. Osami Matsumoto Railway planning / Railway business strategy Mr. Saneyuki Nishi Railway facility planning Mr. Masayuki Fujiki Port planning Mr. Hiroshi Mizumasa Airport planning Mr. Khushal Khan Traffic survey / Traffic analysis Mr. Shogo Uchida Traffic demand analysis / Traffic demand forecast Mr. Daisuke Nagao Financial resource planning Dr. Katsuhiko Takahashi Management and organization / Privatization Mr. Mazhal Iqbal Cargo transport policy / Cargo facility planning Mr. Kazuharu Koishikawa Road design / Natural condition survey Dr. Ahmed Morgan Structural design / Natural condition survey Mr. Masahito Homma Economic / Financial analysis Mr. David Gordon Lees Social environmental specialist Mr. Hironori Kuroki Natural environmental specialist Mr. Takashi Shoyama Border traffic analysis Mr. Hisatoshi Naito Road restoration plan Mr. Takeshi Yoshida Bridge design Dr. Pucai Yang Disaster prevention Mr. Masaru Homma Construction plan and cost estimation Mr. Mineo Endo Preparation of tender documents Mr. Yoshitaka Motomura Coordinator
1.3.4 JICA Advisory Committee
JICA organized the Advisory Committee to provide advice and guidance. The members are given below;
Mr. Tetsuo Yai Chairperson Mr. Keiji Hashida Member
1.3.5 Steering Committee
The Pakistani side organized the Steering Committee to discuss the Study.
The members of the Steering Committee are given below; 1 Ministry of Communications 2 Planning Commission 3 National Highway Authority 4 Planning & Development Department, Govt. of Punjab 5 Planning & Development Department, Govt. of NWFP 6 Planning & Development, Govt. of Sindh 7 Planning & Development, Govt. of Balochistan 8 Ministry of Local Government & Rural Development 9 Ministry of Defense — Civil Aviation Authority 10 Ministry of Commerce 11 National Highways & Motorway Police, Islamabad 12 Ministry of Railways 13 Ministry of Petroleum & Natural Resources 14 Ministry of Environment 15 National Logistic Cell 16 Japanese International Cooperation Agency (JICA)

Pakistan Transport Plan Study in the Islamic Republic of Pakistan (PTPS)
1-7
1.4 Components and Structure of this Report This report consists of 12 chapters and seven appendices. Chapter 2 describes the present situation and identifies problems and issues by each sub-sector. Chapter 3 sets up the socio- economic framework such as population by region and economic growth rate. Chapter 4 estimates the future transport demand and analyzes the desirable modal share between road and rail. The result of the Traffic Survey underlies Chapter 4, and the survey itself is described in Annex A in detail. Based on Chapter 2 – 4, Chapter 5 establishes three transport policies and seven development strategies. Chapter 6 deeply analyzes and clarifies planning directions for the seven strategies. Sector plans are described in Chapter 7 – 10. Chapter 11 summaries projects proposed in the sector plans, and formulates cost allocation program for the Master Plan period and short-term program. Chapter 12 is an independent chapter that describes recommendation for road restoration in AJK and NWFP where the earthquake caused devastating damage in October 8, 2005.
Figure 1.4.1 Structure of this Report
1. Introduction
2. Present Transport Situation and Issues
Road Railway Port Airport
5. Overall Transport Policy
- Infrastructure - Transport - Administration - Financial Situation - Problem and Issues
6. Development Strategy
3. Socio-economic Framework
4. Transport Demand Projection
Annex-A. * Traffic Survey
7. Road Plan 8. Railway Plan 9. Port Plan 10. Airport Plan
11 Implementation Program
12. Road Restoration in AJK and NWFP
AppendicesA. Traffic Survey * B. Statistics of Railway Sector C. Review of Past Studies on Overloading Problem D. Calculation of Railway Capacity E. Environmental Criteria F. Environmental Assessment G. Calculation of Vehicle Operating Cost

Pakistan Transport Plan Study in the Islamic Republic of Pakistan (PTPS)
2-1
Chapter 2. PRESENT TRANSPORT SITUATION AND ISSUES
2.1 Overview of Transport Sector Pakistan has a population of approximately 160 million and is the sixth most populated country in the world. Real GDP is Rs. 6,548 billion (2004/05 est.), and per capita income was estimated at $736 in 2004/051, while per capita income in terms of PPP (Purchasing Power Parity) was estimated at $2,160 in 20042. Exports and imports in 2004/05 amounted to $13.7 billion and $16.7billion, respectively. With this economic scale, the total inland traffic by road and rail amounts to 246 billion passenger-km of passenger traffic and 119 billion ton-km of freight traffic (2004/05).
Road is the dominant mode of inland traffic and carries 91% of passenger traffic and 96% of freight traffic. The total length of roads is approximately 258,000 km, which includes 7,967 km of National Highways, 711km of Motorways, and 207km of Strategic Roads. The National Highway Authority (NHA) operates and maintains the National Highway network.
Photo: N-5 Photo: M-2
The Pakistan Railways (PR) has 11,515km of tracks and 7,791km of route network with 633 stations. Out of the total route-kilometres, 1,043km are double track. There is an electrified section between Lahore and Kanewal of 285km in length. PR operates passenger and freight services, and carried 5.46 billion ton-km of freight and 23.8 billion passenger-km in 2004/05.
Photo: Karachi Cant. Station Photo: North bound train carrying oil at Pano Akil Station
1 Pakistan Economic Survey 2004 2 World Development Indicators database, World Bank, 15 July 2005

Pakistan Transport Plan Study in the Islamic Republic of Pakistan (PTPS)
2-2
Around 95% of imports and exports are handled through Karachi Port and Port Qasim. Another deep-sea port is now under construction in Gwadar. Karachi Port handles about 30 million tons of cargo, while Port Qasim handles about 11 million tons. Approximately 60% of the imported cargo is transported inland from the two ports by road and rail to the upcountry.
There are 44 airports including five international airports located in Islamabad, Karachi, Lahore, Peshawar, and Gwadar. PIA (Pakistan International Airlines) is the national flag carrier, while Aero Asia, Shaheen Air International, Royal Airlines, and Airbule are private airlines in Pakistan. These Pakistani airlines carried 2.8 million domestic passengers in 2003/04.
The Indus, Chenab, Jhelum, Ravi, and Sutlej rivers flow through the territory of Pakistan, but inland water transport is very limited.
Table 2.1.1 shows the transport volumes by road and rail from 1990/91 to present.
Table 2.1.1 Past Trend of Railway and Road Transport Shares
Passenger Traffic Freight Traffic Fiscal Year Road
(MPK) Rail
(MPK) Total
(MPK)Road(%)
Rail (%)
Road(MTK)
Rail (MTK)
Total (MTK)
Road (%)
Rail (%)
1990/91 128,000 19,964 147,964 86.51 13.49 35,211 5,709 40,920 86.05 13.951991/92 131,352 18,158 149,510 87.85 12.15 41,536 5,962 47,498 87.45 12.551992/93 135,000 17,082 152,082 88.77 11.23 53,719 6,180 59,899 89.68 10.321993/94 137,037 16,385 153,422 89.32 10.68 71,596 5,938 77,534 92.34 7.661994/95 146,132 17,545 163,677 89.28 10.72 75,770 5,661 81,431 93.05 6.951995/96 154,566 18,905 173,471 89.10 10.90 79,900 5,077 84,977 94.03 5.971996/97 163,751 19,114 182,865 89.55 10.45 84,345 4,607 88,952 94.82 5.181997/98 173,857 18,774 192,631 90.25 9.75 89,527 4,447 93,974 95.27 4.731998/99 185,236 18,980 204,216 90.71 9.29 95,246 3,967 99,213 96.00 4.001999/00 196,692 18,495 215,187 91.41 8.59 101,261 3,753 105,014 96.43 3.572000/01 208,370 19,590 227,960 91.41 8.59 107,085 4,520 111,605 95.95 4.052001/02 209,381 20,783 230,164 90.97 9.03 108,818 4,573 113,391 95.97 4.032002/03 215,872 22,306 238,178 90.63 9.37 110,172 4,820 114,992 95.81 4.192003/04 222,779 23,045 245,824 90.63 9.37 114,244 4,796 119,040 95.97 4.03
(Jul.-Mar. figures for comparison between 2003/04 and 2004/05 ) 2003/04 166,761 16,692 183,453 90.90 9.10 85,025 3,348 88,373 96.21 3.792004/05 171,749 18,029 189,778 90.50 9.50 86,842 3,816 90,658 95.79 4.21
Source: Economic Survey, 2004

Pakistan Transport Plan Study in the Islamic Republic of Pakistan (PTPS)
2-3
2.2 Road 2.2.1 Road Network
(1) Roads in Pakistan
The Pakistan road network is approximately 258,000 km in length. Approximately 60% of the network is paved. The length of roads has increased by 50,355km since 1994/95 however the increase since 1999/2000 has only been 9,660km. The recent trend is that “high type roads” are increasing while “low type roads” are decreasing as shown in Figure 2.2.1. The figure implies that the strategy for road development has been shifted from expanding the road network to expanding the capacity of the existing network.
050
100150200250300
1990
1991
1992
1993
1994
1995
1996
1997
1998
1999
2000
2001
2002
2003
2004
'000
Km
Low Type Road High Type Road
Source: Economic Survey 2004-2005
Figure 2.2.1 Length of Roads in Pakistan
The road density in Pakistan is 0.32 km per square km, but the Medium Term Development Framework (MTDF) 2005-10 proposes to enhance this to 0.42 km per square km through construction of 80,000 km of roads in the years ahead. The road density in Punjab and Sindh is relatively high at 0.51 and 0.57 km/km2, while it is extremely low in Balochistan as shown in Table 2.2.1. On the other hand, road length per population is highest in Balochistan, while it is the lowest in Punjab.
Table 2.2.1 Road Length and Density
Pakistan Punjab Sindh NWFP BalochistanTotal Road Length (km) 258,214 106,140 79,834 30,049 42,191Percentage of Paved Road 63% 78% 69% 46% 13%Area (km2) 796,095 206,250 140,914 101,741 347,190Road Density (km/km2) 0.32 0.51 0.57 0.30 0.12Population (million) 148.72 85.33 32.99 23.26 7.14Road Length per Mil. People (km) 1,736 1,244 2,420 1,292 5,909Number of Registered Vehicles 4,974,000 2,920,984 1,457,323 430,429 165,264Road Length per 1,000 Vehicles 52 36 55 70 255Source :NTRC, prepared in 2003/04 based on the information of Provincial C&W Department, NHA, Provincial Excise & Taxation Department and Economic Survey 2003/04

Pakistan Transport Plan Study in the Islamic Republic of Pakistan (PTPS)
2-4
The administrative classification categorizes the roads according to the government agency responsible for the construction and maintenance of the road as summarized in Table 2.2.2.
Table 2.2.2 Administrative Classification of Roads Classification Administration Length Function National Highway Motorways Strategic Road
• National Highway Authority (NHA), Ministry of Communications
9,000km Representing the main transport corridors and providing inter-provincial linkages and connections to the neighbouring countries
Provincial Roads • Communication and Works Department (C&WD),
• Works and Services Department (WSD), and
• Frontier Highway Authority (FHA)
101,000km Providing access to the economic and population centres in the four provinces
District Roads • District government 94,000km Providing access to villages and remote areas
Municipal and cantonment roads
• Municipal government and army
54,000km Providing access to villages and remote areas
Source: JICA Study Team
Since the Study focuses on the inter-regional road network, the discussion hereinafter deals with National Highways, Motorways, Strategic Roads and Provincial Roads. The JICA Study Team reviewed the length of roads to identify “Provincial Roads” as shown in Table 2.2.3. The provincial “highways” with a total length of 21,000 km are regarded as “Provincial Roads” in the Study.
Table 2.2.3 Current Road Network Length in Four Provinces (Unit: km)
Federal Government Provincial Government
NHA C&WD FHA C&WD C&WD BDA
District Council Municipal Cantonment
Province NH MW ST H H S A A
Punjab 1,764 462 0 8,664 - 9,672 20,906 - 37,079 21,995 N/A Sindh 1,198 136 0 2,499 - 7,049 245 - N/A N/A N/A NWFP 1,527 0 0 398 1,999 6,127 4,272 - 13,867 885 N/A Balochistan 3,042 0 0 7,388 - 8,800 3,940 N/A 19,011 992 N/A Northern Area 583 0 207 N/A N/A N/A N/A N/A N/A N/A N/A
Subtotal 8,113 598 207 18,949 1,999 32,711 38,966 - 20,948 Total
8,918 92,634 93,832 51,921 1,999 Note:
1. Abbreviation NH : National Highway/ MW: Motorway/ ST: Strategic Road/ H: Highway/ S: Secondary road/ A: Access road NHA : National Highway Authority/ C&WD: Communication and Works Department/ FHA: Frontier Highway Authority/ BDA : Balochistan Development Authority 2. MTDF indicates 101,000 km as provincial inter-city roads. However the study team confirmed that the actual provincial inter-city roads were different distances than expected in four provinces. Hence, 101,000 km in the MTDF seems to include all provincial roads such as provincial secondary roads and intra-district ones. Source: Prepared by NTRC 2003-04 based on the information of C&W Department, NHA, Provincial Excise & Taxation Department and Economic Survey 2003/04. Deducted by NTRC and the Study Team when the current road network was provided because overlapping was admitted for submitted listed networks.

Pakistan Transport Plan Study in the Islamic Republic of Pakistan (PTPS)
2-5
(2) National Highways
There are 14 National Highways (8,600km), five Motorways (767km), and two Strategic Roads (207km) in Pakistan as listed in Table 2.2.4 and illustrated in Figure 2.2.2. N-5 is the longest and the most important National Highway. Due to its high importance, dualization of N-5 has almost been completed except for Karachi to Hyderabad, Peshawr to Torhan and other small portions. The other National Highways are 2-lane roads and only Kohat-Peshawar section of N-55 has a dual carriageway. N-55, named the Indus Highway, is the second longest National Highway. N-25 is an important international and national highway connecting Karachi with Quetta and Chaman on the Afghanistan border. Recently, N-25 has been significantly improved with the assistance of the ADB, WB and JICA.
Table 2.2.4 National Highways and Motorways
No. Route Length (km)National Highways (8,113 km) N-5 Karachi - Hydelabad - Multan - Lahore - RWP - Pashawar – Torkham 1,819N-10 (Makran Coastal Highway) Liari - Ormara - Pasni - Gwadar – Gabd 653N-15 Nansehra - Naran - Jalkhad - Chilas Road 240N-25 Karachi - Nela - Khuzdar - Kalat - Quetta – Chaman 813N-35*1 (KKH) Hassanabdal - Abbottabad - Thakot - Gilgit – Khunjrab 806N-40 Lakpss (near Quetta) - Dalbandin – Taftan 610N-45*2 Nowshera - Dir – Chitral 309N-50 D.I. Khan - Zhob - Kuchlad (near Quetta) 531N-55 (Indus Highway) Kotri - D.G. Khan - D.I. Khan - Kohat – Peshawar 1,264N-65 Sukkur - Sibi - Saryab (Quetta) 385N-70 Multan – D.G. Khan - Loralai - Qila Saifullah 447N-75 Islamabad - Satra Mile - Lower Topa – Kohala 90N-80*3 Turnol - Fatehjang – Kohat 146N-85 Hoshab – Panjgur – Nag – Basima – Surab 487Motorways (711 km) M-1 Islamabad - Peshawar Motorway 155(35)M-2 Lahore - Islamabad including 32 km links & Lahore Bypass 367M-3 Pindi Bhattian - Faisalabad Motorway 53M-9 Karachi - Hyderabad Motorway 136Strategic Roads (207 km) S-1 Gilgit - Skardu Road 167S-2 Kohala - Muzafarabad Road 40Total 9,518
Note : M-1 has the remaining portion of 120km at present. *1 : N35 is called as Karakoram Highway *2 : N45 was federalized in 1999. *3 : N80 was federalized in 2004. Source : NHA

Pakistan Transport Plan Study in the Islamic Republic of Pakistan (PTPS)
2-6
Source: JICA Study Team
Figure 2.2.2 National Highways and Motorways
M-1 (Islamabad – Murhan)
N-5 (Kabirwala – Multan)

Pakistan Transport Plan Study in the Islamic Republic of Pakistan (PTPS)
2-7
There are many topographical obstacles on the National Highways. For example, the Kohat Tunnel has only 2-lane despite the importance of N-55. N-70 has a very dangerous mountainous section between D.G.Khan and Fort Munro, where, on a winding section, rocks are sticking out over the narrow road, and the slopes are very steep. The Khushalgarh Bridge over the River Indus on N-80 is old and narrow. The bridge crosses its access roads at right angles, and container trucks can not pass over the bridge. The Lowari Rail Tunnel Project is underway to overcome topographical obstacles on N-45. The Malakand Tunnel (N-45) and the Lakpass Tunnel (N-25) are also planned to improve road transport. Many new bridges over the River Indus and other big rivers are proposed. There are lots of at-grade cross sections between the railway and the National Highways.
N-70 (D.G.Khan – Fort Munro) N-80 (Khushalgar Bridge over the River Indus) Tolls are collected at toll plazas on both the National Highways and the Motorways. Toll plazas were introduced by NHA in 1999.
Toll Gate (N-5) Toll Gate (N-5)

Pakistan Transport Plan Study in the Islamic Republic of Pakistan (PTPS)
2-8
(3) Motorways
NHA plans to develop a network of full access controlled Motorways as a new economic corridor to provide fast transportation of goods and passengers. The total length of the planned Motorway network is 2,734 km as shown in Figure 2.2.6.
Of the ten planned Motorways, M-2 (Islamabad - Lahore Motorway, 6-lane, 367 km), M-3 (Pindi Bhattian - Faisalabad Motorway, 4-lane, 53 km) and 35 km long Islamabad - Burhan section of M-1 (Islamabad - Peshawar Motorway, 4-lane) are already opened to the traffic. M-2 bears a horizontal radius in excess of 1,500m in hilly terrain, but has a applied maximum gradient of 7%.
M-9 (Karachi - Hyderabad Motorway, 136 km) is a 4-lane highway without access control at present. It will be expanded to a 6-lane access controlled Motorway in the future.
In August 2005, the government approved the construction of a motorway between Faisalabad and Karachi with four sections named M-4, M-5, M-6 and M-7 respectively.
Table 2.2.5 Present Status of Motorways
Name Section Length (km)
Number of Lanes
Status
M-1 Islamabad - Peshawar Motorway
153 6-lane Islamabad - Burhan Section, 35 km long, was opened to traffic in September 2004. The remaining section is under construction with scheduled opening in January 2007.
M-2 Lahore - Islamabad including 32 km links & Lahore Bypass
367 6-lane First Motorway of Pakistan, opened to traffic in 1997.
M-3 Pindi Bhattian - Faisalabad Motorway
53 4-lane Completed. Opened to traffic in 2004.
M-4 Faisalabad - Multan Motorway
243 4-lane Included in the Public/Private Sectors Programme of NHA 5-Year programme (2005-10).
M-5 Multan - D.G. Khan Motorway
84 4-lane
M-6 D.G.Khan - Kakkar Motorway
467 2-lane
M-7 Kakkar - Karachi Motorway
280 2-lane
M-8 Gwadar - Khuzdar - Ratodero Motorway
895 2-lane Gawadar - Turbat - Khuzdar and Shahdadkot Ratodero sections, 284 km in total length, are under construction, to be completed in 2006.
M-9 Karachi - Hyderabad Motorway (Super Highway)
136 6-lane At present 4-lane without access control. Expansion to access controlled 6-lane motorway is considered as a future BOT project.
M-10 Karachi Northern Bypass 56 2-lane A 24 km long section was opened to traffic in 2004. The remaining section will be completed in December 2005. Mostly undivided 2-lane. ROW is secured to upgrade to divide 4-lane.
Total 2,734 Source: NHA, JICA Study Team

Pakistan Transport Plan Study in the Islamic Republic of Pakistan (PTPS)
2-9
(4) Provincial Roads
Provincial roads are managed by different systems and structures enforced by the provincial governments. For instance, the government of Sindh has reinforced the road maintenance management system funded by the ADB in 2000/2001, using an adjusted HDM-4 programme with local conditions and ranked maintenance priorities to estimate the annual maintenance cost of its Road Maintenance Unit. The Communication & Works Department of the government of Balochistan is responsible for the construct and maintenance of six categorized roads, including provincial highways because the Road Management Unit (RMU) in the province was abolished in 2000. Therefore, the Balochistan Development Authority has suggested that the restoration of the defunct RMU is essential in order to develop road reference and classification, and to collect data on traffic volumes and road conditions, including roughness.
Improvement of provincial roads is in progress, mostly with the active support of the ADB. Generally, it is to widen and rehabilitate the existing roads to 7.3 m carriageway paved with asphalt concrete, with 3.0 m wide shoulders. The applied design speed is 100 km/hr for flat terrain, 80 km/hr for rolling terrain and 60 km/hr for hilly terrain.
(5) Road Condition and Maintenance
A number of highway projects have been executed without a corresponding increase in the maintenance funds, and consequently a huge backlog of maintenance work has resulted in the loss of highway assets. This situation has increased the needs for major rehabilitation or new construction. The pavement condition survey in 2000 (NHA) indicated that:
• 50% of the NHA’s existing network is in need of major rehabilitation of reconstruction. • The remaining 50% will be lost in the near future if adequate maintenance and
rehabilitation actions are not taken in a timely and effective manner.
According to the results of “the 2004-05 RAMD Study on pavement condition by NHA”, 47% of the national highway network is classified “Poor” to “Very Poor”. Deterioration of provincial roads is relatively severe compared to national highways.
With the assistance of the World Bank, the Road Asset Management Directorate was established in NHA in 2000, and the Road Asset Management System (RAMS) was created to streamline the annual maintenance business plan. RAMS includes the collection and analysis of data such as a road and bridge inventory, traffic data and pavement condition based on IRI and crack ratio, etc., prioritization of road sections for maintenance and preparation of the maintenance plan using HDM-IV.

Pakistan Transport Plan Study in the Islamic Republic of Pakistan (PTPS)
2-10
(6) Bypass
The major function of National Highways is to carry inter-provincial traffic or long distance traffic along important national corridors, connecting large cites where commercial and industrial activity is very high. National Highways cross the centre of those large cities, where local traffic mixes with long distance traffic, which disturbs traffic flow. Accordingly, National Highways have many congested cities as bottlenecks along their routes. Many bypasses have been constructed in major cities for National Highways to avoid congestion. Figure 2.2.3 shows the cities that have bypasses along N-5. In addition to the cities in the figure, there are some bypasses under construction and many proposed bypasses along N-5. According to NHA, the number of cities with National Highway bypasses amounts to 61.
Peshawar
Bhai Pheru
Iqbal Nagar
Sangi
Pattoki
Rawalpind GujratJhelum Gujranwala LahoreWazirabad
Rohri Bhiria Moro Sakrand Hyderabad Karachi
City having bypass
Mian Channu Kacha Khu Qadir Pur Sadiqabad Dharki Mirpur Mathelo Ghotki
Wah Radaram Renala Khurd Sahiwal Harappa Chichawatni Kasowal
LEGEND
13.8 km
7.2 km
1.9 km 10.5 km 8.7 km
5.3 km 16.0 km
8.9 km
6.8 km 1.4 km 5.2 km 13.5 km 3.8 km 6.8 km 6.2 km
9.2 km 15.5 km 16 km
Source: NHA, JICA Study Team
Figure 2.2.3 Bypasses along N-5
There is a dilemma about bypass construction. Cities in Pakistan have been growing along arterial roads, including bypass roads. Soon after opening a bypass for a city, the city begins to grow along the bypass, and the growth will continue until the bypass can no longer function as a bypass. This may be attributed to the lack of available funds for urban road development – local municipalities have to rely on national roads.
Instead of constructing a bypass, another solution to aid traffic congestion is to control access within urban areas. NHA intends to mount the carriageway and provide service road to segregate local traffic from National Highways.
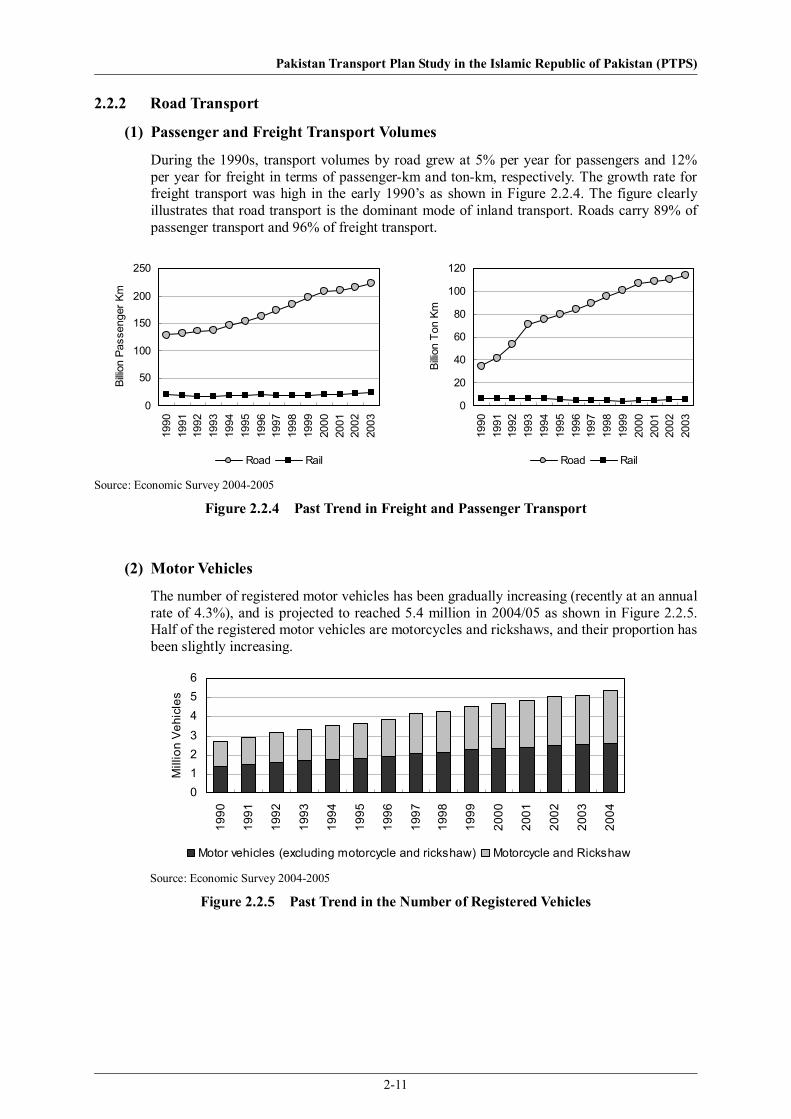
Pakistan Transport Plan Study in the Islamic Republic of Pakistan (PTPS)
2-11
2.2.2 Road Transport
(1) Passenger and Freight Transport Volumes
During the 1990s, transport volumes by road grew at 5% per year for passengers and 12% per year for freight in terms of passenger-km and ton-km, respectively. The growth rate for freight transport was high in the early 1990’s as shown in Figure 2.2.4. The figure clearly illustrates that road transport is the dominant mode of inland transport. Roads carry 89% of passenger transport and 96% of freight transport.
0
50
100
150
200
250
1990
1991
1992
1993
1994
1995
1996
1997
1998
1999
2000
2001
2002
2003
Billio
n Pa
ssen
ger K
m
Road Rail
0
20
40
60
80
100
120
1990
1991
1992
1993
1994
1995
1996
1997
1998
1999
2000
2001
2002
2003
Billio
n To
n Km
Road Rail
Source: Economic Survey 2004-2005
Figure 2.2.4 Past Trend in Freight and Passenger Transport
(2) Motor Vehicles
The number of registered motor vehicles has been gradually increasing (recently at an annual rate of 4.3%), and is projected to reached 5.4 million in 2004/05 as shown in Figure 2.2.5. Half of the registered motor vehicles are motorcycles and rickshaws, and their proportion has been slightly increasing.
0123456
1990
1991
1992
1993
1994
1995
1996
1997
1998
1999
2000
2001
2002
2003
2004
Mill
ion
Veh
icle
s
Motor vehicles (excluding motorcycle and rickshaw) Motorcycle and Rickshaw
Source: Economic Survey 2004-2005
Figure 2.2.5 Past Trend in the Number of Registered Vehicles

Pakistan Transport Plan Study in the Islamic Republic of Pakistan (PTPS)
2-12
The share of cars has increased from 21% in 1995/96 to 37%, while the percentage of trucks has decreased from 48% to 37% as shown in Figure 2.2.6.
NTRC Survey, 1995/96
Car
21.1%
12.4%
12.2%
5.1%
47.6%
1.6%
Minibus
Large BusPickup Truck
Truck
OthersPTPS Survey, 2005
Car
MinibusLarge Bus
Pickup Truck
AgricultureTractor
ArticulatedTruck
37.0%
15.0%9.1%
9.3%
15.2%
7.6%
4.9%1.9%
2-Axle Rigid Truck
3 or more AxleRigid Truck
Note: 1) Car includes Car/Jeep/Taxi/Pickup (passenger)/ 4WD. 2) “Wagon” is renamed as “Minibus” Source: NTRC, JICA Study Team
Figure 2.2.6 Vehicle Composition
Meanwhile, trucks still obstruct the smooth passage of cars on many National Highways, due to the slow speeds of trucks. Typical trucks run at speeds of only 40 – 50km/hr under free traffic flow situations.
(3) Traffic Volume by Road Section
The road section between Rawalpind and Lahore along N-5 has the heaviest traffic in Pakistan as far as inter-city transport is concerned. According to the PTPS Traffic Survey, the traffic volume between Lahore and Gujranwala was the highest at 22,760 vehicles a day, followed by the Gujranwala to Gujrat section at 19,900. As a whole, traffic volumes on N-5 rage from 7,000 to 20,000 vehicles, while other national highways have smaller traffic volumes ranging from 1,000 to 4,000, except for some sections as shown in Table 2.2.6. The table indicates the ratio of traffic volume in the PTPS Traffic Survey (2005) to that of the NTRC Survey (1995/96). The ratio of about 1.3-1.6 means that the annual growth rate was 2.7 – 4.8%, which is similar to the change in other transport indicators. Traffic volumes decrease at several sections because of the opening of bypasses and alternative routes. Traffic volumes on provincial roads were very small at the survey sites of the PTPS Traffic Survey.
Note that this analysis is for inter-city transport. Traffic volumes are much higher within large cities; and where bypasses are not provided, such cities are the bottlenecks of the national transport system.

Pakistan Transport Plan Study in the Islamic Republic of Pakistan (PTPS)
2-13
Table 2.2.6 Traffic Volume Data from the PTPS Traffic Survey
National Highway Code PTPS Traffic Inrease Composition (%) Road Section #site volume 2005/1995 Car Bus Truck
N-5 Peshawar-Rawalpindi 204 12,827 1.31 39.1 25.2 35.7 Rawalpindi-Lahore 256 17,287 1.56 47.7 14.9 37.4 Lahore-Multan 272 8,080 1.01 28.6 16.1 55.3 Multan-Sukkur 315 6,814 0.75 9.8 9.6 80.6 Sukkur-Hyderabad 345 7,332 N.A. 19.6 12.0 68.4 N-25 Hub-Khuzdar 486 1,733 1.17 16.1 21.2 62.7 Khuzdar-Quetta 436 3,813 1.32 21.3 26.3 52.4 N-35 Hassanabdal-Abbotabad 103 8,112 1.46 44.7 34.0 21.3 N-40 Lakpass-Noshki 437 916 1.66 18.7 27.0 54.4 N-50 D.I.Khan-Zhob 109 238 6.46 22.7 23.9 53.4 N-65 Jacobabad-Sibi 412 2,997 1.03 14.7 21.1 64.2 N-70 D.G.Khan-Loralai 411 1,392 1.31 11.7 17.8 70.4 N-55 Peshawar-D.G.Khan 197 7,452 1.36 33.4 31.7 34.9 D.G.Khan-Jacobabad 313 1,924 1.90 11.7 23.5 64.8 Jacobabad-Hyderabad 343 1,353 0.49 30.6 39.5 29.9 Source: PTPS Traffic Survey
The volume of traffic on motorways is relatively small except for the bypass sections in Lahore and Faisalabad as shown in Figure 2.2.7. The average traffic volume is less than 1,000 vehicles along most sections.
01,0002,0003,0004,0005,0006,0007,0008,0009,000
10,000
Islam
abad
-Chak
ri
Chakri
-Balk
asar
Balkasa
r-Kall
arkah
ar
Kallark
ahar-
Lilla
Lilla-B
hera
Bhera-
Salam C
howk
Salam C
howk-K
ot Mon
im
Koto M
onim
-Pind
i Pha
ttan
Pindi B
hatta
n-Sehik
hu Pura
Seikhu P
ura-La
hore
Pindi B
hattia
n-Sah
iwala
Sahiw
ala-Fais
alaba
d
vehi
cles
/day
Note: Traffic volume recorded at computerized toll gate only Source: NHA
Figure 2.2.7 Daily Traffic Volume of Motorway (July, 2004)

Pakistan Transport Plan Study in the Islamic Republic of Pakistan (PTPS)
2-14
(4) Freight Transport
According to PTPS Traffic Survey, the major commodities in terms of tons carried by trucks are: 1) ballast, gravel, stone; 2) cement; 3) fruit; 4) fertilizer; and 5) wheat as shown Figure 2.2.8. In ton-km, the transport volume of fruits was the highest among all commodities.
0 20 40 60 80 100
SandFlour/biscuit
Genaral merchandiseDiesel
Bricks/firebricksWheat
FertilizerFruit
CementBallast, gravel, stone
'000 Tons
In Order of Tons
0 5 10 15 20 25 30
FlourPotatoes and Onion
Paddy and RiceDiesel
General merchandiseBallast, gravel, stone
WheatFertilizerCement
Fruit
Million Ton-Kms
In Order of Ton-km Note: The volumes in ton-km were calculated by a distance matrix. Source: PTPS Traffic Survey
Figure 2.2.8 Top 10 Commodities Carried by Truck
Fruits are perishable goods and are desirable not to be carried for a long distance without temperature control. Figure 2.2.9 illustrates the transport distance of perishable goods such as vegetables, fruit, meat, eggs, fishes, milk, etc. As can be seen in the figure, not a few perishable goods are transported for a long distance. However, the number of refrigerated vehicles is small in Pakistan. As the temperature control transport system is not established in the domestic market, the country looses opportunities to export or import fresh foods.
0
2
4
6
8
10
12
14
<50
<100
<150
<200
<250
<300
<350
<400
<450
<500
<550
<600
<650
<700
<750
<800
<850
<900
<950
<1,0
00<1
,050
<1,1
00<1
,150
<1,2
00<1
,250
<1,3
00<1
,350
<1,4
00<1
,450
<1,5
00<1
,550
Transport Distance (km)
%
Average=423km
Figure 2.2.9 Transport Distance of Perishable Goods
Note: The commodity codes of “perishable goods” are 155, 165, 180, and 185 (Refer Annex-A). Source: PTPS Traffic Survey, JICA Study Team

Pakistan Transport Plan Study in the Islamic Republic of Pakistan (PTPS)
2-15
(5) Road Safety
Table 2.2.7 below summarizes the reported accidents obtained by the NTRC. The reported accident data for 2001 shows 4,527 fatal accidents and 6,060 non-fatal accidents resulting in 5,421 fatalities and 12,942 injuries.
Table 2.2.7 Accident Statistics
Year Fatal Non-Fatal Others Total Killed Injured Total 1996 4,383 5,369 2,938 12,690 5,301 11,697 16,998 1997 4,407 5,249 2,737 12,393 5,141 11,229 16,370 1998 3,620 4,317 418 8,355 4,196 9,817 14,013 1999 4,637 5,635 449 10,721 5,371 11,797 17,168 2000 4,629 6,114 409 11,152 5,627 13,479 19,106 2001 4,527 6,060 338 10,925 5,421 12,942 18,363
Source: Accident Statistics (1991-2001), NTRC
While the road safety study conducted by the NHA in 1998-99 estimated 7,000 fatalities, 140,000 injuries and 1,400,000 property damages based on sample surveys carried out in four provinces, a recent study by the ADB indicated that the road traffic accidents involve over 10,000 fatalities per year (over 30 per 10,000 vehicles) and 150,000 injuries. There are high levels compared with Southeast Asia, although better than those in India and Bangladesh.
Traffic accidents are also recorded by the Federal Bureau of Statistics and they maintain records going back over 20 years. Despite a doubling of vehicle numbers, the number of fatal accidents and the number of fatalities remains the same over a 20-year period. This implies that the traffic accident statistics are not reliable in Pakistan. Regardless of this, according to the statistics, about 5,000 people are killed annually on the roads compared with 3,500 in the UK, however the number of vehicles in the UK is six times more than in Pakistan.
0
5,000
10,000
15,000
20,000
25,000
1991-92
1992-93
1993-94
1994-95
1995-96
1996-97
1997-98
1998-99
1999-00
2000-01
2001-02
2001-02
2002-03
2003-04
2004-05
Year
Num
ber o
f C
asua
lties
Injured
Killed
Figure 2.2.10 Number of Casualties
Traffic accidents are reported in the newspapers based on police reports. These are shown below for the previous 5 years. The location of the various reported accidents is shown on the map. There was a total of 133 incidents reported between 23rd October 2000 and 6th

Pakistan Transport Plan Study in the Islamic Republic of Pakistan (PTPS)
2-16
August 2005. Some of these were single vehicles while others involved two or more vehicles.
Accidents 2000-05
0
10
20
30
40
50
60
bus
wag
on
coac
h
pick
up
truck
jeep ca
r
van
mot
orcy
cle
Num
ber o
f acc
iden
ts
Fatalities 2000-05
0
20
40
60
80100
120
140
160
bus
wag
on
coac
h
pick
up
truck
jeep ca
r
van
mot
orcy
cle
Vehicles
Fata
litie
s
Fatalities / Accident
0
2
4
6
8
10
12
14
bus
wag
on
coac
h
pick
up
truck
jeep ca
r
van
mot
orcy
cle
Vehicles
Aver
age
Fata
litie
s/Ac
cide
nt
Accidents Reported In Newspapers
0
20
40
60
80
100
120
2002 2003 2004 2005Years
Acc
iden
ts R
epor
ted
in P
ress
Source: JICA Study Team
Figure 2.2.11 Numbers of Accidents reported in Newspapers
The figure cannot be taken as absolute, as not all accidents are reported, however they do give an indication of the severity and incidence of accidents. Passenger buses are involved in far more accidents than other vehicles. The level of fatalities in heavier vehicles, such as buses, trucks and wagons tends to be the same, presumably as it is the passengers in the front part of the vehicle who are most at risk. There are far more passengers injured in bus accidents than in other vehicles. Most reported motorcycle accidents are fatalities, probably because injuries are not reported. The conclusion is that the passenger groups most at risk of death or injury are bus passengers. Certain individual accidents stand out in their severity. In 2005 a leased passenger bus carrying a school outing crashed on the M-2 near the salt range causing 19 fatalities and 35 injured. No other vehicle was involved. The incident was attributed to poor vehicle maintenance and driver incompetence. Also in 2005 a passenger bus ran into the rear of a stationary gasoline tanker, resulting in 31 deaths and 12 injured.

Pakistan Transport Plan Study in the Islamic Republic of Pakistan (PTPS)
2-17
(6) Overloading
Overloading by trucks is one of the most typical phenomena in the transport sector in Pakistan. It is commonly observed that 2-axle trucks, having a high vertical limit on the rear carry hundreds of heavy bags (40-100kg per bag) to the extents of the dimensional limit (not tonnage limit).
An Axle Load Study of the National Highways by the NTRC in 1995 has shown that 43% of rear axle loads exceed the 12 tonnes (the legal axle-load limit mandated by the Road Safety Act 2000). Two-axle trucks contribute the most to overloading, which is increasing at about 2.6% annually. Although the proportion of two-axle trucks in the fleet is declining, they still account for over 50% of truck traffic.
NHA calculated an average value of Equivalent Standard Axles (ESAs) for the various axle configurations of commercial vehicles in accordance with the AASHTO Pavement Design Guide 86, and these are compared with the axle load controlled trucks in the USA as shown in Table 2.2.8. This shows that in the case of a 2-axle truck, a Pakistan truck is equivalent to 22 USA trucks in terms of the effect on pavement structure. It is noted that the values shown below are for the average 2-axle truck. The maximum for 2-axle trucks was 13.09, 2.8 times the average.
Table 2.2.8 Average ESAs of Trucks Truck Type Axle Configuration Truck Factor
Pakistan Truck Factor
USA 2-Axle Both Single Axles 4.67 0.21 3-Axle One Single & One Tandem Axle 8.84 1.59 4-Axle All Single Axles 12.99 1.32 4-Axle Two Single & One Tandem Axle 10.35 1.32 5-Axle One Single & Two Tandem Axles 14.73 1.39 6-Axle One Single, One Tandem & One Tridem Axle 10.90 1.39
Source: Axle Load Study on National Highway, NTRC, 1995 and NHA
Overloaded Truck
The local truck manufacturers produce wider and more elevated truck bodies to enable truck owners to overload and reduce haulage costs. The tyres of overloaded trucks are also over-inflated resulting in a reduction in the contact areas between the tyre and the road surface. The excessive wheel loads combined with the reduced tyre contact area exert pressures far in excess of the bearing capacity of the pavement.

Pakistan Transport Plan Study in the Islamic Republic of Pakistan (PTPS)
2-18
Allowable Axle Loads
The National Highways Safety Ordinance 2000 stipulates maximum axle loads and tyre pressures: • Front axle – 5 tones • Single axle - 12 tones • Tandem axle – 22 tones • Tridem axle – 33 tones • Tyre pressure rear axle 120 psi • Tyre pressure – front axle 100 psi
These regulations were passed in 2000 but an agreement was reached between NHA and the transport industry to allow some concessions on National Highways but not on motorways. The current situation for the various configurations is shown below.
Truck Type Allowed on
National Highways
Concession Granted by NHA
in 2002
Allowed on Motor Ways
2 AX SINGLE (BEDFORD) 17.5 20 17.5 2 AX SINGLE (HINO / NISSAN) 17.5 23 17.5 3 AX TANDEM 27.5 32 27.5 3 AX SINGLE 29.5 32 29.5 4 AX SINGLE TANDEM 39.5 42 39.5 4 AX TANDEM SINGLE 39.5 42 39.5 4 AX SINGLE 41.5 44 41.5 5 AX SINGLE TRIDEM 48.5 51 48.5 5 AX TANDEM TANDEM 49.5 52 49.5 5 AX SINGLE SINGLE TANDEM 51.5 54 51.5 5 AX TANDEM SINGLE SINGLE 51.5 54 51.5 6 AX TANDEM TRIDEM 58.5 61 58.5 6 AX TANDEM SINGLE TANDEM 61.5 64 61.5
National Highway Safety Ordinance 2000 is being now amended after the steering committee held in Karachi in August 2005 to provide for the greater punishment of the originator of the overloading.
Weigh Stations
NHA has 54 weigh stations to enforce the axle load limit mentioned above. Currently, the fine for overloading is about Rs. 100 per ton but it occasionally a driver can not pay a fine of Rs. 1000 - 2000 when overloads exceed 10 – 20 tons and the weigh station operator will just overlook the fine. It is also reported that the fine may be set by negotiation between operators and drivers. It is observed that weigh stations do not have unloading space for overloads or parking space for overloaded trucks.
Weigh Station on the N-25

Pakistan Transport Plan Study in the Islamic Republic of Pakistan (PTPS)
2-19
2.2.3 Administration of Road Sector
(1) National Highway Authority (NHA)
NHA was established by the National Highway Act of 1991 as a semi-autonomous organization to plan, promote, organize and implement programmes for construction, development, operation, repair and maintenance of national highways and strategic roads especially entrusted by the Federal Government, or by Provincial Governments or other authorities.
NHA’s organizational set up comprises six core-wings: Motorway, Construction Planning, Operation, Finance and Administration. The organization chart of NHA is shown in Figure 2.2.12. NHA is administered by the NHA Executive Board. Members of the Executive Board are: Executive Officer/ Chairman of NHA (Chairman), Member (Finance), Member (Planning) and other the six other members are government official ex officio.
National Highway Executive Board
National Highway Council
Chairman
Member (Operations)
Member (Finance)
Member (Planning)
Dir. General (Administration)
Secretary (NHA)
General Manager (Internal Audit)
Director (Inspection) Monitoring)
Planning
Public Relations Officer
GM Construction
Member (Motorway)
Budget & Accounts
Finance
Operations & Maintenance
NHA Regional Offices
Design GM (NHIP) Procurement & Contract
General)Establishment Personnel
Director Legal
Source: NHA
Figure 2.2.12 Organization of NHA
The 2001 amendment removed the Boards power to approve projects more than Rs.50 million. For projects over Rs.100 million the NHA Executive Board is required to make recommendations to the Central Development Working Party (CDWP) and the Executive Committee of the National Economic Council (ECNEC).
(2) National Highway Council (NHC)
The National Highway Act also established the National Highway Council (NHC) as a decision-making group. The NHC comprises seven members and is responsible for appointing the Chief Executive/Chairman of the NHA who will also become a member of the NHC and act its secretary. The Minister of Communications is the President of the NHC and the remaining members are: the Secretary Finance Division, the Secretary Planning and Development, Secretary MOC, a professional in the field of highway construction and management, a professional in the field of finance and accounting and Chairman of NHA, three departmental secretaries, one highway professional and one finance/accounting professional. The NHC meets once a year. On the recommendation of the NHA Board, the

Pakistan Transport Plan Study in the Islamic Republic of Pakistan (PTPS)
2-20
Minister of Communication can approve any matter falling under the NHC’s jurisdiction. The NHC has the power to control, direct and regulate the NHA, to sets policies and guidelines to review projects and approve five-year plans and the annual budget.
(3) Communications and Works Departments
The organization of the provincial government is similar for the four provinces.
The Communications and Works Departments of the Provincial Government (PCWDs) are responsible for construction and maintenance of the provincial roads within their respective provinces. Routine maintenance works for improvement and reparation are executed by contractors through bidding procedures. PCWD is divided into Provincial Circles headed by a Superintendent Engineer and the circles are subdivided into Divisions headed by an Executive engineer. The Divisions are further subdivided into Subdivisions headed by a Subdivision Officer.
With the devolution programme, portions of local roads have been transferred from the PCWDs to the newly established district governments.
The Works and Services Department (WSD) is one of several departments under the Chief Secretary of the provincial government. Under the Secretary of WSD, there are two sections, one responsible for roads and the other responsible for water supply and buildings. The provincial highway department is responsible for the construction and maintenance of the Provincial Roads. In the NWFP Province, the department is named as the Frontier Highway Authority (FHA). The Managing Director of FHA coordinates with the District Coordination Officer of each district government for the construction of District Roads. After devolution, part of the Provincial Road network will be transferred to the City/District Governments, while the provincial highway departments will still be providing the employees and funds.
(4) Transport Authorities
The road transport services are regulated by the provincial governments through the Provincial Transport Departments. The Provincial Transport Authorities(PTAs) and Regional Transport Authorities(RTAs) plan, allocate routes, regulate, enforce and collect revenues and assert day-to-day control over inter- and intra- city passenger transport services, which are dominated by the private sector.
Road related public revenue collection is about Rs.32.5 billion per year (52% of these are from a surcharge on POL products). Total public expenditure on roads is over Rs.20 billion per year, with 65% on national roads. The road sector has been the main recipient of public sector funding and about 69% of the total PSDP allocation for the transport sector is earmarked for the road sector. However, road maintenance expenditure over the year has only been about 20% to 30% of the required expenditure.
(5) National Highway and Motorway Police (NH&MP)
The Motorway Police were established in 1997 as the traffic police for enforcement of traffic rule and traffic safety on the M-2. The GOP enacted in 2000 the National highway Safety Ordinance which provided the legal basis for establishing the National Highway and Motorway Police (NH & MP) Force under the MOC.
One of the important tasks of the NH&MP is to enforce axle load control. “The National Highway Safety Ordinance 2000” established the legal framework for overload control as follows:
• The National Highway and Motorway Police are empowered to enforce axle overload control.
• The driver of an overloaded vehicle is directed to convey the vehicle to the nearest place where facilities exist for the storage of goods, and not to remove the vehicle or trailer from that place until the laden weight or axle weight has been reduced.

Pakistan Transport Plan Study in the Islamic Republic of Pakistan (PTPS)
2-21
• Whoever drives a transport vehicle or causes or allows a transport vehicle to be driven on a National highway carrying in excess of 15 % of the permissible load for a goods vehicle shall be punished with imprisonment.
• A police officer shall direct the unloading of the excessive goods before allowing the vehicle to proceed.
It is noted that the NH&MP does not have retention powers and tends to avoid involvement in enforcement matters in which retention and/or legal proceedings are likely to be involved. The enforcement is therefore limited to implementation of a fine regime only and the quick disposal of violators.
2.2.4 Financial Situation
(1) Financial Resources for Roads
The agency for the road sector is the NHA, which is funded in the following manner.
Sources: Interview with NHA
Figure 2.2.13 Flow of Funds for the NHA
Until 1991, the national highway network was in the hands of the government department known as the National Highway Board. The Board work was funded by a grant from the Pakistan Government. In 1991, the Board became a semi-autonomous body, the National Highway Authority (NHA). The NHA collects tolls from the road users and borrows money or issues bonds after consultation with the Ministry of Communication (MOC). However, in 1991, the government decided for the development of roads should be switched from grants to loans, even though the NHA did not have the revenues to repay these loans.
The biggest components of the “Road Taxes” (refer Figure 2.2.13) are the surcharges on Petroleum, Oil and Lubricants (POL) from road users. Table 2.2.9 shows the trend in the surcharges on POL.
Table 2.2.9 Trends in Surcharges on POL from Road Users (Unit: Rs. Million)
1990/91 1991/92 1992/93 1993/94 1994/95 1995/96 9,670 9,138 8,007 12,956 9,576 12,361
1996/97 1997/98 1998/99 1999/2000 Total Average 15,861 17,661 26,128 32,101 153,458 15,346
Sources: Prepared by JICA Study Team with Data from World Bank
From the fiscal year 1990/01 to 1999/2000, the total amount of the surcharges on POL from road users was Rs. 153 billion and the annual road tax revenues amounts to Rs. 15 billion on average. On the other hand, the average annual funding to the NHA from 1990/91 to 1999/2000 amounted to Rs. 9.2 billion, which was 60% of the total road tax. The road taxes
Road Users Ministry of Finance
National Highway Authority (NHA)
Tolls etc.
Funds for Development Funds for
Development
Economic Affairs Division (EAD)
Donor Agencies
Road Taxes Funding from Donor Agencies
Consultation regarding Finance

Pakistan Transport Plan Study in the Islamic Republic of Pakistan (PTPS)
2-22
were absorbed in the government’s consolidated budget, and the most of the road tax revenues was used for other sectors. Table 2.2.10 shows the trend in funding to the NHA.
Table 2.2.10 Trends in Funding to the NHA (Unit: Rs. Million)
Type of Funding 1990/91 1991/92 1992/93 1993/94 1994/95 Loan 250 5,152 9,498 8,084 7,406Grants 287 384 426 447 468 for Maintenance 282 378 410 430 452 for Administration 6 6 16 17 16 for Others - - - - -Total 537 5,537 9,924 8,530 7,874Type of Funding 1995/96 1996/97 1997/98 1998/99 1999/2000Loan 6,100 7,183 9,952 17,325 16,364Grants 371 532 620 625 681 for Maintenance 356 521 600 605 660 for Administration 15 11 20 20 21 for Others - - - - -Total 6,471 7,715 10,572 17,950 17,045
Type of Funding Average 1990/2000 2000/01 2001/02 2002/03 2003/04
Loan 8,731 10,312 10,900 15,263 16,243Grants 484 504 783 833 860 for Maintenance 469 482 760 800 825 for Administration 15 22 23 30 32 for Others - - - 3 3Total 9,215 10,816 11,683 16,096 17,103Source: NHA
In order to prevent the road tax from being used for other sectors, segregating the road tax revenue from the general consolidated budget of the government by creating an independent account for road tax should be considered. This segregation would enable the road tax revenue to only be used in the development of the transport sector.
It may be controversial to only use all the road tax revenue for the development of the road sector because (1) the road taxes are sometimes levied for the reduction of traffic congestion and environmental protection and (2) the “Surcharges on POL” may be generated from the petroleum consumption in other sectors.
With regards to reason (1), the funds from road taxes may have to be allocated to the development of the railway network for the reduction of traffic congestion and environmental protection. Therefore, it is necessary for the government to clarify its policy of how to use the road tax revenue for the development of the entire transport sector. With regards to reason (2), the petroleum tax revenue can be separated into that received from the transport sector and the received from the non-transport sector. Therefore, only the revenue from the transport sector will be used for the development of the transport sector.
According to Table 2.2.10, the Pakistan government funds the NHA mainly with loans. However, as mentioned later, as the revenue collected from the tolls is not sufficient for the loan repayments and interest payments, the NHA has accumulated a massive debt, which amounts to Rs. 103 billion.

Pakistan Transport Plan Study in the Islamic Republic of Pakistan (PTPS)
2-23
(2) Financial Outlook of the NHA
The NHA has engaged in commercial activities since 2001 and is now preparing the commercial based financial statements. Based on the draft financial statements (un-audited), the JICA study team has prepared Table 2.2.11 showing the financial status of the NHA.
Table 2.2.11 Financial Status of NHA* (Unit: Million Rs.)
FY 1998/99 1999/00 2000/01 2001/02 2002/03 Data Sources
(1) Revenues Grants in Aid from Government 625 681 504 783 833 T Maintenance Grant 605 660 482 760 800 Establishment Grants 20 21 22 23 30 Other Grants 0 0 0 0 3 Grants from Foreign Donors 3 3 2 2 2
Data from NHA
Toll Income** 184 1,022 2,186 2,220 2,570
Others*** 121 355 241 369 591
Financial Statement
(Draft) Total 933 2,061 2,933 3,374 3,996 (2) Expenditures Maintenance & Restoration 621 756 1,051 2,355 1,406 Financial and Other Charges 28 1,522 367 240 712 Others 748 2,874 1,913 1,333 666
Financial Statement
(Draft)
Total 1,397 5,153 3,332 3,929 2,785 (3) Surplus before Depreciation (1)-(2) -464 -3,092 -398 -555 1,211
(4) Depreciation Charges 771 1,305 1,342 1,207 972 Financial Statement
(Draft) Surplus (3)-(4) -1,235 -4,397 -1,740 -1,761 239 * Since the accounting data of the NHA is premature, the table only shows the trend in the financial status and
does NOT show exact figures. ** Costs of operational & mobile workshops are deducted from the gross toll incomes. *** Recovery of disposal of assets is included. Source: Prepared by JICA Study Team with NHA Financial Statement (Draft) and Other Documents from the
NHA
As the financial statements of the NHA are currently under preparation, Table 2.2.12 was prepared from various data sources.
According to Table 2.2.12, the NHA continued to run at a loss until the fiscal year 2001/02. Even though the surplus shows a positive figure in the fiscal year 2002/03, this is due to the financial support received from the government. Accordingly, since the NHA does not have enough financial resources for the loan repayments and interest payments, the NHA owed the following loans amounting to Rs. 103 billion at the end of the fiscal year 2002/03.

Pakistan Transport Plan Study in the Islamic Republic of Pakistan (PTPS)
2-24
Table 2.2.12 Loans at the End of FY 2002/03
(Unit: Million Rs.)Lenders Details Amounts
Government of Pakistan Cash Development Loans from the Government 68,082 IBRD 6,274 OECF 13,688 International Development Association 78 Asian Development Bank 232
Foreign Re-lent Loans
Islamic Development Bank 324 Turk Exim Bank (for work on the M1) 934 Foreign Direct Loans Dawwoo (for work on the M2) 13,447
Total 103,061 Source: NHA Financial Statement (Draft)
(3) Fund and Expenditure for Development
For the construction and improvement of national highways, NHA has received funding from the Government through the Public Sector Development Program (PSDP). However, it is sunderstood that the allocations made available to the NHA always fell short of demand, as illustrated in Figure 2.2.14.
0
10
20
30
40
50
1991
/92
1992
/93
1993
/94
1994
/95
1995
/96
1996
/97
1997
/98
1998
/99
1999
/00
2000
/01
2001
/02
2002
/03
2003
/04
2004
/05
Rs.
Bill
ion
Demand Allocation
Source: NHA
Figure 2.2.14 Demand and Allocation of PSDP
(4) Road Maintenance Account (RMA)
Toll revenue is the major fund for maintenance of the national highway network. In addition, the Federal Government provides an annual Maintenance Grant to the NHA. The Maintenance Grant amounted to Rs. 825 Million in 2003/04.
In 2003/04, the total fund raised for maintenance was Rs. 3,774 million, 78% of which was the revenue generated, the remainder being the maintenance grant from the Federal Government, as shown in Table 2.2.13. However, the total fund for maintenance was insufficient to meet the increasing expenditure.

Pakistan Transport Plan Study in the Islamic Republic of Pakistan (PTPS)
2-25
Table 2.2.13 Maintenance Fund and Expenditure
Fund (Rs. in Million)Source 2001/02 2002/03 2003/04 2004/05 Total Maintenance Grant 760.00 800.00 825.00 828.93 3,213.93 Net Revenue Generated 2,023.79 2,432.49 2,948.85 3,704.26 11,109.39 Total Fund 2,783.79 3,232.49 3,773.85 4,533.19 14,323.32 Expenditure (Rs. in Million)Province 2001/02 2002/03 2003/04 2004/05 Total Punjab 1,660.30 190.75 3,932.00 N.A. 5,783.05 Sindh 547.85 319.64 821.19 N.A. 1,688.68 NWFP 133.90 118.87 1,244.00 N.A. 1,496.77 Balochistan 311.11 510.10 1,036.00 N.A. 1,857.21 Total Expenditure 2,653.16 1,139.36 7,033.19 N.A. 10,825.71
Source: NHA RAMD(Road Asset Management Directorate)
In the financial plan for maintenance in 2005/06 (refer to Table 2.2.14), the required fund is estimated at Rs. 8.9 billion. The estimated fundraising can cover only 66% of the requirement even though there will be an increase in toll revenue due to an increase in the toll rates. The financing for the gap is to be secured from another account, which will be carried over to the next year as a liability.
Table 2.2.14 NHA Financial Plan for Maintenance in 2005-06 (Rs. in Million)
Total Fund Required (based on HDM-IV Analysis) 8,900 Estimated Financial Resources
Maintenance Grant 1,200 Revenue to be Generated 4,640
Net Toll Revenue 2,960 Net Revenue from Police Fine (NHA Share) 200 Net Revenue from Weigh Station (NHA Share) 100 Revenue from Regularization of Filling/CNG Stations 150 BOT Concessions for Bus Bays on GT Road 30 Reduction in percentage of Management Contractor like FWO, NLC, etc. 200 Expected Revenue from Increase in Toll Rates to Approved Limit (to be implemented from July 1, 2005) 1,000
Total 5,840 Source: NHA
Pakistan Transport Plan Study in the Islamic Republic of Pakistan (PTPS)
2-26
Road Maintenance Accounts
The Road Maintenance Account (RMA) is an NHA fund for road maintenance, established in 2003 based on “National Highway Authority Roads Maintenance Account Rules, 2003”. According to the rules, the revenue of the NHA and the maintenance grants from the government shall be accumulated in the RMA and the funds in the RMA shall be used for maintenance of the roads. The mission of the RMA is to promote efficient road network maintenance, to a standard that road users want and are willing to pay for, by collecting the road tariff and allocating funds to road administrators for sound planning and execution of the works. The RMA can ensure that road users’ funds are efficiently and effectively spent by the road administrators undertaking the implementation. The revenues that should be transferred into the RMA are: From Road Users • Tolls on roads and bridges; • road use related fines (e.g., overloading, traffic offence); • axle load charges; • supplementary heavy vehicle fees; • international transit fees; and • border fees. From Other Sources • Charges for commercial use of right of way; • profits on bank deposits and income on investment of moneys in the RMA; • annual maintenance grant from the Federal Government; • maintenance funds provided by international donor agencies; • loans secured to finance any maintenance work shortfall; and • endowments and donations for maintenance and road safety from any organization, group
or person. The activities eligible expenditure from the Road Maintenance Account are: • Maintenance plan (routine and periodic maintenance); • Rehabilitation of existing network assets of the National Highway Authority which have
acceptable net present value and economic rates of return; • geometric improvements of the existing network assets of the National Highway Authority; • highway safety improvements; • establishment of new toll plazas with automated electronic toll and traffic management
systems, access control, and weigh stations; and • expenditure related to corridor management.

Pakistan Transport Plan Study in the Islamic Republic of Pakistan (PTPS)
2-27
(5) Financing of Provincial Roads
The financial system for the development and maintenance of the Provincial Roads is similar to that of the National Highways. For development works, the provincial highway departments receive an allocation as the PSDP of the provincial governments. For maintenance works, a maintenance grant is provided by the provincial governments. The provincial governments intend to introduce a revenue generation system including toll collection similar to the NHA, to secure a fund for road maintenance. The status of revenue appears to be different for the four provinces. Internal revenue generation for maintenance is minor in the Punjab Province, while, the FHA of the NWFP Province has substantial revenue generation, as shown in Table 2.2.15. In 2004-05, the FHA generated Rs. 58.822 million, which is more than the grant provided by the provincial government. Of the total revenue, toll revenue provided 33%, with the other revenue coming from the contractor’s registration fee, the sale of application forms, rental charges for Right of Way, and income from machinery rental charges.
Table 2.2.15 Financing for Development and Maintenance of Provincial Roads in the NWFP Province
For Development (Rs. in million) Year Allocation Expenditure
2001-02 13.460 13.460 2002-03 856.921 856.921 2003-04 495.807 495.807 2004-05 685.492 685.492
For Maintenance (Rs. in million)
Year Maintenance Grant FHA Own Receipt (Toll Revenue) Total
2001-02 20.000 17.372 (13.443) 37.372 2002-03 20.000 69.921 (45.225) 89.921 2003-04 40.000 72.951 (48.749) 112.951 2004-05 50.000 58.822 (19.270) 108.822
Source: NWFP Provincial Government

Pakistan Transport Plan Study in the Islamic Republic of Pakistan (PTPS)
2-28
2.2.5 Issues and Problems
(1) Incomplete Hierarchy of Road Network
Motorways are tolled national highways with controlled access and highspeed free flowing traffic lanes1. Although the access control policy and the designed speed are different between Motorways and National Highways, the functional difference is not so clear at present because of the role of National Highways. It is expected that Motorways carry inter- provincial traffic between major cites at high-speed. On the other hand, National Highways carry a large volume of long-distance traffic because inter-provincial connection is the major role of National Highways. M-2 is a Motorway connecting Rawalpindi and Lahore at a distance of 367km, but traffic demand for M-2 is small and most drivers between the two cities prefer N-5 that connects the two cities at a shorter distance of 275km. The recent dualization and improvement are levelling up National Highway close to Motorway in terms of road network hierarchy. Meanwhile, development of feeder road network systems that connect National Highways is so insufficient due to lack of adequate investment that the hierarchy system has a gap between National Highway Network and the lower network systems.
(2) Insufficient Investment on Provincial Roads and Other Local Roads
National Highways form inter-provincial network together with Motorways, and the network connects four provinces along major national transport corridors. However, the National Highway network does not necessarily serve all the territory of Pakistan, because the area of provinces are very large in Pakistan, and the large area in each province, especially in Panjab, are covered by provincial road networks. Provincial roads are the primary feeder roads for National Highway network and the lower system in terms of road hierarchy. Accordingly, priority of investment on provincial roads is lower than that on National Highways. Provincial roads suffer from increasing traffic than National Roads, because of insufficient investment on capacity expansion and lack of maintenance works.
(3) Congestion in Urban Area
The National Highway Network has many congested sections in cities and towns along the roads, which reduce travel speeds and increase traffic accidents. As a cities and towns grow along arterial roads, a new bypass become an urban road soon after it is opened to the public. Therefore, construction of bypasses tends to be only a short-term countermeasure for congestion. The lack of local funds for urban roads and the absence of road network plans in local municipalities may contribute to this effect. Access control along National Highways is one of the solutions but it tends to divide local communities.
Photo: Pedestrians try to cross N-5.
1 Performance Report, NHA

Pakistan Transport Plan Study in the Islamic Republic of Pakistan (PTPS)
2-29
(4) Mix of Traffic (Freight and Passenger) on the National Highway
The mix traffic of freight and passenger traffic is another problems, Naturally, trucks need to use National Highways because one of the basic roles of National Highways is to serve as inter-provincial and long-distance routes for freight transportation. However, it is observed that passenger cars cannot travel at the desired speeds even if the volume if the traffic is low due to the presence of slow trucks.
Photos: Cars can not overtake trucks (N-5)
(5) Overloading
This is the aforementioned problem in the transport sector in Pakistan. Vehicle overloading is a major cause of premature pavement deterioration and an impediment to the sustainable development of the highway network. Overloading reduces the economic benefits of road projects and increases maintenance costs.
The main adverse effects of overloading are:
• Excessive axle loads and high tyre pressures lead to premature and rapid deterioration of existing and new roads in the form of cracking, rutting and potholes;
• Premature damage accelerates and increases the road maintenance budget; • Public transport, such as overloaded buses may not be a source of damage to roads, but,
together with overloaded commercial vehicles, they are the major safety road hazard and are involved in most accidents;
• Transport time is lost by trucks being off road for repairs due to overloading. Revenue is lost to the owner from down time and repair costs are borne by them;
• Marginalization of profitability of the trucking industry due to the overloading fines.
(6) Increase in Road Maintenance Work
The maintenance burden of the NHA has continued to increase because:
• A number of highway projects have been carried out without a corresponding increase in the maintenance budget;
• Several new routes have been federalized. NHA inherited the road network in a dilapidated condition from the provincial governments;
• Many sections of national highways have been dualized, which has virtually increased the length of the national highway network;
• Uncontrolled overloading, causing early damage on pavements; • Increase in traffic volumes.
The NHA receives a maintenance grant from the Federal government, while the provincial highway department receives a maintenance grant from the provincial government. They are supplemented by their own revenue, including toll revenue. However, the secured fund is not sufficient to ensure a stable and secure source of maintenance funding. From an interview with the NHA, it was estimated that the revenues (without grants from the government)

Pakistan Transport Plan Study in the Islamic Republic of Pakistan (PTPS)
2-30
would be able to surpass the maintenance costs in the future.
(7) Road Safety Problem
It is estimated that approximately 7,000 to 10,000 people die every year as a result of road accidents. The number of fatalities might be even higher because of an unsatisfactory system of reporting and follow-up.
Although intensive studies for road safety in Pakistan have been carried out, reliable statistics about traffic accidents is not available. It can be said that there are lots of traffic accidents that are not reported in Pakistan.
(8) Summary of Issues
The issues, which can be immediately identified from the problems mentioned above, are summarized as follows:
• To eliminate the bottlenecks in traffic flow along National Highways; • To develop the urban road network to avoid unexpected urban growth along bypasses so
that National Highways can function in their original role; • To replace old truck fleets with new ones that can travel faster; • To divert truck routes from National Highways to Motorways; • To reduce the number of overloaded trucks; • To improve or rehabilitate deteriorated roads to reduce maintenance cost; • To check the under-reporting of accidents and ensure a rational and scientific approach is
adopted to investigate accidents and take corrective actions accordingly.
Other issues are identified through more detailed analysis such as demand-supply analysis, administrative and institutional analysis and financial analysis as explained in the followings Chapters.

Pakistan Transport Plan Study in the Islamic Republic of Pakistan (PTPS)
2-31
2.3 Railway 2.3.1 Infrastructure
(1) Railway Network
The first railway of Pakistan, between Karachi City and Kotri, was opened in 1861. At the time of independence, most of the existing network had been constructed.
The Pakistan Railways network is comprised of 7,791 route-kilometres; 7,346 km of broad gauge and 445 km of metre gauge. There are 625 stations in the network, 1,043 km of double-track sections (in total) and 285 km of electrified sections.
The Main Line (official route name) is connects the following major stations; Karachi, Multan, Lahore, Rawalpindi and Peshawar. The term “the main corridor” used in this study means the lines including the Main Line and its bypass lines.
The existing Pakistan Railways network is shown in Figure 2.3.1.
LodhranSamasata
Multan
Khanpur
Kot AdduShorkot Cant
D.G.Khan
Faisalabad
Rawalpindi
Peshawar
HyderabadKotri
Karachi
Lala Musa
Lahore
BahawalnagarKhanewalQuetta
Chaman
Sibi
Jacobabad
Rohri
Khokhropar
Kuh-i Taftan
Badin
Kolpur
Attock City
Legend
Main Line
Other Lines
Source: JICA Study Team
Figure 2.3.1 Pakistan Railway Network

Pakistan Transport Plan Study in the Islamic Republic of Pakistan (PTPS)
2-32
(2) Railway Tracks
The railway network in Pakistan is comprised of 7,791 route-kilometres; 7,346 km of broad gauge and 445 km of metre gauge (See Table 2.3.1).
Out of the 7,791 km railway network, double track sections account for 1,043 km in total, and electrified sections for 285 km.
The Pakistan Railways have not constructed any new routes since 1982, and have instead abolished light-traffic branch lines since the 1980’s.
Table 2.3.1 Route and Track Length by Gauge
Route Kilometers Track Kilometers
Year Broad Gauge
Meter Gauge
Total Broad Gauge
Meter Gauge
Total
1990-1995 average 7,718.37 445.50 8,163.77 11,345.52 555.10 11,900.621996-2000 average 7,346.22 477.00 7,823.22 10,971.00 555.10 11,526.102004/05 7,346.00 445.00 7,791.00 10,960.00 555.00 11,515.00
Source: Pakistan Railways Year Book 2004/05
The network is ranked into six classifications of lines based on their role and level of importance, as shown in Table 2.3.2.
Table 2.3.2 Classification of the Lines in 2004/05
Classification Route-kilometres Remarks Primary A 2,124 km Primary B 2,622 km Secondary 1,185 km Tertiary 1,416 km Metre Gauge 439 km Narrow Gauge --- At present abolished
Source : Pakistan Railways
The Main Line of Karachi – Lahore – Rawalpindi – Peshawar (1,685km) and its bypass lines through Faisalabad mostly corresponds to Primary A. Of the 439 km of metre gauge lines, 126 km is being converted into broad gauge to connect to the line in India which has already been converted into broad gauge. No narrow gauge lines are currently in service, but tracks for these lines remain.
In the Karachi - Peshawar section and the bypass lines through Faisalabad and some other sections, the allowable maximum axle load is 22.86 ton, which is the standard for the largest 3,000 HP locomotives and new high performance freight wagons with full loading. The allowable axle load for other lines is 17.27 ton or less.
The gradient of each line is not steep except for a few sections. Along the main corridor, the maximum gradient is less than 6.7/1000 except for the 10/1000 gradient between Rawalpindi and Peshawar, which is suitable for massive freight transport. There is an exceptionally steep gradient of 40/1000 between Sibi and Chaman.
In the section of Karachi – Lala Musa and the bypass lines through Faisalabad, the maximum permissible speed is actually 95 to 105 km/hr. In other lines, it is lower: generally from 50 to 75 km/hr.
Track strengthening and rehabilitation works are underway based on the plan for “Rehabilitation and Improvement of Tracks (2001-2006)”. The works are currently half finished. The progress of the track strengthening and rehabilitation work is shown in Table 2.3.3.

Pakistan Transport Plan Study in the Islamic Republic of Pakistan (PTPS)
2-33
Table 2.3.3 Progress of Track Strengthening and Rehabilitation Work
Rail Sleepers Ballast thicknessSection
Track km
Improved Not Improved Improved Not
Improved Improved Not Improved
Primary - A 3,031 km 2,634(87%)
397(13%)
2,625(87%)
406 (13%)
657 (22%)
2,374(78%)
Primary - B 2,674 km 1,365(51%)
1,309(49%)
758(28%)
1,916 (72%)
79 (3%)
2,595(97%)
Secondary 1,185 km 690(58%)
495(42%)
87(7%)
1,098 (93%)
12 (1%)
1,173(99%)
Tertiary 1,500 km 1,239(83%)
261(17%)
783(52%)
717 (48%)
106 (7%)
1,394(93%)
Karachi-Lahore 2,264 km 2,191(97%)
73(3%)
2,196(97%)
68 (3%)
522 (23%)
1,742(77%)
Source: Pakistan Railways
The purpose of track strengthening and rehabilitation work is to enhance operational speeds and minimize maintenance costs. The structural standard for track strengthening of Primary-A and Primary-B sections is shown below (Table 2.3.4).
Table 2.3.4 Structural Standard
Classifications Primary-A Primary-B Rail UIC54/100RE 100RE/90R Sleepers 1,640 sleepers/km 1,562 sleepers/km Ballast thickness 30cm 25cm Speed 120km/hr 100km/hr
Source: Pakistan Railways
(3) Signalling System
The existing interlocking systems on the Pakistan Railways are classified into four types: one relay interlocking system and three mechanical interlocking systems. The existing interlocking systems are listed in Table 2.3.5.
Table 2.3.5 Existing Interlocking Systems
Type Speed Locking Stations Year of Installation Mechanical Signalling Non-interlocked 15 km/hr 165 1947 Standard-I 50 km/hr Indirect (key)Locking 215 1947-1995 Standard-II 70 km/hr Indirect (key)Locking 19 1947 Standard-III 120 km/hr Indirect (key)Locking 210 1947-1999 Electrical Signalling All Relay Interlocking 39 1962-1969
Source : Pakistan Railways
The existing block systems are broadly classified into the following:
• Absolute block system (seven types) • Automatic block system • Automatic block system with CTC (Centralized Traffic Control)
Classified block systems are listed in Table 2.3.6.

Pakistan Transport Plan Study in the Islamic Republic of Pakistan (PTPS)
2-34
Table 2.3.6 Existing Block System
System Stations Year of Installation Morse Telegraphy (Paper Line Clear) 262 1947 Neal’s Token Insts (Single Line) 126 1947 Siemen’s Tokenless (Single Line) 128 1965/93 Style U Tokenless (Single Line) 39 1969 Style N Tokenless (Single Line) 2 1960 Tyre’s Block Insts (Double Line) 65 1954 Carson Block Insts (Double Line) 5 1960 Automatic Block 16 154km 1970/97 Automatic Block with CTC 9 34km 1962/84
Source : Pakistan Railways
The automatic block system is only installed in a limited section of the 188km between Karachi and Hyderabad. Most of the signals, other than the automatic block system, are semaphores.
(4) Telecommunication System
At present, the Pakistan Railways are equipped with a telecommunication systems at present. The train radio system on the main corridor is operational, but the technology is obsolete, as is that of the signalling system.
(5) Double Tracks
Double track sections are only 1,043 km out of a total out of 7,791 route-kilometres. Most of the double track sections are located in the most critical section (Karachi City - Lahore, 1,218 km). The double-tracking works between Lodhran and Khanewal via Multan are under construction, and due for completion in 2005/06.
Photo: Double tracking work between Multan and Khanewal
Photo: Single track section remained between Karachi and land for double track between Khanewal and Raiwind
(6) Structure
Most of tracks along the Pakistan Railways are laid on embankment. There are a total of 14,570 bridges of which 22 bridges are recognized as large scale bridges. Almost all of these bridges were constructed more than 100 years ago. They require rehabilitation or replacement work.
(7) Electrification
The electrified section is limited to between Kanewal and Lahore (285 km) and some branches. These were electrified 35 years ago, and no extensions have been carried out since that time. Presently, the electrification facilities are aging and require rehabilitation.

Pakistan Transport Plan Study in the Islamic Republic of Pakistan (PTPS)
2-35
2.3.2 Rolling Stock
(1) Locomotives
The Pakistan Railways has 520 diesel locomotives, 23 electric locomotives and 14 steam locomotives including those for metre gauge. The steam locomotives are mostly out of daily services. The locomotives are mainly of 3000 HP class. The number of locomotives classified by performance is; 115 of 3,000 HP, 276 of 2,000 HP (including 2,400 HP).
Most of the locomotives are aging and decrepit, and some of them are out of services. Table 2.3.7 shows the number of over-aged locomotives over 20 years old. The reliable locomotives under 20 years old or ones recently rehabilitated are listed in Table 2.3.9.
Table 2.3.7 Number of Over-aged Locomotives over 20 years old
CLASS Performance Year Built
Numberon Books
Number to be Condemned Remark
GMU-30 3,000 HP 1975 36 36 Locos have been planned for rehabilitation
ARU-20 1076 20 1 ARPW-20 1982 27 18 GEU-20 1971 9 13 HAU-20R 1982 27 HPU-20 1982 4 4 ALU-20R
2,000 HP
1985 3
32 Locos have been planned fir recommissioning
GEU-15 1970 16 9 GMCU-15 1975 29 GMU-15
1,500 HP 1975 31
23 Locos have been planned for recommissioning
ALU-12 1,200 HP 1962 32 17 HAU-10 1,000 HP 1980 4 ALU-95 950 HP 1958 18 9 Total 256 71
Source : Pakistan Railways
Table 2.3.8 Locomotives under 20 years old or Recently Rehabilitated
Name Performance Number on Book Remarks HGMU-30 3,000 HP 28 HBU-20 2,000 HP 60 PHA-20 2,000 HP 23 AGE-30 3,000 HP 30 GRU-30 3,000 HP 48 Rehabilitated recently RGE-20 2,000 HP 27 Rehabilitated recently RGE-24 2,400 HP 21 Rehabilitated recently DPU-30 3,000 HP 17 DPU-20 2,000 HP 7
Total 261 Source : Pakistan Railways
Electric locomotives were introduced 35 years ago when the electrification works were completed, however they are already aging. The number of electric locomotives has not increased since their introduction in 1970 because there has been no extension of the electrified section of the railway. Due to the lack of sound electric locomotives, most trains are hauled by diesel locomotives even in the electrified section today.

Pakistan Transport Plan Study in the Islamic Republic of Pakistan (PTPS)
2-36
Photo: DHL running under wire new and powerful GM-made 3,000 HP-DHL, purchased with Japanese ODA between Lahore and Khanewal
Photo: Lahore DEL Depot GM-made 3,000 HP-DHL
(2) Passenger Coaches
The total number of passenger coaches on the Pakistan Railways was 1,865 at the end of 2004/05. This number includes 1,604 vehicles for conveyance of passengers and 214 vehicles for conveyance of luggage, parcels, mail, automobiles and horses, etc. This does not include departmental vehicles and 273 coach brake-vans.
(3) Freight wagons
The number of freight wagons on the Pakistan Railways was 21,556 at the end of 2004/05 comprising 10,491 covered wagons, 5,526 opens wagons and 5,216 special type wagons (for carriage of liquids, explosives, machinery, live-stock, timber and rails, etc.). This does not include 629 departmental wagons and 328 brake-vans. A total of 17,863 of those wagons are 4-wheelers, and the rest are mostly 8-wheelers.
Most of the wagons are out of date and of low performance. They are only equipped with vacuum brake systems. Some wagons, mainly the 4-wheelers, are restrained to operation speeds less than 55 km/hr because of their low stability.
The only high performance wagons that are currently useful are 130 flat wagons that were purchased from China and are used for container transport. The Pakistan Railways have a project to introduce 1,300 high performance wagons including 80 brake vans between 2002/03 to 2005/06. The introduction of the 130 flat wagons enabled the Pakistan Railways to start high speed container transport services between Karachi/Qasim ports and Lahore/ Faisalabad dry ports with six pairs of trains per week.
The actual transport time from Karachi to Lahore for the new high performance wagons is 26 hours, whereas that of conventional wagons is about 60 hours because of not only a long running time but also a long waiting time. Thus the existing conventional wagons take 2.5 times longer than locomotives.
(4) Manufacturing and Services
The Pakistan Railways undertake various non-core activities such as manufacturer, contractor, consultant as well as hospital and school services and other services. These activities are a relic of the past when the railway was the largest and most advanced enterprise and the primary land transport means. These activities are managed together with the railway under the unified regulations, even though they are not directly related to daily management, operation and maintenance of the railway. Their customer base is narrow and almost exclusively Pakistan Railways.

Pakistan Transport Plan Study in the Islamic Republic of Pakistan (PTPS)
2-37
2.3.3 Achievements of the Previous Master Plan, JICA Study 1995
The previous JICA study, “The Study on National Transport Plan in the Islamic Republic of Pakistan”, February 1995, predicted that the traffic demand for the railway would be 36,089 million passenger-km and 21,131 million ton-km in 2005/06, surmising the passenger traffic would keep its share and freight traffic would satisfy its share of an “economically desirable modal split”. However, the actual traffic demand in 2004/05 was 24,237 million passenger-kilometres and 5,013 million ton-kilometres, which is contrary to the predictions in the study.
The proposed railway project in the Master Plan consists of 17 projects of a total estimated cost of Rs. 146 billion. Each item and its proposed achievements are summarized in Table 2.3.9. As shown the table, there has been little progress on projects between 1995/96 and 2004/05. In particular, the improvement of the signalling system has been neglected, even though serious accidents were caused by problems in signalling system at Sangi in 1990 and at Ghotki in 1992.
As for rolling stock, not only locomotives but also passenger coaches and freight wagons have not been procured to the required scale. Above all, the lack of wagons required to meet the current customer needs has caused the catastrophic fall in its share of the land transport market
Double-tracking works for the remaining single track section on the corridor between Karachi and Lahore was executed only partially, and a section of 245 km (Khanewal - Raiwind) remains to be completed.
Since the 1970s, the road sector has been made a priority for investment in the transport sector and investment in the railway sector has been restrained. Therefore, the railway infrastructure and rolling stock has become aged and decrepit. In response, the government adopted the policy to increase investment in the railway sector in the eighth Five Year Plan (1993/94 – 1997/98) and allocated a budget. However, the government could not execute the budget for the railway due to the fragile national economic situation. The largest project implemented in this period was the purchase of thirty 3,000 HP diesel locomotives. This project was funded by OECF (in present, JBIC: Japan Bank for International Cooperation).
In July of 1997, in order to implement a radical reform of the Pakistan Railways, which were in a critical situation, the government decided to privatise the Pakistan Railways with the assistance of the World Bank. The Pakistan Railways considered themselves to be self-sufficient without the government support and attempted to reduce the government support in advance. Therefore, a backlog of investment in replacement, rehabilitation and daily maintenance were further amplified.
In the beginning of the year 2000, the government decided to postpone the privatisation. At the same time, the government approved to the execution of the Emergency Repair Plan (ERP) to the scale of Rs. 40.8 billion thereby promoting the rehabilitation and improvement of infrastructure and rolling stock.
Consequently, the Pakistan Railways commenced work on backlogged projects such as the purchase of diesel locomotives, coaches and high-performance wagons, track strengthening and rehabilitation work on main lines and double-tracking work in the section of Lodhran - Multan - Kahnewal. However, the project for the improvement of the signalling system has been postponed so far.
The above investment projects for the railways were listed in the Ten Year Plan (2001/02 – 2010/11) and are taken over in the Medium Term Development Framework (MTDF) 2005-2010.

Pakistan Transport Plan Study in the Islamic Republic of Pakistan (PTPS)
2-38
Table 2.3.9 Proposed railway project for the Master Plan in 1995
No. Projects Estimated Cost(Rs. Million) Achievement until 2004/05
1 Automatic block signalling Karachi - Lahore Lahore - Rawalpindi
2,220 1,760
460
No progress
2 Electric/Relay interlocking Karachi - Lahore
2,340 No progress
3 Tokenless block signalling and colour light signals Jacobabad - Quetta Kotri - Habib Kot Chak Jhumra - Lala Musa Attock City - Sher Shah Wazirabad - Sialkot
1,630
340400270570
50
No progress
4 Centralised traffic control system 1,100 No progress 5 Track renewal
Rail Sleeper
7,120 6,510
610
Partial progress
6 Electrification Samasata - Khanewal Kiamari - Samasata
17,420 1,170
16,250
No progress
7 Double tracking Lodhran - Sher Shah Multan - Khanewal
- Raiwind Shahdara Bagh - Rawalpindi Shahdara Bagh - Faisalabad
7,760 720
2,950
2,8201,270
Partial progress Under construction Under construction No progress No progress No progress
8 Upgrading KYC - LLM section 5,500 Partial progress 9 Electric locomotives
Procurement Revamping
4,350 3,3001,050
No progress
10 Diesel locomotives Procurement (3,000HP, 2000HP) Rehabilitation Traction motor renewal
43,800 40,300
3,000500
Partial progress 30xAGE-30, 12xDPU-30, 7xDPU-20 108x2,000HPClass Progress
11 Procurement of wagon movers 4,700 12 Procurement of Wagons 13,000 Partial progress
130 flat wagons out of 1,300 projected 13
Replacement of coaches 13,700 Partial progress 108 new coaches out of 175 projected
14 Improvement of rolling stock Air brake Roller bearing Air conditioner
3,000 1,0001,0001,000
Progress
15 Improvement of container traffic Karachi Dry Port Lahore Dry Port Other dry ports
2,400 400
1,600400
Partial progress
16
Information system and communi- cation system Management information system Seat reservation system Communication system
2,230
330400
1,500
Partial progress
17 Miscellaneous and minor projects 13,330 Total 145,600 Source: The Study on National Transport Plan in the Islamic Republic of Pakistan, February 1995

Pakistan Transport Plan Study in the Islamic Republic of Pakistan (PTPS)
2-39
2.3.4 Railway Transport
(1) Passenger Transport
a) Past and Present Situation As shown in the Table 2.3.10, the number of railway passengers began to decrease due to motorization at the end of the 1970s and reached its lowest level in 1998/99. Since hten the number of passengers has increased and is on track to recover. The number of passengers was 67.5 million in 1999/2000 and 78.1 million in 2004/05, an increase of 16% over the last five years.
Passenger-km was 18.5 billion in 1999/2000 and 24.2 billion in 2004/05, an increase of 31% over the last five years. The Pakistan Railways specialize in express services for middle/long distance intercity passenger transport.
Table 2.3.10 Railway Passenger Data
Year No. of
Passengers (million)
Total Passenger Kilometres (million)
Average No. of
Kilometres Travelled per
Passenger
Average Revenue
per Passenger
(Rs.)
Average Rate Charged per
Passenger per Kilometre (in Paisa)
1950-1955 average 78.9 6,778.5 85.9 1.50 1.75 1955-1960 average 102.7 8,064.0 78.5 1.56 1.99 1960-1965 average 126.3 9,533.6 75.5 1.55 2.05 1965-1970 average 130.5 10,025.2 76.9 1.83 2.28 1970-1975 average 134.1 10,792.2 80.2 2.36 2.93 1975-1980 average 145.7 15,112.0 103.7 4.47 4.31 1980-1985 average 113.5 17,402.6 155.3 11.32 7.21 1985-1990 average 82.3 18,483.2 224.3 21.15 9.42 1990/91 84.9 19,963.7 235.2 27.72 11.79 1991/92 73.3 18,158.0 247.7 36.54 14.75 1992/93 59.0 17,082.3 289.3 47.13 16.29 1993/94 61.7 16,385.1 265.5 45.70 17.23 1994/95 66.5 17,555.4 264.1 46.70 17.68 1995/96 73.7 18,904.8 256.7 48.85 19.03 1996/97 68.8 19,114.4 277.8 64.48 23.21 1997/98 64.9 18,773.8 289.4 70.60 24.22 1998/99 65.0 18,979.8 292.0 69.77 23.89 1999/00 67.5 18,495.3 273.9 72.41 26.43 2000/01 68.9 19,589.7 284.4 84.25 29.61 2001/02 69.0 20,782.9 301.1 95.10 31.60 2002/03 72.4 22,305.6 308.1 102.62 33.30 2003/04 75.7 23,045.1 304.4 108.44 35.62 2004/05 78.1 24,237.7 310.0 118,9 38.37 Note : Excludes differential on government traffic and Public Service Obligation Source : P.R. Yearbook
The average distance travelled has been increasing, and at present exceeds 300 km as shown in Figure 2.3.2. This indicates that short distance travel has shifted from railway to road transport, and the role of railway is specialized in middle/long distance travel. In current years, the degree of change tends to be slow.

Pakistan Transport Plan Study in the Islamic Republic of Pakistan (PTPS)
2-40
0
50
100
150
200
250
300
350
1945
1950
1955
1960
1965
1970
1975
1980
1985
1990
1995
2000
2005
km
Source: PR, JICA Study Team
Figure 2.3.2 Change in Average Distance Travelled
In 2004/05, the overall average transport density was 8,500 passengers per day. In the sections where passenger trains are running everyday, the average transport density increases to 10,600 passengers per day.
In the most congested section, Karachi - Lodhran, 18 to 21 pairs of passenger trains are operated in one day. These trains consist of 10 to 20 coaches. The daily operation volume of passenger trains/coaches is shown in Figure 2.3.3.
(1) Number of Trains (2) Number of Coaches
4020 trains/day
Lala Musa
RawalpindiPeshawar
Larkana
LahoreFaisalabad
Mianwali
Jacobabad
Multan
Karachi
Hyderabad
Rohri
Samasata
Gujranwala
Sibi
Quetta
Sialkot
Sargodha
250 coaches/day500
PeshawarRawalpindi
Lala Musa
Larkana
LahoreFaisalabad
Mianwali
Jacobabad
Multan
Karachi
Hyderabad
Rohri
Samasata
Gujranwala
Sibi
Quetta
Sialkot
Sargodha
Source: Elaborated by JICA Study Team based on Operation Time Table
Figure 2.3.3 Daily Operation of Passenger Trains
b) Rate Structure Currently, passenger services are classified into seven classes according to the quality of service and coaching vehicles.
• Air-conditioned Sleeper • Air-conditioned Sitter
(Total of both direction) (Total of both direction)

Pakistan Transport Plan Study in the Islamic Republic of Pakistan (PTPS)
2-41
• Air-conditioned Lower Special • Air-conditioned Lower • First Class • Economy Class • Second Class
Table 2.3.11 shows the distribution of passengers by the classes. For a long time, 96% to 97% of passengers have used the lower classes (economy class and second class). The air-conditioned lower class was started in 2004/05 with the aim of the improving passenger services. Now second class is only offered only for local trains.
Table 2.3.11 Pakistan Railways: Classification of Passenger Services (Thousand)
Air-Conditioned Class
Sleeper Sitter
Air- Conditioned
Lower
First ClassSleeper
Economy Class
Second Class Total Class
Year
No. % No. % No. % No. % No. % No. % No. 1995/96 78 0.11 258 0.35 737 1.00 627 0.96 30,083 41.50 41,379 56.18 73.6521996/97 69 0.10 250 0.36 1,254 1.82 632 0.92 29,645 43.09 36,951 53.71 68,8011997/98 72 0.11 291 0.45 1,453 2.24 628 0.97 29,819 45.50 32,607 50.26 64,8701998/99 72 0.11 251 0.39 1,415 2.18 610 0.98 30,768 47.34 31,812 49.00 64,9881999/00 89 0.13 240 0.36 1,481 2.19 625 0.93 30,241 44.80 34,832 51.59 67,5082000/01 99 0.15 163 0.24 1,511 2.19 683 0.99 32,373 47.01 34,080 49.42 68,8592001/02 99 0.15 145 0.21 1,444 2.10 585 0.84 34,886 50.56 31,844 46.14 69,0032002/03 95 0.14 139 0.20 1,909 2.62 403 0.55 37,225 51.42 32,632 45.07 72,3972003/04 91 0.12 138 0.18 1,867 2.47 417 0.55 38,880 51.36 34,307 45.32 75,7002004/05 94 0.12 142 0.18 1,928 2.45 413 0.55 40154 51.36 35430 45.32 78,179
Source: Pakistan .Railways. Yearbook
Table 2.3.12 shows the passenger fares for the Pakistan Railways. Passenger fares are classified by the classes and distance zones. The air-conditioned lower special class is only provided in the section between Karachi and Lahore. The fare for this class is set according to the section. Table 2.3.13 shows the fare of air-conditioned lower special in comparison to other classes.
Table 2.3.12 Passenger Fares
Fare (Rs.) Class Minimum 100 km 500 km
Air-conditioned Sleeper 130 240 1,160 Air-conditioned Sitter 80 130 630 Air-conditioned Lower 80 80 450 First Class Sleeper 60 70 420 Economy Class 10 35 210 Second class 7 25 130
Source: Pakistan Railways
Table 2.3.13 Fare for the Class of Air-conditioned lower special class Unit: Rs.
Section Air-conditioned Lower Special
Air-conditioned Sleeper Economy
Lahore - Karachi 1,280 1,870 510 Lahore - Hyderabad 1,090 1,670 460 Lahore - Multan 410 650 160
Source: Pakistan Railways

Pakistan Transport Plan Study in the Islamic Republic of Pakistan (PTPS)
2-42
(2) Freight Transport
a) Past Trend The change in freight traffic is shown in Table 2.3.14. The total number of tons carried and ton-km have been on a downward trend since 1960-65 and 1980-85 respectively, and in these years, are slightly in uptrend.
Table 2.3.14 Pakistan Railways: Freight Data
Year Tons carried (Thousand)
Ton-kilometres (Million)
Average Kilometres Carried by a Ton
1950-1955 average 9,244 4,377.9 477.0 1955-1960 average 11,703 5,479.8 468.2 1960-1965 average 14,156 7,212.7 514.4 1965-1970 average 14,619 7,899.9 550.8 1970-1975 average 12,715 7,906.7 626.3 1975-1980 average 13,367 8,598.5 665.3 1980-1985 average 11,185 7,379.1 666.2 1985-1990 average 10,960 7,942.6 732.2 1990/91 7,717 5,708.6 742.3 1991/92 7,560 5,961.6 792.4 1992/93 7,769 6,180.3 798.8 1993/94 8,036 5,938.8 741.7 1994/95 7,356 5,661.0 772.8 1995/96 6,854 5,077.4 742.3 1996/97 6,380 4,607.0 727.1 1997/98 5,977 4,447.3 745.8 1998/99 5,448 3,969.5 730.6 1999/00 4,770 3,753.5 759.3 2000/01 5,894 4,519,5 771.0 2001/02 5,866 4,572.7 782.6 2002/03 6,180 4,819.8 779.8 2003/04 6,140 4,796.3 781.2 2004/05 6,410 5,013.5 782.1 Source: P.R. Yearbook.
b) Commodities Major commodities handled by the Pakistan Railways are: 1) petroleum and other non-dangerous hydrocarbon oils (18.1%), 2) chemical manures (9.9%) and 3) railway material and stores (17.4%). The volume of each commodity carried in the fiscal year 2003/04 is shown in Table 2.3.15. Change of transport volume of main commodities in recent 5 years is shown Table 2.3.16.

Pakistan Transport Plan Study in the Islamic Republic of Pakistan (PTPS)
2-43
Table 2.3.15 Commodity Volume Carried
Name of commodities Freight Carried (Tonnes)
Tonne Kilometres (Tonnes-km) Kilometres of (km)
Iron and Steel Division "A" includes angle, axles, sheets, girders etc., 8 6,306 788
Sugar 72 56,634 787 Paddy and Rice 41 32,147 784 Cement 51 39,977 784 Oil Division "D" includes vacuum refined edible oil 40 31,366 784 Gypsum 23 17,972 781 Oil Seeds 201 157,031 781 Petroleum and other hydrocarbon oils non-dangerous i.e., having flashing point at above 76 Fahr. 1,111 867,812 781
Coal and Coke for the Public 362 282,715 781 Chemical manures (Fertilizers) 609 475,451 781 Fire wood 64 49,651 776 Ballast and Stone 25 19,259 770 Machinery, other than electrical 4 2,791 698 Other grains and pulses 4 2,713 678 Sugarcane 2 1,306 653 Timber 1 470 470 Live-stock 1 429 429 Salt 132 36,647 278 Miscellaneous 2,069 1,686,558 815 Total 4,820 3,767,235 782 Departmental Commodities Coal, Coke and Patent fuel for Railways (including H.S.D. and furnace oil) 253 195,120 771
Railway Material and Stores 1,067 833,914 782 Total 1,320 1,029,034 780 G-Total 6,140 4,796,269 781 Source: PR
Table 2.3.16 Change in Transport Volume for Main Commodities
Ton-Km of Commodity (Thousand) Name of commodity
2000/01 2001/02 2002/03 2003/04 Ratio of 2003/2000
Sugar 10,530 2,613 77 56,634 5.38 Paddy and Rice 13,204 16,977 37,098 32,147 2.43 Ballast and Stone 4,334 3,901 8,235 19,259 4.44 Coal and Coke for the Public 104,386 815,520 163,104 282,715 2.71 Salt 30,321 33,353 32,802 36,647 1.21 Iron and Steel 10,930 2,186 6,558 6,306 0.58 Petroleum and other hydrocarbon oils non-dangerous 1,990,675 2,064,518 1,755,677 867,812 0.44
Cement 138,280 66,374 68,586 39,977 0.29 Gypsum 75,157 71,269 81.635 17,972 0.24 Wheat 71,717 131,481 204,456 886 0.01 Source: Pakistan Railways
Pakistan Transport Plan Study in the Islamic Republic of Pakistan (PTPS)
2-44
c) Rate Structure Table 2.3.17 shows the basic rate scale for freight transport on the Pakistan Railways. The freight fare is determined on a commercial basis for each commodity, taking account of the following factors; volume, weight, form (type of packing), method of loading, susceptibility to transport losses.
Table 2.3.17 Pakistan Railways: Basic Rate Scale
Distance (km) Rate (Paisa per tonne per km) 1-250 km 37.85
+ 250-300 km 28.65 + 301-500 km 18.95
+ 501 km and Above 16.95 Note: Basis of Rate Scale 100 Source: PR
d) Freight Operation There is not currently a fixed operation diagram for freight trains. Freight trains are operated in intervals between the running of passenger trains and are frequently are forced to stop and wait for the passing and exchanging of passenger trains.
The Pakistan Railways offers container transport services between Karachi/Qasim ports and dry ports in Lahore, Faisalabad, Rawalpindi, Peshawar and Quetta. Most of the containers transported by railway are handled in the Lahore dry port, which was established in 1973 as the first dry port in Pakistan. The high speed container transport service commenced in 2003/04 with six pairs of trains per week.
2.3.5 Administration of Railway Sector
(1) Pakistan Railways (PR)
Pakistan Railways (PR) is a department of the MOR and is governed by the Railway Act of 1890. The Railway Board is the decision making organ and the Secretary of the MOR serves as its Chairman. The PR comprises two functional units: the Operation Unit and the Manufacturing and Service Unit each headed by a General Manger who is accountable to the Railway Chairman for the performance of the unit. The Operation Unit overseas train operations and all related functions, i.e. business units for passengers, freight and infrastructure. The Manufacturing and Service Unit is responsible for the management of the Concrete Sleeper Factories, Locomotive and Carriage Factories, Workshops, Hospitals and medical services, Schools and two consulting firms namely Pakistan Railway Advisory and Consultancy Services Ltd, (PRACS) and Railway Constructions Pakistan Ltd. (RAILCOP).
PR has seven territorial divisions, at Peshawar, Rawalpindi, Lahore, Multan, Sukker, Karachi and Quetta, and a Mechanical Division, Workshop Division at Moghalpura, and Administrative Division at the Headquarters in Lahore. The territorial and work divisions are each headed by a Divisional Superintendent, reporting to the General Manager (Operations). The Divisional Superintendent is assisted by the Divisional and Assistant Officers of their respective departments, i.e. engineering department (civil, mechanical, electrical, signal and telecommunications), Mechanical, Transportation, Commercial, Accounts and Railway Police. The number of employees of PR is 90,000. An allocation of Rs.62.5 billion has been made for the railway under the PSDP. This includes Rs.21.5 billion for on-going works and Rs.41.0 billion for new projects.
The Pakistan Railway network has 625 stations in its system connecting of the major cities in four provinces from North to South and East to West. The section of network Karachi-Lodhran (843 km) and 193 km of other short sections are double tracks, and 286 km from Lahore to Khanewal is electrified. The railway network is also connected to three neighbouring countries, Iran at Kohi Taftan, India at Wagha and Afghanistan at Chaman and

Pakistan Transport Plan Study in the Islamic Republic of Pakistan (PTPS)
2-45
Landi Kotai on the north-western border.
(2) Institutional Reform of the Pakistan Railways
The PR was organized as a subordinate department of the Ministry of Railways. This form of organization proved increasingly ineffective in coping with competition, as PR’s pre-eminent position was increasingly challenged in the post deregulation era.
In 1995, the JICA Study on the National Transport Plan in the Islamic Republic of Pakistan recommended the creation of a Pakistan Railway Corporation, similar to PIA, with a Ministerial presentation in the board. The ownership and overall direction of the railway would remain in the public sector, but day-to-day running of the railway would be passed on to commercially oriented managers with clearly defined targets and responsibilities. The study concluded that, ultimately, given the expectation of increased productivity and profitability in the railway sector, such a structure would be suitable for the privatization of the railways, if that was politically desirable.
In 1997, the GOP announced its strategy for the privatization of the Pakistan Railways. The strategy is to restructure the PR into three core businesses namely Passengers, Freight and Infrastructure. A new public entity (the Railway Resettlement Agency) will be created to retain all surplus assets and liabilities, including labour, real estate, debts and environmental clean up obligations. In addition, a new Railway Regulatory Authority will be established under a new regulatory framework for regulating the largely private sector rail industry. This plan was failed and caused a negative impact on the moral of the PR employees. In 2004, after 10 years of JICA recommendations and the unsuccessful attempts at the PR. privatization in 1997, the GOP has decided to create a Pakistan Railways Corporation. The objectives are:
• To promote the railway as the preferred mode of transport in the country; • To grant the Pakistan Railways Corporation sufficient autonomy to operate and to
enable it to effectively compete with other modes of transport; • To allow the Corporation to procure finances directly from banks/market under
suitable terms.
The new Board consists of a Chairman, CEO, and nine directors: three from the GOP, three from the Corporation and three from the private sector. The CEO will be recruited from the private sector. The GOP provides the Board with more autonomy and power for its governance.
(3) Reorganization of Management
The institutional reform calls for:
• Transferral from the strong social service aspects of the management structure to a commercially oriented railway
• Increasing performance by creating a business management structure to enhance management responsibilities and accountabilities and enable profit centre accounting
• The curtailment of surplus employees is one of the top priorities • Creating a financially sustainable structure.
The financial structure of the PR has been an ad hoc and unsustainable and there have been no tests, or monitoring to underpin budgetary support. During the 1990’s there was no investments in the railway infrastructure except for the procurement of locomotives. In the absence of a clear long-term plan or short-term goals and the “Shock Treatment” of 1998, the railway has failed to organize itself to receive PSDP allocations to cover maintenance of the rolling stock and rail structure. As a result the infrastructure and rolling stock are out of date and require a substantial amount of investment in order to function as one of the key transport systems in the country.
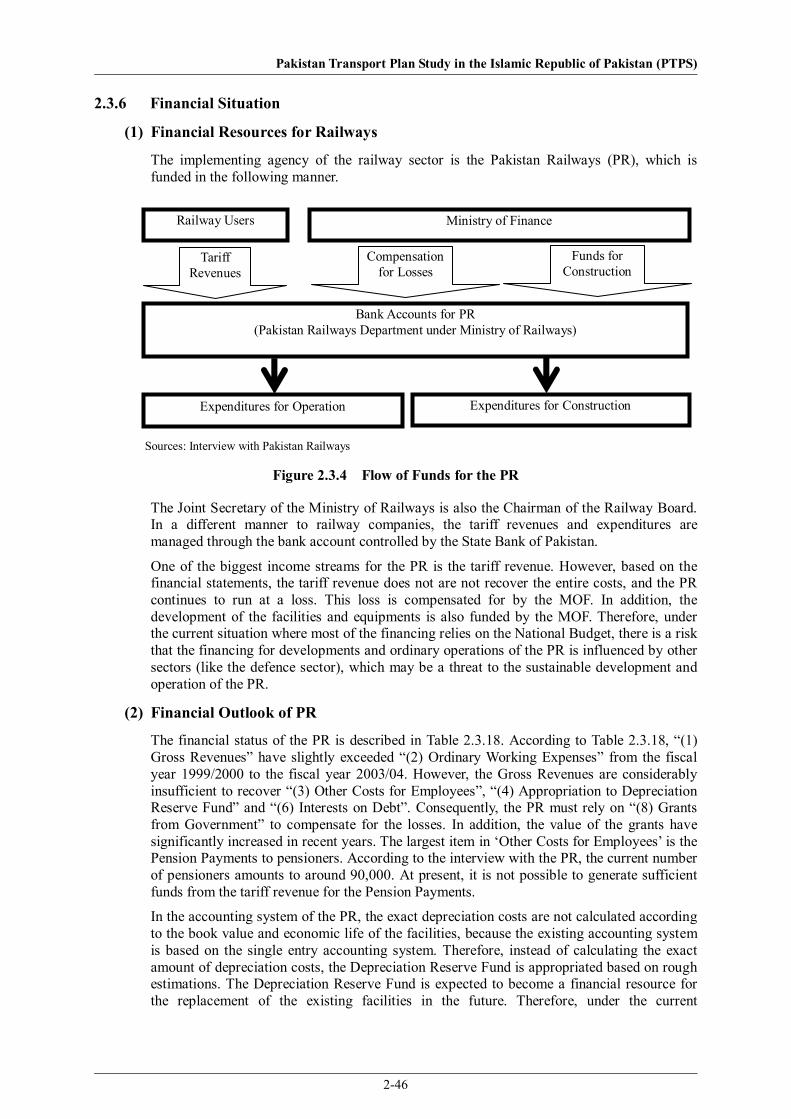
Pakistan Transport Plan Study in the Islamic Republic of Pakistan (PTPS)
2-46
2.3.6 Financial Situation
(1) Financial Resources for Railways
The implementing agency of the railway sector is the Pakistan Railways (PR), which is funded in the following manner.
Figure 2.3.4 Flow of Funds for the PR
The Joint Secretary of the Ministry of Railways is also the Chairman of the Railway Board. In a different manner to railway companies, the tariff revenues and expenditures are managed through the bank account controlled by the State Bank of Pakistan.
One of the biggest income streams for the PR is the tariff revenue. However, based on the financial statements, the tariff revenue does not are not recover the entire costs, and the PR continues to run at a loss. This loss is compensated for by the MOF. In addition, the development of the facilities and equipments is also funded by the MOF. Therefore, under the current situation where most of the financing relies on the National Budget, there is a risk that the financing for developments and ordinary operations of the PR is influenced by other sectors (like the defence sector), which may be a threat to the sustainable development and operation of the PR.
(2) Financial Outlook of PR
The financial status of the PR is described in Table 2.3.18. According to Table 2.3.18, “(1) Gross Revenues” have slightly exceeded “(2) Ordinary Working Expenses” from the fiscal year 1999/2000 to the fiscal year 2003/04. However, the Gross Revenues are considerably insufficient to recover “(3) Other Costs for Employees”, “(4) Appropriation to Depreciation Reserve Fund” and “(6) Interests on Debt”. Consequently, the PR must rely on “(8) Grants from Government” to compensate for the losses. In addition, the value of the grants have significantly increased in recent years. The largest item in ‘Other Costs for Employees’ is the Pension Payments to pensioners. According to the interview with the PR, the current number of pensioners amounts to around 90,000. At present, it is not possible to generate sufficient funds from the tariff revenue for the Pension Payments.
In the accounting system of the PR, the exact depreciation costs are not calculated according to the book value and economic life of the facilities, because the existing accounting system is based on the single entry accounting system. Therefore, instead of calculating the exact amount of depreciation costs, the Depreciation Reserve Fund is appropriated based on rough estimations. The Depreciation Reserve Fund is expected to become a financial resource for the replacement of the existing facilities in the future. Therefore, under the current
Sources: Interview with Pakistan Railways
Railway Users Ministry of Finance
Tariff Revenues
Compensation for Losses
Funds for Construction
Bank Accounts for PR(Pakistan Railways Department under Ministry of Railways)
Expenditures for Operation Expenditures for Construction
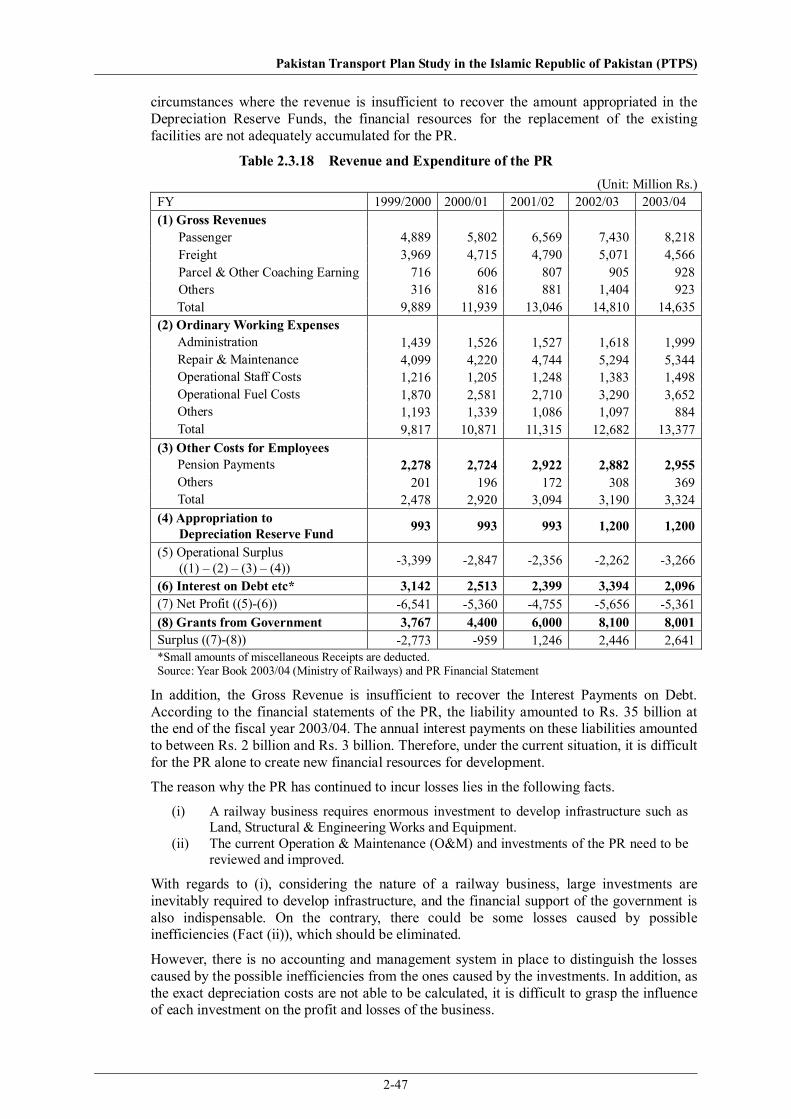
Pakistan Transport Plan Study in the Islamic Republic of Pakistan (PTPS)
2-47
circumstances where the revenue is insufficient to recover the amount appropriated in the Depreciation Reserve Funds, the financial resources for the replacement of the existing facilities are not adequately accumulated for the PR.
Table 2.3.18 Revenue and Expenditure of the PR (Unit: Million Rs.)
FY 1999/2000 2000/01 2001/02 2002/03 2003/04 (1) Gross Revenues
Passenger 4,889 5,802 6,569 7,430 8,218 Freight 3,969 4,715 4,790 5,071 4,566 Parcel & Other Coaching Earning 716 606 807 905 928 Others 316 816 881 1,404 923 Total 9,889 11,939 13,046 14,810 14,635
(2) Ordinary Working Expenses Administration 1,439 1,526 1,527 1,618 1,999 Repair & Maintenance 4,099 4,220 4,744 5,294 5,344 Operational Staff Costs 1,216 1,205 1,248 1,383 1,498 Operational Fuel Costs 1,870 2,581 2,710 3,290 3,652 Others 1,193 1,339 1,086 1,097 884 Total 9,817 10,871 11,315 12,682 13,377 (3) Other Costs for Employees Pension Payments 2,278 2,724 2,922 2,882 2,955 Others 201 196 172 308 369 Total 2,478 2,920 3,094 3,190 3,324 (4) Appropriation to
Depreciation Reserve Fund 993 993 993 1,200 1,200
(5) Operational Surplus ((1) – (2) – (3) – (4)) -3,399 -2,847 -2,356 -2,262 -3,266
(6) Interest on Debt etc* 3,142 2,513 2,399 3,394 2,096 (7) Net Profit ((5)-(6)) -6,541 -5,360 -4,755 -5,656 -5,361 (8) Grants from Government 3,767 4,400 6,000 8,100 8,001 Surplus ((7)-(8)) -2,773 -959 1,246 2,446 2,641 *Small amounts of miscellaneous Receipts are deducted. Source: Year Book 2003/04 (Ministry of Railways) and PR Financial Statement
In addition, the Gross Revenue is insufficient to recover the Interest Payments on Debt. According to the financial statements of the PR, the liability amounted to Rs. 35 billion at the end of the fiscal year 2003/04. The annual interest payments on these liabilities amounted to between Rs. 2 billion and Rs. 3 billion. Therefore, under the current situation, it is difficult for the PR alone to create new financial resources for development.
The reason why the PR has continued to incur losses lies in the following facts.
(i) A railway business requires enormous investment to develop infrastructure such as Land, Structural & Engineering Works and Equipment.
(ii) The current Operation & Maintenance (O&M) and investments of the PR need to be reviewed and improved.
With regards to (i), considering the nature of a railway business, large investments are inevitably required to develop infrastructure, and the financial support of the government is also indispensable. On the contrary, there could be some losses caused by possible inefficiencies (Fact (ii)), which should be eliminated.
However, there is no accounting and management system in place to distinguish the losses caused by the possible inefficiencies from the ones caused by the investments. In addition, as the exact depreciation costs are not able to be calculated, it is difficult to grasp the influence of each investment on the profit and losses of the business.

Pakistan Transport Plan Study in the Islamic Republic of Pakistan (PTPS)
2-48
2.3.7 Issues and Problems
(1) Infrastructure
a) Insufficient Signalling System A tragic accident occurred at Sharhad on 19th of July 2005. This accident could have been avoided with a proper signalling system.
Various types of interlocking systems are applied, but some stations on miner lines are excluded from the interlocking system. In addition, the ATP has so far been installed even though the operation speed is 120km/hr.
An automatic block system has only been installed over a section of 188 km out of 7,791 km, and is not been installed even in the double track sections. Most of the signals, other than the sections with the automatic block system are semaphores which are dim, difficult to be recognized in night time, and require frequent maintenance work. Improvement of the signalling systems, including the installation of automatic train protection devices (ATP), is postponed.
The existing signalling system is insufficient for the current operation and safety requirements due to because of the following problems;
• No back-up system, • Many staff required to switch signals, • No spare parts due to quite old types of signals, • Quite small line capacity regardless the double track, • Low night visibility of semaphores at night and higher danger of oversight, • Restricted train speed at 15 km/hr in large station yards
b) Unsatisfactory Telecommunication System The telecommunication system aids the sales systems and smoothes train operation smooth leading to a credible high-quality service and raising safety levels. The current telecommunication system is not satisfactory for a sustainable railway network.
Table 2.3.19 Problems with the Existing Signalling System Item Remark No back up System A backup system is important because the scale of damage caused by an accident on the
railway is very large. There are many trains running on the Main Line, and the ratio of accidents such as oversight of signals is likely to be high. In addition, since the Pakistan Railways operate high-speed trains at the speed of 105–120 km/hr, an accident may result in quite large damages. However, currently, no automatic train protection system (ATP) has been installed to provide a back-up system and protect against human errors such as oversight of red signal.
Many staff required to switch signals
At each stations, it is necessary to allocate a group of five staff for each of three shifts at a station – a station master (or their alternative), one signalman for signal cabins in each direction, and one sub-signalman for the turnouts in each direction. (The reason for the allocation of sub-signalmen is that a turnout sometimes does not function by remote control from a signal cabin.). Taking account of backup staff for holidays and staff for management, it is necessary to allocate at least 25 staff at each station. Since only one train is allowed to run between an adjoining two stations, stations are laid out at every 10 -15 km in the section between Karachi and Lahore on the Main Line, where the train operation density is high. The group of staff is allocated at each station.

Pakistan Transport Plan Study in the Islamic Republic of Pakistan (PTPS)
2-49
cont. of Table 2.3.19 Item Remark No spare parts due to quite out-dated type of signals
No suppliers can provide spare parts as the signals in use are quite out-dated. Currently, the Pakistan Railways makes do with some spare parts from abolished stations. However, in case additional spare parts are required more in the future, the Pakistan Railways has no choice but to purchase specially manufactured expensive parts. By the abolishing some stations, the Pakistan Railways curtailed the number of staff required, however the spacing between some stations became longer causing new bottlenecks.
Quite small line capacity regardless of the double tracks
Only one train is allowed to run in one direction between adjacent stations. It takes a long time to communicate and switch signal levers in order for a follow-on train to depart from the preceding station. The long handling time of the current signalling systems disturbs the smooth train operation and amplifies delays. During the site investigation, it was often observed that trains were forced to slow down or make a long stop for changing handling levers. Therefore, despite the double track section, the line capacity is quite low, and other facilities are not utilized efficiently. Note: JICA Study Team
Long waiting time required to overtake a train running at a different speed
When a slow freight train or local passenger train is overtaken by an express train, the slow train is forced to wait until the express train passes, because only one train at a time is allowed to run between stations. In this case, the waiting time for those trains is the total of the following 1) and 2): 1) running time of an express train for two station-to-station distances and signal sighting distance; and 2) time for switching signal levers twice. Depending on the station-to-station distance, a train will be required to wait for 20-30 minutes. There is not only the long waiting time, the number of times a train needs to stop also increases, because the next train will catch up with the waiting train. Therefore, the travelling time for slow trains becomes quite long. In the time zone when express passenger trains are in operation at intervals of 20–30 minutes, once caught up with, slow trains may not be able to run forward for quite some time. This causes a serious drop in the average train speed for freight trains. Taking economic efficiency into account, it is not realistic to operate heavy freight trains at high-speeds like passenger trains. Although high performance wagons are to be introduced in the future, the problem of long waiting times will remain to some extent. With regarding to local passenger trains, delays further amplify the long unexpected waiting times. In order for an express train to avoid overtaking a local train at a middle station, the express train sometimes follows the local train until a large station is reached, where the standing time will be long.
Low night visibility of semaphores and higher danger of oversight
A semaphore is an obscure lamplight through coloured glass, and it is too dim to recognize during the night time. An oversight of a signal sighting sign may cause a driver to be late in the sighting the signal. In fact, a driver will sometimes turns off the headlights to confirm the signals.
Restricted train speed at 15 km/hr in large station yards
Train speed is regulated at 15 km/hr in the following large station yards; Karachi City, Karachi Cant., Kotri, Hyderabad, Rohri, Samasata, Lodhran, Sher shah, Multan Cant., Khanewal, Raiwaind and Lahore. This train speed significantly influences travel times. The signalling system, track alignment in station yards and inadequate maintenance of turnouts, creates th need for this speed restriction. It is necessary to improve the train speed by the improvement of the signalling system and track strengthening work including turnouts on the main tracks.
Note: JICA Study Team
c) Delay in Track Strengthening/Rehabilitation Works along the Main Corridor Currently, the actual maximum speed is 95 to 105 km/hr on the main corridor. The actual speed meets the present requirement for transport services, but it is not sufficient for sustainable railway management.
d) Remaining Single Track Section on the Main Corridor A single track section of 245 km (Khanewal - Raiwind) is still remaining on the main

Pakistan Transport Plan Study in the Islamic Republic of Pakistan (PTPS)
2-50
corridor. The traffic is heavy in this section as well as the other double track sections. However, the scheduled speed is forced to be reduced in this section because trains must wait to exchange, and delays are amplified by unexpected waiting. This means that the single track section disturbs effective train operation.
e) Aging of Bridges and Poor Repainting Work for Steel Bridges Most of the bridges have problems due to aging. In particular, five bridges are recognized as “Bridges requiring attention”, and rehabilitation or reinforcement works are required according to the level of aging. In addition, repainting work for the maintenance of steel bridges has not been adequately due to the lack of funds and skilled work force.
f) Inadequate Priority for Electrification The Pakistan Railways has planned to extend the electrified section to Samasata together with the rehabilitation of the existing electrified facilities that are aging. They also plan to electrify the second track to meet the double tracking plan just within the electrified section. (The existing electrified section is 285 km and the proposed is 404 km in total.)
There is a low priority for the extension and rehabilitation of the electrified section, because partial electrification is inefficient. Partial electrification requires the frequent changing of, and only short runs for locomotives. In addition, the power supply in Pakistan is not stable enough to extend the electrification.
The double-tracking plan has a higher priority than electrification. It is not possible to electrify only one track of a double track. Therefore, in carrying out double tracking, due consideration should be given to the choice of electrification.
(2) Rolling Stock
a) Shortage of Reliable and High Performance Locomotives Currently, the Pakistan Railways owns 557 locomotives, but the age of more than half of these is beyond their expected lifetime, which increases maintenance works.
b) Shortage of Suitable and Attractive Passenger Coaches The existing fleet of passenger coaches is insufficient to carry out the required services. Express trains are always crowded, and people are forced to purchase tickets far in advance to reserve their seats. Commencement of new train services and additional coaches resulted in an increase of passengers in recent years.
Out of new 175 coaches, New 108 have been imported from China. These commenced operation in 2003/04. Out of the 450 coaches in a rehabilitation plan, 317 are sent from the Carriage Factory, Islamabad. Some of them are converted to allow for the new service of “air-conditioned lower (special)”.
The maximum permissible operation speed of these new and rehabilitated coaches is 140 km/hr, if all other conditions are satisfied. They have the much potential to improve the services and competitiveness in the future, however, at present the quantity and service level of passenger coaches is too low.
c) Shortage of High Performance Freight Wagons The operation speed of freight trains is relatively the low due to low performance of the existing freight wagons.
PR has only 130 flat wagons (purchased from China) for container transport which can be regarded as high performance wagons. Almost all freight trains operate at less than 55 km/hr. Such low speed operation requires not only a long operating time but also a long waiting time. Thus, the average speed is extremely low, and the current system of railway freight

Pakistan Transport Plan Study in the Islamic Republic of Pakistan (PTPS)
2-51
transport is not able to meet the market demand. In addition, low speed operation interrupts the effective use of valuable locomotives.
Most of the existing 4-wheelers will be useless in the near future because they are unsuitable for the current transport system.
(3) Transport
a) Severe Competition The passenger transport on the Pakistan Railways is steady with express services for middle to long distance intercity transport. However, competition from road transport is predicted to be further intensified in the future with the progress of road construction projects and the development of the automobile industry. Moreover, as the Pakistan economy develops, customers of the upper class railway services who pay high fares will become wealthier. Consequently, those customers will shift to air transport or begin to use private cars. The Pakistan Railways operate in a severely competitive environment. Therefore, continuous to keep up with the changing environment are required for the railway to survive.
b) Low Fares One of the key problems in passenger transport is that the “economy class” fare is too low to cover the costs despite the fact that earnings from the economy class are the main earnings. The revenue from economy class and second class amounts to 77% of the total revenue from passenger transport. Considering the highly competitive situation, it is necessary to raise fares and offer higher quality services that can attract passengers and attract higher fares, for example the introduction of the “Air-conditioned Lower (Special)”.
c) Serious Delays Long distance trains have considerable delays, and the length of the delay accumulates towards the end of the journey. This is a serious problem that degrades the value of the railway service. For example, the service of “7up Tezgam” from Lahore to Rawalpindi appears to be convenient on the time table, but actual operation times are not given on the time table.
For example, the actual delays observed by the study team during the site investigation were as follows (Table 2.3.20).
Table 2.3.20 Actual Delays Observed Date Train # Station Delay
20 July 2005 8DN Khanewal Jn. 1 hr. 13 min. a Rohri Jn. 4 hr. 36 min. a Karachi Cantt. 4 hr. 55 min.
28 July 2005 29UP Dabheji 15 min. Ran Pethani 47 min. (increasing 32min.in 18.4 km) Rohri Jn. 1 hr. 6 min. Lodhran 1 hr. 48 min. Multan 1 hr. 55 min.
29 July 2005 115UP Multan (Start) 41min. Lahore 1 hr. 40 min.
30 July 2005 103UP Rawalpindi 26 min. Source: JICA Study Team
On 28 July 2005, the 29UP train took 42 minutes from Dabheji to Ran Pethani (18.4km) accumulating a delay of 32 minutes This delay was caused by speed restriction attributed to the track strengthening work over a long section. Construction/maintenance work should be limited to an appropriate length to minimize delay to train in service. To decide this length, both the economic efficiency of the construction/maintenance work and the effect of the works on the quality of services should be taken into consideration.
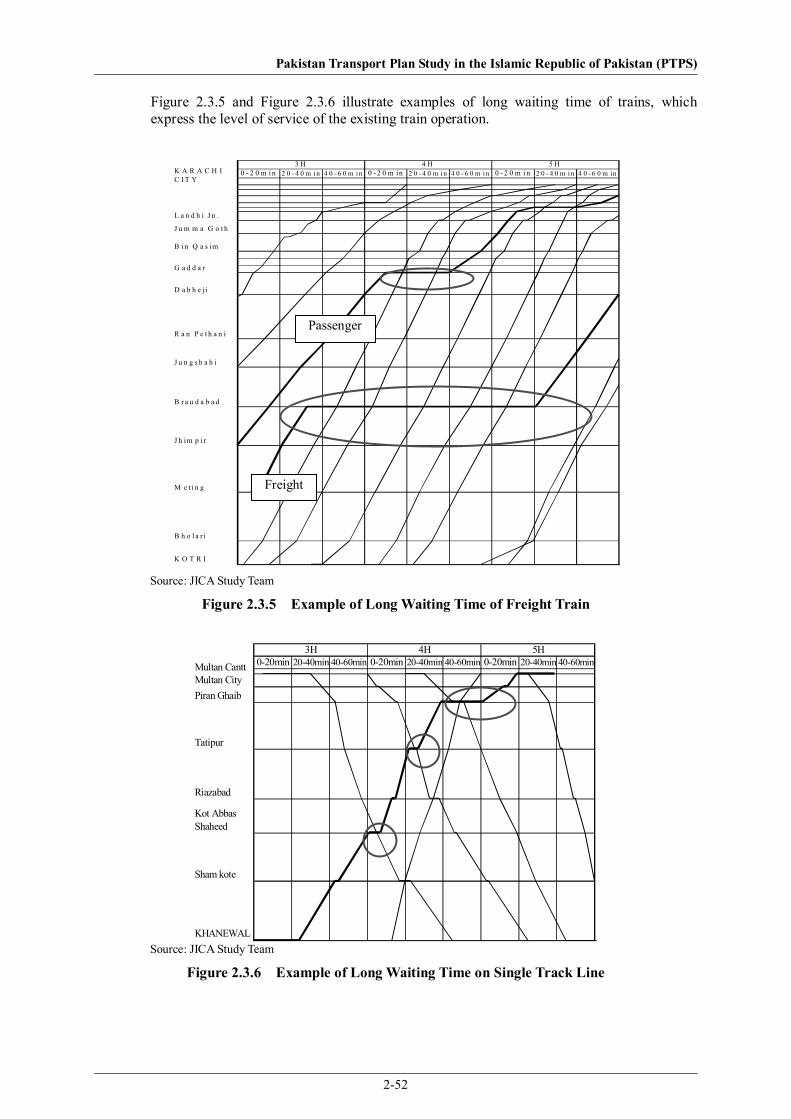
Pakistan Transport Plan Study in the Islamic Republic of Pakistan (PTPS)
2-52
Figure 2.3.5 and Figure 2.3.6 illustrate examples of long waiting time of trains, which express the level of service of the existing train operation.
3 H 4 H 5 H
0 - 2 0 m i n 2 0 - 4 0 m i n 4 0 - 6 0 m i n 0 - 2 0 m in 2 0 -4 0 m i n 4 0 - 6 0 m i n 0 - 2 0 m i n 2 0 - 4 0 m i n 4 0 -6 0 m in
L a n d h i J n .
J u m m a G o t h
B i n Q a s im
G a d d a r
D a b h e j i
R a n P e t h a n i
J u n g s h a h i
B r a u d a b a d
J h im p i r
M e t i n g
B h o l a r i
K O T R I
K A R A C H IC I T Y
Source: JICA Study Team
Figure 2.3.5 Example of Long Waiting Time of Freight Train
3H 4H 5H
0-20min 20-40min 40-60min 0-20min 20-40min 40-60min 0-20min 20-40min 40-60min
Multan CityPiran Ghaib
Tatipur
Riazabad
Kot AbbasShaheed
Sham kote
KHANEWAL
Multan Cantt
Source: JICA Study Team
Figure 2.3.6 Example of Long Waiting Time on Single Track Line
Passenger
Freight

Pakistan Transport Plan Study in the Islamic Republic of Pakistan (PTPS)
2-53
d) Insufficient Capacity The carrying capacity of the passenger transport is insufficient. The express trains, which are the main services on the Pakistan Railways, are always overcrowded and it is difficult to offer immediate seat reservations. Travelling without a seat is unfavourable for long distance express services. This situation results in customers in choosing other means of travel.
e) Less Attention to Freight Transport Currently freight transport is not treated on an equal terms with passenger transport. For example, there is a higher priority for locomotives to be used for passenger transport. Freight trains have no fixed operation diagram and no precedence in the actual operation adjustment. In order to prosper, it is essential that the freight business, such as high speed container transport, obtains equal status with passenger transport.
(4) Administration
a) Obscure Responsibilities for Each Business Unit The responsibilities of the three business units under the operation unit; the infrastructure business unit, passenger business unit and freight business unit, are not clearly divided.
b) Non-core Business Activities under the Direct Management of PR The non-core activities under the Manufacturing and Services Unit are managed together with the railway under the unified regulation, and their customers are limited to the Pakistan Railways. This situation prevents the activities from prospering by broad and free business and forces the Pakistan Railway to bear a considerable burden.
The non-core businesses are to be separated from the railway as stand alone businesses so that each business can be well managed. They can then expand their customer bases and business categories, make the most of their property and human resources and raise efficiency by applying suitable management principles without any restraints from the railway management.
For example, the carriage factory is able to manufacture not only carriages but also steel bridges, large automobile chassis/bodies and containers for customers other than the Pakistan Railways. Concrete sleeper factories are able to manufacture various concrete products such as piles, poles, U-shaped gutters as well as sleepers. They can sell those products to a broad range of customers.
As for hospitals and schools, a comprehensive reform must be carried out whereas the facilities can be useful as property.

Pakistan Transport Plan Study in the Islamic Republic of Pakistan (PTPS)
2-54
(5) Summary of Issues
The Pakistan Railways has many issues. They are mainly due to a backlog caused by a shortage of funds in the 1990s. Other issues are the result of overlooking the demand in the transport market.
The issues are summarized below:
• Completion of track strengthening of the main corridor, in which the maximum speed of 120km/hr is applied for the highest standard section;
• To set maintenance schedule and to make outfit and equipment satisfactory with track maintenance work because not only track strengthening, but also maintenance work such as tamping and re-alignment is indispensable to keep tracks in good condition.;
• To improve telecommunication system – improvement of signalling systems inevitably accompanies enhancement of telecommunication systems;
• To double –tracked the single track section between Khanewal and Raiwind as early as possible, considering that improvement of bypass routes as an alternative is expected to be much more expensive than the double tracking;
• To increase the number of high performance locomotives in order to provide more reliable and sustainable services and to expand railway transport;.
• To secure high performance wagons and locomotives to realize high speed freight transport service ;
• To increase the number of coaches to improve quality of services; • To introduce suitable high performance wagons as much as possible for railway freight
transport to survive.

Pakistan Transport Plan Study in the Islamic Republic of Pakistan (PTPS)
2-55
2.4 Port 2.4.1 Ports
(1) Introduction
Pakistan's coastline faces the Arabian Sea and is approximately 1,100 km in length, of which 330 km is in the Sind Province and 770 km is in the Baluchistan Province. The ports of Karachi and Qasim are located in the Sind Province and are the only deep sea ports in Pakistan as shown in Figure 2.4.1.
Along the coastline there are several ports including two international ports; the ports of Karachi and Qasim. Other ports are mostly small ports such as Jiwani, Gwadar, Pasni, Kalmat, Ormara, Sonmiani, Nargar Parkar and Keti Bunder.
Since 1950 Pakistan has expanded its port facilities. Karachi port was originally Pakistan's only port. A second port was built at the port of Qasim and became operative in the early 1980's. Government policy in recent years has been to promote privatization, and both ports have been developed with the assistance of private funds.
The total cargo volume through the two ports in 2003/04 was 43.4 million tons, about 1.6 times the volume in 1991/92. Therefore, this study considers the two ports of Karachi and Qasim as part of the study for the national transport plan.
(2) Natural Conditions
a) Geography The Port of Karachi is located to the west of the mouth of the Indus River. The port is situated between the Western and Eastern Backwater. The Western Backwater (behind the West Wharf) is an area of approximately 35 km2, and the Eastern Backwater (behind the East Wharf) is an area of about 6 km2 and some of the area is covered with mangroves. The harbour entrance is protected by Manora Breakwater (480 m) and Keamari Groyne. The surface is mostly covered with mud and many creeks running through a shallow area.
The port of Qasim is located between Phitti, Kadiro and Gharo Creeks. The whole channel is divided into outer and inner channels with a total length of 43.7 km. The outer channel is open to waves approaching from the southwest during the monsoon season, while the other is in the protected creek.
b) Tides The major tidal levels are as shown in Table 2.4.1.
Table 2.4.1 Tidal Levels unit: m
Tidal Level Karachi Qasim Highest Astronomic Tide H.A.T 3.20 3.44 Mean Higher High Water M.H.H.W 2.68 2.93 Mean Lower High Water M.L.H.W 2.19 2.26 Mean Sea Level M.S.L 1.65 1.74 Mean Higher Low Water M.H.L.W 1.10 1.22 Mean Lower Low Water M.L.L.W 0.43 0.55 Chart Datum 0.00 0.00 Lowest Astronomic Tide L.A.T -0.43 -0.58
Source: Pakistan Tide Tables

Pakistan Transport Plan Study in the Islamic R
epublic of Pakistan (PTPS)
2-56
Figure 2.4.1 Karachi and Qasim Ports Area
Source: JICA Study Team

Pakistan Transport Plan Study in the Islamic Republic of Pakistan (PTPS)
2-57
c) Currents Observations of the maximum velocity and direction of the currents at the port of Karachi were carried out at points near the top of the Manora Breakwater in July and August, 1971. According to the observations, the direction of the flood currents is eastward at both points. The velocity of the flood currents is approximately 0.3 m/sec. The direction of the ebb currents is south westward and the velocity is between 1 m/sec and 1.25 m/sec. These velocities are relatively low and can be considered not to affect the navigation of vessels.
The maximum velocity and direction of the currents at the outer channel of the port of Qasim during spring tide were assumed based on the two observation points. The direction of the current inside the Phitti creek was determined by the tides. Discharges of the rivers flowing into the creek are small, so their contributions are negligible. According to the Pakistani Chart (PAK-20), the maximum current velocity in the channel (near Buddo Island) during spring tide is 1.5 m/sec for flood current and 2.5 m/sec for ebb current. Velocities in Phitti creek are 1.25 m/sec for flood current and 1.5 m/sec for ebb current. It is understood that the current speed is generally not strong, however, during the spring tide period the maximum current could affect the navigation of ships in the narrow channel.
d) Earthquakes Pakistan lies in the active seismic region which runs through Indonesia to the Himalayas. However, in the Karachi region, no earthquakes of any considerable magnitude are reported.
According to a map of the seismic zone prepared by the Department of Meteorology and Geophysics of West Pakistan, the seismic factor in the Karachi region ranges from 0.05 to 0.10. According to the "Soil Investigation Report for Marginal Wharf Project in Port of Qasim in 1976", the port area lies in a minor seismic zone, with acceleration ranging from 0.05 to 0.07.
(3) Berthing Facilities
a) Karachi Port The Port has five water areas: the Approach Channel, Channel Bend, Lower Harbour, Upper Harbour and Juna Bunder. The berth facilities are comprised of the East Wharf, West Wharf, Juna Bunder Wharf, Barge Wharf and Oil Piers, which have transit sheds or plinth. The entrance of the port is protected from open sea waves by the Keamari Groyne and Manora Breakwater as shown in Figure 2.4.2.
There are a total of 30 berths, 17 on the East Wharf, 7 berths on the West Wharf and 6 berths on the Juna Bunder Wharf. Three Oil Piers including Oil Pier II which is under construction are located in the lower harbour.
In addition, there are two international container terminals such as Karachi International Container Terminal (KICT) and Pakistan International Container Terminal (PICT) as described below.
KICT is situated at berth Nos. 28 to 30 on the West Wharf with a total quay length of 600 m. The major shipping lines using the KICT terminal are: APL, Cosco, Evergreen, Hanjin HMM, Lloyd Triestino, OOCL, PONL, Seacon, TSK, Wan Hai and Yang Ming.
PICT is situated at berth Nos. 6 to 9 on the East Wharf with a total terminal area of some 22 hectares, a quay length of 600 m and a water depth in front of the quay of 10.5 m.
Lists of the channels, berths and storage facilities are presented in Table 2.4.2, Table 2.4.3 and Table 2.4.4.
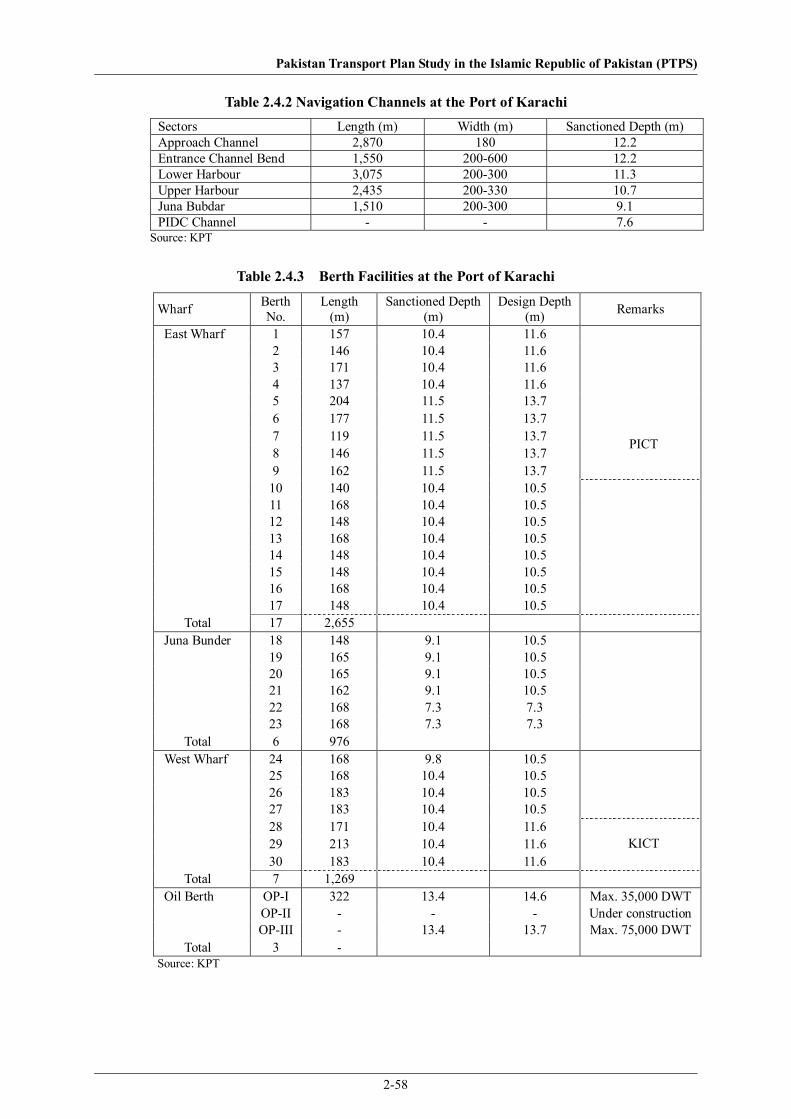
Pakistan Transport Plan Study in the Islamic Republic of Pakistan (PTPS)
2-58
Table 2.4.2 Navigation Channels at the Port of Karachi Sectors Length (m) Width (m) Sanctioned Depth (m) Approach Channel 2,870 180 12.2 Entrance Channel Bend 1,550 200-600 12.2 Lower Harbour 3,075 200-300 11.3 Upper Harbour 2,435 200-330 10.7 Juna Bubdar 1,510 200-300 9.1 PIDC Channel - - 7.6
Source: KPT
Table 2.4.3 Berth Facilities at the Port of Karachi
Wharf Berth No.
Length (m)
Sanctioned Depth (m)
Design Depth (m) Remarks
East Wharf 1 157 10.4 11.6 2 146 10.4 11.6 3 171 10.4 11.6 4 137 10.4 11.6 5 204 11.5 13.7 6 177 11.5 13.7 7 119 11.5 13.7 8 146 11.5 13.7 9 162 11.5 13.7
PICT
10 140 10.4 10.5 11 168 10.4 10.5 12 148 10.4 10.5 13 168 10.4 10.5 14 148 10.4 10.5 15 148 10.4 10.5 16 168 10.4 10.5 17 148 10.4 10.5 Total 17 2,655 Juna Bunder 18 148 9.1 10.5 19 165 9.1 10.5 20 165 9.1 10.5 21 162 9.1 10.5 22 168 7.3 7.3 23 168 7.3 7.3 Total 6 976 West Wharf 24 168 9.8 10.5 25 168 10.4 10.5 26 183 10.4 10.5 27 183 10.4 10.5 28 171 10.4 11.6 29 213 10.4 11.6 30 183 10.4 11.6
KICT
Total 7 1,269 Oil Berth OP-I 322 13.4 14.6 Max. 35,000 DWT OP-II - - - Under construction OP-III - 13.4 13.7 Max. 75,000 DWT Total 3 - Source: KPT

Pakistan Transport Plan Study in the Islamic R
epublic of Pakistan (PTPS)
2-59
Figure 2.4.2 Port of Karachi
K.I.C.T
P.I.C.T
OP-III
OP-II
OP-I
R.L.5
R.L.4
R.L.3
R.L.2
ENTRANCE CHANNEL
MANORA BREAKWATERKE AMARI G
ROYNE
G.L.5
G.L.4
G.L.3
G.L.2
LOWER HARBOUR
BUNKER ISLAND
BITH ISLAND
BABA ISLAND
NEW CHANNEL
CHINNA CREEK BACKWATER
NEW N.M.ROAD BRIDGE
P.B.S
ESSO
P.B.S
ESSO
P.R.L
P.B.S
P.N.
O
DA
WO
OD
EAST WHARVES BERTHS
WEST WHARVES BERTHS
N.M. BERTHS
JUN
A BU
NDER BERTHS
MANORA
0 500 1000m
12345
67
89
1011
1213
1415
1617
20
22
2425
2627
2829
30
23
2119
18
N
Source: KPT
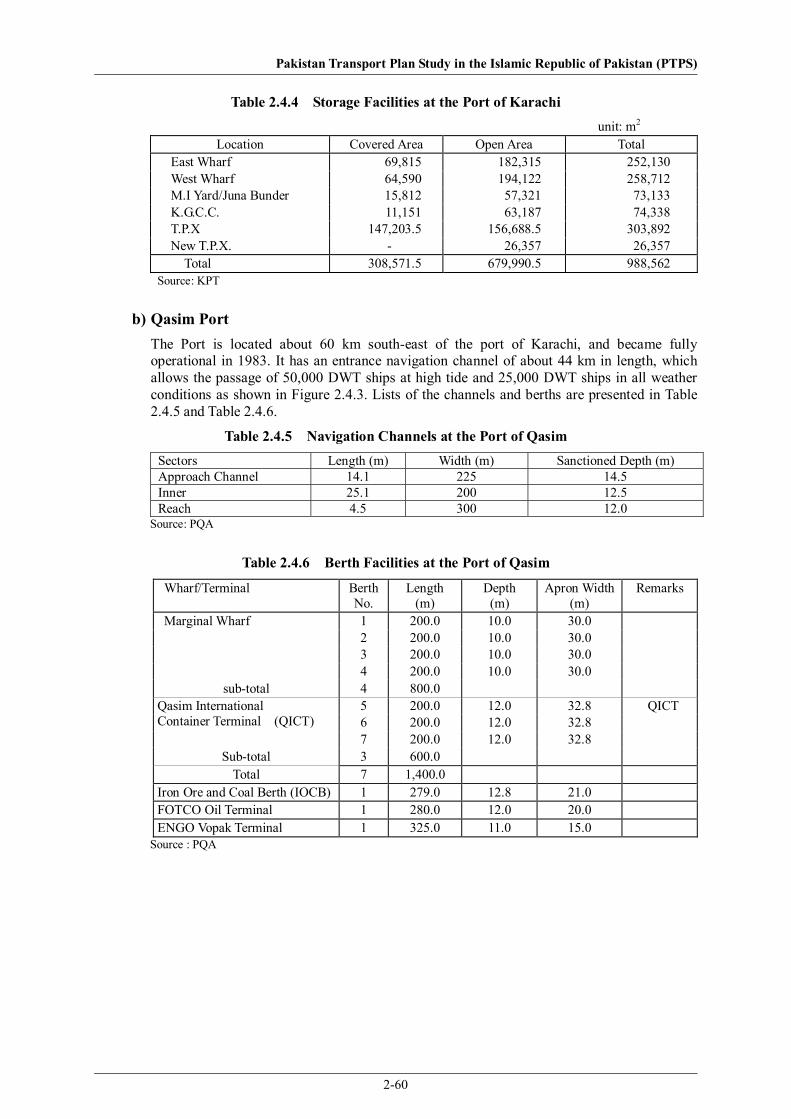
Pakistan Transport Plan Study in the Islamic Republic of Pakistan (PTPS)
2-60
Table 2.4.4 Storage Facilities at the Port of Karachi unit: m2
Location Covered Area Open Area Total East Wharf 69,815 182,315 252,130 West Wharf 64,590 194,122 258,712 M.I Yard/Juna Bunder 15,812 57,321 73,133 K.G.C.C. 11,151 63,187 74,338 T.P.X 147,203.5 156,688.5 303,892 New T.P.X. - 26,357 26,357 Total 308,571.5 679,990.5 988,562 Source: KPT
b) Qasim Port The Port is located about 60 km south-east of the port of Karachi, and became fully operational in 1983. It has an entrance navigation channel of about 44 km in length, which allows the passage of 50,000 DWT ships at high tide and 25,000 DWT ships in all weather conditions as shown in Figure 2.4.3. Lists of the channels and berths are presented in Table 2.4.5 and Table 2.4.6.
Table 2.4.5 Navigation Channels at the Port of Qasim Sectors Length (m) Width (m) Sanctioned Depth (m) Approach Channel 14.1 225 14.5 Inner 25.1 200 12.5 Reach 4.5 300 12.0
Source: PQA
Table 2.4.6 Berth Facilities at the Port of Qasim
Wharf/Terminal BerthNo.
Length (m)
Depth (m)
Apron Width (m)
Remarks
Marginal Wharf 1 200.0 10.0 30.0 2 200.0 10.0 30.0 3 200.0 10.0 30.0 4 200.0 10.0 30.0
sub-total 4 800.0 5 200.0 12.0 32.8 QICT 6 200.0 12.0 32.8
Qasim International Container Terminal (QICT)
7 200.0 12.0 32.8 Sub-total 3 600.0
Total 7 1,400.0 Iron Ore and Coal Berth (IOCB) 1 279.0 12.8 21.0 FOTCO Oil Terminal 1 280.0 12.0 20.0 ENGO Vopak Terminal 1 325.0 11.0 15.0
Source : PQA

Pakistan Transport Plan Study in the Islamic Republic of Pakistan (PTPS)
2-61
The "Marginal Wharf" is comprised of seven berths with a total length of 1,400 m. Berth Nos. 1 to 4 are used as multi-purpose terminals and handle edible oil, liquid bulk, chemicals and LPG (berth No. 1), wheat, fertilizer, rice and cement (berth Nos. 3 to 4) and can take fully laden ships up to 25,000 DWT. Berth Nos. 5 to7 are used for container handling by
Figu
re 2
.4.3
Po
rt o
f Qas
im
Sour
ce: P
QA

Pakistan Transport Plan Study in the Islamic Republic of Pakistan (PTPS)
2-62
QICT and can accommodate ships up to 35,000 DWT. There are four private terminals as follows.
Iron Ore and Coal Berth (IOCB)
The berth is exclusively used by Pakistan Steel Mills and designed to accommodate ships of 75,000 DWT, however, due to channel constraints, the cargo parcel size is limited to about 55,000 tons. The permissible LOA is 225 m and beam is 40 m. Current depth alongside is 12.8 m. The berth is connected to a stockyard by a 4.5 km conveyor belt system and has two unloaders (grab gantry cranes) with a rated capacity of 600 tons/hour per unloader (total is 1,200 tons/hour).
Qasim International Container Terminal (QICT)
The berth is situated at Nos. 5 to 7 of the marginal wharf including a 400 m back up space. Total berth length is 600 m with a width of 32.8 m and a water depth of 12.0 m. Therefore, the permissible dimensions of vessels are 245 m LOA, 32.25 m beam and 11.0m draft. The total terminal area is about 240,000 m2, with a stacking area of about 195,000 m2. Cargo handling operations within the terminal are performed by the terminal’s own staff. The major shipping lines using the QICT terminal are: Maersk Sealand, NSCSA, PONL and TSK.
FOTCO Oil Terminal
The berth is designed to accommodate vessels up to 75,000 DWT but due to the limited channel depth, the maximum draft of vessels is 11.0 m. Vessel size of up to 245 m LOA and 40 m beam are permitted. Current depth alongside is 12.0 m. The cargo loading/unloading facilities consist of two 16-inch marine loading arms. The cargo pipeline supplies the onshore terminal point about 4 km from the berth.
Engro Vopak Terminal
The berth was constructed in 1997 and is 11.0 m in depth. Cargo handling is carried out by loading arms or hoses depending on the cargo. The berth is connected to the storage area by a causeway of 2 km, with pipelines for various chemicals and LPG running along the trestle.
2.4.2 Port Transport
(1) Cargo Handling Volume
Table 2.4.7 summarizes the total cargo volume and annual increase rate from 1991/92 to 2003/04 at the ports of Karachi and Qasim. Exports and imports of general cargo have been increasing at high growth rates. The annual growth rate of exports is higher than that of imports.
Table 2.4.7 Cargo Handling Volume at the Ports of Karachi and Qasim
Handling Volume (000’ tons) Annual Growth Rate (%) 1991/92 1993/94 1998/99 2003/04 1991-04 1993-04 1998-04
Import General Cargo 3,821 4,111 5,884 11,191 9.4 10.5 13.7 Dry Bulk Cargo 7,090 6,810 7,129 6,377 -0.9 -0.7 -2.2 Liquid Bulk Cargo 10,706 13,455 17,642 15,824 3.3 1.6 -2.2 Total Import 21,618 24376 30,655 33,391 3.7 3.2 1.7 Export General Cargo 2,872 2,736 3,233 6,647 7.2 9.3 15.5 Dry Bulk Cargo 1,474 855 2,189 976 -3.4 1.0 -14.9 Liquid Bulk Cargo 1,648 2,102 2,512 2,411 3.2 1.8 -0.8 Total Export 5,993 5,633 7,935 10,034 4.4 5.9 4.8 Total (Imp+Exp) 27,611 30,009 38,590 43,425 3.8 3.8 2.4 Source: JICA Study Team

Pakistan Transport Plan Study in the Islamic Republic of Pakistan (PTPS)
2-63
a) Karachi Port Figure 2.4.4 shows the cargo tonnage handled by type of cargo at Karachi port for 1991/92 through to 2003/04. During this period the total port traffic increased from 20.5 million tons in 1991/92 to 27.8 million tons in 2003/04. Traffic at the port has been predominately imports with 21.7 million tons of imports in 2003/04 accounting for 78.1% of total traffic.
0
5,000
10,000
15,000
20,000
25,000
1991
-92
1992
-93
1993
-94
1994
-95
1995
-96
1996
-97
1997
-98
1998
-99
1999
-00
2000
-01
2001
-02
2002
-03
2003
-04
'000 tonnes
General Cargo (Import) Dry Bulk (Import)Liquid Bulk (Import) Total (Import)
0
5,000
10,000
15,000
20,000
25,000
1991
-92
1992
-93
1993
-94
1994
-95
1995
-96
1996
-97
1997
-98
1998
-99
1999
-00
2000
-01
2001
-02
2002
-03
2003
-04
'000 tonnes
General Cargo (Export) Dry Bulk (Export)Liquid Bulk (Export) Total (Export)
Figure 2.4.4 Cargo Handled at the Port of Karachi
Imported Cargoes
There has been a significant difference in the growth of general cargo, dry bulk, and liquid bulk within imports.
As can be seen from Table 2.4.8, imported general cargo reached 7.1 million tons in 2003/04 up from 3.8 million tons in 1991/92 and 4.5 million tons in 1998/99. This represents annual increase rates of 5.3%, 5.6% and 9.3% from 1991/92 to 2003/04, 1993/94 to 2003/04 and 1998/99 to 2003/04 periods, respectively.
Dry bulk dropped from 1.9 million tons in 1991/92 to 1.8 million tons in 1998/9, however it then rapidly increased to 2.9 million in 2003/04 on the strength of an annual average increase rate of 10.7%.
Liquid bulk steadily increased from 9.6 million tons in 1991/92 to 12.0 million tons in 1998/99, however, fell to 11.7 million tons in 2003/04. Diesel and other oils rapidly increased to 3.6 million tons in 2003/04 from 0.7 million tons in 1991/92. However, crude oil and fuel oil decreased from 8.4 million tons in 1991/92 to 7.5 million tons in 2003/04 and from 1.1 million tons in 1991/92 to 265 thousand tons in 2003/04.
Exported Cargo
The total exported cargo at Karachi port marginally increased from 5.2 million tons in 1991/92 to 6.4 million tons in 2001/02, however, exports were down slightly in 2003/04 at 6.1 million tons.
Exported general cargo registered 2.9 million tons in 2003/04 or 48.1% of total export, which is basically unchanged from the approximately 3.0 million tons recorded in 1991/92.
The handling volume of rice reached 761 thousand tons in 2003/04 and accounted for 81.2% of dry bulk exports.
Molasses exports reached 1.5 million tons in 2003/04, accounting for 68.7% of total liquid bulk exports. Naphtha and petroleum products registered 695 thousand tons in 2003/04, accounting for 31.3% of liquid bulk exports.

Pakistan Transport Plan Study in the Islamic Republic of Pakistan (PTPS)
2-64
b) Qasim Port Figure 2.4.5 shows the cargo tonnage handled by type of cargo at Qasim port for 1991/92 through to 2003/04. During this period, total port traffic rapidly increased from 7.2 million tons in 1991/92 to 15.6 million tons in 2003/04 with an annual increase rate of 6.7%. Traffic at the port has been predominately imports, with 2003/04 imports of 11.7 million tons accounting for 74.7% of total traffic.
0
2,000
4,000
6,000
8,000
10,000
12,000
14,000
1991
-92
1992
-93
1993
-94
1994
-95
1995
-96
1996
-97
1997
-98
1998
-99
1999
-00
2000
-01
2001
-02
2002
-03
2003
-04
'000 tonnesGeneral Cargo (Import) Dry Bulk (Import)Liquid Bulk (Import) Total (Import)
0
2,000
4,000
6,000
8,000
10,000
12,000
14,000
1991
-92
1992
-93
1993
-94
1994
-95
1995
-96
1996
-97
1997
-98
1998
-99
1999
-00
2000
-01
2001
-02
2002
-03
2003
-04
'000 tonnesGeneral Cargo (Export) Dry Bulk (Export)Liquid Bulk (Export) Total (Export)
Figure 2.4.5 Cargo Handled at the Port of Qasim
Imported Cargoes
As can be seen from Table 2.4.9, total imports rapidly increased from 6.4 million tons in 1991/92 to 13.4 million tons in 1999/00, however, decreased to 11.7 million tons in 2003/04. This represents an annual increase rate of 5.2%, 5.6% and -1.1% from 1991/92 to 2003/04, 1993/94 to 2003/04 and 1998/99 to 2003/04 periods.
Dry bulk cargo steadily increased from 5.2 million tons in 1991/92 to 8.4 million tons in 1997/98, however, decreased to 7.6 million tons in 2003/04. General cargo makes up 35.4% of the total imported cargo and has rapidly increased from 16 thousand tons in 1991/92 to 4.1 million tons in 2003/04 with an annual increase rate of 58.8%. Liquid bulk rapidly increased from 1.1 million tons in 1991/92 to 7.1 million tons in 1999/00, however, decreased to 4.1 million tons in 2003/04. Edible oils rapidly increased from 19 thousand tons in 1992/93 to 1.4 million tons in 2003/04.
Exported Cargo
Total exports at Qasim port in 2003/04 reached 4.0 million tons with an annual growth rate of 14.2% from 1991/92 through 2003/04. Of this total 3.7 million tons or 94.2% were general cargo.

Pakistan Transport Plan Study in the Islamic Republic of Pakistan (PTPS)
2-65
Table 2.4.8 Cargo Handled at the Port of Karachi Unit:000'ton
1991/92 1992/93 1993/94 1994/95 1995/96 1996/97 1997/98 1998/99 1999/00 2000/01 2001/02 2002/03 2003/04IMPORTBULKCARGOCement 7 45 89 301 24 0 0 0 0 7 0 0 0Fertilizer 832 1,154 1,433 568 1,291 1,738 1,073 1,563 1,158 981 1,060 1,278 1,281RockPhosphate 314 280 276 251 320 183 165 162 286 294 322 307 324IronScrap 596 353 62 0 45 131 100 24 43 329 225 30 72Sugar 113 59 39 1 0 460 0 0 39 581 42 53 67Sulphar 23 39 26 21 11 23 15 15 29 35 8 7 15Repseeds 0 0 0 0 0 0 21 34 70 0Wheat 5 3 3 0 0 0 4 8 0 47 0Coal&Coke 0 0 0 0 0 0 0 102 299 1,126SoyaBean 0 0 0 0 0 0 0 48 87 50Bitumen 0 0 0 0 0 0 0 0 0 3Total 1,889 1,930 1,926 1,146 1,693 2,536 1,352 1,764 1,559 2,255 1,841 2,178 2,939IMPORTGENERALCARGOBamboos 1 4 2 3 0 0 0 0 0 0Dyes&Chemicals 167 172 144 162 193 172 106 128 127 100 81 117 72Jute 49 5 5 15 68 73 100 89 92 120NewsPrin- 45 49 45 25 19 22 15 10 7 2OtherPaper 46 47 42 21 23 8 10 8 19 4Timber 1 3 2 2 2 3 2 5 23 8Logs 21 16 23 21 8 13 13 12 5 12Tea 56 69 56 62 42 25 27 54 39 0 0 13 37Iron&Steel 395 399 456 544 600 387 283 389 504 655 617 634 734MotorVehicles 24 81 32 16 11 13 9 11 11 2 4 7 8Tractors 0 0 0 0 0 0 0 0 0 0RubberScrap 2 4 1 1 0 0 0 0 0 0DangerousCargo 50 52 53 49 59 44 34 36 30 21 21 11 8AfghanCargo 56 61 75 91 52 52 70 59 76 144 198 197 219OtherCargo 3,057 3,352 3,285 3,090 3,389 3,544 3,597 3,723 4,044 4,180 4,832 4,937 5,841Total 3,805 4,187 4,101 4,181 4,475 4,357 4,215 4,520 4,952 5,241 5,875 6,063 7,064IMPORTLIQUIDBULKCARGOCrudeOil *1 8,378 *1 9,454 *1 10,384 4,022 4,252 3,841 4,233 4,499 4,584 6,860 7,528 7,174 7,519Diesel&OtherOil *2 67 *2 154 *2 119 5,263 5,859 5,650 5,509 5,852 5,949 4,651 3,683 3,215 3,616FuelOil *3 1,127 *3 1,531 *3 1,081 1,559 1,448 1,240 1,205 1,016 642 615 803 648 267PalmOil 1,097 818 558 382 237 183 264 391 197 144Soyabeanoil 196 104 150 136 339 183 106 167 74 74Tallow 62 71 31 82 91 97 71 41 87 110Total 9,572 11,139 11,585 12,200 12,552 11,470 11,547 12,034 11,639 12,567 12,614 11,395 11,730TotalImports 15,266 17,255 17,611 17,526 18,719 18,362 17,114 18,318 18,149 20,063 20,330 19,637 21,732EXPORTBULKCARGOFertilizer 0 0 0 0 0 0 1 0 25 0Rice 565 436 420 990 741 1,088 1,202 1,607 1,469 1,769 1,227 904 761Steel 0 0 0 0 0 11 0 0 0 0Wheat 29 51 59 0 0 0 0 0 153 27ChoromeOre 42 44 20 19 1 0 66 43 92 91 79 70 40Sugar 18 0 0 0 27 282 0 0 0 16 30Cement *4 65 *4 51 0 14 49 16 0 3 0 0 0 2Clinker 0 0 0 6 0 0 0 0 0 42Slag 0 0 0 0 0 0 0 0 0 35Total 672 531 458 1,037 806 1,196 1,317 1,932 1,574 1,861 1,306 1,168 936EXPORTGENERALCARGOCotton 320 156 85 30 231 13 60 2 75 116 35 36 18CottonYarn 240 211 251 257 237 223 43 72 165 113 128 91 54Cowdung 143 199 186 85 4 0 0 0 0 0 0 0 0FoodGrain 0 0 0 0 0 0 0 0 0 0GuwerMeal/OilCake 37 64 24 16 9 22 13 12 7 11Leather(hide&skin) 4 3 3 2 2 5 5 5 5 4RiceBran 5 0 6 0 0 0 0 0 0 0SportsGoods 7 10 13 5 2 5 7 8 6 4Textiles 212 199 266 285 294 326 119 141 289 275 332 277 227OtherCargo 1,952 2,213 1,948 1,966 2,087 2,193 2,415 1,450 1,601 2,031 2,189 2,680 2,606Total 2,866 2,978 2,736 2,677 2,930 2,802 2,659 1,678 2,162 2,559 2,709 3,101 2,924EXPORTLIQUIDBULKCARGOMolasses 1,081 1,013 1,614 1,701 1,027 1,049 1,517 2,070 1,718 1,128 1,734 1,292 1,525PeroliumProduct 217 125 151 18 6 3 0 2 29 79 285 50 79Naptha *5 350 *5 267 101 64 30 21 21 111 283 321 659 616Oil(ForBunkers) 37 30 34 56 32 17 9 6 2 0Total 1,648 1,406 1,764 1,857 1,126 1,115 1,594 2,125 1,876 1,499 2,346 2,004 2,221TotalExports 5,186 4,914 4,959 5,572 4,862 5,113 5,570 5,735 5,612 5,918 6,362 6,273 6,081Total(Imp+Exp) 20,452 22,170 22,570 23,098 23,581 23,476 22,685 24,053 23,761 25,982 26,692 25,909 27,813
Note;*1:Crudeoil,diesel,fueloil,etc*2:LPG,kerosene,etc.*3:Edibleoils*4:Cementandclinker*5:Crudeoil Source: KPT

Pakistan Transport Plan Study in the Islamic Republic of Pakistan (PTPS)
2-66
Table 2.4.9 Cargo Handled at the Port of Qasim Unit:000'ton
1991/92 1992/93 1993/94 1994/95 1995/96 1996/97 1997/98 1998/99 1999/00 2000/01 2001/02 2002/03 2003/04DRYIMPORTSWheat 2,215 2,866 1,686 2,526 2,031 2,541 4,243 3,228 2,050 125 256 132 66Phosphate 0 28 0 0 0 0 0 0 0 0 52 436 463Urea 338 317 27 26 82 0 0 0 0Sugar 12 12 0 0 0 211 7 0 0 440 0 0 0Pulses 0 122 25 65 112 0 0 0 0 27 43 0 0Cement 0 18 89 0 0 0 0 0 0Jute 0 0 17 35 66 88 91 10 9 0 0 0 0PigIron 0 0 0 0 0 112 0 0 0Live-stock(Innumber 0 0 0 0 25 44 0 0 29 0 0 0 0MobileUnits(Innumb 0 0 0 8 3 0 0 0 0IronOre 1,623 1,701 2,032 1,653 1,793 1,322 1,776 1,196 1,623 1,763 1,604 1,543 1,770Coal 985 1,044 1,007 1,114 1,030 845 1,084 915 957 1,056 913 1,032 1,139Mang.Ore 30 0 0 0 28 22 24 16 26 26 64 37 0GeneralCargo 16 0 10 4 11 168 1,124 1,364 1,659 1,532 1,917 2,878 4,127Sub-Total 5,218 6,109 4,894 5,431 5,180 5,352 8,350 6,729 6,352 4,969 4,849 6,058 7,565LIQUIDIMPORTSFurnaceOil 1,103 1,345 1,704 2,280 3,256 3,802 4,665 4,115 5,502 4,664 3,611 3,775 702Chemicals 31 16 17 19 30 72 126 370 669 762 562 560 930EdibleOil 0 19 115 218 326 716 787 1,094 873 1,075 1,040 1,101 1,355CarbonOil 0 0 0 0 0 0 0 0 0 7 5 19 167LPG 0 10 35 58 49 25 23 28 12 0 11 8 20HSD 0 0 0 0 0 0 0 0 0 496 1,004 734 920Sub-Total 1,134 1,390 1,871 2,575 3,662 4,615 5,602 5,608 7,056 7,004 6,233 6,197 4,094DRYEXPORTSWheat(Re-exp) 0 0 0 0 0 0 0 0 0 35 689 963 19Wheat 0 0 0 0 0 0 0 0 0 0 0 0 0PigIron 0 0 0 0 0 0 0 0 0 0 0 0 0Coke 28 0 0 18 20 11 0 0 0 0 0 0 0Rice 774 404 339 556 527 206 52 96 108 98 0 0 0Cotton 0 0 0 0 0 0 0 0 0 0 0 0 0Sugar 0 0 88 284 4 0 49 161 0 0 0 12 13SteelBillets 0 0 0 0 0 0 0 0 0 0 0 0 0HRSCoils/SteelPipes 0 0 0 0 0 0 0 0 0 4 0 0 0Fertilizer(Urea) 0 0 0 23 10 0 0 0 60 63 37 13 0Cowdung 0 0 0 0 0 0 0 0 0 0 0 0 0Cement 0 0 0 0 0 16 0 0 68 0 0 0 8GeneralCargo 6 0 0 7 0 1 1,164 1,555 1,603 1,548 1,649 2,602 3,723Sub-total 807 404 427 888 561 235 1,265 1,813 1,839 1,748 2,375 3,590 3,763LIQUIDEXPORTSCrudeOil 0 158 248 300 274 456 221 387 335 430 475 302 183Molasses 0 0 0 11 0 0 0 0 0 21 19 0 7FurnaceOil(Re-Exp) 0 0 0 1 0 0 0 0 0 0 0 0 0Sub-Total 0 158 248 312 274 456 221 387 335 451 494 302 190GRANDTOTAL 7,159 8,061 7,440 9,197 9,649 10,614 15,438 14,537 15,553 14,173 13,952 16,146 15,620
Source: PQA

Pakistan Transport Plan Study in the Islamic Republic of Pakistan (PTPS)
2-67
(2) Container Traffic
Table 2.4.10 and Table 2.4.11 show the annual container movements at the ports of Karachi and Qasim for 1997/98 through to 2003/04. In 2003/04, there were 1.2 million TEUs movements at the two ports, of which 1.0 million TEUs, or nearly 80.9% of the total were full container movements,.
a) Karachi Port Container traffic has been a growing component of port traffic between 1997/98 and 2003/04. In 2003/04 824,753 TEUs were handled which is more than 1.6 times the 505,287 TEUs handled in 1997/98.
During the 1997/98 to 2003/04 period, container traffic has increased at an annual average rate of 8.5%. Container traffic has been roughly balanced between import and export movements.
The share of empty containers for imports and exports in 2003/04 was 6.5% and 37.2%, respectively. The cargo volume for a loaded import and export container in 2003/04 was 14.5 ton/TEU and 13.8 ton/TEU respectively.
Table 2.4.10 Container Traffic at the Port of Karachi 1997/98 1998/99 1999/00 2000/01 2001/02 2002/03 2003/04Import Empty Container
20 ft. 16,719 17,618 13,959 17,618 18,163 14,403 12,075 40 ft. 10,827 7,702 16,700 21,045 15,340 10,221 8,105 TEU 38,373 33,022 47,359 59,708 48,843 34,845 28,285
Loaded Container 20 ft. 118,951 130,181 113,174 146,107 155,961 164,221 190,350 40 ft. 50,960 56,744 62,537 65,456 83,911 92,890 109,418 TEU 220,871 243,669 238,248 277,019 323,783 350,001 409,186
Cargo volume (ton) 3,259,497 3,680,440 4,031,331 4,250,090 4,942,097 5,125,277 5,943,115 Total (TEU) 259,244 276,691 285,607 336,727 372,626 384,846 437,471 Export Empty Container
20 ft. 27,695 28,034 33,164 34,821 38,228 38,039 65,011 40 It. 10,125 17,477 20,480 10,856 22,083 28,040 39,451 TEU 47,945 62,988 74,124 56,533 82,394 94,119 143,913
Loaded Container 20 ft. 101,330 106,988 115,355 118,640 124,280 129,891 116,715 40 ft. 48,384 39,738 55,714 68,698 68,296 67,877 63,327 TEU 198,098 186,464 226,783 256,036 260,872 265,645 243,369
Cargo volume (ton) 2,625,490 2,642,251 2,989,347 3,329,883 3,523,639 3,652,708 3,359,051 Total (TEU) 246,043 249,452 300,907 312,569 343,266 359,764 387,282 Grand Total (TEU) 505,287 526,143 586,514 649,296 715,892 744,610 824,753 Source: KPT
b) Qasim Port Container traffic has rapidly increased since 1997/98, when the operation of QICT commenced.
During the period from 1997/98 to 2003/04, container traffic increased from 132,743 TEUs in 1997/98 to 421,369 TEUs in 2003/04 at an annual average increase rate of 21.2%. In a similar manner to the Karachi port, container traffic has been roughly balanced between import and export movements. The percentage of empty import and export containers in 2003/04 was 16.6% and 14.7%, respectively. Qasim port has prepared the annual container movements, however the cargo volume of loaded container has not been recorded.

Pakistan Transport Plan Study in the Islamic Republic of Pakistan (PTPS)
2-68
Table 2.4.11 Container Traffic at the Port of Qasim 1997/98 1998/99 1999/00 2000/01 2001/02 2002/03 2003/04Import
EmptyContainer 20ft. 9,625 12,654 9,621 6,172 4,518 13,009 7,03640ft. 11,629 11,828 12,989 11,992 11,702 14,227 13,126TEU 32,883 36,310 35,599 30,156 27,922 41,463 33,288
LoadedContainer 20ft. 12,540 12,261 11,523 13,258 17,506 39,500 65,29940ft. 9,416 12,214 11,524 10,881 15,688 28,440 51,225TEU 31,372 36,689 34,571 35,020 48,882 96,380 167,749
Total(TEU) 64,255 72,999 70,170 65,176 76,804 137,843 201,037Export
EmptyContainer 20ft. 773 880 812 1,248 623 5,733 11,07940It. 963 2,111 2,338 674 1,432 2,859 10,692TEU 2,699 5,102 5,488 2,596 3,487 11,451 32,463
LoadedContainer 20ft. 25,157 34,521 31,444 29,580 29,600 51,156 65,76940ft. 20,316 25,994 28,964 28,743 31,802 45,659 61,050TEU 65,789 86,509 89,372 87,066 93,204 142,474 187,869
Total(TEU) 68,488 91,611 94,860 89,662 96,691 153,925 220,332GrandTotal(TEU) 132,743 164,610 165,030 154,838 173,495 291,768 421,369Source:QPA
c) Containerized Ratio at Karachi Port Table 2.4.12 shows the containerized ratio at Karachi port. 9.3 million tons of cargo was handled in containers in 2003/04, accounting for 84.9% of the port's total general cargo traffic and other cargo.
Table 2.4.12 Containerized Ratio at Karachi Port (Million Tons/Year)
1997/98 1998/99 1999/00 2000/01 2001/02 2002/03 2003/04Import Containerizable Cargo 4.33 4.56 5.06 6.19 6.20 6.24 7.27 Containerized Cargo 3.26 3.68 4.03 4.25 4.94 5.13 5.94 Containerization (%) 75.3 80.7 79.6 68.7 79.7 82.1 81.7 Export Containerizable Cargo 3.86 3.28 3.63 4.33 3.94 4.00 3.68 Containerized Cargo 2.63 2.64 2.99 3.23 3.52 3.65 3.36 Containerization (%) 68.0 80.4 82.3 77.0 89.5 91.2 91.2 Total Containerizable Cargo 8.19 7.84 8.69 10.51 10.13 10.25 10.96 Containerized Cargo 5.88 6.32 7.02 7.58 8.47 8.78 9.30 Containerization (%) 71.8 80.6 80.8 72.1 83.5 85.7 84.9 Source:KPT

Pakistan Transport Plan Study in the Islamic Republic of Pakistan (PTPS)
2-69
(3) Vessels Calling at the Ports
a) Karachi Port According to the KPT's classification, vessels calling at the port of Karachi are divided into four types; general cargo vessels, oil tankers, dry bulk carriers, and container vessels as shown in Figure 2.4.6. According to the actual records in 2003/04 around 1,500 vessels called at the port. Almost half (50.7%) or 783 of the vessels that called the port were container vessels. Oil tankers and general cargo vessels followed, accounting for 27.1% (418 vessels) and 11.9% (184 vessels), respectively. In terms of the volume of cargoes handled at the port, the oil tankers accounted for 50.2% of the total volume, and container vessels, dry bulk carriers and general cargo vessels accounted for 33.4%, 13.9% and 2.5% respectively.
0100200300400500600700800900
1000
1990/00 2000/01 2001/02 2002/03 2003/04
Year
No.
of S
hips
General Cargo Dry Bulk Carrier Oil Tanker Container
Source: KPT
Figure 2.4.6 Number of Vessels Calling at the Port of Karachi
b) Qasim Port The vessels calling at the port of Qasim are classified by the terminal in the port statistics as Marginal Wharf (general cargo and others), IOCB (dry bulk carrier), FOTOCO Terminal (oil tanker), ENGRO Terminal (dry and liquid bulk carrier) and QICT (container) as shown in Figure 2.4.7.
There were 806 vessels calling at the port in 2003/04. Vessels of QICT (container vessels) accounted for 47.9% (386 vessels) of the total number. In terms of the volume of cargoes handled at port, the container carriers and liquid bulk accounted for 45.6% and 27.4% respectively. Iron and coal carriers accounted for 18.6%.
050
100150200250300350400450
1990/00 2000/01 2001/02 2002/03 2003/04Year
No.
of S
hips
Marginal Wharf
IOCB (Dry Bulk Carrier)
FOTCO (Oil Tanker)
Engro (Dry and LiquidBulk Carrier)
QICT (Container)
Source: PQA
Figure 2.4.7 Number of Vessels Calling at the Port of Qasim

Pakistan Transport Plan Study in the Islamic Republic of Pakistan (PTPS)
2-70
(4) Waiting Time for Berthing
a) Karachi Port According to the KPT's records in 2003/04 the average waiting time for general cargo vessels, fertilizer and rice carriers reached 21.6 hours per ship, 20.2 hours per ship and 37.2 hours per ship. While crude oil, HSD oil and Naphtha carriers reached 34.7 hours per ship, 30.3 hours per ship and 56.4 hours per ship respectively. Container vessels had an average waiting time of 18.1 hours per ship. Remaining vessels, except Palm Oil and Molasses carriers, kept within 40.0 hours per ship as shown in Figure 2.4.8.
0.0
40.0
80.0
120.0
Gen
eral
Car
go
Cont
aine
r
Ferti
lizer
Ric
e
Roc
k Ph
osph
at
Soya
Bea
n
Cru
de O
il
Gas
Oil
HSD
Oil
Mol
asse
s
Nap
htha
Palm
Oil
Soya
bean
Oil
Tallo
w O
il
hour
s/sh
ip
Source: KPT
Figure 2.4.8 Vessel Waiting Time at the Port of Karachi (per ship)
b) Qasim Port According to records, in 2003/04 the average waiting time for the iron ore carriers reached 100.7 hours per ship, which is the longest waiting time at the Qasim port. Wheat carriers (Marginal Wharf), HSD oil carriers (FOTOCO Terminal) and general cargo vessels (Marginal Wharf) followed the iron ore carriers, accounting for 69.8, 48.3 and 33.4 hours per ship respectively. Container vessels had an average waiting time of 12.4 hours per ship, which was shorter than at Karachi port despite the long navigation channel as shown in Figure 2.4.9.
0.0
40.0
80.0
120.0
Gen
eral
Car
go (M
. Wha
rf)
Che
mic
als (
M. W
harf
)
Car
bon
Oil
(M. W
harf
)
Edib
le O
il (M
. Wha
rf)
Whe
at (M
. Wha
rf)
Con
tain
er (Q
ICT)
Coa
l (IO
CB
)
Iron
Ore
(IO
CB
)
IOC
B
Cru
de O
il (F
OTC
O)
HSD
Oil
(FO
TCO
)
LPG
(EN
GR
O)
Chem
ical
s (EN
GR
O)
hour
s/sh
ip
Source: PQA
Figure 2.4.9 Vessel Waiting Time at the Port of Qasim (per ship)

Pakistan Transport Plan Study in the Islamic Republic of Pakistan (PTPS)
2-71
(5) Utilization of Berths
a) Karachi Port The utilization of berths at the port of Karachi is classified according to vessel type, namely, general cargo vessels, container vessels, dry bulk carriers and tankers as shown in table 2.4.13.
Table 2.4.13 Utilization of Berths at the Port of Karachi
Berth Berth No.
Total Length
(m)
Actual No. of Berths
No. of Vessels
Actual Berthing
Time (hours/ship)
Actual Berthing
Time (hours)
Berth Occupancy Rate (%)
East Berth 1 - 5 815 5 230 132.5 30,474 69.6 6 - 9 604 2 121 43.6 5,271 30.1 PICT 10 - 17 1,236 8 345 125.6 43,331 61.8 Juna Bunder 18 - 19 316 2 40 159.8 6,391 36.5 Berth 20 165 1 19 157.8 2,999 34.2 21 162 1 8 216.5 1,732 19.8 22 168 1 - - - - 23 168 1 - - - - West Berth 24 - 27 702 4 196 125.9 24,674 70.4 28 - 30 567 2 333 22.2 7,395 42.2 KICT Oil Berth OP-1 - 1 114 48.6 5,545 63.3
OP-2 - 1 - - - - Under construction
OP-3 - 1 180 38.7 6,957 79.4 Note: This table was made based on the information of KPT Source: JICA Study Team
There are 27 berths used for loading and unloading dry and liquid cargoes and three oil berths. According to the several kinds of records of the cargo-handling operation in 2003/04, 25 of the 27 berths and the two oil berths were operational. The total number of ships which moored at the 25 berths and two oil berths was 1,292 and 294 respectively.
The average berthing/operation time per ship is 376.0 hours for rock phosphate carriers, 235.0 hours for fertilizer carriers and 143.6 hours for rice carriers. The average volume of cargoes handled per vessels is 67,739 tons per oil tanker, 61,288 tons per HSD oil tanker, 1,040 TEU per container vessel and 6,604 tons per general cargo vessel.
The berth occupancy rate at the port of Karachi maintained normal values in 2003/04 except for the East Berth Nos. 1 to 5, West Berth Nos. 24 to 27 and the oil berths, because OP-II is under construction and the Berth No. 1 is being utilized for oil handling on a temporary basis.
b) Qasim Port The utilization of berths at the port of Qasim is classified according to vessel type, namely, general cargo vessels including various kinds of vessels, dry bulk carriers laden with wheat, dry bulk carriers laden with iron ore and coal, and tankers as shown in Table 2.4.14. The "Marginal Wharf" is comprised of seven berths with a total length of 1,400 m. Berth Nos. 1 to 4 are used as multi-purpose terminals, while berth Nos. 5 to 7 are used for container handling by QICT. There are four private terminals.
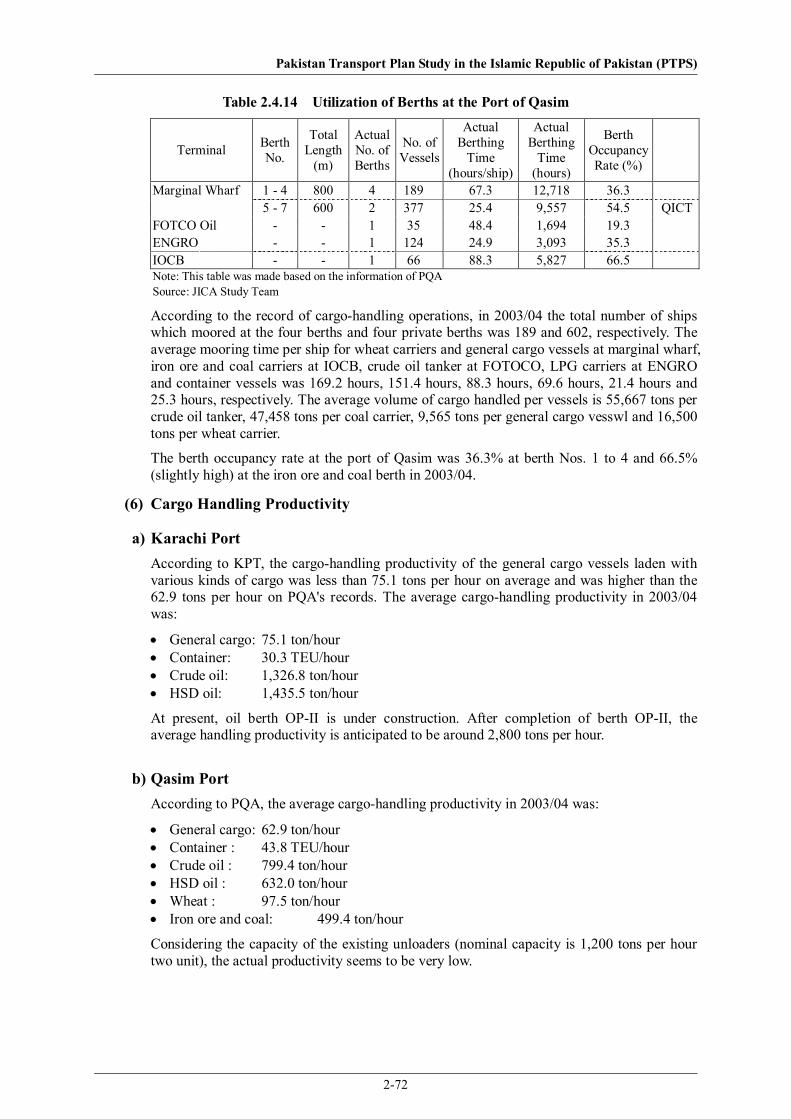
Pakistan Transport Plan Study in the Islamic Republic of Pakistan (PTPS)
2-72
Table 2.4.14 Utilization of Berths at the Port of Qasim
Terminal Berth No.
Total Length
(m)
Actual No. of Berths
No. of Vessels
Actual Berthing
Time (hours/ship)
Actual Berthing
Time (hours)
Berth Occupancy Rate (%)
Marginal Wharf 1 - 4 800 4 189 67.3 12,718 36.3 5 - 7 600 2 377 25.4 9,557 54.5 QICT
FOTCO Oil - - 1 35 48.4 1,694 19.3 ENGRO - - 1 124 24.9 3,093 35.3 IOCB - - 1 66 88.3 5,827 66.5 Note: This table was made based on the information of PQA Source: JICA Study Team
According to the record of cargo-handling operations, in 2003/04 the total number of ships which moored at the four berths and four private berths was 189 and 602, respectively. The average mooring time per ship for wheat carriers and general cargo vessels at marginal wharf, iron ore and coal carriers at IOCB, crude oil tanker at FOTOCO, LPG carriers at ENGRO and container vessels was 169.2 hours, 151.4 hours, 88.3 hours, 69.6 hours, 21.4 hours and 25.3 hours, respectively. The average volume of cargo handled per vessels is 55,667 tons per crude oil tanker, 47,458 tons per coal carrier, 9,565 tons per general cargo vesswl and 16,500 tons per wheat carrier.
The berth occupancy rate at the port of Qasim was 36.3% at berth Nos. 1 to 4 and 66.5% (slightly high) at the iron ore and coal berth in 2003/04.
(6) Cargo Handling Productivity
a) Karachi Port According to KPT, the cargo-handling productivity of the general cargo vessels laden with various kinds of cargo was less than 75.1 tons per hour on average and was higher than the 62.9 tons per hour on PQA's records. The average cargo-handling productivity in 2003/04 was:
• General cargo: 75.1 ton/hour • Container: 30.3 TEU/hour • Crude oil: 1,326.8 ton/hour • HSD oil: 1,435.5 ton/hour
At present, oil berth OP-II is under construction. After completion of berth OP-II, the average handling productivity is anticipated to be around 2,800 tons per hour.
b) Qasim Port According to PQA, the average cargo-handling productivity in 2003/04 was:
• General cargo: 62.9 ton/hour • Container : 43.8 TEU/hour • Crude oil : 799.4 ton/hour • HSD oil : 632.0 ton/hour • Wheat : 97.5 ton/hour • Iron ore and coal: 499.4 ton/hour
Considering the capacity of the existing unloaders (nominal capacity is 1,200 tons per hour two unit), the actual productivity seems to be very low.

Pakistan Transport Plan Study in the Islamic Republic of Pakistan (PTPS)
2-73
(7) Port Tariff
The present main tariff at both ports is shown in Table 2.4.15. The tariff of PQA is about 12% lower than that of KPT excluding wharfage.
Table 2.4.15 Main Tariff of KPT and PQA
Unit KPT Revised in Sept. 2004
PQA Revised in May 2005
Pilotage US$/GRT 0.15 0.13 Over 5000GRT
Haulage and Towage US$/tug/act 485 485 Mooring Fee US$ per GRT 0.05 0.04 Berthage Fee US$ per GRT 0.08 0.08
For first 24 hrs Port Dues US$ per GRT 0.40 0.32
Wharfage Import Export Import ExportBreak Bulk Rs./ton 70.00 35.00 44.00 31.00Dry Bulk Cargo Rs./ton 54.00 40.00 Wheat Rs./ton 21.00 21.00 Coal Rs./ton 44.00 40.00 34.00 34.00Crude, Diesel, Kerosene oil, Fuel Rs./1000 Litre 30.00 30.00 25.00 25.00Edible Oil Rs./1000 kg 35.00 35.00 31.00 31.00Molasses Rs./1000 kg 18.00 18.00 11.00 15.00Tractor, Tracked vehicle, etc. Rs./CBM 256.00 126.00 218.00 68.00Motor vehicle Rs./CBM 316.00 158.00 275.00 83.00Tyre, Tyre scrap, Accessories Rs./ton 316.00 158.00 275.00 275.00Food grain, fertilizer. Etc Rs./ton 25.00 25.00 21.00 17.00Food grain, flour and seed Rs./ton 21.00 17.00Fertilizer, rock phosphates ecl. Cow dung Rs./ton 14.00 14.00Container LCL Container (s)
Rs./ton x 2 Size 20 ft
Rs. 70.00 35.00 620.00 620.00
FCL Container (s) Rs./ft
Size 40 ft Rs.
90.00 35.00 1240.00 1240.00
Empty Container (s) Rs./ft
Over Size 40 ft Rs./ft
40.00 40.00 34.00 34.00 Source: The Gazette of Pakistan, KPT Tariff

Pakistan Transport Plan Study in the Islamic Republic of Pakistan (PTPS)
2-74
2.4.3 Administration of Port and Shipping Sector
(1) General
The Ministry of Ports and Shipping controls the administration of ports and shipping in Pakistan. The Director General of Ports and Shipping of MOPS is in charge of the overall administration of the various organizations related to ports and shipping. All practical works are conducted by organizations which are autonomous bodies under the control of the Director General of Ports and Shipping.
(2) The Karachi Port Trust (KPT)
KTP is based on the Karachi Port Trust Act of 1886. The highest decision-making organ is the Board of Trustees which consists of 11 members including the Chairman who is appointed by the Federal Government and other trustees are representatives of ship owners, shippers, port labours and the Government. Important matters such as the lease, sale and transfer of property, the general budget, major investments and the revision of port fees require prior approval by the Government. There are about 5,500 employees.
Figure 2.4.10 shows the organization chart of KPT.
Engineering Pl. & Develpmt. Civ. W. & Est.
Chaiman
Administration Operations Finance
Chief Secretary Manager
Gen. Manager Gen. Manager Gen. Manager
Auditor (O&M) Officer
Gen. Manager Gen. Manager Gen. Manager
Pub. RelationsOfficer
Port Intelligence
CoordinationManager
LawOfficer
Source: KPT
Figure 2.4.10 Organization Chart of KPT
At present, KPT is promoting privatization according to government policy, and the following privately operated terminals have been established:
Karachi International Container Terminal (KICT)
The terminal has been in operation since 1998 and it was originally leased out by KPT to APL, Pakistan on a BOT basis for 20 years. However, Hutchison Port Holdings have now taken over and are operating the terminal.
Pakistan International Container Terminal (PICT).
The terminal was operated by Premier Mercantile Services and was the first private terminal to be owned and operated by a Pakistani company. However, it was leased to Trustees of the Port of Karachi for 21 years commencing in June 2002.

Pakistan Transport Plan Study in the Islamic Republic of Pakistan (PTPS)
2-75
(3) The Port Qasim Authority (PQA)
PQA is based on the Port Authority Act of 1973. PQA controls the land, water area and various facilities inside the port area as prescribed by the Act. The highest decision-making organ is the Board consisting of not less than three and not more than seven members including the Chairman, who is appointed by the Government. As at the port of Karachi, PQA must obtain the prior approval of the Government concerning important matters at the Port of Qasim. PQA has approximately 1,600 employees. Figure 2.4.11 shows the organization chart of PQA.
Source: PQA
Figure 2.4.11 Organization Chart of PQA
At present, PQA is promoting privatization for the port development, and the following privately operated terminals have been established:
Iron Ore and Coal Berth (IOCB)
This berth was built by PQA and has been leased to Pakistan Steel; PQA is responsible for maintenance. IOCB commenced operation in 1980 and the equipment for unloading and transferring the ore and coal to Pakistan Steel has been installed and is maintained by Pakistan Steel. The berth has been leased to Pakistan Steel.
Qasim International Container Terminal (QICT)
The agreement was signed in 1995 between PQA and a group of companies led by P&O Ports-Australia, and QICT commenced operation in 1997. Berth Nos. 5 to 7 of the marginal wharf including a 400 m back up space has been leased to the owners of QICT on a BOO basis.
FOTCO Oil Terminal
The agreement was signed between PQA and FOTCO in 1992. The terminal was constructed on a BOO basis and the charges for a minimum of four million tons of heavy furnace oil per year have been guaranteed by the Government of Pakistan.
Director General Director General Director General Director General Director General(Technical) (Finance) (Administration) (Operations) Co-ordination
General Manager General Manager General Manager General Manager Dy. General Manager(Engineer) (Finance) (Administration) (Operations) (Establishment)
Chief Deputy General Dep. Gen. Manager Deputy General Deputy GeneralHydrographer Manager (M. Accts) (Transp. & Security) Manager (Mar. Ops) Manager (Store)
Deputy General Deputy General Deputy General Deputy General Deputy General Manager (Maint Ops) Manager (F. Accts) Manager (I.R &W) Manager (Cargo Ops) Manager (Coordination)
Deputy General Deputy General Port Facilitation Deputy GeneralManager (B.W.S.S) Manager (E&S) Officer Manager (Training)
Deputy General Manager (Mech. Maint)
Deputy General Manager (Civil Maint)
Deputy General Manager (Elect. Maint)
Deputy General Manager (M. P)
ChairmanSecretary Deputy G.M Internal Audit
Director General (P&D)
Director General Manager (I.M)
Director General Manager (I.S)
Director General Manager (P&D)
Deputy G. Manager (P.S Project)
Deputy G. Manager (Marketing &

Pakistan Transport Plan Study in the Islamic Republic of Pakistan (PTPS)
2-76
Engro Vopak Terminal
The agreement was signed between PQA and Engoro Chemicals, Pakistan and VOPAC Holland in 1998. The terminal was constructed on a BOO basis.
Therefore, only Marginal Wharf berths Nos. 1 to 4 are under direct management of PQA. Berth No.1 is being used for liquid bulk handling and berths Nos. 2 to 4 for dry bulk.
(4) Pakistan National Shipping Corporation (PNSC)
PNSC is a shipping company, whose shares are mainly held by the Federal government. At the end of the fiscal year 2003/04, the Federal government held approximately a 90% share of the PNSC.
2.4.4 Financial Situation
In the MTDF, from the fiscal year 2005/06 to the fiscal year 2009/10, an allocation of Rs.117 billion (Rs.13 billion under the public sector development programme and Rs. 104 billion under the self-financing and private sector financing programme) is envisaged for the development works of the Ports and Shipping sector. Most of the development works depend on the financial capacity of the implementing agencies and private financing.
(1) Financial Status of KPT
Table 2.4.16 shows the trend in the financial status of the KPT. According to Table 2.4.16, the KPT consistently generates a surplus every year and the financial status of the KPT is stable. In particular, the revenues generated from investment activities sustain the financial stability of the KPT. In the fiscal year 2002/03, the investment revenue was equal to 76% of the operational revenue. The operational revenue amounted to Rs. 860 million and the investment revenue amounted to Rs. 3,623 million, which accounts for approximately 84% of the total surplus.
Table 2.4.16 Trend in the Financial Status of the KPT
(Unit: Million Rs.)
FY 1998/99 1999/2000 2000/01 2001/02 2002/03 % per
Revenues(2002/03)
(1) Revenues Cargo Handling 1,487 1,608 1,709 1,847 1,854 Cargo Storage 1,660 564 455 420 480 Ship Movement & Services 1,845 1,779 2,283 2,448 2,154 Property management 155 227 217 424 275 Total 5,147 4,178 4,665 5,139 4,763 100.0%
(2) Expenses Labor 2,748 2,673 2,521 2,496 2,584 Repairs and Maintenance 308 308 344 155 153 Other Operational expenses 865 912 896 830 681 Depreciation Costs 467 417 560 526 485 Total 4,388 4,309 4,321 4,007 3,903 81.9%
(3) Operational Profits (1)-(2) 760 -131 344 1,132 861 18.1% (4) Investment Revenues etc 1,791 2,090 2,499 2,925 3,623 76.1% (5) Interest Payments 207 197 178 179 151 3.2% (6) Others* 1,783 -12 -121 1 -40 -0.8% Total Surplus (3)+(4)-(5)-(6) 4,128 1,749 2,721 4,059 4,293 90.1%
* In the fiscal year 1998/99, items of prior year adjustment are included. Source: Karachi Port Trust Financial Statements

Pakistan Transport Plan Study in the Islamic Republic of Pakistan (PTPS)
2-77
The KPT has enormous financial resources based on the surplus accumulated so far (Rs. 32.6 million at the end of the fiscal year 2002/03). This is invested in bonds issued by the Pakistan government. Table 2.4.17 shows a list of the investments at the end of the fiscal year 2002/03.
Table 2.4.17 List of Investments of the KPT
Type of Investments Amounts (Unit: Rs. Million) Rate of Profits
Federal Investment Bonds 4,234 15% per year Pakistan Investment Bonds 6,770 13-15% per year Defence Saving Certificate 5,775 8.15% per year Others 1 - Total 16,780 - Source: Karachi Port Trust Financial Statements
Table 2.4.18 shows the revenue and expenditure budget of the KPT for the fiscal year 2004/05. As shown in the table, the investment revenue is estimated to be nearly Rs. 4 billion, which equates to 77% of the ordinary revenues.
Table 2.4.18 Budget of the KPT (2004/05)
Items Rs. Millions % per Revenues
(1) Revenues Cargo Handling 2,295 44.9% Ship Movement and Services 1,962 38.4% Cargo Storage 578 11.3% Property Management 278 5.4% Total 5,113 100.0% 100.0%
(2) Expenditures Labor 2,497 51.4% Outsourcing of Repairs and Maintenance 717 14.8% Others 1,645 33.9% Total 4,859 100.0% 95.0%
(3) Operating Surplus (1)-(2) 254 5.0% (4) Investment Revenues 3,935 77.0% (5) Total Surplus (3)+(4) 4,189 81.9% Sources: Prepared by JICA Study Team with Data from World Bank
Based on the financial resources of the KPT, it is envisaged that there may not be any financial hazards in the development of Karachi Port.
(2) Financial Status of the PQA
In the MTDF, from the fiscal year 2005/06 to 2009/10, more than Rs.23 billions in investments is envisaged for Qasim Port, which includes Rs.13.5 of investments to be procured by private financing. In order to attract private investors, the profitability of the business in Qasim Port business is important. Table 2.4.19 shows the trend in the financial status of the PQA.

Pakistan Transport Plan Study in the Islamic Republic of Pakistan (PTPS)
2-78
Table 2.4.19 Trend in Financial Status of the PQA (Unit: Million Rs.)
FY 1999/00 2000/01 2001/02 2002/03 2003/04 (1) Revenues Operational Income 1,509 1,570 1,768 1,730 1,924 Other Income 221 181 196 251 250 Total 1,730 1,751 1,964 1,981 2,175 (2) Costs Salaries etc 382 442 529 561 548 Administration Costs 189 222 215 224 261 Maintenance Costs 197 542 332 547 287 Depreciation Costs 119 113 118 111 130 Others 4 68 297 86 48 Total 891 1,387 1,491 1,529 1,274 (3) Operating Surplus (1)-(2) 840 365 473 451 901 (4) Other Revenues 259 309 307 247 179 (5) Other Charges 113 7 55 -125 -10 (6) Net Surplus (3)+(4)-(5) 986 666 725 822 1,089
Source: Qasim Port Authority Financial Statements
The operational surplus of the PQA is stable, and the business related to the operation of Qasim Port seems profitable. According to Table 2.4.19, the PQA have continuously created a surplus in recent years. The PQA accumulated a financial surplus amounting to nearly Rs. 5 billion at the end of the fiscal year 2003/04. Consequently, the profitability of the Qasim Port business is likely to attract investors, and it is envisaged that there may not be any financial hazards in the development of the Qasim Port.
(3) Financial Status of PNSC
In the MTDF, from the fiscal year 2005/06 to 2009/10, an allocation of Rs.12 billion for development works is assumed to be funded by the PNSC. Therefore, the financial status of the PNSC is extremely important for the development of the shipping sector. Table 2.4.20 shows the trend in the financial status of the Pakistan National Shipping Corporation (PNSC).
Table 2.4.20 Trend in the Financial Status of the PNSC
(Unit: Million Rs.)FY 1999/2000 2000/01 2001/02 2002/03 2003/04 Operational Revenues 3,540 5,459 4,625 3,631 2,736 Operational Expenses 3,839 5,014 4,012 2,785 2,041 Operational Profits -299 445 613 846 695 Other Income 127 216 234 124 1,424 Other Expenses 316 915 344 234 254 Profit before Taxation -489 -254 503 736 1,866 Taxation 94 45 172 269 232 Profit after Taxation -582 -300 330 467 1,634 Source: Pakistan National Shipping Corporation Annual Report 2004
Up until the fiscal year 2000/01, the PNSC continually suffered from losses. However, in the fiscal year 2001/02, the PNSC reformed its business. One of the biggest changes was to discard unprofitable routes and concentrate its business resources on the profitable routes. With this reform, the PNSC began to make a profit from 2001/02. Subsequently, in the fiscal year 2003/04, the PNSC recorded a profit of Rs. 1.6 billion. Therefore, it is envisaged that there may not be any financial hazards in the development of the shipping sector under the current financial situation in the PNSC.
Pakistan Transport Plan Study in the Islamic Republic of Pakistan (PTPS)
2-79
2.4.5 Issues and Problems
In this section, the problem areas in the existing handling systems at the ports are identified together with a preliminary assessment of overall performance.
(1) Karachi Port
• According to the KPT's records in 2003/04 the berth occupancy ratio maintained normal values. However, two berths, Nos. 22 and 23, were not used for cargo handling, despite the limited available space within the existing port area. Effective utilization of the existing facilities is required.
• At Karachi port, various kinds of cargo are being handled at conventional berth (except at berths Nos. 6 to 9 (PICT) and 28 to 30 (KICT)). This includes general cargo, fertilizer, rice, phosphate and scrap. The dry bulk carriers are being forced to moor for a long time at the berths due to the low cargo-handling productivity. Therefore, it is necessary to provide specialized dry bulk handling facilities.
(2) Qasim Port
• Berth Nos. 2, 3 and 4 handle dry bulk cargo such as wheat, coal, sugar, and fertilizer. The major import is wheat, of which 1.1 million tons was handled in 2002/03. However, Qasim port does not yet have a specialized terminal for the handling of wheat and this fact is one of the main reasons for the long period of waiting and mooring times. Therefore, it is necessary to provide specialized dry bulk handling facilities.
• There is a restriction on night navigation at the Qasim port due to navigation facilities. Currently, vessels of LOA 202 m can be accommodated during the night on a request basis. Therefore, it is necessary to develop the navigation system as soon as possible.
(3) Both Ports
• Neither port has introduced an EDI system. The computer system of both ports covers only management of vessel arrivals an departures but does not cover other operation and management works such as operation at conventional and container terminals. However, some shipping lines have already developed their own world-wide computer systems. The computer system is competent for processing statistics, however, neither port has fully utilized the potential of their systems. With regard to statistics, the present system covers only vessel statistics but these are not compiled periodically or systematically. Cargo statistics are not compiled at all.
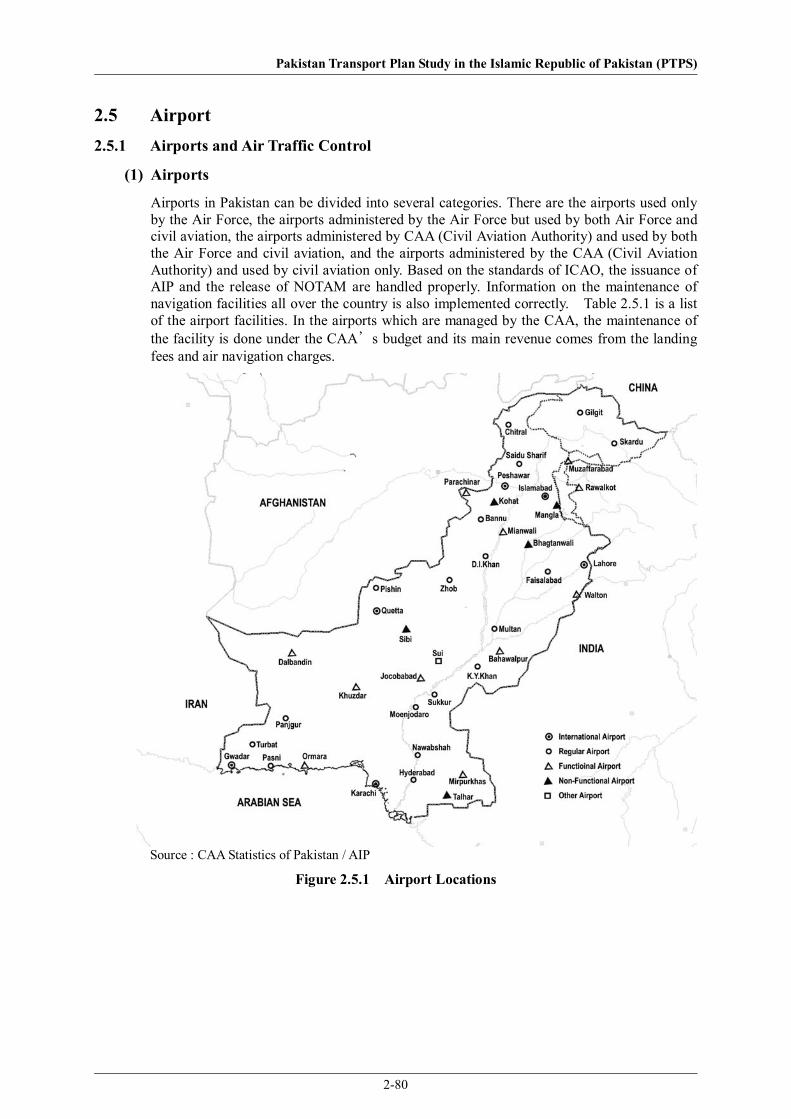
Pakistan Transport Plan Study in the Islamic Republic of Pakistan (PTPS)
2-80
2.5 Airport 2.5.1 Airports and Air Traffic Control
(1) Airports
Airports in Pakistan can be divided into several categories. There are the airports used only by the Air Force, the airports administered by the Air Force but used by both Air Force and civil aviation, the airports administered by CAA (Civil Aviation Authority) and used by both the Air Force and civil aviation, and the airports administered by the CAA (Civil Aviation Authority) and used by civil aviation only. Based on the standards of ICAO, the issuance of AIP and the release of NOTAM are handled properly. Information on the maintenance of navigation facilities all over the country is also implemented correctly. Table 2.5.1 is a list of the airport facilities. In the airports which are managed by the CAA, the maintenance of the facility is done under the CAA’s budget and its main revenue comes from the landing fees and air navigation charges.
Source : CAA Statistics of Pakistan / AIP
Figure 2.5.1 Airport Locations

Pakistan Transport Plan Study in the Islamic Republic of Pakistan (PTPS)
2-81
Table 2.5.1 Airport Condition and Facilities in Pakistan
2002-03 District Airport Aircraft
Movement Passenger Cargo (t.)Admini-strative Category Runway
(m) Navigation Facilities
Quetta 2,480 239,425 1,346 JF I 3,658 X 46 NDB, VOR Gwadar 1,827 45,956 81 C I 1,524 X 23 NDB Jiwadar C R 1,783 X 46 Jiwani C F 1,783 X 46 NDB, VOR Khuzdar C F 1,829 X 30 NDB Panjgur 346 7,147 32 C R 1,524 X 23 NDB, VOR Pasni JC R 2,743 X 46 NDB Sui 198 7,907 7 P P 1,524 X 46 Turbat 1,323 30,131 1 C R 1,829 X 30 NDB Zhob 54 994 C R 1,829 X 30 NDB, VOR Dalbandin JC F 1,524 X 25 Ormara C F 1,524 X 23 NDB
Balochistan
Sibi N 1,829 X 23 Karachi 44,005 4,870,544 166,202 C I 3,200 X 60 ILS,VOR,NDB2nd R/W 3,400 X 60 Hyderabad C R 2,133 X 31 Moenjodaro 698 14,234 11 C R 1,981 X 30 NDB Nawabshah 8 - JC R 2,743 X 46 NDB, VOR Sukkur 2,179 84,092 222 JC R 2,743 X 30 NDB Jacobabad 286 2,860 4 JF F 3,048 X 31 Mipur Khas JF F 3,048 X 46
Sindh
Talhar N 2,743 X 23 Islamabad 20,418 2,556,483 41,286 JF I 3,292 X 46 ILS,VOR,NDBLahore 24,641 2,714,246 76,341 JC I 3,360 X 46 ILS,VOR,NDB2nd R/W 2,743 X 46 Faisalabad 1,934 147,789 1,239 JC R 2,826 X 46 ILS,NDB Multan 4,420 231,131 1,484 JC R 2,743 X 30 ILS,VOR,NDBMianwali JF F 3,048 X 46 Bahawarpur 910 24,187 16 C F 2,850 X 30 R.Y.Khan 1,060 38,170 C R 3,000 X 45 NDB, VOR Bhagtanwala N 1,920 X 46 Mangla N 1,524 X 31
Punjab
D.G.Khan C R 1,981 X 30 NDB Peshawar 7,948 729,599 10,406 JF I 2,743 X 46 NDB, VOR Chitral 673 23,806 45 C R 1,768 X 31 D.I.Khan 118 1,447 2 C R 1,524 X 23 NDB, C-VORSaidu Sharif C R 1,829 X 46 NDB Bannu C R 1,829 X 30 NDB Kohat JF F 2,352 X 46
North West Frontier
Parchinar N 1,219 X 23 Gilgit 760 26,670 31 C R 1,646 X 30 NDB Skardu 266 24,080 222 JC R 1,981 X 30 NDB Muzaffarabad C F 914 X 23 NDB
Northern Area
Rawalakot C F 914 X 23 NDB Administrative: F=Air Force / C=CAA / JF=Joint but ATC by Air Force / JC=Joint but ATC by CAA Category:I=International Airport / R=Regular Airport / F=Feeder Airport / P=Private Airport / N=Non Oparation Source : CAA Statistics of Pakistan / AIP
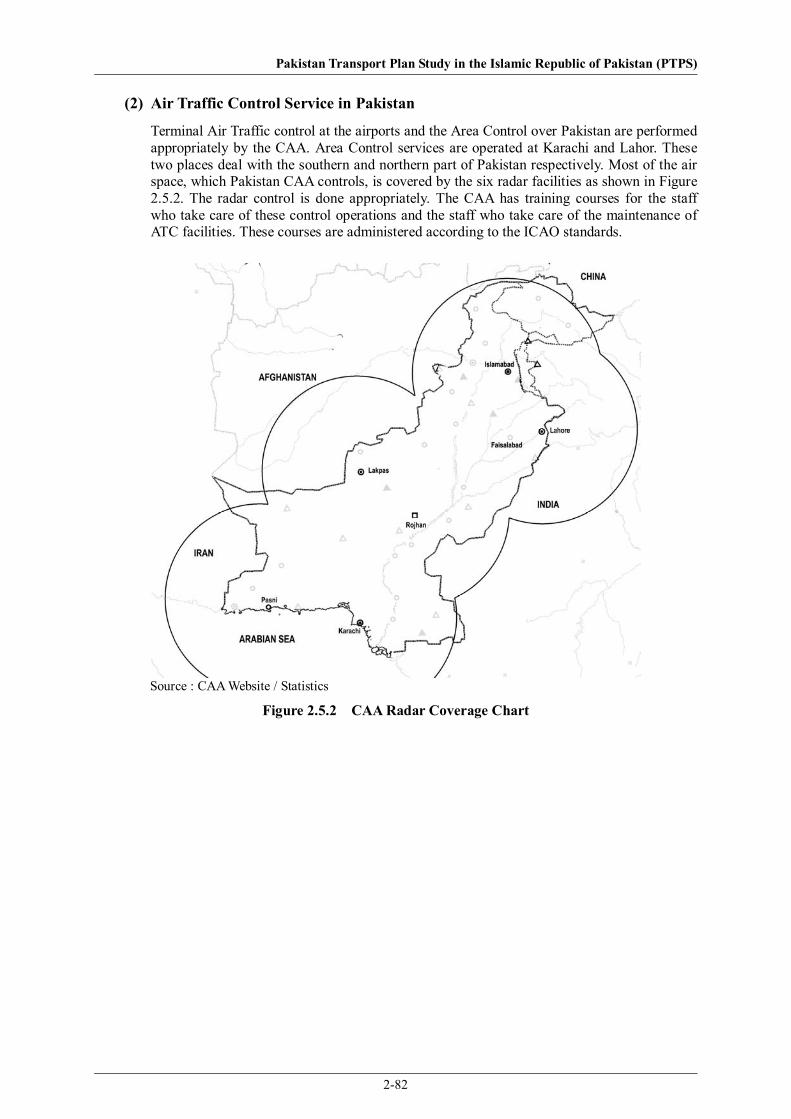
Pakistan Transport Plan Study in the Islamic Republic of Pakistan (PTPS)
2-82
(2) Air Traffic Control Service in Pakistan
Terminal Air Traffic control at the airports and the Area Control over Pakistan are performed appropriately by the CAA. Area Control services are operated at Karachi and Lahor. These two places deal with the southern and northern part of Pakistan respectively. Most of the air space, which Pakistan CAA controls, is covered by the six radar facilities as shown in Figure 2.5.2. The radar control is done appropriately. The CAA has training courses for the staff who take care of these control operations and the staff who take care of the maintenance of ATC facilities. These courses are administered according to the ICAO standards.
Source : CAA Website / Statistics
Figure 2.5.2 CAA Radar Coverage Chart

Pakistan Transport Plan Study in the Islamic Republic of Pakistan (PTPS)
2-83
2.5.2 Air Transport
(1) Domestic Airline Network
Figure 2.5.3 (below left) shows the domestic airline network and the right figure shows the estimated passenger volume by air route in Pakistan. It is clear that the number of flights between Karachi and Islamabad / Karachi and Lahore are outstanding among domestic flights in Pakistan.
Skardu
D.G.Khan Multan
Faisalabad
Islamabad
Peshaw ar
Karachi1
Lahore
Quetta
Saidu
Chitral Gilgit
Sargodha
Mianwali
D.I.Khan
Bannu
Kohat
Zhob
Rahimyar KhanSui
SukkurMoen jo Daro
Badin
Panjgur
Turbat
PasniJiwani
Hyderabad
Khaskheli
Thatta
Bahawalpur
1000Pax/Year250
1000 500
Panjgur
Turbat
Quetta
GilgitSkardu
Chitral
Faisalabad Lahore
Gw adar
Peshaw ar
Karachi
Islamabad
Chitral
Sui
Saw an
Source : Source : CAA Statistics of Pakistan / AIP
Figure 2.5.3 Domestic Flight Network and Number of Flight
(2) PIA (Pakistan International Airline)
In 1947, when Pakistan attained independence, PIA (Pakistan International Airline) was established with the support of the government. It has been developed as the flagship carrier of Pakistan. Even though there are now several private airlines operating after the private airline liberalization in 1992, PIA is still the biggest airline in Pakistan, and has been steadily expanding its operation. Figure 2.5.4 shows PIA International Operation Route
Source : PIA website
Figure 2.5.4 PIA International Flight Route 2005

Pakistan Transport Plan Study in the Islamic Republic of Pakistan (PTPS)
2-84
(3) Other Airlines
As shown in Figure 2.5.5 shows, after the Private Airline Liberalization in 1992, many airlines entered the industry. They are competing through the use of the latest technology such as on-line booking and E-tickets and the corresponding low costs.
1992 1993 1994 1995 1996 1997 1998 1999 2000 2001 2002 2003 2004 2005Airline
PIA
Aero Asia
Shaheen Air Int'l.
Royal Airlines
Safe Air
Airblue
Bhoja
Raji
Hajveri
Source : CAA Statistics of Pakistan
Figure 2.5.5 Time Line of the Commercial Airline Activity
PIA carried 4.66 million passengers in 2003/04, accounting for 79.4% of domestic air passengers in Pakistan, followed by Aero Asia at 15.6%, Airblue at 10.1% and Shaheen Air International at 4.9% as shown in Table 2.5.6.
1
2
3
4
5
6
7
2001-02 2002-03 2003-04
year
No
of P
asse
nger
(M
illio
n)
AirblueRoyal AirlinesShaheen Air Int'l.Aero AsiaPIA
Source : CAA Statistics of Pakistan
Figure 2.5.6 Air Passenger Traffic by Airline (Domestic)
(4) Air Passenger Traffic
Domestic flights in Pakistan carried 2.9 million passengers and 48,800 tons of cargo in 2003/04. Passenger transport volumes in terms of revenue passenger kms (RPKs) were 2.4 billion RPKs in 2003/04, which was a tenth of the passenger transport by rail, and a hundredth of the passenger transport by road. Cargo cartage was very small at 49,000 ton-kms. Passenger traffic on domestic flights reached a peak volume of 4.5 million in 1995/06, and then decreased rapidly to 2.5 million in 2001/02. Since 2001/02, the passenger traffic has been increasing at an annual rate of 7.7% as shown in Figure 2.5.7. Passenger traffic on international flights did not experience a sharp decrease and has recently shown a steady increase.

Pakistan Transport Plan Study in the Islamic Republic of Pakistan (PTPS)
2-85
.0
.51.01.52.02.53.03.54.04.55.0
1972
-73
1973
-74
1974
-75
1975
-76
1976
-77
1977
-78
1978
-79
1979
-80
1980
-81
1981
-82
1982
-83
1983
-84
1984
-85
1985
-86
1986
-87
1987
-88
1988
-89
1989
-90
1990
-91
1991
-92
1992
-93
1993
-94
1994
-95
1995
-96
1996
-97
1997
-98
1998
-99
1999
-00
2000
-01
2001
-02
2002
-03
2003
-04
2004
-05
Year
Num
ber o
f Pas
seng
er (M
illio
n)
Domestic International
Source: CAA Statistics of Pakistan
Figure 2.5.7 Air Passenger Traffic in Pakistan
Figure 2.5.8 shows the percentage of total passengers by airport in Pakistan. The four major airports (Karachi, Islamabad, Lahore and Peshawar) have 85% of the total air passengers in Pakistan, as shown in Figure 2.5.8.
Karachi; 42%
Lahore; 23%
Islamabad; 21%
Peshaw ar; 6%
Multan; 2%Quetta; 2% Faisalabad; 1% Others; 3%
Figure 2.5.8 International Passengers by Airport
Figure 2.5.9 and Figure 2.5.10 show the trend in domestic and international passenger at the four airports. The number of domestic passengers at the four airports decreased during the period of 1995/06 – 2001/02 and began to increase in 2001/02 except for Peshawar Airport as shown in Figure 2.5.9.

Pakistan Transport Plan Study in the Islamic Republic of Pakistan (PTPS)
2-86
.0
.5
1.0
1.5
2.0
2.5
3.0
3.5
1990
-91
1991
-92
1992
-93
1993
-94
1994
-95
1995
-96
1996
-97
1997
-98
1998
-99
1999
-00
2000
-01
2001
-02
2002
-03
2003
-04
2004
-05
No
of P
asse
nger
(Mill
ion)
Is lamabad Karachi Lahor Peshawar
Source : CAA Statistics of Pakistan
Figure 2.5.9 Domestic Passengers at Four Major Airports
Although the number of international air passengers is increasing as mentioned above (Figure 2.5.9), Karachi Airport was losing international air passengers in the 1990s while the traffic at other airports increased as shown in Figure 2.5.10. The traffic at Karachi Airport began to increase in 2001/02, as well as the recovery of domestic passengers in 2001/02.
.0
.5
1.0
1.5
2.0
2.5
3.0
3.5
1990
-91
1991
-92
1992
-93
1993
-94
1994
-95
1995
-96
1996
-97
1997
-98
1998
-99
1999
-00
2000
-01
2001
-02
2002
-03
2003
-04
2004
-05
No
of P
asse
nger
(Mill
ion)
Is lamabad Karachi Lahore Peshawar
Source : CAA Statistics of Pakistan
Figure 2.5.10 International Passenger at Four Major Airports
Air cargo traffic has been increasing steadily, except for a slight decrease in domestic air cargo in the 1990s when it had been slightly decreased, as shown in Figure 2.5.11.

Pakistan Transport Plan Study in the Islamic Republic of Pakistan (PTPS)
2-87
0
50,000
100,000
150,000
200,000
250,000
1973
-74
1975
-76
1977
-78
1979
-80
1981
-82
1983
-84
1985
-86
1987
-88
1989
-90
1991
-92
1993
-94
1995
-96
1997
-98
1999
-00
2001
-02
2003
-04
Year
Car
go (T
ons)
Domestic International
Source : CAA Statistics of Pakistan
Figure 2.5.11 Total Cargo at all Airports
2.5.3 Administration of Aviation Sector
Currently, the Pakistani airport facilities are managed by the Pakistani Civil Aviation Authority (CAA) and the Air Force. The CAA is under the administration of the MOD (Ministry of Defence) but deals only with civil aviation. It performs ATC (Air Traffic Control) at civil airports and maintenance of airport facilities. Major capital comes from the government. The PIA, which is a major airline in Pakistan, is currently implementing its privatisation plan. The government still holds more than 50% of the PIAs outstanding shares., however it is managed as a private organization. The ASF is the Airport Security Force under the MOD (Ministry of Defence), which has the responsibility for aviation safety. The number of airlines has been increasing since privatisation. Now, other than the PIA, there are 4 airlines operating scheduled domestic and international flights. There are also sporadic service airlines as well.
(1) CAA (Civil Aviation Authority)
The CAA is organized under the MOD and was established in 1982 to promote safe operation and to develop transportation to meet the increase in air traffic increase. The CAA is responsible for planning, construction/improvement and maintenance of airport facilities such as runways, aprons, terminal buildings, cargo buildings and air navigation systems, and for the provision of air safety facilities such as fire fighting and rescue facilities. It also acts as the aeronautical authority to enforce aviation rules and regulations including aircraft development in the country.
(2) ASF (Airport Security Force)
In Pakistan, originally, the MOD (Ministry of Defence) used to administer all the airports as a part of the military facility. In 1976 the MOD started the ASF (Airport security force) as an organization, under the administration of the MOD, which takes responsibility for the security of all airports and aircraft passengers.
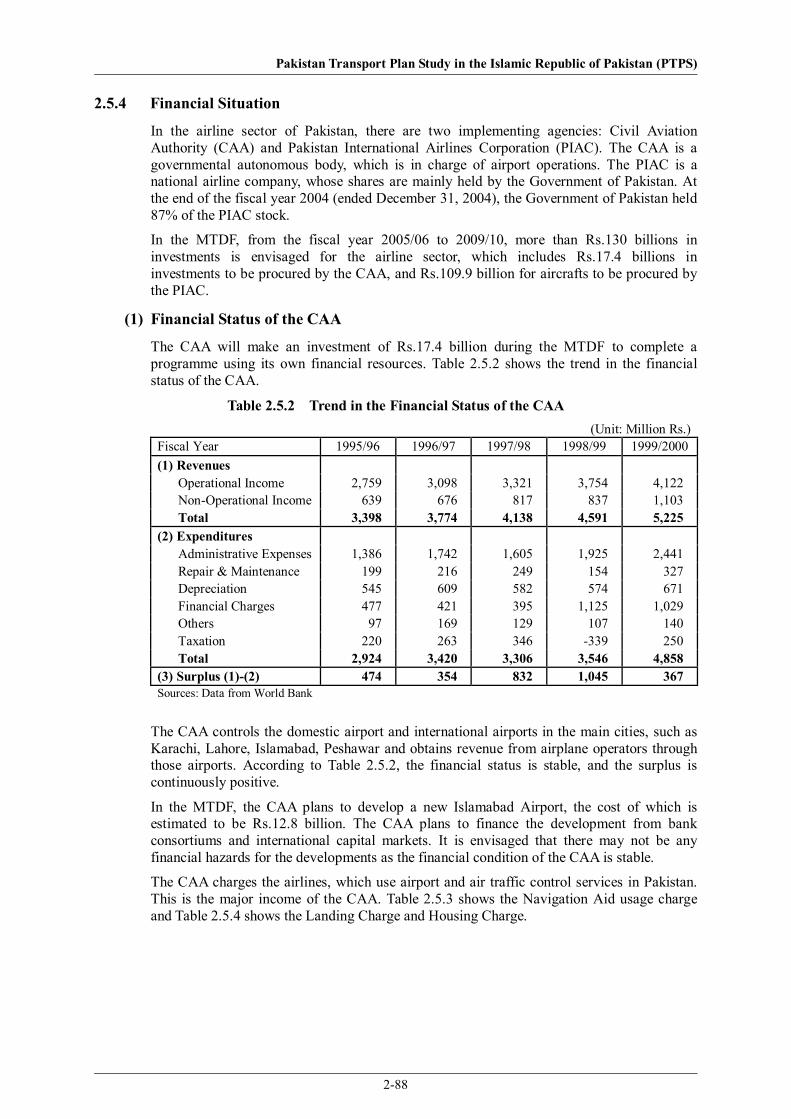
Pakistan Transport Plan Study in the Islamic Republic of Pakistan (PTPS)
2-88
2.5.4 Financial Situation
In the airline sector of Pakistan, there are two implementing agencies: Civil Aviation Authority (CAA) and Pakistan International Airlines Corporation (PIAC). The CAA is a governmental autonomous body, which is in charge of airport operations. The PIAC is a national airline company, whose shares are mainly held by the Government of Pakistan. At the end of the fiscal year 2004 (ended December 31, 2004), the Government of Pakistan held 87% of the PIAC stock.
In the MTDF, from the fiscal year 2005/06 to 2009/10, more than Rs.130 billions in investments is envisaged for the airline sector, which includes Rs.17.4 billions in investments to be procured by the CAA, and Rs.109.9 billion for aircrafts to be procured by the PIAC.
(1) Financial Status of the CAA
The CAA will make an investment of Rs.17.4 billion during the MTDF to complete a programme using its own financial resources. Table 2.5.2 shows the trend in the financial status of the CAA.
Table 2.5.2 Trend in the Financial Status of the CAA (Unit: Million Rs.)
Fiscal Year 1995/96 1996/97 1997/98 1998/99 1999/2000(1) Revenues
Operational Income 2,759 3,098 3,321 3,754 4,122 Non-Operational Income 639 676 817 837 1,103 Total 3,398 3,774 4,138 4,591 5,225
(2) Expenditures Administrative Expenses 1,386 1,742 1,605 1,925 2,441 Repair & Maintenance 199 216 249 154 327 Depreciation 545 609 582 574 671 Financial Charges 477 421 395 1,125 1,029 Others 97 169 129 107 140 Taxation 220 263 346 -339 250 Total 2,924 3,420 3,306 3,546 4,858
(3) Surplus (1)-(2) 474 354 832 1,045 367 Sources: Data from World Bank
The CAA controls the domestic airport and international airports in the main cities, such as Karachi, Lahore, Islamabad, Peshawar and obtains revenue from airplane operators through those airports. According to Table 2.5.2, the financial status is stable, and the surplus is continuously positive.
In the MTDF, the CAA plans to develop a new Islamabad Airport, the cost of which is estimated to be Rs.12.8 billion. The CAA plans to finance the development from bank consortiums and international capital markets. It is envisaged that there may not be any financial hazards for the developments as the financial condition of the CAA is stable.
The CAA charges the airlines, which use airport and air traffic control services in Pakistan. This is the major income of the CAA. Table 2.5.3 shows the Navigation Aid usage charge and Table 2.5.4 shows the Landing Charge and Housing Charge.

Pakistan Transport Plan Study in the Islamic Republic of Pakistan (PTPS)
2-89
Table 2.5.3 Navigation Charge for Over Flight in Pakistan
Navigation Charge for Over Flight in Pakistan (per flight) Weight of Aircraft (Tons)
Exceeding 1 Ton But not 40 Tons
Exceeding 40 TonBut not 120 Tons
Exceeding 120 TonBut not 160 Tons
Exceeding 160 Ton But not 250 Tons
Exceeding 250 Tons
US$208 US$273 US$313 US$352 US$417 Source : CAA Statistics of Pakistan
Table 2.5.4 Landing Charge (per ton)
International Flight (Weight of Aircraft)
Non-International Flight (Weight of Aircraft)
Not Exceeding
1 Ton
Exceeding 1 Ton
But not 250 Tons
Exceeding 250 Tons
Not Exceeding
1 Ton
Exceeding 1 Ton
But not 250 Tons
Exceeding 250 Tons
International Airport
US$ 12.75 US$ 7.00 US$ 20.00 Rs. 1.50 Rs. 1.20 Rs. 6.20
Domestic Airport
Rs. 1.00 Rs. 5.20
Source: CAA Statistics of Pakistan
Table 2.5.5 Aircraft Housing Charge
Aircraft Housing Charge (per tons) INTERNATIONAL FLIGHT NON-INTERNATIONAL FLIGHT Weight of Aircraft (Tons) Weight of Aircraft (Tons)
Not Exceeding
1 Ton
Exceeding 1 TonBut not 250 Tons
Exceeding250 Tons
Not Exceeding
1 Ton
Exceeding 1 Ton But not 250 Tons
Exceeding250 Tons
Karachi / Islamabad /
Lahor US$3.14 US$3.14 US$36.00 Rs.1.00 Rs 1.00 Rs 3.60
All Other Rs.0.90 Rs.0.90 Rs.2.70 Source : CAA Statistics of Pakistan
In addition, the CAA charges a passenger service charge at airports as shown in Table 2.5.6. The Passenger Service Charge is included in air tickets.
Table 2.5.6 Passenger Service Charge
International Flight Passenger Domestic Economy Business First
Rs. 100 Rs. 400 Rs. 600 Rs. 800 Source : CAA Statistics of Pakistan

Pakistan Transport Plan Study in the Islamic Republic of Pakistan (PTPS)
2-90
(2) Financial Status of PIAC
In the MTDF, Rs.109.9 billion for aircrafts is to be financed by the PIAC. The investments depend on the financial resources of the PIAC. Table 2.5.7 shows the trend in the financial status of the PIAC. Up until the fiscal year 2001, the financial status of the PIAC was in a critical condition. In the fiscal year 2001, the total liabilities exceeded the total assets, and the accumulated loss amounted to nearly Rs. 13 billion. In order to resolve this problem, from the fiscal year 2000 to 2002, the PIAC changed the management and rationalized the organization (including the abolishment of unprofitable routes) with the financial assistance of the government. The financial status of the PIAC began to improve from the fiscal year 2002, and consequently, the profit after tax became positive.
Table 2.5.7 Trend in the Financial Status of the PIAC (Unit: Million Rs.)
FY 2000 2001 2002 2003 2004 (1) Operational Income Passenger 32,433 36,646 35,977 40,613 49,207 Excess Baggage 1,025 1,002 1,064 951 939 Freight 3,520 4,063 3,908 3,962 4,554 Mail 176 214 203 202 267 Charters 21 108 540 696 623 Others 2,052 1,575 1,982 1,529 2,198 Total 39,228 43,608 43,674 47,952 57,788 (2) Cost and Expenditures Personal Costs 10,460 7,784 7,984 8,320 9,444 Aircraft Fuel and Oil 12,321 12,211 9,336 11,605 17,319 Depreciation 2,569 2,651 4,503 3,303 4,189 Others 16,683 20,597 16,274 19,346 24,920 Total 42,033 43,242 38,097 42,574 55,872 (3) Profit from Operation(1)-(2) -2,805 366 5,577 5,378 1,916 (4) Other Income 713 616 289 664 2,187 (5) Finance Cost and Provision etc 3,054 2,864 3,755 2,342 3,266 (6) Profits before Tax (3)+(4)-(5) -5,146 -1,882 2,111 3,700 837 (7)Tax -9 -324 -238 -2,401 1,469 (8)Profits after Tax (6)+(7) -5,155 -2,206 1,873 1,298 2,307 Source: Pakistan International Airline Corporation Annual Report
Based on the current financial status, the PIAC is going to obtain new aircraft or replace its existing aircraft. The detail of the PIAC’s investment is shown in Table 2.5.8. As described in Table 2.5.8, most of the investments are to be financed, based on the financial credibility of the PIAC. It is envisaged that there may not be any financial hazard for the investments from the PIAC.
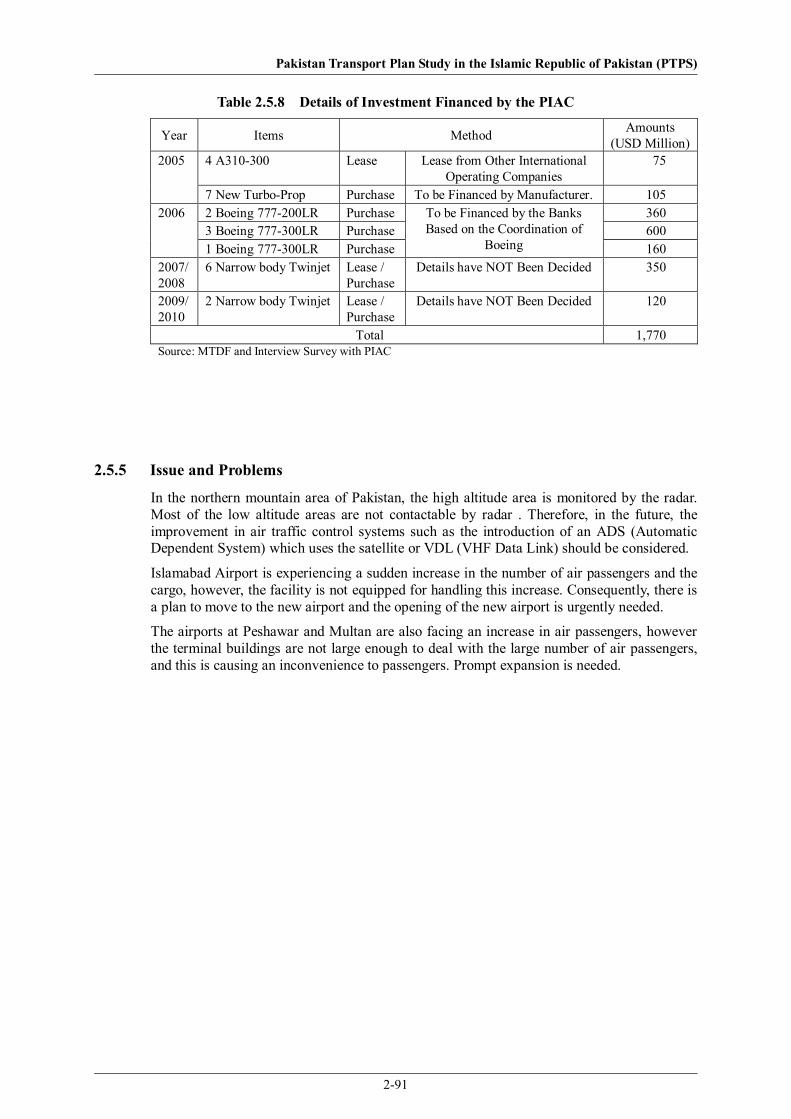
Pakistan Transport Plan Study in the Islamic Republic of Pakistan (PTPS)
2-91
Table 2.5.8 Details of Investment Financed by the PIAC
Year Items Method Amounts (USD Million)
4 A310-300 Lease Lease from Other International Operating Companies
75 2005
7 New Turbo-Prop Purchase To be Financed by Manufacturer. 105 2 Boeing 777-200LR Purchase 360 3 Boeing 777-300LR Purchase 600
2006
1 Boeing 777-300LR Purchase
To be Financed by the Banks Based on the Coordination of
Boeing 160 2007/ 2008
6 Narrow body Twinjet Lease / Purchase
Details have NOT Been Decided 350
2009/ 2010
2 Narrow body Twinjet Lease / Purchase
Details have NOT Been Decided 120
Total 1,770 Source: MTDF and Interview Survey with PIAC
2.5.5 Issue and Problems
In the northern mountain area of Pakistan, the high altitude area is monitored by the radar. Most of the low altitude areas are not contactable by radar . Therefore, in the future, the improvement in air traffic control systems such as the introduction of an ADS (Automatic Dependent System) which uses the satellite or VDL (VHF Data Link) should be considered.
Islamabad Airport is experiencing a sudden increase in the number of air passengers and the cargo, however, the facility is not equipped for handling this increase. Consequently, there is a plan to move to the new airport and the opening of the new airport is urgently needed.
The airports at Peshawar and Multan are also facing an increase in air passengers, however the terminal buildings are not large enough to deal with the large number of air passengers, and this is causing an inconvenience to passengers. Prompt expansion is needed.
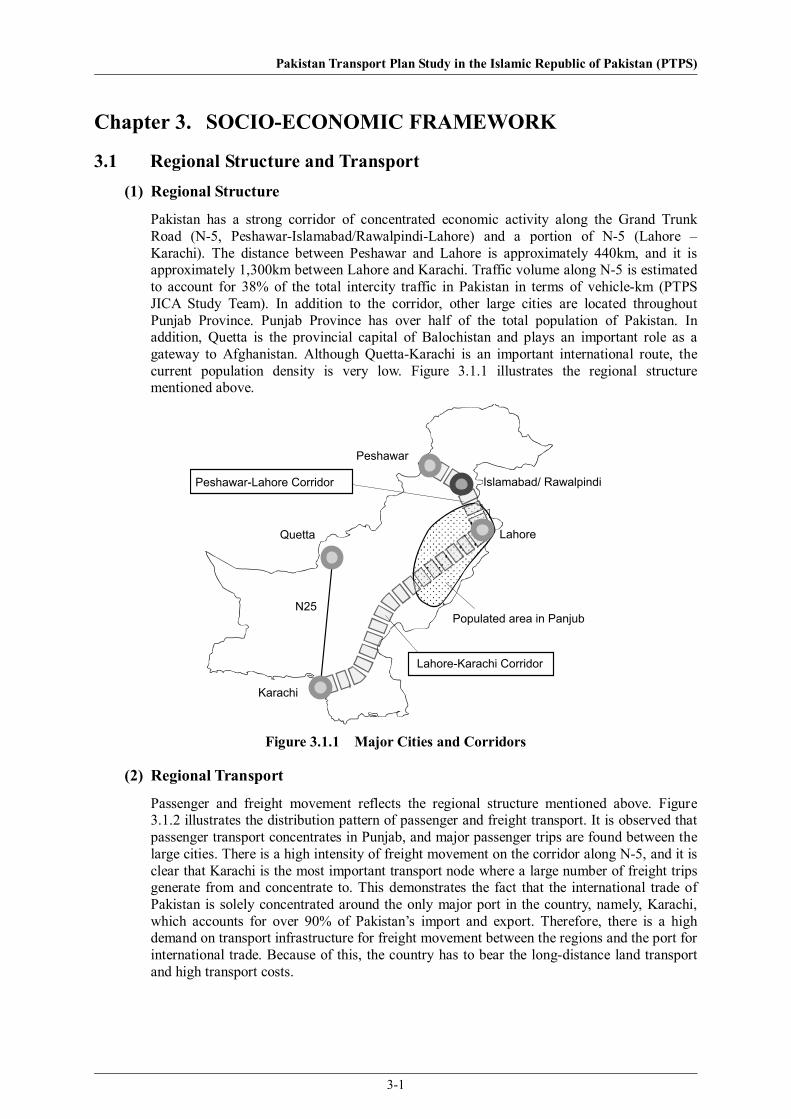
Pakistan Transport Plan Study in the Islamic Republic of Pakistan (PTPS)
3-1
Chapter 3. SOCIO-ECONOMIC FRAMEWORK
3.1 Regional Structure and Transport (1) Regional Structure
Pakistan has a strong corridor of concentrated economic activity along the Grand Trunk Road (N-5, Peshawar-Islamabad/Rawalpindi-Lahore) and a portion of N-5 (Lahore – Karachi). The distance between Peshawar and Lahore is approximately 440km, and it is approximately 1,300km between Lahore and Karachi. Traffic volume along N-5 is estimated to account for 38% of the total intercity traffic in Pakistan in terms of vehicle-km (PTPS JICA Study Team). In addition to the corridor, other large cities are located throughout Punjab Province. Punjab Province has over half of the total population of Pakistan. In addition, Quetta is the provincial capital of Balochistan and plays an important role as a gateway to Afghanistan. Although Quetta-Karachi is an important international route, the current population density is very low. Figure 3.1.1 illustrates the regional structure mentioned above.
Islamabad/ Rawalpindi
Lahore
Populated area in Panjub
Lahore-Karachi Corridor
Peshawar-Lahore Corridor
Peshawar
Quetta
N25
Karachi
Figure 3.1.1 Major Cities and Corridors
(2) Regional Transport
Passenger and freight movement reflects the regional structure mentioned above. Figure 3.1.2 illustrates the distribution pattern of passenger and freight transport. It is observed that passenger transport concentrates in Punjab, and major passenger trips are found between the large cities. There is a high intensity of freight movement on the corridor along N-5, and it is clear that Karachi is the most important transport node where a large number of freight trips generate from and concentrate to. This demonstrates the fact that the international trade of Pakistan is solely concentrated around the only major port in the country, namely, Karachi, which accounts for over 90% of Pakistan’s import and export. Therefore, there is a high demand on transport infrastructure for freight movement between the regions and the port for international trade. Because of this, the country has to bear the long-distance land transport and high transport costs.
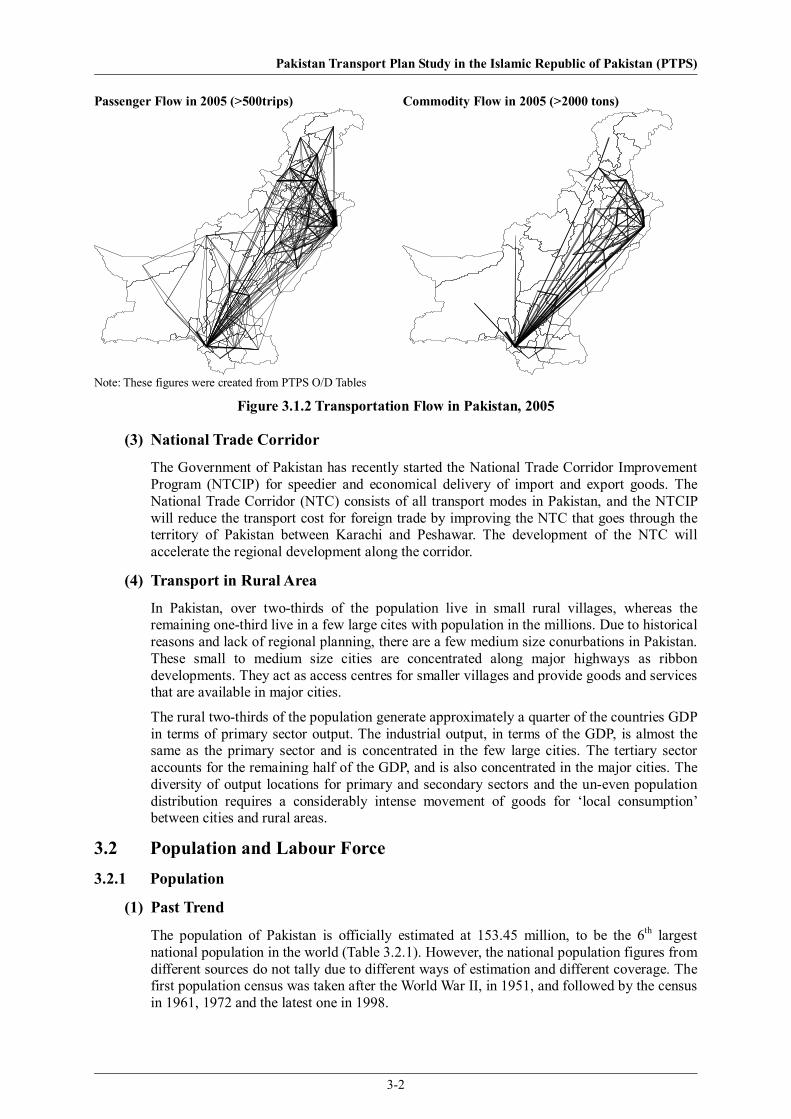
Pakistan Transport Plan Study in the Islamic Republic of Pakistan (PTPS)
3-2
Passenger Flow in 2005 (>500trips)
Commodity Flow in 2005 (>2000 tons)
Note: These figures were created from PTPS O/D Tables
Figure 3.1.2 Transportation Flow in Pakistan, 2005
(3) National Trade Corridor
The Government of Pakistan has recently started the National Trade Corridor Improvement Program (NTCIP) for speedier and economical delivery of import and export goods. The National Trade Corridor (NTC) consists of all transport modes in Pakistan, and the NTCIP will reduce the transport cost for foreign trade by improving the NTC that goes through the territory of Pakistan between Karachi and Peshawar. The development of the NTC will accelerate the regional development along the corridor.
(4) Transport in Rural Area
In Pakistan, over two-thirds of the population live in small rural villages, whereas the remaining one-third live in a few large cites with population in the millions. Due to historical reasons and lack of regional planning, there are a few medium size conurbations in Pakistan. These small to medium size cities are concentrated along major highways as ribbon developments. They act as access centres for smaller villages and provide goods and services that are available in major cities.
The rural two-thirds of the population generate approximately a quarter of the countries GDP in terms of primary sector output. The industrial output, in terms of the GDP, is almost the same as the primary sector and is concentrated in the few large cities. The tertiary sector accounts for the remaining half of the GDP, and is also concentrated in the major cities. The diversity of output locations for primary and secondary sectors and the un-even population distribution requires a considerably intense movement of goods for ‘local consumption’ between cities and rural areas.
3.2 Population and Labour Force 3.2.1 Population
(1) Past Trend
The population of Pakistan is officially estimated at 153.45 million, to be the 6th largest national population in the world (Table 3.2.1). However, the national population figures from different sources do not tally due to different ways of estimation and different coverage. The first population census was taken after the World War II, in 1951, and followed by the census in 1961, 1972 and the latest one in 1998.

Pakistan Transport Plan Study in the Islamic Republic of Pakistan (PTPS)
3-3
According to the old census, the annual growth rate of the population was lower than 2.0% in 1951. Following this, mortality declined sharply, but fertility did not accompany this change. Consequently, the annual population growth rate increased to 2.5% in 1961 and 3.6% in 1972. Since the 1970s, the Government has been making efforts to implement an intensive family planning programme. Thereby, the fertility and birth rate started to decline, and the population increase was lowered to the average rate of 2.6% during the inter-censal period of 1981 – 1998. In the MTDF, the population growth rate was estimated to be below 2.0% for the first time in 2003 and in 2005 at 1.87%. (Table 3.2.2)
Table 3.2.1 Population and Rate of Birth, Death and Increase
Mid-Year Population (Million)
Crude Birth Rate(per mill)
Crude Death Rate(per mill)
Annual Rate of Increase (%)
1981 85.09 - - - 1991 112.61 39.50 9.80 - 1992 115.54 39.30 10.10 2.60 1993 118.50 38.90 10.10 2.56 1994 121.48 37.60 9.90 2.51 1995 124.49 36.60 9.20 2.48 1996 127.51 35.20 8.80 2.43 1997 130.56 33.80 8.90 2.39 1998 133.48 - - 2.24 1999 136.69 30.50 8.60 2.40 2000 139.76 - - - 2001 142.86 - - - 2002 146.75 - - 2.72 2003 149.65 27.30 8.00 1.98 2004 152.53 27.80 8.70 1.92 2005* 153.45 - -
Source :Pakistan Economic Survey, 2004 – 2005, Statistical Appendix, P93 * Population in 2005 is estimated in MTDF2005 (Part 2,Chapter 9 P9-1)
Table 3.2.2 Change in population and Growth Rate in Pakistan
Census Year
Population (million)
Average annual Intercensal Population
Growth Rate (%)
Percentage Intercensal
Increase (%) 1951 33.82 1.8 - 1961 42.97 2.5 27.09 1972 65.32 3.6 52.31 1981 84.25 3.1 29.01 1998 133.32 2.6 57.09 2003* 147.69 1.96 10.78 2004* 150.58 1.92 1.96 2005* 153.45 1.87 1.92
Source : MTDF, Chapter 7 Note : * Estimated by MTDF
(2) Future Population
The MTDF asserted that reducing the population growth rate is a basic prerequisite for Pakistani economic growth through improving labour productivity and accelerating social development. Table 3.2.3 shows the MTDF demographic targets, which aims at lowering the population growth rate down to 1.63% by 2010 by raising the contraceptive prevalence rate from 36% in 2005 to 51% in 2010.

Pakistan Transport Plan Study in the Islamic Republic of Pakistan (PTPS)
3-4
Table 3.2.3 MTDF Demographic Targets
Year Total Fertility Rate (TFR), %
Crude Birth Rate (CBR),%
Crude Death Rate(CDR), %
Rate of Growth
(%)
ContraceptivePrevalence
Rate 2005 3.50 27.1 8.4 1.87 36.0 2006 3.28 26.1 8.2 1.80 38.0 2007 3.13 25.5 7.9 1.76 41.0 2008 3.00 25.0 7.7 1.73 45.0 2009 2.85 24.3 7.5 1.69 48.0 2010 2.70 23.6 7.3 1.63 51.0 Source: MTDF, Chapter 7
In the period from 2005 to 2010, the total fertility rate is expected to decline by 23% from 3.50% to 2.70%, while the crude birth rate will drop only 13% due to the high momentum, and as the crude death rate is also decreased, the population growth rate will be lowered from 1.87% to 1.63%.
In order to extrapolate the population trend, a linear equation was determined using population growth rates observed between 1992 and 2010 (growth rates between 1992 and 2004 are estimates, and those between 2005 and 2010 are targets). (Figure 3.2.1)
R = 116.865 – 0.05734 t (r = 0.986)
Where: R: Annual population growth rate (%) t : Year
Although the regression line shows a good fit for the period of input data, it may be risky to use the equation directly for a period longer then 20 years as it causes the growth rate to decline annually by a constant value (below 1.0% in the year of 2021 and at 0.47% in 2030). However, the growth rate will hardly become lower than 1.0% in 20 - 25 years.
Consequently, the equation was only applied up to the year 2015, and after 2015 the gradient of the regression line was divided by 2.0 every five years, to make the line level off towards the value of 1.0% (Figure 3.2.2).
0.05.0
10.015.020.025.030.035.040.045.0
1992
1994
1996
1998
2000
2002
2004
2006
2008
2010
Year
Cru
de B
irth
and
Dea
th R
ate
(per
mill
)
0.00
0.50
1.00
1.50
2.00
2.50
3.00A
nnua
l Pop
ulat
ion
Gro
wth
Rat
e(%
)
Crude Burth Rate Crude Death Rate Auual Growth Rate
Source: Elaborated by Study Team based on Census data & MTDF data
Figure 3.2.1 Linear Regression on Annual Population Growth Rate
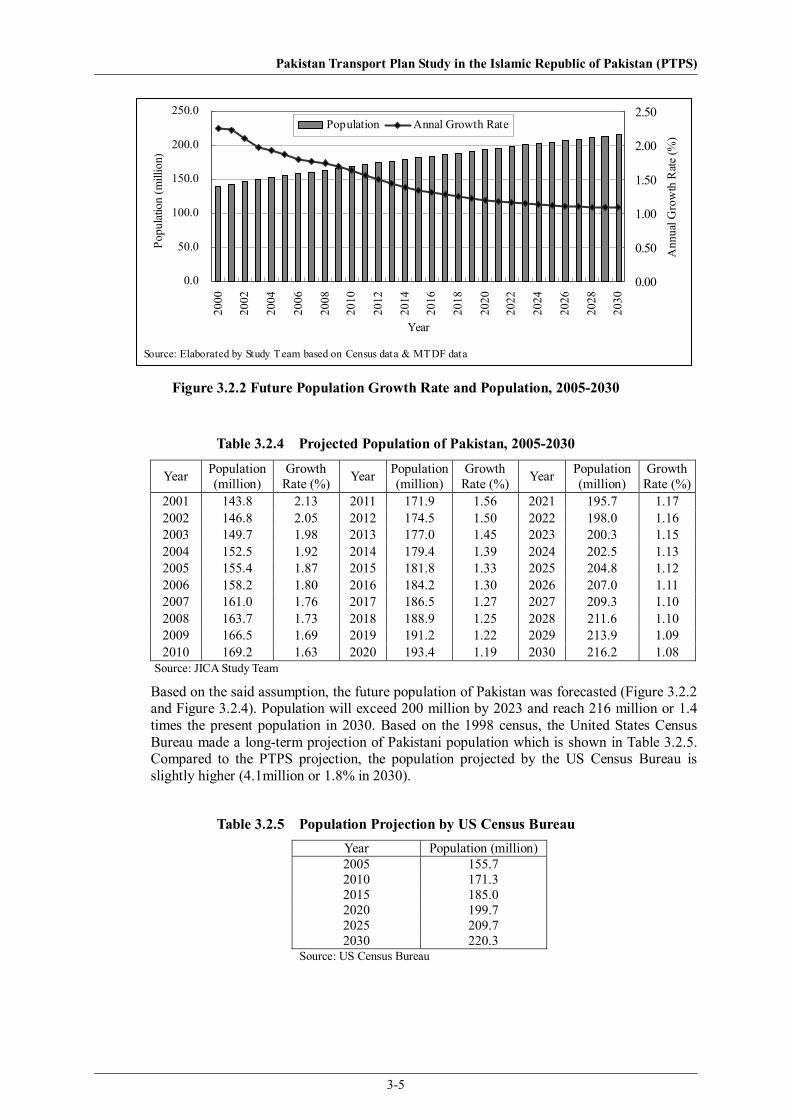
Pakistan Transport Plan Study in the Islamic Republic of Pakistan (PTPS)
3-5
0.0
50.0
100.0
150.0
200.0
250.0
2000
2002
2004
2006
2008
2010
2012
2014
2016
2018
2020
2022
2024
2026
2028
2030
Year
Popu
latio
n (m
illio
n)
0.00
0.50
1.00
1.50
2.00
2.50
Ann
ual G
row
th R
ate
(%)
Population Annal Growth Rate
Source: Elaborated by Study Team based on Census data & MTDF data
Figure 3.2.2 Future Population Growth Rate and Population, 2005-2030
Table 3.2.4 Projected Population of Pakistan, 2005-2030
Year Population (million)
Growth Rate (%) Year Population
(million)Growth
Rate (%) Year Population (million)
Growth Rate (%)
2001 143.8 2.13 2011 171.9 1.56 2021 195.7 1.17 2002 146.8 2.05 2012 174.5 1.50 2022 198.0 1.16 2003 149.7 1.98 2013 177.0 1.45 2023 200.3 1.15 2004 152.5 1.92 2014 179.4 1.39 2024 202.5 1.13 2005 155.4 1.87 2015 181.8 1.33 2025 204.8 1.12 2006 158.2 1.80 2016 184.2 1.30 2026 207.0 1.11 2007 161.0 1.76 2017 186.5 1.27 2027 209.3 1.10 2008 163.7 1.73 2018 188.9 1.25 2028 211.6 1.10 2009 166.5 1.69 2019 191.2 1.22 2029 213.9 1.09 2010 169.2 1.63 2020 193.4 1.19 2030 216.2 1.08
Source: JICA Study Team
Based on the said assumption, the future population of Pakistan was forecasted (Figure 3.2.2 and Figure 3.2.4). Population will exceed 200 million by 2023 and reach 216 million or 1.4 times the present population in 2030. Based on the 1998 census, the United States Census Bureau made a long-term projection of Pakistani population which is shown in Table 3.2.5. Compared to the PTPS projection, the population projected by the US Census Bureau is slightly higher (4.1million or 1.8% in 2030).
Table 3.2.5 Population Projection by US Census Bureau Year Population (million)2005 155.7 2010 171.3 2015 185.0 2020 199.7 2025 209.7 2030 220.3
Source: US Census Bureau

Pakistan Transport Plan Study in the Islamic Republic of Pakistan (PTPS)
3-6
(3) Regional Distribution
Geographically, the population of Pakistan is unevenly distributed as shown in Table 3.2.6 and Figure 3.2.3. The two provinces of Punjab and Sindh contain 78% of the total population, while the other provinces (with 57% of national land) contain only 22% of the population.
Table 3.2.6 Regional Population in Census Year In 1000 population
Urban Population Rural Population Total Population Region/ Province 1972 1981 1998 1972 1981 1998 1972 1981 1998 Islamabad 77 204 529 158 136 276 235 340 805Punjab 9,183 13,052 23,019 28,428 34,241 50,602 37,610 47,292 73,621Sindh 5,726 8,243 14,840 8,430 10,786 15,600 14,156 19,029 30,440NWFP 1,196 1,665 2,994 7,193 9,396 14,750 8,389 11,061 17,744Balochiostan 399 677 1,569 2,029 3,655 4,997 2,429 4,332 6,566FATA 13 - 85 2,478 2,199 3,091 2,491 2,199 3,176Pakistan 16,594 23,841 43,036 48,716 60,412 89,316 65,310 84,253 132,352
Note: not inclusive of the population of AJK and Northern Area Source: Pakistan Economic Survey 2004-05, Statistical Appendix P.95
Figure 3.2.3 clearly shows the concentration of population in the corridor along the Indus, its tributaries and the corridor from Lahore to Peshawar via Islamabad/ Rawalpindi.
According to the 1998 census, about one person out of three lives in an urban area. This urban population ratio has been steadily growing from 25 % in 1972 and 28 % in 1981. Most of the urban population live in Punjab and Sindh. The most populous city is Karachi (9.3 million in 1998), followed by Lahore (5.4 million), Faisalabad (2.0 million), Rawalpindi (1.4 million), Multan (1.2 million), Hyderabad (1.2 million), Gujranwala (1.1 million) and Peshawar (1.0 million). Quetta, the capital of Balochistan had a population of 0.6 million in 1998.
Provincial population was projected by extrapolating the 1998 population using the 1981-1998 growth rates and then adjusting the projected population to meet the total forecast population of Pakistan. Table 3.2.7 shows the projected provincial population.
Table 3.2.7 Projection of Provincial Population, 2005 – 2030
Province 1998 2005 2010 2015 2020 2025 2030 Islamabad 805 1,119 1,441 1,832 2,278 2,884 3,559 Punjab 73,621 86,110 93,335 99,813 104,410 111,232 115,516 Sindh 30,440 36,005 39,466 42,680 45,149 48,641 51,083 NWFP 17,744 21,012 23,059 24,966 26,441 28,519 29,986 Balochiostan 6,566 7,596 8,143 8,613 8,911 9,390 9,644 FATA 3,176 3,602 3,785 3,925 3,981 4,112 4,141 Pakistan 132,352 155,444 169,229 181,828 191,169 204,777 213,928Source: JICA Study Team
The forecasted provincial population was further subdivided into traffic zones which were composed by combining several adjacent districts (taking into consideration their geographically homogeneous nature). The results are shown in Table 3.2.8 and illustrated in Figure 3.2.4. The population distribution was forecast based only on the past trend and did not take into account any large-scale investments for regional development, except for the Gwardar area development in Balochistan.
The total population of Pakistan is expected to exceed 200 million in 20 years with an increase of about 50 million, of which 51% will occur in Punjab, 26% in Sindh and 16% in .NWFP together with FATA. Balochistan and Islamabad are projected to experience the same increase of 1.8 million, respectively.
The trend in zone-wise distribution clearly shows that significant increases are observed in

Pakistan Transport Plan Study in the Islamic Republic of Pakistan (PTPS)
3-7
zones of the provincial capitals or zones of large cities, while rather moderate increases are observed in other zones. This indicates that an intensive migration from rural to urban area will continue in the future.
Lahore
Islamabad/Rawalpindi
Peshawar
Karachi
Quetta
800 to 500,000 (13)600 to 800 (3)400 to 600 (20)200 to 400 (20)
0 to 200 (51)
Poplation 983,000,0001,500,000
300,000
Pop98
Islamabad/Rawalpindi
Punjab
N.W.F.P
Sindh
Balochistan
50,000,00025,000,000
5,000,000
UrbanPopRuralPop
800 to 1,000 (1)200 to 400 (3)
0 to 200 (2)
Source: Elaborated by Study Team using 1998 Census data
Figure 3.2.3 Population Distributions and Density, 1998

Pakistan Transport Plan Study in the Islamic Republic of Pakistan (PTPS)
3-8
Table 3.2.8 Future Population by Traffic zone (1,000 persons)
Traffic Zone Census Population Estimated and Forecast Population No. Zone Name 1972 1981 1998 2005 2010 2015 2020 2025 2030
1 Malkand 1,238 1,523 2,660 3,275 3,630 3,969 4,243 4,619 4,901 2 Swat 888 1,233 2,199 2,731 3,046 3,350 3,604 3,948 4,215 3 Mansehra 2,069 2,701 3,506 3,820 3,997 4,125 4,162 4,277 4,283 4 Mardan 1,204 1,507 2,487 2,992 3,262 3,508 3,689 3,951 4,123 5 Peshawar 2,492 2,730 4,805 5,936 6,595 7,227 7,744 8,450 8,986 6 Kohat 1,145 1,412 1,982 2,230 2,388 2,522 2,604 2,738 2,806 7 Bannu 818 950 1,527 1,817 1,966 2,098 2,189 2,326 2,409 8 D.I.Khan 781 945 1,521 1,811 1,960 2,092 2,184 2,321 2,405
Subtotal NWFP 10,635 13,000 20,685 24,614 26,844 28,891 30,422 32,631 34,127 9 Islamabad 1,982 2,462 4,169 5,041 5,598 6,133 6,574 7,177 7,641
10 Attok 749 877 1,275 1,448 1,537 1,611 1,651 1,723 1,754 11 Jhelum 1,285 1,435 2,021 2,265 2,382 2,472 2,510 2,596 2,618 12 Gujrat 1,899 2,255 3,209 3,611 3,810 3,966 4,039 4,189 4,238 13 Sargodha 1,558 1,912 2,666 2,976 3,121 3,229 3,269 3,371 3,389 14 Khushab 543 641 906 1,016 1,070 1,111 1,129 1,168 1,179 15 Mianwali 1,096 1,377 2,108 2,445 2,635 2,802 2,916 3,090 3,193 16 Sialkot 2,344 2,711 3,989 4,551 4,848 5,096 5,241 5,489 5,607 17 Gujranwala 2,060 2,676 4,234 4,978 5,418 5,819 6,113 6,542 6,827 18 Sheikhupura 1,657 2,110 3,321 3,896 4,234 4,540 4,762 5,088 5,302 19 Faisalabad 4,248 4,696 7,051 8,113 8,696 9,196 9,513 10,024 10,301 20 Jhang 1,555 1,971 2,834 3,204 3,391 3,541 3,617 3,763 3,819 21 Lahore 3,774 5,073 8,695 10,565 11,773 12,944 13,923 15,254 16,297 22 Sahiwal 2,684 3,549 5,363 6,187 6,643 7,038 7,295 7,701 7,928 23 D.G.Khan 1,142 1,583 2,747 3,355 3,752 4,141 4,470 4,916 5,272 24 Muzaffagath 1,565 2,164 3,757 4,589 5,133 5,665 6,116 6,726 7,212 25 Multan 4,160 5,409 8,448 9,880 10,713 11,461 11,995 12,788 13,294 26 Bahalnagar 1,074 1,374 2,061 2,372 2,541 2,687 2,779 2,928 3,009 27 Bahawalpur 1,071 1,453 2,433 2,928 3,240 3,538 3,779 4,112 4,363 28 Rhahim Yan Khan 1,399 1,841 3,141 3,809 4,239 4,654 4,999 5,469 5,835
Subtotal Punjub 37,845 47,570 74,426 87,229 94,777 101,645 106,687 114,116 119,075 29 Loralai 340 719 956 1,041 1,098 1,141 1,160 1,199 1,208 30 Quetta 502 762 1,501 1,921 2,145 2,361 2,540 2,781 2,967 31 Chagai 65 120 203 243 259 272 279 292 297 32 Dera Bugti 682 1,036 1,619 1,883 1,983 2,058 2,089 2,158 2,171 33 Khuzdar 421 854 1,141 1,244 1,300 1,340 1,350 1,385 1,383 34 Gwadar 296 653 833 891 963 1,026 1,068 1,133 1,170 35 Lasbela 125 188 313 373 396 415 424 442 448
Subtotal Balochistan 2,431 4,333 6,566 7,596 8,143 8,613 8,911 9,390 9,644 36 Shikarpur 1,232 1,596 2,285 2,575 2,705 2,802 2,837 2,924 2,937 37 Larkana 921 1,139 1,927 2,327 2,568 2,794 2,973 3,219 3,396 38 Sukkur 862 1,134 1,900 2,285 2,514 2,728 2,894 3,124 3,286 39 Dadu 811 1,082 1,669 1,940 2,083 2,206 2,284 2,407 2,471 40 Khairpur 725 981 1,547 1,814 1,960 2,089 2,176 2,307 2,384 41 Nawabshah 1,365 1,667 2,190 2,383 2,514 2,615 2,659 2,753 2,777 42 Sanghar 674 893 1,422 1,675 1,815 1,940 2,027 2,156 2,234 43 Tharparkar 1,016 1,502 2,483 2,970 3,255 3,518 3,717 3,997 4,188 44 Hyderabad 1,626 2,022 2,834 3,167 3,406 3,611 3,743 3,950 4,060 45 Badin 641 813 1,193 1,358 1,480 1,591 1,671 1,787 1,862 46 Thatta 676 761 1,113 1,266 1,378 1,480 1,554 1,660 1,728 47 Karachi 3,607 5,438 9,856 12,244 13,786 15,306 16,614 18,356 19,760
Subtotal Sindh 14,156 19,029 30,420 36,005 39,466 42,680 45,149 48,641 51,083 Pakistan Total 65,067 83,931 132,097 155,444 169,229 181,828 191,169 204,777 213,928Source: JICA Study Team

Pakistan Transport Plan Study in the Islamic Republic of Pakistan (PTPS)
3-9
IslamabadRawalpindi
Lahore
Multan
Peshawar
Karachi
Quetta
Figure 3.2.4 Future population Increase by Province and Traffic Zone
5,000
year 05year 15year 25
Thousand
0
20,000
40,000
60,000
80,000
100,000
120,000
Islamabad/Punjab Sindh NWFP/FATA Balochistan
Popu
latio
n (1
000)
200520152025

Pakistan Transport Plan Study in the Islamic Republic of Pakistan (PTPS)
3-10
3.2.2 Labour Force and Employment
(1) Labour Force
As shown in Table 3.2.9, the labour force rate has been rising in Pakistan, reaching the current rate of 30%. This is due to the change in age-structure and participation of the female population. However, 30% is still low compared with south-east Asian countries attaining a steady economic growth. The labour force rate will continue to rise and MTDF foresees the rate will reach 31.2% in 2010 (shaded area in Table 3.2.9). The unemployment rate is currently very high at 7.7%. MTDF aims at gradually lowering this rate to 4% by 2010.
Table 3.2.9 Trends of Labour Force and Employment
Population Working Age Population
Labour Force Employed Unempl-
oyed Working Age
Pop. Rate
Labour Force Rate
Unemploy-ment RateYear
(million) (million) (million) (million) (million) (%) (%) (%) 1996 127.51 87.87 35.01 33.13 1.88 68.9 27.5 5.37 1997 130.56 86.91 37.45 35.16 2.29 66.6 28.7 6.11 1998 133.61 88.92 39.26 36.94 2.32 66.6 29.4 5.91 1999 136.64 90.95 40.15 37.78 2.37 66.6 29.4 5.90 2000 139.76 94.59 40.49 37.32 3.17 67.7 29.0 7.83 2001 142.86 96.69 41.38 38.14 3.24 67.7 29.0 7.83 2002 145.96 99.70 43.21 39.64 3.57 68.3 29.6 8.26 2003 149.03 101.80 44.12 40.47 3.65 68.3 29.6 8.27 2004 150.47 103.54 45.76 42.24 3.52 68.8 30.4 7.69 2005 153.96 106.72 46.82 43.22 3.60 69.3 30.4 7.69 2006 156.32 109.16 47.60 44.36 3.24 69.8 30.5 6.81 2007 159.13 111.94 48.59 45.66 2.93 70.3 30.5 6.03 2008 161.93 114.75 49.71 47.04 2.67 70.9 30.7 5.37 2009 164.74 117.60 50.90 48.53 2.37 71.4 30.9 4.66 2010 167.52 120.47 52.21 50.12 2.09 71.9 31.2 4.00
Source: Labour Force Survey by Federal Bureau of Statistics and MTDF
In order to forecast employment levels up to the year 2030, the followings two assumptions were made:
• The labour force rate will continue to increase at the same pace as during 2000-2010 and reach 34.2% in 2030.
• The unemployment rate will be maintained at 4% after 2010.
Accordingly, employment in 2030 will be 71 million or 1.64 times the level of employment in 2005, while total population will increase 1.41 times (Table 3.2.10). Therefore, Pakistan has to create 28 million working opportunities in 25 years. The agricultural sector appears to have a limited capacity for new job creation and the consequently the majority of the new workers will have to be absorbed in the secondary and tertiary sectors. This will also accelerate the concentration of people in urban areas
Table 3.2.10 Future Labour Force and Employment
Population Working
Age Population
Labour Force Employed Unemp-
loyed
Working Age Pop.
Rate
Labour Force Rate
Unemploy-ment Rate
Year
(million) (million) (million) (million) (million) (%) (%) (%) 2005 153.96 106.72 46.82 43.22 3.60 69.3 30.4 7.69 2010 167.52 120.47 52.21 50.12 2.09 71.9 31.2 4.00 2015 181.83 131.69 58.04 55.72 2.32 72.4 31.9 4.00 2020 193.44 141.11 63.21 60.68 2.53 72.9 32.7 4.00 2025 204.78 150.45 68.47 65.72 2.74 73.5 33.4 4.00 2030 216.24 160.02 73.93 70.97 2.96 74.0 34.2 4.00
Source: JICA Study Team

Pakistan Transport Plan Study in the Islamic Republic of Pakistan (PTPS)
3-11
(2) Employment by Sector
Based on the industrial classification in Table 3.2.11, the sectoral composition of employment was forecast based on the provincial characteristics in 2002 (Table 3.2.12), and the past and future trend of shares in the industrial sector (Table 3.2.13). In order to make the sum of provincial employment and the sum of the employment by sector tally with the national total, an iteration process was taken. The results are shown in Table 3.2.14 and Figure 3.2.5.
Table 3.2.11 Industry Classification in Pakistan
1. Major Crops 2. Minor Crops 3. Livestock 4. Fishing
Primary Sector
5. Forestry 6.Mining & Quarrying 7. Manufacturing 8. Construction
Commodity Producing Sectors
Secondary Sector
9. Electric and Gas & Water Supply 10. Transport, Storage & Communication 11. Wholesale & Retail Trade 12. Finance & Insurance 13. Ownership of Dwellings 14. Public Administration & Defence
Service Sector Tertiary Sector
15. Community & Social Services Source: MTDF and JICA Study Team
Table 3.2.12 Employment Composition by Province in 2002
Sector Punjub NWFP Balochistan Sindh Pakistan Primary Sector 45.2 40.9 46.0 37.9 43.5 Secondary Sector 21.3 18.1 13.5 20.0 20.3 Tertiary Sector 33.5 41.1 40.6 42.2 36.2 Total 100.0 100.0 100.0 100.0 100.0 Source: Labour Force Survey, 2002
Table 3.2.13 Change in Employment Composition by Industrial Sector
Year/Period Primary Sector
Secondary Sector
Tertiary Sector Total
1990 51.2 19.8 29.0 100.0 1991-95 48.0 18.9 33.1 100.0 1996-00 46.8 17.9 35.3 100.0 2001-05 43.7 20.0 36.2 100.0 2006-10 40.5 20.6 38.9 100.0
2010 38.7 20.7 40.5 100.0 2015 36.1 21.7 42.1 100.0 2020 33.7 22.8 43.5 100.0 2025 31.5 23.9 44.7 100.0 2030 29.4 25.0 45.6 100.0
Source: MTDF and JICA Study Team

Pakistan Transport Plan Study in the Islamic Republic of Pakistan (PTPS)
3-12
Table 3.2.14 Employment by Industrial Sector and by Province Item Year Punjab NWFP Balochistan Sindh Pakistan
2005 87,229 20,920 6,566 30,440 155,444 2010 94,777 24,614 7,596 36,005 169,229 2015 101,645 26,844 8,143 39,466 181,828 2020 106,687 28,891 8,613 42,680 191,169 2025 114,116 30,422 8,911 45,149 204,777
Population
2030 119,075 32,631 9,390 48,641 213,928 2005 27,886 4,820 1,779 8,735 43,220 2010 31,428 5,982 2,130 10,580 50,120 2015 34,708 6,718 2,352 11,942 55,720 2020 37,429 7,429 2,556 13,269 60,683 2025 40,772 7,966 2,693 14,294 65,725
Employed
2030 43,555 8,748 2,905 15,766 70,974 2005 12,546 1,958 814 3,288 18,606 2010 12,812 2,177 879 3,552 19,420 2015 13,234 2,277 909 3,722 20,142 2020 13,349 2,347 926 3,843 20,464 2025 13,579 2,343 913 3,843 20,678
Primary Sector
2030 13,563 2,401 924 3,944 20,832 2005 5,926 869 239 1,740 8,774 2010 6,867 1,097 293 2,134 10,390 2015 7,966 1,288 340 2,511 12,105 2020 9,024 1,491 389 2,911 13,815 2025 10,308 1,671 430 3,270 15,680
Secondary Sector
2030 11,563 1,923 489 3,768 17,743 2005 9,414 1,993 726 3,707 15,840 2010 11,749 2,708 959 4,895 20,310 2015 13,509 3,152 1,103 5,709 23,474 2020 15,057 3,590 1,242 6,514 26,404 2025 16,885 3,951 1,350 7,181 29,367
Tertiary Sector
2030 18,429 4,424 1,492 8,053 32,398 Source: MTDF and JICA Study Team
5,0002,500
500
PrimarySecondaryTertiary
Punjab
N.W.F.P
Sindh
Balochistan
Figure 3.2.5 Employment Composition by Industrial Sectors in 2025

Pakistan Transport Plan Study in the Islamic Republic of Pakistan (PTPS)
3-13
3.3 Economic Growth 3.3.1 Past and Recent GDP Growth
Since the 1980s, the economy of Pakistan has been performing well except for the period of 1995-2000 which was badly affected by the global financial crisis, attaining 5.2 – 7.3% of the 5-year average growth rate. Of particular note is GDP growth of 8.4% per annum in 2004/5.
The increase in GDP between 1980 and 2004 is made up of the primary sector (20%), secondary sector (26%) and tertiary sector (54%), respectively. Over the same period, the primary sector decreased its share of the total GDP by 3.1% and the secondary and teriary sectors increased by 1.9% and 1.2%.
0
1,000
2,000
3,000
4,000
5,000
6,000
7,000
1980
1982
1984
1986
1988
1990
1992
1994
1996
1998
2000
2002
2004
GD
P a
t 200
4/05
pric
e (b
illion
Rp)
TertiarySecondaryPrimary
Source: Pakistan Economic Survey, 1985/6 – 2004/5, elaborated by Study Team
Figure 3.3.1 Trend of GDP Growth by Sector
Table 3.3.1 Past Performance of Economic Growth (Billion Rs. at 2004/05 price)
GDP Primary Sector Secondary Sector Tertiary Sector
Year Billion (Rs)
Average Growth
Rate (%)
Billion (Rs)
Compo- sition (%)
Billion (Rs)
Compo- sition (%)
Billion (Rs)
Compo-sition (%)
1980 1,689 - 418 24.7 393 23.2 879 52.0 1985 2,404 7.3 560 23.3 607 25.2 1,237 51.5 1990 3,295 6.5 801 24.3 790 24.0 1,704 51.7 1995 4,238 5.2 1,036 24.5 985 23.3 2,216 52.3 2000 4,918 3.0 1,157 23.5 1,164 23.7 2,597 52.8 2004 6,130 5.7 1,323 21.6 1,540 25.1 3,267 53.3
Source: Elaborated by Study Team based on Pakistan Economic Survey, 2004-05
3.3.2 Projection of Economic Growth
Due to the recent good performance in economic growth, the Government is aiming for high growth rates over the MTDF period, starting at 7.0% in 2005/06, becoming higher year by year up to 8.2% in 2009/10. The average growth rate over the five years is 7.6%.
As the investment and financial markets are expanding, it is possible that the target may be attained. However, such a high growth is hardly sustained for a long period. The JICA Study Team has prepared three scenarios for the macro-economic framework:
1) High growth scenario: To maintain the average rate of MTDF of 7.6% for 20 years after

Pakistan Transport Plan Study in the Islamic Republic of Pakistan (PTPS)
3-14
2010.
2) Medium growth scenario: The growth rate of 7% will continue until 2010/11, and then start to decline by 0.5% every five years
3) Low growth scenario: The growth rate of 7.0% will decline by 0.5% every year until 2010/11, and will then gradually drop to 3.0% in the year 2025.
Table 3.3.2 and Figure 3.3.2 show the economic growth rates under each scenario.
Table 3.3.2 Economic Growth Scenarios
Annual Growth Rate (%) Year High Medium Low
2005/06 7.0 7.0 7.0 2006/07 7.3 7.0 6.5 2007/08 7.6 7.0 6.0 2008/09 7.9 7.0 5.5 2009/10 8.2 7.0 5.0
2010/11-2014/15 7.6 6.5 4.0 2015/16-2019/20 7.6 6.0 4.0 2020/21-2024/25 7.6 5.5 3.0 2025/26-2029/30 7.6 5.0 3.0
Source: JICA Study Team
0.0
2.0
4.0
6.0
8.0
10.0
2005
2007
2009
2011
2013
2015
2017
2019
2021
2023
2025
2027
2029
Ann
ual G
row
th R
ate
(%)
High Case
Medium Case
Low Case
Figure 3.3.2 Economic Growth Scenario
Under these conditions, the Pakistan economy will grow as shown in Table 3.3.3 and Figure 3.3.3. In the 20 years until 2025, the Pakistan economy will expand by 3.3 times in High Case, 2.5 times in Medium Case, and 1.7 times in Low Case. Accordingly, GDP per Capita will rise from Rs. 42,213 (US$700) to Rs. 139,000 (US$ 2,300) for High Case, Rs. 108,000 (US$1,800) for Medium Case and Rs. 75,000 (US$1,250) for Low Case.
The JICA Study Team used the medium case as the planning base.
Table 3.3.3 Projection of GDP and GDP per Capita by Scenario
High Case Medium Case Low Case Year
Population (million) GDP
(Rs. Billion) GDP per
Capita (Rs.)GDP
(Rs. Billion)GDP per
Capita (Rs.)GDP
(Rs. Billion) GDP per
Capita (Rs.)2005 155.4 6,559 42,213 6,559 42,213 6,559 42,213 2010 169.2 9,513 56,214 9,199 54,361 8,531 50,408 2015 181.8 13,721 75,460 12,604 69,319 10,379 57,079 2020 193.4 19,790 102,304 16,867 87,195 12,627 65,277 2025 204.8 28,543 139,386 22,045 107,652 15,363 75,023 2030 216.2 41,168 190,381 28,135 130,110 18,691 86,438
Note: Projection by JICA Study Team

Pakistan Transport Plan Study in the Islamic Republic of Pakistan (PTPS)
3-15
0
5,000
10,000
15,000
20,000
25,000
30,00035,000
40,000
45,000
2004
2006
2008
2010
2012
2014
2016
2018
2020
2022
2024
2026
2028
2030
Year
GD
P (B
illio
n R
p.)
HighMedium
Low
Note: Projection by JICA Study Team
Figure 3.3.3 Projection of GDP by Scenario
3.4 Freight Transport Demand 3.4.1 Analysis of Major Commodities
(1) Oil and Petrol Products
Pakistan does have some oil reserves and produces crude oil. However, there is an enormous gap between local production and demand: Pakistan imported 7.8 billion tonnes of crude oil in 2003-04 while the export of crude oil was 0.1 billion tonnes in the same year (Pakistan Energy Yearbook).
The consumption of oil products is depicted in Figure 3.4.1. The figure shows that the demand for oil products, mostly petrol and diesel, is insatiable, and is increasing almost unabatedly with the exception of furnace oil, for which demand dropped almost to the half in 2003/04. The demand for kerosene oil has been continually decreasing over the years due to the availability of sui (natural) gas for cooking. Also, the amount of kerosene is relatively small compared to the demand for petrol and diesel.
02468
1012141618
1995-96
1996-97
1997-98
1998-99
1999-00
2000-01
2001-02
2002-03
2003-0
4
2004-05
KeroseneFurnace OilDieselPetrol
Figure 3.4.1 Consumption of oil products in Pakistan (tonnes/year)

Pakistan Transport Plan Study in the Islamic Republic of Pakistan (PTPS)
3-16
(2) Agricultural Products
The agriculture sector accounts for about 90% of the country’s primary sector GDP and in 2004-05 it is estimated to be just over 23% of the GDP. It employs about 43% of the labour force and provides a livelihood for close to two-thirds of the population. The key agricultural products of interest are those which are essential: wheat and rice as the main staples, maize as animal fodder, and other major cash crops such as cotton and sugarcane.
Growth in the agriculture sector growth has been quite variable over the last decade. There are many reasons for these variations, however the main ones are: weather conditions, drought, pest control, effective use of available water, availability of treated and higher quality seeds, and use of fertilizers.
Table 3.4.1 and Table 3.4.2 show the recent trends in the production of the major agricultural products. Crops have increased at a rate of 4.0% p.a. while meat, milk and fish have shown a slightly less growth of 2.8% p.a.
Table 3.4.1 Production of Crops (2000 – 04)
“000” TonnesActual Items
2000-01 2001-02 2002-03 2003-04 ACGR (%)
Grains 25,986 24,310 25,890 26,854 1.1 Wheat 19,024 18,226 19,183 19,500 Rice 4,803 3,882 4,479 4,848 Basmati 1,629 1,999 2,304 2,522 Others 3,174 1,883 2,174 2,326 Maize 1,643 1,664 1,737 1,897 Other Cereals 516 538 491 609 Cash Crops 46,366 50,787 54,694 56,090 6.6 Cotton (Lint) 1,820 1,803 1,737 1,709 (Million Bale) (10.7) (10.6) (10.2) (10.05) Sugarcane 43,606 48,042 52,056 53,491 Tabacco 85 95 88 86 Pulses 621 594 930 871 11.9 Gram 397 362 675 611 Others 224 232 255 260 Oil Seeds 4,085 4,080 3,951 4,160 0.6 Cottonseed 3,640 3,606 3,473 3,418 Rape & Mustard and Canola 231 221 235 238 Sunflower 70 78 131 359 Others 145 175 112 145 Vegetables 6,089 5,990 6,254 6,415 1.8 Potato 1,666 1,731 1,946 1,938 Onion 1,563 1,385 1,428 1,449 Other vegetables 2,860 2,874 2,880 3,028 Fruits 5,892 5,900 5,742 5,712 -1.1Total* 89,039 91,661 97,461 100,102 4.0 Note: * 1 Bale = 0.25 ton Source: MTDF
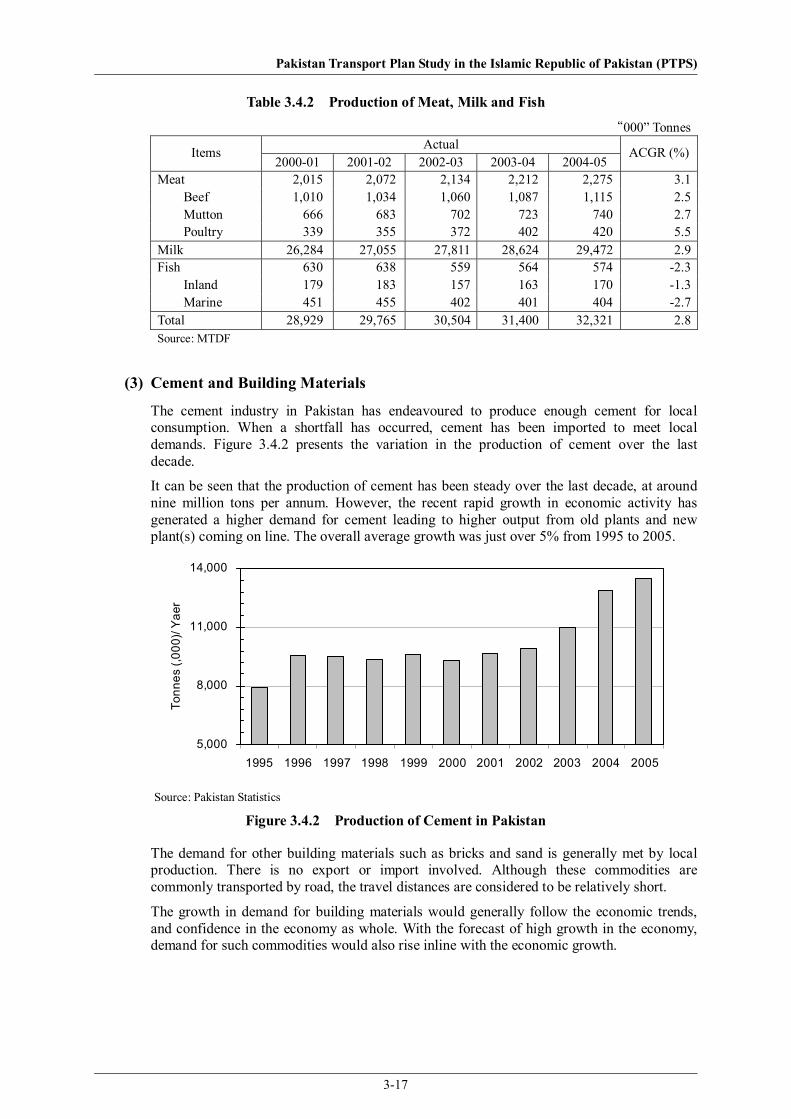
Pakistan Transport Plan Study in the Islamic Republic of Pakistan (PTPS)
3-17
Table 3.4.2 Production of Meat, Milk and Fish
“000” TonnesActual Items
2000-01 2001-02 2002-03 2003-04 2004-05 ACGR (%)
Meat 2,015 2,072 2,134 2,212 2,275 3.1 Beef 1,010 1,034 1,060 1,087 1,115 2.5 Mutton 666 683 702 723 740 2.7 Poultry 339 355 372 402 420 5.5 Milk 26,284 27,055 27,811 28,624 29,472 2.9 Fish 630 638 559 564 574 -2.3 Inland 179 183 157 163 170 -1.3 Marine 451 455 402 401 404 -2.7 Total 28,929 29,765 30,504 31,400 32,321 2.8 Source: MTDF
(3) Cement and Building Materials
The cement industry in Pakistan has endeavoured to produce enough cement for local consumption. When a shortfall has occurred, cement has been imported to meet local demands. Figure 3.4.2 presents the variation in the production of cement over the last decade.
It can be seen that the production of cement has been steady over the last decade, at around nine million tons per annum. However, the recent rapid growth in economic activity has generated a higher demand for cement leading to higher output from old plants and new plant(s) coming on line. The overall average growth was just over 5% from 1995 to 2005.
5,000
8,000
11,000
14,000
1995 1996 1997 1998 1999 2000 2001 2002 2003 2004 2005
Tonn
es (,
000)
/ Yae
r
Source: Pakistan Statistics
Figure 3.4.2 Production of Cement in Pakistan
The demand for other building materials such as bricks and sand is generally met by local production. There is no export or import involved. Although these commodities are commonly transported by road, the travel distances are considered to be relatively short.
The growth in demand for building materials would generally follow the economic trends, and confidence in the economy as whole. With the forecast of high growth in the economy, demand for such commodities would also rise inline with the economic growth.

Pakistan Transport Plan Study in the Islamic Republic of Pakistan (PTPS)
3-18
(4) Manufactured Goods
The proportion of manufactured goods in the volume of freight transported has been increasing as industrialization proceeds. Table 3.4.3 shows the export trends for the major industrial products.
Table 3.4.3 Export Trends for Major Industrial Products (US$ million)
2000-01 2001-02 2002-03 2003-04 ACGR (%) Textile 5,756 5,778 7,225 8,039 11.8 Leather 658 623 621 666 0.4 Chemical 157 153 261 263 18.8 Engineering Goods 194 221 254 262 10.5
Others 684 722 733 743 2.8 Total 7,449 7,497 9,094 9,973 10.2 Source: MTDF
The export of manufactured goods has thus increased at a higher rate than the GDP of Pakistan. If Pakistan’s economy grows at a considerably higher rate than the past decade, then the export of manufactured goods will increase rapidly. This is caused by the synergy of the rising share of the manufacturing industry and the high elasticity in the production of this industry to the entire economic growth, i.e. GDP.
Although this analysis does not necessarily show that the transport demand increases according to the export of manufactured goods, its higher growth should be duly taken into account in the transport demand forecast.
3.4.2 Suggested Growth of Freight Transport Demand up to 2025
Table 3.4.4 summarizes the growth rates (ACGR) assumed in MTDF for production, consumption and export of selected goods. In general, higher growth is assumed for industrial goods rather than agricultural products and raw materials. Also in MTDF, land transport demand for freight is assumed to grow at an average annual rate of 6.3% (10.0% for railway and 6.1% for road) as shown in Table 3.4.5. For the same period, MTDF assumes a growth of GDP at 7.6% a year. This means that the elasticity of land freight traffic demand against GDP is less than 1.0.
The growth rate of land freight traffic demand assumed in MTDF seems to be a little underestimated due to the following reasons:
A. In the past, the land traffic volume has increased at an average annual rate of 8.6% in terms of ton-km from 1990/91 to 2003/04. This is higher than the growth rate of GDP which was 5.2 – 7.3% during the same period.
B. Taking into account the future structural change of Pakistani industries which is only reflected in MTDF, the freight transport demand is likely to increase faster than that projected by MTDF. This is particularly true on a ton-km basis, because the growth of industrial products which move in larger spheres will be higher than agricultural products and raw materials which tend to move within local production/consumption areas.
In conclusion, it is reasonable for PTPS to assume a future demand growth of land freight transport slightly higher than GDP on a ton-km basis, and the same or slightly lower than GDP on a ton basis, as exemplified in Table 3.4.6.

Pakistan Transport Plan Study in the Islamic Republic of Pakistan (PTPS)
3-19
Table 3.4.4 Growth of Production, Consumption and Export assumed for Selected Goods in MTDF, 2004/05-2009/10
2003-04 2009-10 ACGR (%) POL Products Demand (million tons) 16.8 20.7 4.3 Agricultural Products (thousand tons) - Grains 29,476 35,977 3.8 - Cash Crops 49,050 61,056 4.5 - Pulses 1,041 1,561 8.4 - Oil Seeds 5,844 7,493 5.0 - Vegetables 6,988 10,004 7.4 - Fruits 6,000 9,445 9.5 - Meat 2,275 3,124 6.5 - Milk 29,472 43,304 8.0 - Fish 574 725 4.8 Export of Major Industrial products (US$ million) - Textile 8,999 14,528 10.1 - Leather 790 1,347 11.3 - Chemical 300 1,114 30.0 - Engineering Goods 165 920 41.0 - Cement 42 84 14.9 Source: MTDF
Table 3.4.5 Freight Traffic Growth Assumed in MTDF
2003-04 2009-10 ACGR (%) Freight Traffic (Million ton-km) Railway 4,800 8,503 10.0 Road 138,668 198,155 6.1 Total 143,468 206,658 6.3 Source: MTDF
Table 3.4.6 Likely Growth of Land Freight Transport Demand
ACGR (%) 2005 – 2025
Ratio (2025/2005)
Ton-km Basis 6.2 – 7.2 3.3 – 4.0 Ton Basis 5.2 – 6.2 2.8 – 3.3
GDP Growth (Medium Case)
6.2 3.4
Note: Assumption by JICA Study Team

Pakistan Transport Plan Study in the Islamic Republic of Pakistan (PTPS)
3-20
3.5 Future Motorization 3.5.1 Increase of Vehicles
The historical trend in the number of vehicles in Pakistan fits well with the trend in GDP as shown in Figure 3.5.1. The linear models in Table 3.5.1 were obtained by regression analysis and the correlation coefficients were high enough to use the models for the projection. Using the medium growth case, stated in the section 2 of this chapter (4.2), for the future economic growth, the future numbers of vehicles were estimated by the models as shown in Figure 3.5.2 and Table 3.5.1.
(1) Car
0
500
1,000
1,500
2,000
3,500 4,000 4,500 5,000 5,500 6,000 6,500
GDP (Rs. Billion)
No.
of
Cars
(10
00)
Actual
Theoretical
(2) Truck
0
50
100
150
200
250
300
3,500 4,500 5,500 6,500
GDP (Rs. billion)
No. of
Tru
cks
(1000) Actual
Theoretical
(3) Bus
0
20
40
60
80
100
120
140
3,500 4,000 4,500 5,000 5,500 6,000 6,500
GDP (Rs. Billion)
No. of
Buses (
1000) Series1
Series2
Source: JICA Study Team
Figure 3.5.1 Correlation between Number of Vehicles and GDP
Table 3.5.1 Regression Equation of Number of Vehicles on GDP Vehicle
Type Regression Equation Correlation Coefficient (R)
Car Y = 2198.89 Ln(X1) -247.719Ln(X2) - 17423.6 0.9799 Truck Y = 0.055452 X1 – 70.5714 0.9707 Bus Y = 0.024867 X1 – 37.1298 0.9565 Y: No. of Vehicle (1000unit), X1: GDP (Rs million at 2005 price), X2: Dummy variable (1.0 for year 1996 to 2000 and 1.0 for other years)
Source: JICA Study Team
0
1,000
2,000
3,000
4,000
5,000
6,000
2004
2006
2008
2010
2012
2014
2016
2018
2020
2022
2024
2026
2028
2030
Year
No.
of V
ehic
les
(100
0 un
it)
Car
Truck
Bus
Source: JICA Study Team
Figure 3.5.2 Future Increase of Vehicle Fleet in Pakistan
In 2005, the number of cars used in Pakistan is estimated at 1.9 million and this is predicted to increase to 4.6 million, 2.4 times the present quantity, by 2025. In the same way, the number of trucks is predicted to increase by 3.9 times from 293,000 units to 1,152,000 units and the number of buses is predicted to increase by 4.0 times from 126,000 units to 511,000 units.
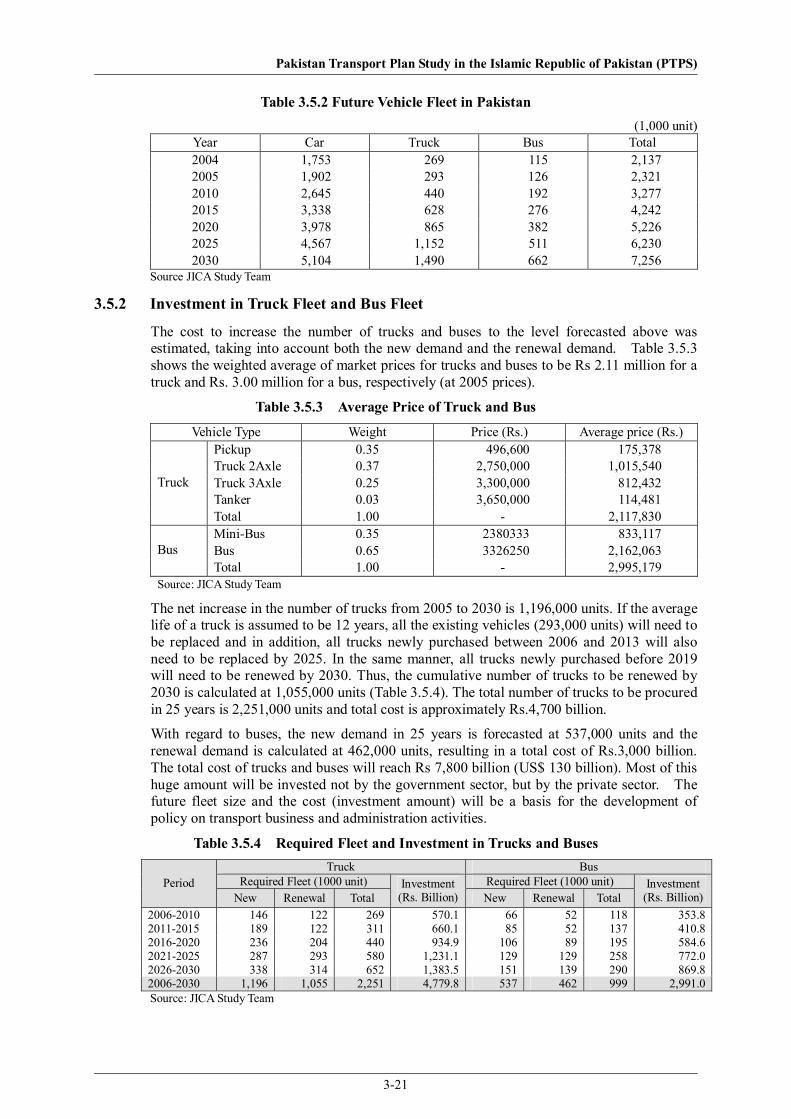
Pakistan Transport Plan Study in the Islamic Republic of Pakistan (PTPS)
3-21
Table 3.5.2 Future Vehicle Fleet in Pakistan (1,000 unit)
Year Car Truck Bus Total 2004 1,753 269 115 2,137 2005 1,902 293 126 2,321 2010 2,645 440 192 3,277 2015 3,338 628 276 4,242 2020 3,978 865 382 5,226 2025 4,567 1,152 511 6,230 2030 5,104 1,490 662 7,256
Source JICA Study Team
3.5.2 Investment in Truck Fleet and Bus Fleet
The cost to increase the number of trucks and buses to the level forecasted above was estimated, taking into account both the new demand and the renewal demand. Table 3.5.3 shows the weighted average of market prices for trucks and buses to be Rs 2.11 million for a truck and Rs. 3.00 million for a bus, respectively (at 2005 prices).
Table 3.5.3 Average Price of Truck and Bus
Vehicle Type Weight Price (Rs.) Average price (Rs.) Pickup 0.35 496,600 175,378 Truck 2Axle 0.37 2,750,000 1,015,540 Truck 3Axle 0.25 3,300,000 812,432 Tanker 0.03 3,650,000 114,481
Truck
Total 1.00 - 2,117,830 Mini-Bus 0.35 2380333 833,117 Bus 0.65 3326250 2,162,063 Bus Total 1.00 - 2,995,179
Source: JICA Study Team
The net increase in the number of trucks from 2005 to 2030 is 1,196,000 units. If the average life of a truck is assumed to be 12 years, all the existing vehicles (293,000 units) will need to be replaced and in addition, all trucks newly purchased between 2006 and 2013 will also need to be replaced by 2025. In the same manner, all trucks newly purchased before 2019 will need to be renewed by 2030. Thus, the cumulative number of trucks to be renewed by 2030 is calculated at 1,055,000 units (Table 3.5.4). The total number of trucks to be procured in 25 years is 2,251,000 units and total cost is approximately Rs.4,700 billion.
With regard to buses, the new demand in 25 years is forecasted at 537,000 units and the renewal demand is calculated at 462,000 units, resulting in a total cost of Rs.3,000 billion. The total cost of trucks and buses will reach Rs 7,800 billion (US$ 130 billion). Most of this huge amount will be invested not by the government sector, but by the private sector. The future fleet size and the cost (investment amount) will be a basis for the development of policy on transport business and administration activities.
Table 3.5.4 Required Fleet and Investment in Trucks and Buses Truck Bus
Required Fleet (1000 unit) Required Fleet (1000 unit) Period New Renewal Total
Investment(Rs. Billion) New Renewal Total
Investment (Rs. Billion)
2006-2010 146 122 269 570.1 66 52 118 353.8 2011-2015 189 122 311 660.1 85 52 137 410.8 2016-2020 236 204 440 934.9 106 89 195 584.6 2021-2025 287 293 580 1,231.1 129 129 258 772.0 2026-2030 338 314 652 1,383.5 151 139 290 869.8 2006-2030 1,196 1,055 2,251 4,779.8 537 462 999 2,991.0
Source: JICA Study Team

Pakistan Transport Plan Study in the Islamic Republic of Pakistan (PTPS)
4-1
Chapter 4. TRANSPORT DEMAND PROJECTION
4.1 Demand Forecast Methodology 4.1.1 Process of Demand Forecast
As the model for the previous JICA Study was found to provide a good projection of traffic demand, the same approach as the previous study was applied for the demand forecast. The previous JICA Study projected transport volumes in 2005/06 to be 339 billion passenger- km (BPK) and 89.3 billion ton-km (BTK). On the other hand, the estimated volumes will be lower than the actual ones in 2005/06, which was estimated at 162.12 BTK in the MTDF. However, considering the difference between the estimated GDP and actual GDP, the forecast model for passenger transport can project the future transport volume well.
Using a regression analysis, the future passenger-km and ton-km of land transport were estimated as a control total for growth scenarios. Meanwhile, the future trip distribution (passenger and freight O/D tables) was estimated using the four-step forecast method, and passenger-km and ton-km were calculated from the O/D tables. Subsequently, the O/D tables were adjusted so that the passenger-km and ton-km coincide with that of the control total. The traffic volume on roads was calculated based on the adjusted O/D tables using the traffic assignment model. Figure 4.1.1 illustrates the process adopted for the demand forecast.
Figure 4.1.1 Process followed for the Demand Forecast
Traffic demand for air transport was estimated separately because the impact of air transport on land transport was expected to be low in the future.
Trip Generation/ Attraction (Passenger and Freight)
Trip Distribution (Passenger and Freight O/D)
Fratar Method
Passenger and Freight O/D by Mode (tentative)
Modal Split
Passenger-kms and ton-kms
Passenger and Freight O/D by Mode
Adjustment
Traffic volume of road and rail network
Future O/D Transport Volume Indicators
Traffic Assignment

Pakistan Transport Plan Study in the Islamic Republic of Pakistan (PTPS)
4-2
4.1.2 Traffic Survey
A reliable nationwide vehicle O/D matrix, representing an origin-destination pattern of vehicle trips in a country, is valuable information for the projection of traffic demand. In order to make the nationwide O/D matrix for Pakistan, the Study Team carried out a nationwide traffic survey during August and September 2005. The survey consisted of a Roadside O/D Interview Survey (RIS) at 100 locations, a Manual Classified Traffic Count Survey at the same 100 locations and other supplemental surveys. The survey locations were selected from the points where major roads cross district boundaries in accordance with the zoning system applied in PTPS. The survey was undertaken over a period of 16 hours, between 6:00 and 22:00. From RIS, more than 75,000 samples were collected, and the average sampling rate amounted to 34.9%. Districts are the minimum level of information on origins and destinations in the RIS data.
4.1.3 Zoning System
The demand forecast for road transport was carried out based on the PTPS Zoning System, with 45 traffic analysis zones including 39 zones in Pakistan and 6 zones in the external area as shown in Figure 4.1.2. A district is the minimum unit of a traffic analysis zone. Since it is necessary to catch all of the traffic crossing the borders of the traffic analysis zones, districts were merged when too many roads were found to cross the boundary between them. The list of districts for each traffic zones is shown in Table 4.1.1.
26
3925
23
6
21
32
18
42
45
44
41
30
15
14
34
28
5
20
31
19
27
13
24
33
29
22
37
17
36
1210
11
16
35
71
2
3
43
40
4
9
838
China
Iran India, North
India, South
Afghanistan,Kabul
Afghanistan,Kandahar
Figure 4.1.2 PTPS Zoning

Pakistan Transport Plan Study in the Islamic Republic of Pakistan (PTPS)
4-3
Table 4.1.1 Traffic Analysis Zone and District Traffic Zone District Traffic Zone District
Province No. Name Name Code Province No. Name Name CodeNWFP 1 Malakand Malakand 174 Panjab 20 Multan Multan 261
Upper Dir 175 Vehari 262Lower Dir 176 Khanewal 264Swat 177 Lodhran 265Chitral 179 21 Bahawalpur Bahawalnagar 282Bajaur Agency (TA) 180 Bahawalpur 281Shangla 178 22 Rahim Yar Khan Rahim Yar Khan 283
2 Mansehra Abbottabad 141 Balochistan 23 Loralai Zhob 421Haripur 142 Killa Saifullah 422Mansehra 143 Loralai 423Kohistan 151 Musakhel 424Bat Gram 152 Barkhan 425
3 Peshawar Peshawar 111 24 Quetta Quetta 411Nowshera 112 Pishin 412Charsada 113 Qilla Abdullah 413Khyber Agency (TA) 114 39 Chagai Chagai 414Mardan 121 25 Dera Bugti Sibi 431Swabi 122 Kohlu 432Bunar 123 Derabuqti 433Mohmand Agency (TA) 181 Ziarat 434
4 Kohat Kohat 131 Nasirabad 441Hangu 132 Jafarabad 442Karak 133 Bolan 443Orakzai Agency (TA) 134 Jhalmagsi 444Kurram Aqency (TA) 135 26 Khuzdar Kalat 451
5 Bannu Bannu 171 Khuzdar 452Lakki 172 Kharan 453North Waziristan (TA) 173 Awaran 454
6 D.I. Khan Dera Ismail Khan 161 Mastung 455Tank 162 Turbat/ Kech 461South Waziristan (TA) 163 Gwadar 462
North 7 Gilgit Gilgit Northern Areas 471 Panjgoor 463Area Azad Jamu & Kashmir 481 27 Lasbella Lasbella 456Panjab 8 Islamabad Islamabad 211 Sindh 28 Shikarpur Shikarpur 322
Rawalpindi 212 Jaccobabad 32338 Attock Attock 213 Larkana 3219 Jhelum Jhelum 214 29 Sukkur Sukkur 311
Chakwal 215 Ghotki 31510 Gujrat Gujrat 252 30 Dadu Dadu 334
Mandi Bahauddin 255 31 Khaipur Khairpur 31211 Sargodha Sargodha 221 36 Nawabshah Nausheroferoz 31312 Khushab Khushab 222 Nawabshah 31413 Mianwali Mianwali 223 37 Sanghar Sanghar 344
Bhakkar 224 32 Tharparkar Mirpur Khas 34114 Sheikhupura Sialkot 253 Tharparkar 342
Narowal 254 Umer Kot 343 Gujranwala 251 33 Hyderabad Hyderabad 331 Hafizabad 256 Badin 332 Sheikhupura 243 34 Thatta Thatta 333
15 Faisalabad Faisalabad 231 35 Karachi Karachi 351 Toba Tek Singh 233 Jhang 232 Traffic Zone
16 Lahore Lahore 241 No. Name Code Kasur 242 Foreign 44 India (Panjub) 501
17 Sahiwal Okara 244 45 India (Sind) 502
Sahiwal 263 40 Afghanistan (Kabul) 511 Pakpattan 266 41 Afghanistan (Kandahar) 513
18 D.G.Khan Dera Ghazi Khan 271 42 Iran 521 Rajanpur 273 43 China 531
19 Muzaffaragarh Muzaffargarh 272 Layyah 274
Source: JICA Study Team

Pakistan Transport Plan Study in the Islamic Republic of Pakistan (PTPS)
4-4
4.1.4 Making the Present O/D Matrices
(1) Overall Steps
The O/D matrices of road traffic for passenger and freight were created according to the steps shown in Figure 4.1.3.
Figure 4.1.3 Overall Steps for Creating O/D Matrices
(2) Site O/D Matrix
A Site O/D Matrix means an O/D matrix at each survey site, having information of origin, destination, the number of vehicles by vehicle type, the number of passengers by vehicle type, and freight volume by commodity category1. The vehicle and passenger O/D were created from field data by multiplying each interview record by multiplying expansion factors at each site. The average payload of truck by vehicle type by commodity type was calculated from RIS data, and was used to calculate the freight volume in a Site O/D Matrix.
In principal, the field data should be adjusted by several factors such as daily fluctuation and seasonal fluctuation. However, since there are not enough traffic data to estimate such fluctuation factors in Pakistan, the field data were directly applied to make Site O/D Matrices.
(3) District-wise O/D Matrix
If the boundary of a TAZ forms a cordon line, the O/D table relating to the TAZ can be directly calculated by adding up O/D tables on the cordon line. On the other hand, an O/D pair can be calculated using several lines that can catch the all traffic relating the O/D pair as shown in Figure 4.1.4. In such case, each O/D pair between two districts was calculated as the average of O/D pairs on such kind of lines (“screen line”), and a district-wise O/D matrix was produced from all O/D pairs. This O/D matrix includes not a few blanks because not all inter-district traffic was recorded in the RIS.
1 100 Commodity types in RIS are grouped into 30 categories.
RIS & MCC (100 sites)
Site O/D (100 sites)
District-wise O/D Matrix
TAZ O/D Matrix (Road)

Pakistan Transport Plan Study in the Islamic Republic of Pakistan (PTPS)
4-5
B
Line-1
Line-2
Line-3Line-4
ASurvey Point
The O/D pair between “A” Zone and “B” Zone can be calculated using Line-1, Line-2, Line-3, and Line-4. This creates four different O/D pairs that must be equal ideally.
Figure 4.1.4 Example for O/D Pair Calculation
(4) TAZ O/D Matrix
The O/D matrix for a traffic analysis zone (TAZ) was produced from the district-wise O/D matrix by merging district zones.
Figure 4.1.5 illustrates desired lines taken from the O/D matrix, based on the PTPS zoning system (45 zones).
Figure 4.1.5 Vehicle Trip Distribution (2005)

Pakistan Transport Plan Study in the Islamic Republic of Pakistan (PTPS)
4-6
4.1.5 Comparison of O/D data
Figure 4.1.6 shows the number of vehicle trips calculated in JICA Studies for 1985/86, 1992/93 and 2005 (PTPS). The vehicle trips increased from 69,896 trips/ day in 1985/86 to 152,502 trips/ day in 1992/03 and 277,353 trips in 2005 as shown in Table 4.1.2. Although an annual growth rate of 5.1% shows a similar increase in passenger-km and freight ton-km, the increase in the number of bus trips is very high at 9.9% while that of trucks is low at 2.1%.
050
100150200250300
1985/86 1992/93 2005
'000
trip
s/da
y
Car Bus Truck
Figure 4.1.6 Vehicle Trips
Table 4.1.2 Comparison of Vehicle OD Tables (Trips/day)
Year Car Bus Truck Total Survey 1985-86 33,100 17,587 19,209 69,896 JICA
1990 60,054 16,026 44,563 120,643 NTRC 1992-93 76,377 22,389 53,736 152,502 JICA
* 5.1% 9.9% 2.1% 5.1% 2005 139,328 69,236 68,789 277,353 PTPS
Note: 1) * Figures with % show annual growth rate. 2) PTPS Data of the year 2005 is regarded as the data of 2004-05 3) Zoning system is different among NTRC, the previous JICA Study, and PTPS
Figure 4.1.7 illustrates the number of passenger and freight trips by road. The number of passenger trips by road increased from 1.48 trips/day in 1992/93 to 2.24 trips/day in 2005 at an annual growth rate of 3.5%. The lower growth rate for passenger trips than for bus trips reflects the significant increase in minibuses (wagons) compared to large buses. The volume of freight being transported increased from 322 tons/day in 1992-93 to 710 tons/day in 2005 at an annual growth rate of 6.8%. The higher growth rate is due to the increase in the average load per truck from 6.0 tons /truck to 10 tons/ truck.
Passenger
851
1479
2234
0
500
10001500
2000
2500
1985/86 1992/93 2005
000
trips
/day
Freight
116
322
710
0
200
400
600
800
1985/86 1992/93 2005
000
tons
/day
Figure 4.1.7 Passenger Trips and Freight Trips (Road)

Pakistan Transport Plan Study in the Islamic Republic of Pakistan (PTPS)
4-7
4.2 Projection of Transport Volume Indicators 4.2.1 Overall Land Transport Demand
Passenger-km and ton-km have been estimated as important indicators of transport volumes for transport demand analysis and strategic targets for the transport sector in Pakistan. The average growth rate of passenger-km in the period was higher (at 4.8%) than that of ton-km (at 4.4%). The growth rates had been higher than the GDP growth rate prior to 2000/01, while they were lower than the GDP growth rates over the recent four years as shown in Figure 4.2.1. The average growth rates for passenger-km and ton-km between 1994/95 and 2000/01 were 5.8% and 5.2%, respectively. For the same two measures the growth rates between 2000/01 and 2003/04 were 3.4% and 3.2% respectively. Since these indicators have a strong relationship to GDP, passenger-km and ton-km were estimated using a regression model.
0.80.9
11.11.21.31.41.51.6
FY93-94
FY94-95
FY95-96
FY96-97
FY97-98
FY98-99
FY99-00
FY00-01
FY01-02
FY02-03
FY03-04
Passenger Freight GDP
Note: Passenger-km and Freight ton-km are taken from Economic Survey, 2004.
Figure 4.2.1 Increase in Land Transport Volume and GDP (1.0 in FY94-95)
The regression model for projecting passenger-km used data for the past 20years between 1980/01 and 2003/04 as shown in Figure 4.2.2.
y = 40.939x + 12560R2 = 0.979
0
50,000
100,000
150,000
200,000
250,000
300,000
0 1000 2000 3000 4000 5000 6000GDP (billion Rs.)
Mill
ion
Pass
enge
r-K
ms
Source: Economic Survey 2004 (Passenger-kms), JICA Study Team (GDP)
Figure 4.2.2 Regression Analysis for Passenger-Kms
As freight transport showed a sharp increase in the late 1990’s unlike passenger transport (refer Figure 2.2.4 in Chapter 2), the recent data between 1993/94 and 1994/95 was used to estimate the slope of the linear model. Values from 2001/02 to 2004/04 were not used

Pakistan Transport Plan Study in the Islamic Republic of Pakistan (PTPS)
4-8
because they did not appear to follow the trend. The linear with the same slope intersecting the point of 2003/04 was applied as the projection model for freight transport as shown in Figure 4.2.3.
y = 29.201x - 35500R2 = 0.9653
0
50,000
100,000
150,000
3500 4000 4500 5000 5500 6000 6500GDP (billion Rs.)
Mill
ion
Ton-
kms
same slope
2003/042002/032001/02
ProjectionModel
Source: Economic Survey 2004 (Passenger-kms), JICA Study Team (GDP)
Figure 4.2.3 Regression Analysis for Ton-Kms
The projection model was used to estimate the future transport volumes based on the medium growth scenario as shown in Table 4.2.1.
Table 4.2.1 Projection of Land Transport Demand Year Passenger-kms
(Million Passenger-kms) Ton-kms
(Million Ton-kms) X (billion Rs.)
GDP at 04/05 price
40.939x + 12,560 29.02(x – 5,657) + 119,040
2005-06 294,785 141,660 6,559 2010-11 438,131 207,881 9,199 2015-16 622,967 293,268 12,604 2020-21 854,406 400,185 16,867 2025-26 1,135,494 530,037 22,045 2030-31 1,466,149 682,787 28,135
Annual Growth Rate 05/06 – 10/11 8.25% 7.97% 7.00% 10/11 – 25/26 6.55% 6.44% 6.00%
Source: JICA Study Team
4.2.2 Inter-zonal Transport Volume
Inter-zonal transport is that which crosses traffic zone boundaries, and has been incorporated into demand forecast models in the previous JICA Studies (1983, 1998, and 1995). The inter-zonal transport volume is less than the overall transport volume both in terms of passenger-km and ton-km. As a whole, the proportion of inter-zonal transport to the overall transport volume tends to decline as shown in Table 4.2.2. The sharp drop in the proportion between 1992/93 and 2005/06 is the result of an unnatural increase in freight ton-km in 1992 and 1993.

Pakistan Transport Plan Study in the Islamic Republic of Pakistan (PTPS)
4-9
Table 4.2.2 Share of Interzonal Traffic (%)
Passenger-kms Ton-kms Road Rail Total Road Rail Total
1980-81 0.554 0.912 0.626 0.907 0.984 0.930 1985-86 0.473 0.938 0.542 0.789 1.000 0.838 1992-93 0.526 0.967 0.576 0.774 0.979 0.803 2005-06 0.473 0.950* 0.524 0.659 0.950* 0.700
Source: NTPS JICA in 1983, 1988, and 1995, and this study Note: * Assumption
It is expected that the large cities will continue to grow and the number of trips will increase within traffic zones at a higher rate than inter-zonal trips. On the other hand, trade and industrial trips will also grow at a rate that will be able to support economic growth. Therefore, the proportion of inter-zonal trips will decrease to some extents; however this is anticipated to be at a low rate. The future inter-zonal transport volume is projected using the estimated proportion of inter-zonal transport as shown in Table 4.2.3.
Table 4.2.3 Projection of the Future Interzonal Transport (Million Passenger-kms/ Million Ton-kms)
Passenger-kms Ton-kms Total Interzonal Ratio Total Interzonal Ratio
2010-11 438,131 212,494 0.485 207,881 133,044 0.640 2015-16 622,967 292,794 0.470 293,268 184,759 0.630 2025-26 1,135,494 516,650 0.455 530,037 328,623 0.620 2030-31 1,466,149 667,098 0.455 682,787 423,328 0.620
Source: JICA Study Team
4.3 Future O/D Table 4.3.1 Trip Generation and Attraction
The volumes of passenger trips and freight trips were based on the estimation of Regional Gross Domestic Products (RGDP), assuming that the volumes will increase in proportion to the increase in RGDP. The volume at each traffic zone was adjusted by the estimation of the total passenger-km and ton-km.
4.3.2 Trip Distribution
Tentative future OD matrices were estimated by the fratar method using the present O/D matrices and the estimated trip generation and attraction. Passenger-km and ton-km were calculated from the tentative matrices and adjusted to meet the estimated volume of inter-zonal transport. In order to convert passenger volumes and freight volumes to the number of vehicles, it was assumed that the present modal share, passenger occupancy rate, and average loading of a truck will be the same in the future. Figure 4.3.1 illustrates the results from the projection of the trip distribution.

Pakistan Transport Plan Study in the Islamic Republic of Pakistan (PTPS)
4-10
Passenger Trip Distribution Freight Trip Distribution
Figure 4.3.1 Desired Line of Road Transport (Projection)
2010-11 2010-11
2015-16 2015-16
2025-26 2025-26

Pakistan Transport Plan Study in the Islamic Republic of Pakistan (PTPS)
4-11
4.3.3 Modal Share between Road and Rail
(1) Past Trend of Railway Transport
Passenger transport by rail in passenger-km increased at an annual rate of 3.5% from 1993-04 to 2003-04. Although this was lower than the annual growth rate of passenger transport by road (which was 5.0% in the same period), passenger transport by rail showed steady growth in the last ten years. On the other hand, freight transport decreased in the same period at an annual rate of –2.1%. The volume reached its lowest level at 3.75 billion ton-km in 1999/2000, and began to increase at an annual growth rate of 6.0% over recent years (Figure 4.3.2).
0.000.200.400.600.801.001.201.401.60
90-91
91-92
92-93
93-94
94-95
95-96
96-97
97-98
98-99
99-00
00-01
01-02
02-03
03-04
04-05
Freight ton-km Passenger-km
Source: Pakistan Railways
Figure 4.3.2 Increase in Transport Volume by Rail (1.0 in 1993-94)
This does not necessarily mean that “demand” for freight transport by rail is essentially small, because transport demand by rail is strongly affected by the level of service of the railway system.
(2) Comparison of Transport Cost between Road and Rail
a) Unit Cost In order to realize the system optimization that minimizes the total transport cost, rail and road should properly share the entire transport demand in accordance to their characteristics of cost performance. Research on optimization and policy measures to guide the demand toward the optimal share are essential for a successful multi-modal transport system.
Comparison of unit costs between railway and road transportation can give a suggestion for realization of the optimal modal share. Table 4.3.1 shows the unit costs1 of the PR under the current situation. According to Table 4.3.1, the unit costs for both passenger services and freight services are calculated at around Rs. 0.5.
1 In this analysis, the “Unit Costs” are assumed to be composed of the “Ordinary Working Expenses” and the “Allocation of
Depreciation Reserve”.
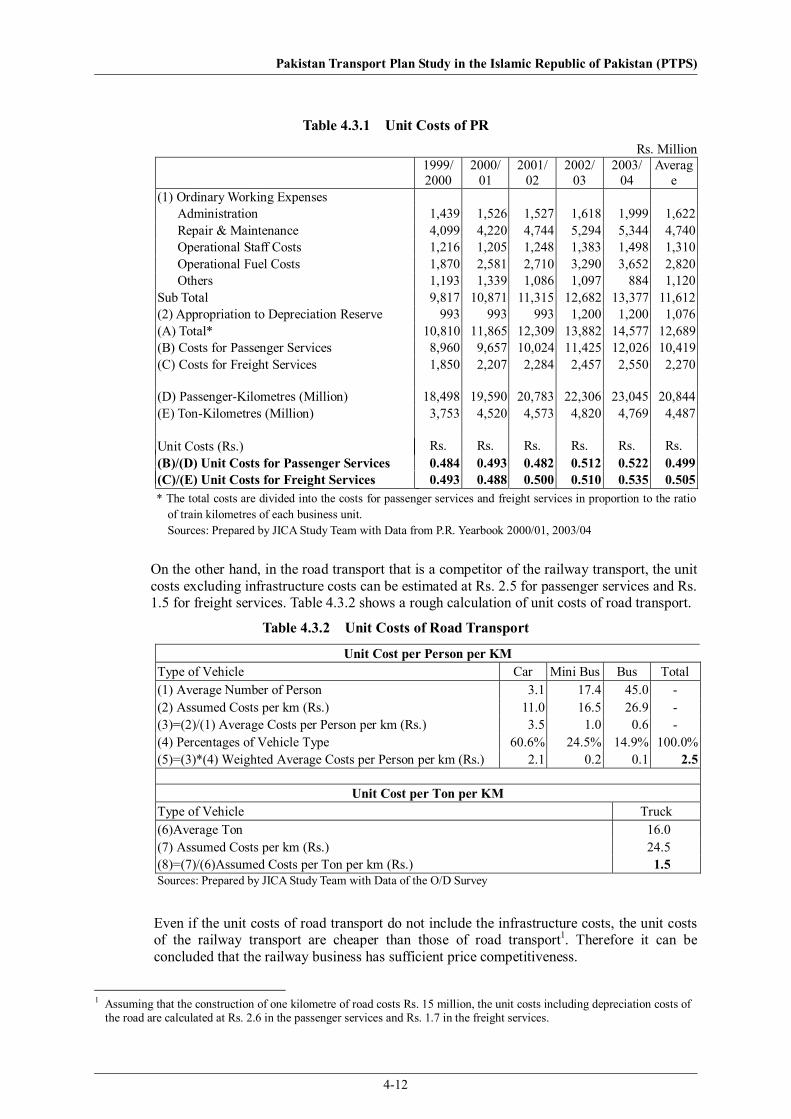
Pakistan Transport Plan Study in the Islamic Republic of Pakistan (PTPS)
4-12
Table 4.3.1 Unit Costs of PR Rs. Million
1999/2000
2000/01
2001/02
2002/ 03
2003/ 04
Average
(1) Ordinary Working Expenses Administration 1,439 1,526 1,527 1,618 1,999 1,622 Repair & Maintenance 4,099 4,220 4,744 5,294 5,344 4,740 Operational Staff Costs 1,216 1,205 1,248 1,383 1,498 1,310 Operational Fuel Costs 1,870 2,581 2,710 3,290 3,652 2,820 Others 1,193 1,339 1,086 1,097 884 1,120 Sub Total 9,817 10,871 11,315 12,682 13,377 11,612 (2) Appropriation to Depreciation Reserve 993 993 993 1,200 1,200 1,076 (A) Total* 10,810 11,865 12,309 13,882 14,577 12,689 (B) Costs for Passenger Services 8,960 9,657 10,024 11,425 12,026 10,419 (C) Costs for Freight Services 1,850 2,207 2,284 2,457 2,550 2,270 (D) Passenger-Kilometres (Million) 18,498 19,590 20,783 22,306 23,045 20,844(E) Ton-Kilometres (Million) 3,753 4,520 4,573 4,820 4,769 4,487
Unit Costs (Rs.) Rs. Rs. Rs. Rs. Rs. Rs. (B)/(D) Unit Costs for Passenger Services 0.484 0.493 0.482 0.512 0.522 0.499 (C)/(E) Unit Costs for Freight Services 0.493 0.488 0.500 0.510 0.535 0.505 * The total costs are divided into the costs for passenger services and freight services in proportion to the ratio
of train kilometres of each business unit. Sources: Prepared by JICA Study Team with Data from P.R. Yearbook 2000/01, 2003/04
On the other hand, in the road transport that is a competitor of the railway transport, the unit costs excluding infrastructure costs can be estimated at Rs. 2.5 for passenger services and Rs. 1.5 for freight services. Table 4.3.2 shows a rough calculation of unit costs of road transport.
Table 4.3.2 Unit Costs of Road Transport
Unit Cost per Person per KM Type of Vehicle Car Mini Bus Bus Total(1) Average Number of Person 3.1 17.4 45.0 - (2) Assumed Costs per km (Rs.) 11.0 16.5 26.9 - (3)=(2)/(1) Average Costs per Person per km (Rs.) 3.5 1.0 0.6 - (4) Percentages of Vehicle Type 60.6% 24.5% 14.9% 100.0%(5)=(3)*(4) Weighted Average Costs per Person per km (Rs.) 2.1 0.2 0.1 2.5
Unit Cost per Ton per KM Type of Vehicle Truck (6)Average Ton 16.0 (7) Assumed Costs per km (Rs.) 24.5 (8)=(7)/(6)Assumed Costs per Ton per km (Rs.) 1.5 Sources: Prepared by JICA Study Team with Data of the O/D Survey
Even if the unit costs of road transport do not include the infrastructure costs, the unit costs of the railway transport are cheaper than those of road transport1. Therefore it can be concluded that the railway business has sufficient price competitiveness.
1 Assuming that the construction of one kilometre of road costs Rs. 15 million, the unit costs including depreciation costs of
the road are calculated at Rs. 2.6 in the passenger services and Rs. 1.7 in the freight services.

Pakistan Transport Plan Study in the Islamic Republic of Pakistan (PTPS)
4-13
b) Transport Cost by Distance
The unit cost of freight transport per kilometre by rail (Pakistan Railways) is calculated at Rs. 0.51 from ordinary working expenses and depreciation of the Pakistan Railways as shown in Table 4.3.3. The ordinary working expenses consist of administration, repair & maintenance, operation fuels, operation staff, and other expenses.
Table 4.3.3 Calculation of Transport Cost per Kilometre by Rail Average ordinary working expense and depreciation (2000/01-03/04)
Average train kilometres
(2000/01-03/04)
Train Operating Cost
per train-km
Average Tons carried by train (2000/01-03/04)
Transport unit cost by rail per
kilometre
(a) (b) (c) = (a)/(b) (d) (c)/(d) Rs. Million Million train-km Rs. per train-km Tons per train Rs. /ton /km
13,158 37.335 352.4 692 0.509 P.R. Yearbook P.R. Yearbook - P.R. Yearbook -
Note: PTPS calculation with data from Pakistan Railways Yearbooks
The vehicle operating costs of a truck carrying 15 tons of cargo was estimated at about Rs. 21 per kilometre (Refer to Annex G). From this, the unit cost of freight transport by road can be estimated at Rs. 1.4 /ton/km.
Loading and unloading costs of a truck are roughly in the range of Rs. 50 to 80 per ton. It is assumed that those costs of a railway are in the range of Rs. 30 to 48 per ton. Freight transport by rail requires additional loading and unloading by feeder trucks.
Figure 4.3.3 illustrates the transport costs by road and rail by distance. The costs include operating costs, maintenance & management costs, and loading& unloading costs. Cargo holding costs at warehouses or terminals are excluded. On this basis, it can be said that distances between 250– 500km are in the competitive range.
Source: JICA Study Team
Figure 4.3.3 Comparison of Economic Cost between Truck and Railway
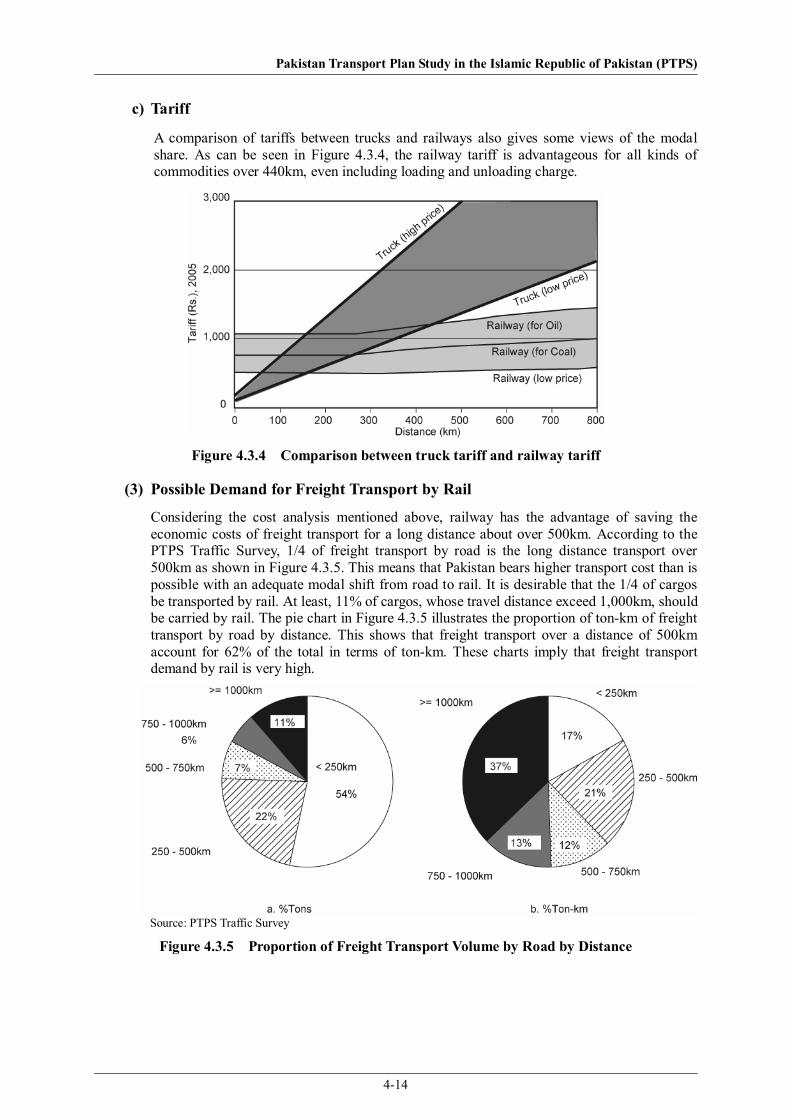
Pakistan Transport Plan Study in the Islamic Republic of Pakistan (PTPS)
4-14
c) Tariff
A comparison of tariffs between trucks and railways also gives some views of the modal share. As can be seen in Figure 4.3.4, the railway tariff is advantageous for all kinds of commodities over 440km, even including loading and unloading charge.
Figure 4.3.4 Comparison between truck tariff and railway tariff
(3) Possible Demand for Freight Transport by Rail
Considering the cost analysis mentioned above, railway has the advantage of saving the economic costs of freight transport for a long distance about over 500km. According to the PTPS Traffic Survey, 1/4 of freight transport by road is the long distance transport over 500km as shown in Figure 4.3.5. This means that Pakistan bears higher transport cost than is possible with an adequate modal shift from road to rail. It is desirable that the 1/4 of cargos be transported by rail. At least, 11% of cargos, whose travel distance exceed 1,000km, should be carried by rail. The pie chart in Figure 4.3.5 illustrates the proportion of ton-km of freight transport by road by distance. This shows that freight transport over a distance of 500km account for 62% of the total in terms of ton-km. These charts imply that freight transport demand by rail is very high.
Source: PTPS Traffic Survey
Figure 4.3.5 Proportion of Freight Transport Volume by Road by Distance

Pakistan Transport Plan Study in the Islamic Republic of Pakistan (PTPS)
4-15
(4) Target Modal Share of Freight Transport
Estimating the modal share of freight largely depends on the extent to which the railway will be improved as the existing railway capacity is insufficient. The economic cost analysis shows that the economic cost of freight transport by rail for 1,000km is only 30 – 40% of that by road transport, even inclusive of feeder transport cost and loading/ unloading cast at terminals. The cost analysis for tariff shows that transporting freight by rail is advantageous where the transport distance is over 440km. This is consistent for all kinds of commodities and takes into account loading and unloading costs.
In the light of the cost analysis, PTPS sets a target modal share as follows:
Table 4.3.4 Target Railway Share of Freight Transport by Transport Distance
Year 1,000km 2,000km 2015 30% 50% 2025 50% 80%
Note: PTPS Recommendation
The logit choice model was applied to make a function that calculates the railway share by travel distance of freight transport. The formula is:
)exp(1
1
RTR UU
P−+
= (4.1)
where PR = Railway share UT = Utility function of truck transport UR = Utility function of rail transport
Considering the economic cost by travel distance in Figure 4.3.3, PTPS applied the following formulas as the utility functions above:
KaxcUT ++−= )4.1( , )51.0( bycU R +−= x = Travel distance of freight transport by road (km) y = Travel distance of freight transport by rail (km) a, b, c: Constant values K = ln(500/x)2 where x <500, K = 0 where x >= 500
From this, the exponent portion in (4.1) works out to be:
KbayxcUU RT +−++−=− )51.04.1( .
In the formulas, 1.4 and 0.51 are the slopes of the lines of road and rail in Figure 4.3.3. The constant values of a, b, and c are calculated so that the target modal share in Table 4.3.4 can be obtained from the formulas. The calculated constant values are:
Table 4.3.5 The Model Parameters for the Modal Share Calucation
c a - b 2015 8.369×10⁻⁴ 2020 2025 1.373×10⁻³ 1010
Note: PTPS Calculation
When the distance travelled is the same between road and rail, the formula illustrates the conversion curves as shown in Figure 4.3.6.

Pakistan Transport Plan Study in the Islamic Republic of Pakistan (PTPS)
4-16
0102030405060708090
0 250 500 750 1000 1250 1500 1750 2000
km
%2015
2025
Figure 4.3.6 Conversion Curve of Railway
Using the conversion formula, the future railway demand was estimated as shown in Table 4.3.6. The railway transport volume in ton-km is expected to grow over six times higher by 2015 and 20 times by 2025. The target modal share is one third of the total interzonal transport (ton-km) in 2025.
Table 4.3.6 Future Potential Demand of Railway (Interzonal)
Freight Traffic (million ton/ year) *1 Transport Vol. (billion ton-km/year) 2005 2015 2025 2005 2015 2025
Total
241 440 748 99 185 329
Road 234 97.1%
40191.2%
63685.0%
9393.9%
148 79.9%
21866.2%
Rail 7 *2
2.9% 39
8.8%112
15.0%6 *3
6.1%37
20.1% 111
33.8% Note: Figures with % are composition of each mode of the total. Note: Freight Traffic (million tons/ year) was estimated using the average trip length. Note: *2: 6.79 in 2005-06, JICA Estimation Note: *3: 6.12 in 2005-06, MTDF

Pakistan Transport Plan Study in the Islamic Republic of Pakistan (PTPS)
4-17
(5) Railway Passenger
The number of railway passengers has been increasing at an annual rate of 3.5% in recent years. There are two competitors to be considered for passenger transport by rail: domestic flights and long-distance buses. However, according to the Passenger Interview Survey, the markets for railway and air passengers are different in view of personal income level, and the number of air passengers can be estimated separately. On the other hand, the mode choice between rail and bus need to be considered because customers of rail and bus are similar. It is expected that bus services between major cities increases as road networks expand, and the number of passenger by rail also increases through improving the train service. Therefore, it is rational that the steady growth of railway passengers will continue.
The future transport volume of railway passenger in terms of passenger-km was estimated using a regression model based on statistics over the last ten years as follows.
Table 4.3.7 Projection of Railway Passenger Demand (Million Passenger-kms )
Total (All Pakistan) Interzonal Year Railway Total Railway Modal Share
2005-06 24,199 154,397 22,989 14.9% 2010-11 28,124 212,494 26,718 12.6% 2015-16 33,185 292,794 31,526 10.8% 2025-26 47,219 516,650 44,858 8.7% 2030-31 56,273 667,098 53,459 8.0%
Note: The ratio of interzonal transport to the total for railway passenger is assumed to be 0.95 Source: JICA Study Team
15
18
21
24
0 2,000 4,000 6,000
GDP (Billion Rs.)
Billi
on p
asse
nger
-km
s
Y=1.45687X1-2155.62X2+14448.5 (R=0.998) Where; Y: Annual demand in million passenger kms X1: GDP in Rs. Billion X2: Dummy Variable (zero after the year 2002) Source: JICA Study Team
Figure 4.3.7 Regression Analysis of Passenger Demand for Railway Passenger

Pakistan Transport Plan Study in the Islamic Republic of Pakistan (PTPS)
4-18
4.3.4 Summary of Demand Forecast for Land Transport
Passenger transport volume by road was calculated as the difference of the passenger-km by rail subtracted from the total passenger-km. On the other hand, freight transport by road was calculated using a conversion formula between road and rail. The results of the estimation are summarized in Table 4.3.8 and Table 4.3.9.
Inter-zonal passenger transport in passenger-km will increase at a high annual rate of 6.6% for the next five years and 6.4% from 2010/11 to 2025/26. Although the passenger transport by rail will increase at a steady growth rate of 3% and 3.5%, the railway share of inter-zonal transport will decrease to 8.7% in 2025-26.
Table 4.3.8 Projection of Passenger Transport Demand (Million Passenger-km/ Year)
All Pakistan Inter-zonal Total Road Rail Total Road Rail
2005-06 294,785 270,586 24,199 154,397 131,408 22,989 2010-11 438,131 410,007 28,124 212,494 185,776 26,718 2015-16 622,967 589,782 33,185 292,794 261,269 31,526 2025-26 1,135,494 1,088,275 47,219 516,650 471,792 44,858 2030-31 1,466,149 1,409,876 56,273 667,098 613,638 53,459 AGR*
05/06-10/11 8.25% 8.67% 3.05% 6.60% 7.17% 3.05% 10/11-25/26 6.55% 6.72% 3.51% 6.44% 6.41% 3.51% Mode Share
2005-06 91.8% 8.2% 85.1% 14.9% 2015-16 94.7% 5.3% 89.2% 10.8% 2025-26 95.8% 4.2% 91.3% 8.7%
Note: *Annual Growth Rate
The results of the demand forecast for freight transport show a significant increase in railway demand as shown in Table 4.3.9. Interzonal freight transport by rail is expected to account for 33.8% in 2025-06. Note that the figures express potential demand rather than a prediction, and this should be considered as the target demand for railway development.
Table 4.3.9 Projection of Freight Transport Demand (Million Ton-kms) (Million Ton-kms)
All Pakistan Interzonal Total Road Rail Total Road Rail
2005-06 141,600 135,480 6,120 99,223 93,409 5,814 2010-11 207,881 197,107 10,774 133,044 122,809 10,235 2015-16 293,268 254,086 39,182 184,759 147,536 37,223 2025-26 530,037 412,976 117,061 328,623 217,415 111,208 2030-31 682,787 530,433 152,354 423,328 278,591 144,737 AGR*
05/06-10/11 7.98% 7.79% 11.98% 6.04% 5.63% 11.98% 10/11-25/26 6.44% 5.05% 17.24% 6.21% 3.88% 17.24% Mode Share
2005-06 95.7% 4.3% 94.1% 5.9% 2015-16 86.6% 13.4% 79.9% 20.1% 2025-26 77.9% 22.1% 66.2% 33.8%
Note: *Annual Growth Rate

Pakistan Transport Plan Study in the Islamic Republic of Pakistan (PTPS)
4-19
4.3.5 Traffic Forecast in MTDF
The traffic forecast for roads and railways up to 2010 is appended to the MTDF as shown in Table 4.3.10 and Table 4.3.11. According to the MTDF, the passenger demand and freight demand are estimated to increase by 1.38 times and 1.35 times, respectively, over the next five years. However, 215.09 BPK of passenger traffic by road in 2004/05 seems to be an underestimation because the actual volume was 222.78 BPK in 2003/04. Considering the rapid increase in the number of passenger cars and the growth in commuter trips in the large cities, the higher demand forecast of PTPS is reasonable. The forecast of passenger traffic volume by railway in MTDF is similar to that in PTPS.
Table 4.3.10 Passenger Traffic Forecast in MTDF and PTPS (Passenger: Billion Passenger-Km)
Fiscal Road Railway Total Year Actual* MTDF PTPS Actual* MTDF PTPS MTDF PTPS 2003/04 222.78 - - 19.96 - - 2004/05 - 215.09 - - 23.80 - 238.89 - 2005/06 - 230.15 270.59 - 24.59 24.20 254.74 294.79 2006/07 - 246.26 - - 25.40 - 271.66 - 2007/08 - 263.49 - - 26.23 - 289.72 - 2008/09 - 281.94 - - 27.10 - 309.04 - 2009/10 - 301.67 - - 27.99 - 329.66 - 2010/11 - 410.01 - 28.12 438.13 AGR % - 7.00 8.67 - 3.30 3.05 - 8.25
*: Economic Survey 2004 Source: Economic Survey, MTDF, JICA Study Team
On the contrary, the freight traffic volume by road in 2004/05 seems to be an overestimation, considering the actual value in 2003/04. PTPS forecasted freight traffic volume by road to be smaller than that of MTDF, but applied a higher annual growth rate at 7.79%. The forecast of PTPS approximates to that of MTDF. The results of freight traffic forecast by railway are the same between MTDF and PTPS.
Table 4.3.11 Freight Traffic Forecast by MTDF and PTPS (Freight: Billion Ton-Km)
Fiscal Road Railway Total Year Actual MTDF PTPS Actual MTDF PTPS MTDF PTPS 2003/04 114.24 - - 4.80 - - - - 2004/05 - 147.17 - 5.46 - 152.63 2005/06 - 156.00 135.48 - 6.12 6.12 162.12 141.60 2006/07 - 165.36 - - 6.85 172.21 2007/08 - 175.28 - - 7.67 182.95 2008/09 - 185.80 - - 8.59 194.39 2009/10 - 196.94 - - 9.62 206.56 2010/11 - - 197.11 - - 10.77 - 207.88 AGR % - 6.00 7.79 - 12.00 11.98 6.26 7.98
*: Economic Survey 2004 Source: MTDF, JICA Study Team
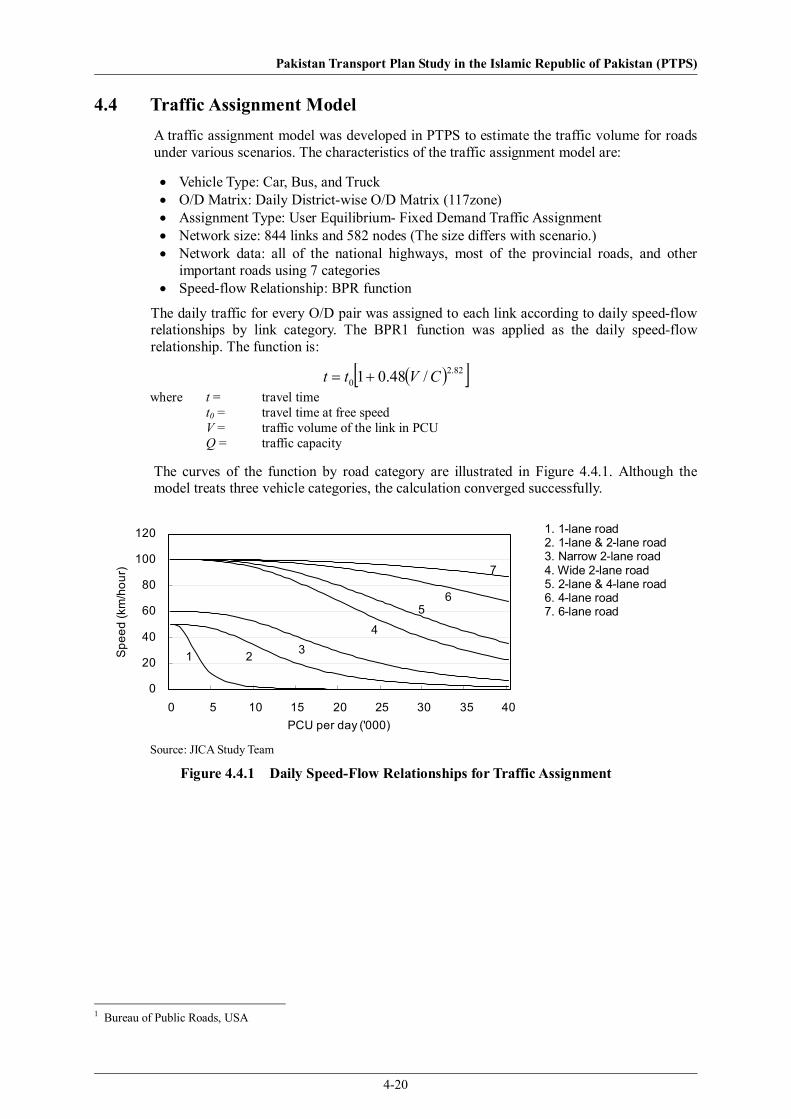
Pakistan Transport Plan Study in the Islamic Republic of Pakistan (PTPS)
4-20
4.4 Traffic Assignment Model A traffic assignment model was developed in PTPS to estimate the traffic volume for roads under various scenarios. The characteristics of the traffic assignment model are:
• Vehicle Type: Car, Bus, and Truck • O/D Matrix: Daily District-wise O/D Matrix (117zone) • Assignment Type: User Equilibrium- Fixed Demand Traffic Assignment • Network size: 844 links and 582 nodes (The size differs with scenario.) • Network data: all of the national highways, most of the provincial roads, and other
important roads using 7 categories • Speed-flow Relationship: BPR function
The daily traffic for every O/D pair was assigned to each link according to daily speed-flow relationships by link category. The BPR1 function was applied as the daily speed-flow relationship. The function is:
( )[ ]82.20 /48.01 CVtt +=
where t = travel time t0 = travel time at free speed V = traffic volume of the link in PCU Q = traffic capacity
The curves of the function by road category are illustrated in Figure 4.4.1. Although the model treats three vehicle categories, the calculation converged successfully.
0
20
40
60
80
100
120
0 5 10 15 20 25 30 35 40PCU per day ('000)
Spe
ed (k
m/h
our)
1 2 34
56
7
1. 1-lane road 2. 1-lane & 2-lane road 3. Narrow 2-lane road 4. Wide 2-lane road 5. 2-lane & 4-lane road 6. 4-lane road 7. 6-lane road
Source: JICA Study Team
Figure 4.4.1 Daily Speed-Flow Relationships for Traffic Assignment
1 Bureau of Public Roads, USA

Pakistan Transport Plan Study in the Islamic Republic of Pakistan (PTPS)
5-1
Chapter 5. OVERALL TRANSPORT POLICY
5.1 Review of Existing Development Plan The Medium Term Development Framework (MTDF) published in May, 2005 declares an ambitious goal for Pakistan to be a developed, industrial, just and prosperous country within 25 years, by attaining 7-8 per cent annual economic growth. To support such rapid growth, MTDF envisages a total investment of about Rs.8.0 trillion during the five years of 2005/06 – 2009/10. The amount corresponds to 1.3 times of GDP in 2004/05. Out of Rs.8 trillion, the fixed investment is Rs.7.3 trillion, of which 65% is expected to come from the private sector and 35% from the public sector.
Total investment in the transport sector is planned to be over Rs.573 billion, of which Rs.304 billion is to be by public investment. Prior to discussing a long-term developing policy and strategy of PTPS, the MTDF was reviewed, and summarized in the followings.
5.1.1 Overall Policy and Strategy of MTDF
The overall policy and strategy of MTDF are summarized in Table 5.1.1. The PTPS is one of the actions in accordance with the policy (1) and the strategies (1) to (4) are included in the TOR of PTPS.
Table 5.1.1 Overview of MTDF Policy and Strategy for Transport Sector
Overall Policy and Strategy of Transport Sector
Policy
(1) Development of a comprehensive and integrated transport policy during MTDF (2) Establishment multimodal transport system (3) Emphasis on asset management of the existing system (4) Enhanced private sector participation
Strategy (1) Enhancement of regional connectivity to improve links to the Central Asian States, Iran, Afghanistan and India
(2) Improvement of transport planning, prioritization and rationalizing public sector expenditure and mobilization of resources from users and private sector
(3) Reforms of institutions governance (4) Adoption of an integrated and holistic approach for more productive, efficient and
reliable transport system aiming at lower transport cost Source: MTDF
5.1.2 Policy and Strategy of Transport Sub-Sectors of MTDF
Table 5.1.2 presents the policy and strategies of each transport sub-sector. Every sub-sector shows the general direction of private sector participation. The MTDF expects private sector investment in transport sector to reach 47% of total investment. The Pakistani experience shows, however that private capital will not be easily induced to participate in the road and railway sub-sectors unless each PFI/PPP project is deliberately structured.
As a whole, the road sub-sector emphasizes improvement of existing facilities and better operation, rather than new construction. New road projects are limited to those with high economic return. Improvement of cross-border routes is also highlighted in order to enhance the hub-function of Pakistan to the surrounding countries.

Pakistan Transport Plan Study in the Islamic Republic of Pakistan (PTPS)
5-2
Table 5.1.2 Policy and Strategy of Transport Sub-Sectors of MTDF Sub-Sector Policy and Strategy of Transport Sub-Sector
Road
(1) Optimal utilization of the existing capacity with emphasis on rehabilitation and upgrading
(2) Selective and cost efficient investment in economically viable new roads, including expansion of the rural network
(3) Development/improvement of road network to facilitate transport and trade with Iran, Afghanistan, Central Asian States and India
(4) Development of innovative financing mechanisms and enhancement of private sector participation
(5) Priority to roads maintenance and safety (6) Effective control of overloading on the roads (7) Enhancement of capacity of the road sector agencies
Railway
(1) Revitalization of railways into a more commercially oriented entity, while retaining the railway network in public ownership
(2) Corporatization of railways (3) Induction of private sector capital and management expertise into the sector,
particularly into railway support industries and train operations (4) Emphasis on inland freight traffic handled by the railways, to achieve maximum
utilization of inherent capacity Ports & Shipping
A. Port (1) Upon the concept of “Landlord port”, the port’s responsibilities are limited to
(a) provision of fixed infrastructure such as land wharves and buildings; (b) ownership of wharves, buildings, harbour structures, navigational aids and electrical installations; and (c) control and regulatory functions with respect to services of the port and port conservation and development.
(2) All port operations would be done by private sector (3) The Port Authorities would be made fully autonomous B. Shipping (1) Speedy enactment of the Merchant Shipping Ordinance (2) To allow Pakistan ship owner to act as if they are located in EPZ (3) Encouragement of local banks toward extension of financial assistance to
potential ship owners (4) Amendment of bilateral shipping agreement (5) Institutionalization of role of freight forwarding agencies for efficient movement
of cargoes (6) Revitalization of Pakistan Marine Academy
Airports& Aviation
(1) CAA should limit its role to regulatory function with ADA providing the aviation infrastructure and services
(2) Pakistani private airline on international routes should be encouraged and be allowed to operate on viable domestic routes
(3) The landing and fuel charges should be brought at a with the neighbouring countries
(4) PIA and private airlines are to be treated at par in levy of duties and taxes for import of aircrafts and spares
Source: MTDF
As for the railway sub-sector, “revitalization”, “corporatization” and “privatization of operation” are keywords. In order to step toward this direction, the sub-sector will require painful structural reform and a sizable amount of additional investment in order to improve substandard railways and renovate superannuated rolling stock.
The port and the airport sub-sectors intend to promote further private sector participation by limiting the government agencies role to “landlord” and regulatory functions.

Pakistan Transport Plan Study in the Islamic Republic of Pakistan (PTPS)
5-3
5.2 Planning Goal Based on the understanding of policies and strategies of the current MTDF, the Study Team tried to set up a planning goal and long-term policies/strategies targeting the year of 2025 in order to clarify the basic planning directions of PTPS.
The planning goal of PTPS was set as follows, which may be appropriate in most of long-term transport plans at the national level. “Proper level of services” may vary by economic conditions and for particular problems of the country.
Planning Goal of PTPS “Accomplishment of safe, stable and sustainable transportation system and network with an adequate level of services, enough to support people’s economic and social activities”
To approach the goal, three policies and seven strategies have been selected in PTPS.
Three Policies A. Transport system to support economic and social activities B. Transport network to support balanced growth of regional economy C. Transport system to realize optimal modal share
Seven Strategies 1. Development of financially realizable master plan 2. Transparent Prioritization 3. Pursuit of Road Safety 4. Inter-modal Facilities Development 5. Cross-border Facilities Development 6. Institutional Capacity Enhancement 7. Environmental Consideration
To set up those policies and strategies, those of the MTDF are fully taken into account and then the basic planning directions are illustrated as shown in Figure 5.2.1.
Figure 5.2.1 Long-term Policies and Strategies of PTPS
Policy and Strategies of MTDF
A. Transport system to support economic and social activities
B. Transport network to support balanced growth of regional economy
C. Transport system to realize optimal modal share
Planning Goal of PTPS
Long-term policies of PTPS
Strategies of PTPS
1. Financially Realizable Master Plan
4. Inter-modal Facilities Development
3. Pursuit of Road Safety
2. Transparent Prioritization
5. Cross-border Facilities Development
6. Institutional Capacity Enhancement
7. Environmental Conservation

Pakistan Transport Plan Study in the Islamic Republic of Pakistan (PTPS)
5-4
5.3 Long-Term Policies of PTPS 5.3.1 Policy A. Development of transport system to support economic and social
activities
The MTDF says that about 4.2 million vehicles are currently operated on about 258,000 km road network (page 441). If the national economy grows at such a high rate of 7 to 8 percent per annum as the Government aims, traffic volume will definitely increase by more than five times the present level. On the other hand, the present road network is still in poor condition. Multi-lane roads are very limited and most provincial roads are 3.5 – 4.0 meters wide, where even small vehicles can hardly pass each other. Under such conditions, not only will traffic accidents increase, but transportation time will become longer and cost are even more. Even now, the MTDF estimates Rs.220 billion or 8.5% of GDP is annually lost due to the inadequate and insufficient transport system (p.442), which will hinder economic growth and reduce export competitiveness unless the transport system is not properly developed.
In this study, project identification and prioritization will be made firstly from the economic point of view and then by other factors such as: social needs, development effects and environmental impacts not because they are less important, but due to the difficulties of quantitative analysis required for such factors.
Economic evaluation of a project will be conducted for each project based on the present and future traffic, through “with and without” comparison. Main sources of economic benefit are savings in vehicle operating cost (VOC) and travel time cost (TTC) attributable to the project. Decreased traffic accident by the project will be taken into account, if necessary. The future traffic and accruing benefit are estimated through assignment of OD volume on the network consisting of the national and provincial roads, railways, ports and airports.
To support economic activities, the transport network has to be stable and not affected seriously by a natural disaster or social incidents. Major economic centres (large cities, industrial centres, ports, etc.) are interconnected mutually by plural trunk roads or railways so that in case of one link is severed, another will be available.
Under Policy A, the focal points for project identification and formation will be as follows:
• Supporting economic activities by connecting major economic centers with motorways or national highways
• Demand oriented project formation to avoid traffic congestion • Establishment of stability by providing alternative mode or route • Increase of urban bypasses • Development or improvement of inter-modal facilities • Strengthening of international routes • Management and effective utilization of existing resources
5.3.2 Policy B. Development of transport network to support balanced growth of regional economy
Pakistan has two dominant corridors of development: one is the north-south corridor along the Indus basin from Karachi to Lahore/Rawalpindi/Islamabad and the other is east-west corridor from Lahore to Peshawar via Rawalpindi/Islamabad. Economic activities and population are concentrated along these corridors, mainly due to geographical and natural conditions. As a result, a significant economic disparity is observed between the corridors and other areas.
Beside this regional disparity, there is an income gap between urban and rural areas. The poverty ratio (the percentage of people below the poverty line) is much higher in rural areas than in urban areas. (Table 5.3.1)

Pakistan Transport Plan Study in the Islamic Republic of Pakistan (PTPS)
5-5
Table 5.3.1 Regional Disparity in Pakistan, 1998/99
Average Monthly Income per capita (Rs/month)
Poverty Ratio (%) Province
Whole Urban Rural Whole Urban Rural Panjab 1033 1390 889 33.0 25.5 36.0 Shindh 1053 1347 828 26.6 16.1 34.7 NWFP 796 1211 725 42.6 29.2 44.9 Balochistan 979 1073 965 22.8 24.3 22.5 Pakistan 1001 1354 854 32.2 22.4 36.3 Source: Average monthly income from Household Integrated Survey (HIES) P.10 Table 2.5.C, 1998/99, FBS,
2001 Poverty Ratio from “Pakistan, Guideline for Assistance” JICA, 2003
As no district-wise data directly expressing poverty level are available in HIES, 2001, five social indicators have been selected as proxy variables in order to see the regional distribution of poverty by district. These are:
1) Percentage of the unvaccinated population of age below 10 years, 2) Percentage of illiterate household members of age 10 years and above, 3) Percentage of household without drinking water inside the house, 4) Percentage of household without electricity for lighting, and 5) Percentage of household with wood only as cooking fuel source.
These indicators are well-known to have a close relation to poverty. At province level, actually, the multiple regression of average income per capita on those indicators shows a good fit and a high correlation coefficient of 0.95 The geographical distributions of those indicators are shown in Figure 5.3.2. The estimates of average monthly income using the multi-variable regression equation and actual income show a good correlation as shown in Figure 5.3.1.
500.0
600.0
700.0
800.0
900.0
1000.0
1100.0
1200.0
1300.0
1400.0
1500.0
500.0 700.0 900.0 1100.0 1300.0 1500.0
Actual monthly income per capita
Est
imat
e o
f m
onth
ly in
com
e
Source: JICA Study Team
Figure 5.3.1 Correlation of actual monthly income and estimate
As poverty alleviation is one of the most important policies of the Pakistani Government and international donors, proper consideration should be paid to the projects in and around relatively poorer area in addition to their economic viability.
Under Policy B, the focal points for project identification and formation will be as follows:
• Harmonization of transport network development with regional development policies and plans
• Network development aiming at alleviation of poverty and regional disparity • High priority setting on transport projects in poorer areas • Project implementation by utilization of local materials and procurement of local labor
force • Effective monitoring of the effects of projects and other poverty alleviation measures
and projects affect

Pakistan Transport Plan Study in the Islamic Republic of Pakistan (PTPS)
5-6
Figure 5.3.2 District-wise Social Indicators as Proxy Variables of Poverty
50 - 100 (16)40 - 50 (19) 30 - 40 (26) 20 - 30 (35) 0 - 20 (10)
Unvaccinated
80 - 90 (19)60 - 80 (52) 50 - 60 (16) 40 - 50 (11) 0 - 40 ( 8)
Illiteracy
80 - 100 (12)60 - 80 (18) 40 - 60 (14) 20 - 40 (26) 0 - 20 ( 36)
Drinking water outside
80 - 100 ( 8)60 - 80 (14) 40 - 60 (23) 20 - 40 (29) 0 - 20 ( 32)
No electricity for lighting
90 - 100 (39)80 - 90 (30) 70 - 80 (13) 60 - 70 (10) 0 - 60 ( 14)
Wood for cooking
20 - 25 (22)15 - 20 (36) 10 - 15 (32) 5 - 10 (16)
Aggregated indicator of poverty level

Pakistan Transport Plan Study in the Islamic Republic of Pakistan (PTPS)
5-7
5.3.3 Policy C. Transport system to realize optimal modal share
The Pakistani Government has been emphasising the importance of a multi-modal transport system. In Pakistan, multi-mode transport means transport by road and rail. Air transport of cargo is also important but the volume is small and river transport is negligible.
It is believed, in general, the unit transport cost (operating cost) of rail is lower than that of road, while capital cost (costs of infrastructure and rolling stock) of rail is higher than that of road, even including road construction cost and maintenance cost. Therefore, the cost curves of the two modes will meet at some point (Figure 5.3.3). The breakeven distance is usually in the range of 150 to 500 km. It depends on the fixed costs (of which, the main part is for loading and unloading) and the variable costs of the two modes and also on the volume of cargoes.
Figure 5.3.3 Breakeven Point of Transport Cost by Road and Railway
Taking into account the economic advantage of railway transport, PTPS proposes a target share of railway at 20% in 2015 and 34% in 2025 as stated in Chapter 4.3.3. By attaining this target modal shift from road to rail, a sizeable economic benefit is expected to accrue. If comparing the economic costs of two modes, direct economic benefit is estimated at Rs. 20.6 billion in 2015 and Rs. 64.1 billion in 2025 (estimated in PTPS), even disregarding the savings in transport cost due to the mitigation of road congestion. The cumulative benefit during 2015 to 2025 will reach Rs. 426 billion (US$ 7.1 billion) and then, at least the amount will be economically justifiable for realization of target modal share.
Under this policy C, focal points for project identification and formation will be as follows:
• Minimization of transport cost by multi-modal transportation • Fare competition between road and rail • Modernization of railway system through rehabilitation with improvement to railway
infrastructure and facilities, renewal of rolling stock and institutional reform of management and operation
• Development and improvement of inter-modal facilities • Introduction of research works suitable for local conditions
5.4 Development Strategy of PTPS Seven strategies have been selected to develop the long-term transportation master plan, PTPS.
150-500 km
Transport Cost per ton
Distance
Road
Rail

Pakistan Transport Plan Study in the Islamic Republic of Pakistan (PTPS)
5-8
5.4.1 Development of Financially Realizable Master Plan
A master plan should not be a mere “wish list”, but a practical list for which the total amount is in the financially feasible range according to the scale of the national economy and government budget. The MTDF plans to invest Rs.573 billion or 9.3% of GDP in 2004/05 for five years of 2005/06 to 2009/10, that is, 1.8% per annum. As the annual investment in the transportation sector is usually in the range of 1.5 to 3.0% of GDP in developing countries, the investment plan of the MTDF is rather modest as far as the transportation sector is concerned.
Based on the economic growth scenarios stated in Chapter 4, an analysis of a reasonable range of transport investment in the coming 20 years is presented in Chapter 6.1.2 and the range was estimated to be Rs. 3.7 to 5.1 trillion (US$ 62 – 85 billion). As the revenue of the Government can hardly keep up with the economic growth, the majority of the investment should be shouldered by the private sector.
In general, however, PFI/BOT scheme are not easy to apply to a transportation projects because of the huge investment, long cost recovery period and limited users’ affordability; such a project then needs prudent preparation works and in most cases, public and private joint participation (PPP scheme) will be necessary.
• Preparation of an investment plan according to the national economy • Expansion of financial sources and proper allocation • Application of “Beneficiary pay” principle or “Causer pay” principle • Participation of private sector
5.4.2 Transparent Prioritization
The budget of the Pakistan Government has been tight compared to the huge demand for transportation investment, so project prioritization is important in these kind of master plan studies. The method adopted for prioritization has to be logical and reasonable. It should alos be understandable and agreeable to most stakeholders. Above all, the method and process should be clear and transparent. Figure 5.4.1 shows the procedure taken in this Study for priority setting on candidate projects.
Figure 5.4.1 PTPS Procedure of Project Prioritization
1. Demand Forecast 4. Project Cost Estimation
5. Economic Project Cost
6. Economic Evaluation
7. Other Criteria1) Environmental Consideration 2) Magnitude of Beneficiaries 3) Safety Improvement Effect 4) Pro-Poor Projects 5) Burdens on Government Budget
8. Comprehensive Evaluation
9. Project Prioritization
2. Transport Cost Analysis
3. Benefit Estimation
Pakistan Transport Plan Study in the Islamic Republic of Pakistan (PTPS)
5-9
The economic return of a project is regarded as the most dominant criterion in determining the priority of the project, because the economic growth is one of the most important objectives of the MTDF. After setting priority on all candidate projects from an economic view point, those projects are re-evaluated on other criteria and finally, comprehensive priority setting will be done. How to set the relative weights among evaluation criteria is being studied. Regarding the prioritization, focal points are:
• Consensus among stakeholders on evaluation criteria and relative weight among them • Technology transfer to the counterpart team on prioritization technology.
5.4.3 Pursuit of Road Safety
As the number of vehicles increases, traffic accidents have been increasing also in Pakistan. Overloading on trucks accelerates the rate of increase in accidents. As for rail, three fatal accidents have been occurring in the past five years mainly due to poor communication systems. As traffic accidents will increase in parallel with transport demand, traffic safety will become a more important issue in the future. Focal points for traffic safety are:
• Physical improvement and good maintenance of road and rail systems • Strict regulation enforcement especially on overloading and transporting hazardous
freight • Establishment of rescue system • Development a system for traffic accident statistical data • Traffic safety education to drivers and school children
5.4.4 Inter-modal Facilities Development
Why inter-modal? For a variety of reasons, and due to regional diversities, production and consumption of goods takes place in geographically separate locations. In this competitive world, it is essential that the transport costs of both imported and exported goods are kept low. This requires good accessibility, and use of most appropriate and efficient mode or modes of transport. For example, for the movement of large volumes of goods over long distances it is efficient to use bulk movement modes: railways or shipping, as appropriate. However, one of the key drawback of multi-modal or single mode transshipment facilities is the increase in the number of times goods have to be handled, i.e. loaded and unloaded - contributing to the increase in the cost of transportation.
The minimum criteria for an efficient and cost-effective inter-modal terminal would be to at least take account of the following points:
• The location of such termini is “accessible” for all modes using the terminal, • All modes using the facility should have adequate transport infrastructure and carrying
capacity, • The design of such a facility should allow safe and efficient transfer of goods through the
use of technology and material handling devices, • Handling of goods is made efficient through unitization, i.e. handling only containerized
goods, and container stuffing and unpacking takes place elsewhere, • Make effective use of communication systems such that clients are aware of the status
and location of their freight, • Through systemized and simplified documentation, allowing easy processing of goods
through customs and excise checks and payment of dues. For example, clearance of goods at Lahore airport requires payment of dues to at least six or seven different agencies, which could easily be paid at a single counter.
This is particularly true of multi-modal terminals such as ports, and major inland freight termini usually called “dry ports”. Such single or multi-modal inland termini could also be used for the local distribution of goods for large local populations and export collection points for industrial centers for the export of goods.

Pakistan Transport Plan Study in the Islamic Republic of Pakistan (PTPS)
5-10
Pakistan, with its vast area of over 790,000 sq-km and few population centres with access to the ports at or near Karachi, adopted the use of “dry ports” since the mid-1980s. This had the key impact of reducing the congestion at Karachi port, and leaving it to be an efficient multi-modal terminal and not become a distribution center for the whole country.
There are about 20 dry port termini in Pakistan in cities other than Karachi. As one would expect, the majority of these are in large conurbations in the provinces of Punjab, Sindh and NWFP. PTPS traffic and transport survey programme would cover a number of these facilities. Further analyses of their function, importance, processing capacity, likely improvements and location of additional such terminal would be covered in this study.
It could be commented that the PTPS strategy for efficient and cost effective movement of goods in Pakistan involves effective use of all available modes of transport, and propose s further transport infrastructure development, where necessary, to promote economic growth as anticipated by MTDF.
5.4.5 Cross-border Facilities Development
Pakistan has several thousand kilometres of land borders with its neighbouring countries: Iran, Afghanistan, China and India. Beyond these countries Pakistan could act as a major transshipment route for the land locked countries of central Asia, which have enormous growth potential and wealth of mineral deposit. A Pakistan with efficient land transport infrastructure and ports for import export would gain enormously by providing the key access routes to the warm waters of the Indian Ocean and Persian Gulf.
The PTPS strategy towards cross-border trade of Pakistan with its neighbouring countries and the Central Asian states is two-fold:
a. Improve bi-lateral trade with neighbouring countries through harmonization of political relations, promoting not only trade but tourism and other such activities, and
b. Provide seamless transshipment route for Afghanistan and the Central Asian states farther away.
1) Cross-Border Trade with the Four Neighbouring Countries
The recent thaw in political relationship has seen an increase in cross-border movement of goods and people. However, there is a long way to go before the people of these nations could travel across each other’s land without restriction in the way Europeans do. The trade with these countries has started to pick-up and should be encouraged by:
• Reducing bureaucratic paper work, • Simplifying the custom and excise formalities, • Providing facilities for fast track processing of passport checks through enhanced use of
technologies, • Improving transport infrastructure of all modes to international standards ensuring
adequate capacity, • Provision of multiple cross-border facilities between neighbours across several thousand
kilometres of borders.
PTPS as part of its extensive traffic and transport survey programme across Pakistan has conducted surveys at most cross-border facilities. In developing the transport master plan for Pakistan, due consideration will be given to these facilities.
2) Role of Pakistan as Transit Trade Route Pakistan could play a pivotal role in the development of the economies of Central Asian states and that of Afghanistan by providing them with transit routes to the ports of the Gulf and Indian Ocean. Afghanistan and China are already using the historic trade routes for access to the ports in Pakistan. However, trade is limited due to:
Pakistan Transport Plan Study in the Islamic Republic of Pakistan (PTPS)
5-11
• Poor inter-modal transshipment facilities at border crossings, • Limited through movement of goods due to limitations imposed by each country, • Lack of facilities for through passage of goods and people • Poor capacity transport links between border crossing and to the nearest dry-ports and
overland routes to major ports at Karachi • Inadequate high capacity rail links for bulk movement of goods, • Totally unimpressive performance of current railways in terms of frequency, delivery of
goods on time, insurance against loss and damage to goods, and so on • Little or no provision for handling of containers for inter-modal transfer • Lack of secure and modern warehousing facilities for storage of goods • Outdated documentation and billing processes, and so on.
For Pakistan to act as trade route for these nations, PTPS would recommend strategies on how to enhance cross-border facilities. Currently, a number of projects are on the way to improving the poor facilities outlined above, for example, widening the road section at the border crossing between India and Pakistan at Lahore. The data from cross-border surveys is being processed to asses the inadequacy of facilities for future recommendations to follow.
5.4.6 Institutional Capacity Enhancement
Construction and maintenance of roads has been devolved from the Central Government to the local government in accordance with the devolution policy. However, financial sources have not necessarily been transferred to local government, along with the transfer of responsibility. In addition, some local governments have not yet acquired the absorptive capacity in planning, design, cost estimate, evaluation bidding, etc.
Both at the central and local level, institutional capacity for research and training functions do not appear to be sufficient. To meet the increasing demand for such functions, institutional enhancement will be needed.
• Enhancement of training function for government personnel, inclusive of traffic police • Enhancement of transport research institute, particularly in creation, collection and
maintenance of transport statistical data • Encouragement for universities and colleges to create faculties of transport planning and
design
5.4.7 Environmental Consideration
Protection of the environment and environmental awareness has been common for some time in Pakistan. GOP has taken measures towards improving and protecting the environment through legislation, education, and public participation. Such programmes are in their infancy. In preparing the PTPS due consideration will be given to environmental laws, rules, regulations and issues. Key points for consideration are:
• Preparation of environmentally sustainable transport master plan, • Environmental assessment to be an integral part of project evaluation and prioritization
process, • Recommending full environmental impact assessment of all proposed projects before
implementation, • All proposed transport infrastructure projects to follow environmental laws, rules and
regulations at all stages of the project, i.e. before, during and after construction, • Fare compensation for land and loss of livelihood of land owners • Propose mitigation measures to reduce adverse impacts, and • Not to allow worsening of environmental conditions, where the current environment has
already suffered degradation due to neglect and over-sight of the past decades.

Pakistan Transport Plan Study in the Islamic Republic of Pakistan (PTPS)
6-1
Chapter 6. DEVELOPMENT STRATEGY
6.1 Development of Financially Realizable Master Plan In this section, the national financial situation was analysed and the possible investment budget for the Master Plan was calculated. In order to increase funds for transport sector, strengthening of the road tax was recommended and target investment level with road tax was proposed. Financial reforms of NHA and PR were proposed to ensure the financial stability for the Master Plan. Finally, private sector involvement in transport sector was analysed because private sector investment is essential for the transport development.
6.1.1 Analysis of Financial Situation of Pakistan
(1) General Information Regarding Pakistan National Budget
Fiscal deficits have continued to appear in the National budget of Pakistan. Table 6.1.1 shows the trend in fiscal deficits as a percent of GDP. These fiscal deficits may lead to the massive public debts. Table 6.1.2 shows the trends in public debts from fiscal year 2001/02 to fiscal year 2004/05. According to Table 6.1.2, public debt has ranged from 60 to 80% of GDP. The increase in debts leads to increased interest payments and contributes to inflexibility in budgetary expenditures.
Table 6.1.1 Proportion of Deficit of GDP (Unit: %)
FY 1990/91 1991/92 1992/93 1993/94 1994/95 1995/96 1996/97Revenues 16.9 19.2 18.1 17.5 17.3 17.9 15.8 Expenditures 25.7 26.7 26.2 23.4 22.9 24.4 22.3 Overall Fiscal Deficit 8.8 7.5 8.1 5.9 5.6 6.5 6.4 FY 1997/98 1998/99 1999/00 2000/01 2001/02 2002/03 2003/04Revenues 16 15.9 13.5 13.3 14.2 14.9 14.3 Expenditures 23.7 22 18.7 17.2 18.8 18.6 17.3 Overall Fiscal Deficit 7.7 6.1 5.4 4.3 4.3 3.7 2.3 Sources: Pakistan Economic survey 2004/05
Table 6.1.2 Trends in Public Debt (Unit: Rs. Billion)
2001/02 2002/03 2003/04 2004/05 (July - March)
Debt (in Rupees) 1,715.2 1,853.7 1,987.8 1,982.3 Debt (in Foreign Exchange) 1,984.1 1,891.3 1,807.7 1,944.4 Total Debt. 3,699.3 3,745.0 3,786.6 3,926.7 GDP 4,401.7 4,821.3 5,532.7 6,547.6 As % of GDP 84% 78% 68% 60% Sources: Pakistan Economic survey 2004/05
(2) Inflexibility of Budgetary Expenditures
The problem regarding the National Budget of Pakistan lies in the inflexibility of the budgetary expenditures. Interest payments and the defence sector account for approximately 40 to 50% of the total expenditures. This situation is forcing the budgetary expenditure to be inflexible. Table 6.1.3 shows the details of budgetary expenditures.

Pakistan Transport Plan Study in the Islamic Republic of Pakistan (PTPS)
6-2
Table 6.1.3 Details of Budgetary Expenditures
1997/98 1998/99 1999/2000 2000/01 FY Rs. Billion % Rs. Billion % Rs. Billion % Rs. Billion %
Total 634.0 100.0 647.8 100.0 709.1 100.0 717.9 100.0Current Expenditures 529.9 83.58 547.3 84.49 626.4 88.34 645.7 89.94
Interest Payments 202.4 31.92 220.1 33.98 262.2 36.98 249.3 34.72Defence 136.2 21.48 143.5 22.15 150.4 21.21 131.2 18.28
Development Expenditures 104.1 16.42 98.3 15.17 95.6 13.48 89.8 12.51
2001/02 2002/03 2003/04 (Estimated) FY Rs. Billion % Rs. Billion % Rs. Billion %
Total 826.3 100.0 898.2 100.0 955.8 100.0 Current Expenditures 700.2 84.74 791.7 88.1 774.9 81.1
Interest Payments 273.9 33.15 235.3 26.2 226.3 23.7 Defence 149.3 18.06 159.7 17.8 180.4 18.9
Development Expenditures 126.2 15.27 106.5 11.9 180.9 18.9 Sources: Pakistan Economic survey 2004/05
According to the Medium Term Development Framework (MTDF), transport is an important sector of the economy contributing 10% of the GDP and over 17% of the Gross Capital Formation. In addition, the development expenditure in the transport sector from 2001/02 to 2004/05 is calculated to be Rs. 145 billion, and the average budgetary annual expenditure during this period is Rs. 29 billion. Considering that the total annual development expenditure is around Rs. 100 billion (see Table 6.1.3), the development expenditure on the transport sector is 30% of the total. This percentage indicates that the Pakistan Government regards transport as one of the most important sectors to be developed. The details of expenditure in the transportation sector from 2001/02 to 2004/05 are described in Table 6.1.4.
Table 6.1.4 Details of Development Expenditures (2001/02-2004/05) (Unit: Rs. Million)
Government Self Financing / Corporation
Public-Private / Private Financing Total
Railway 31,195 0 0 31,195 Road 98,868 0 10,890 109,758 Port & Shipping 14,800 3,112 4,950 22,862 Airways 0 10,709 7,964 18,673 Total 144,863 13,821 23,804 182,488 * Expenditures for the NHA and Provincial Road Programme are included. Sources: Annex I in Section 29 of MTDF (2005/10)
(3) Medium Term Development Framework (MTDF)
The Planning Commission (hereinafter referred to as the Commission) is in charge of preparing the MTDF. The ministries of the national governemnt are required to submit the documents, which is called Planning Commission Pro-forma (hereinafter referred to as “PC”), to the Commission for approval to start and proceed development projects. The PC can be classified into four types from “PC1” to “PC4”. Each PC has the following role.
PC1: Proposal of Development Projects PC2: Feasibility Study of Proposed Development Projects PC3: Progress Report to Monitor PC4: Evaluation of the Projects

Pakistan Transport Plan Study in the Islamic Republic of Pakistan (PTPS)
6-3
The PC1 includes an outline of the project, project cost estimation, financial resources for the project, and so on. With the financial data of PC1, the Commission prepares the MTDF, which includes the budgetary allocation. Table 6.1.5 shows a summary of the fund resources described in the MTDF. As described in Table 6.1.5, the investment plans funded by the “Self Financing / Corporation” and the “Public-Private / Private Financing” equals to around 48% of the total investments, while the investment plans funded by the “Government” equals to around 52%. This indicates that the financial capacities of the implementing agencies and private participation are significantly important in order to realize the MTDF especially in the Port & Shipping Sector and Airways Sector.
Table 6.1.5 Investment Plans for Transport Sector (2005/06 – 2009/10) (Unit: Rs. Million)
Government Self Financing / Corporation
Public-Private / Private Financing Total
Railway 59,549 0 0 59,549 Road 216,850 0 30,796 247,646 Port & Shipping 12,732 32,237 71,737 116,706 Airways 0 127,288 6,600 133,888 Total 289,131 159,525 109,133 557,789 % 51.8% 28.6% 19.6% 100.0% * Expenditures for the NHA and Provincial Road Programme are included. Sources: Annex II in Section 29 of MTDF (2005/10)
On the other hand, the role of the Federal Government is still vital in the Roads and Railways Sector. The scheduled allocation of funding of the Federal Government is described in Table 6.1.6.
Table 6.1.6 Allocation of Funds of Government (2005/06 – 2009/10) (Unit: Rs. Million)
FY 2005/06 2006/07 2007/08 2008/09 2009/10 Total Road 32,350 36,300 41,400 49,800 57,000 216,850 Railways 9,849 11,000 12,000 13,200 13,500 59,549 Port & Shipping 3,744 2,122 1,299 1,889 3,678 12,732 Total 45,943 49,422 54,699 64,889 74,178 289,131Sources: Annex-3(a) in Section 29 of MTDF 2005/10
These figures only refer to funds regarded as necessary to develop the transport sector. Therefore, the funds allocated in each year are not guaranteed to be provided in the annual budget. In addition, since 40% of the expenditure is for interest payments and the defence sector, there is a risk that expenditure on interest and defence will overweigh expenditure on the development of the transport sector.
In order to avoid this risk, it is essential to establish more sustainable financial schemes for roads and railways through strengthening the financial capacity of the implementing agencies, promoting private financing, and formulating schemes to maintain funds for the development outside of the National Budget.

Pakistan Transport Plan Study in the Islamic Republic of Pakistan (PTPS)
6-4
(4) Foreign Direct Investments
Table 6.1.7 shows trends of the foreign investments. Pakistan has been introducing reforms to attract the inflow of foreign investment since the early 1980s. However, the total foreign investments exceeded Rs. one billion only in the fiscal years 1994/95 and 1995/96. After fiscal year 1995/96, foreign investment declined until the fiscal year 2000/01. Thereafter, the improvement in the country’s economic environment and upward revision of the country’s credit ratings may contribute to attracting large inflows of foreign investment. Consequently, the amount of foreign investments increased from fiscal year 2002/03.
Table 6.1.7 Trends of Foreign Investment (Unit: USD Million)
FY 1992/93 1993/94 1994/95 1995/96 1996/97 1997/98Direct Investment 306.4 354.1 442.4 1,101.7 682.1 601.3 Portfolio Investment 136.8 288.6 1,089.9 205.0 267.7 221.3 Total 443.2 642.7 1,532.3 1,306.7 949.8 822.6 FY 1998/99 1999/00 2000/01 2001/02 2002/03 2003/04Direct Investment 376.0 469.9 322.4 484.7 798.0 949.6 Portfolio Investment 27.3 73.5 -140.4 -10.0 22.1 -27.7 Total 403.3 543.4 182.0 474.7 820.1 921.9 Sources: Pakistan Economic survey 2004/05
Table 6.1.8 shows trends of foreign direct investments by economic groups. The major sectors attracting Foreign Direct Investments (FDI) are the Oil & Gas, Telecommunications and Financial Sectors. According to the MTDF report, the transport sector recently opened new avenues for FDI, after which the area of intra-city transport was able to capture larger investment from Middle Eastern investors. Besides macroeconomic stability and wide-ranging structural reforms, Pakistan now has a robust financial system. However, the cost of doing business remains high due to bureaucratic hurdles, high utility prices, multiplicity of taxes and high tax rates. The legal and regulatory infrastructure also needs to be improved. These problems should be dealt with in a decisive manner.
Table 6.1.8 Trends of FDI in Main Economic Groups (Unit: Million USD)
Economic Group 2001/02 2002/03 2003/04 Power 36.4 32.8 (14.2)Chemical , Pharmaceutical & Fertilizer 17.8 92.4 28.5 Construction 12.8 17.6 32.0 Mining & Quarrying, Oil and Gas 274.8 188.2 203.5 Petro-Chemical & Refining 5.0 3.0 72.4 Food, Beverages & Tobacco (5.1) 7.0 4.5 Textile 18.4 26.1 35.4 Transport, Storage & Communication 35.2 114.1 230.7 Machinery Other Than Electrical 0.1 0.4 0.7 Electronics 15.9 6.7 7.5 Electronic Machinery 10.5 10.5 8.7 Financial Business 3.5 207.5 242.1 Trade 34.2 39.1 35.6 Tourism / Paper & Pulp 0.8 1.5 1.8 Cement / Sugar 0.5 1.3 2.3 Others 23.9 49.4 57.9 Total 484.7 797.6 949.4 Sources: Pakistan Economic survey 2004/05

Pakistan Transport Plan Study in the Islamic Republic of Pakistan (PTPS)
6-5
(5) Activities of Donor Agencies
The major donors in Pakistan are the Government of Japan (JICA & JBIC), the World Bank and ADB. According to the Pakistan Transport Sector Assistance Strategy Note (Report No. 24354-PAK) released by the World Bank, major donor activities in Pakistan’s transport sector of Pakistan from 1990 to 2002 were as follows.
• Government of Japan: medium term National Transport Plans, National Highways (Indus Highway), rural access roads, railways and a proposed light rails mass transit system for Lahore;
• World Bank: Transportation Policy formulation, the National Highways System (N-5 expansion and network maintenance), Railways, Karachi Port and Trade & Transport Facilitation; and
• ADB: National Highways (Sukkur Bypass), provincial highways, farm-to-market roads, Port Qasim and Trade & Export Promotion.
Recent activities of the World Bank and ADB are as follow.
a) World Bank The World Bank is now supporting privatization of Pakistan Railways. In February 2005, the World Bank held discussions with the Ministry of Finance, Ministry of Railways and the Planning Commission regarding Restructuring of Pakistan Railways. Based on the Aide Memoire of the discussion, the World Bank was requested to assist the implementation of new financial systems for the railway entity. The assistance includes establishing the specifications and implementing a financial and management information system to facilitate business approaches to railway management and the introduction of private sector operations into the rail system. The cost of proposed package of the assistance would be approximately USD 750,000, based on the assumption that consultants would provide two-thirds of the input. Table 6.1.9 shows a list of recent financial assistance of World Bank since 2000.
Table 6.1.9 List of Financial Assistance of World Bank
Project ID Project Name Approval
Date Closing
Date Total Project Costs
(Million USD) Committed Amount
(Million USD)
P082621 NWFP Community Infrastructure Project II(NWFP CIP2)
20-May-04 31-Dec-09 53.3 37.1
P010556 Highways Rehabilitation 23-Dec-03 30-Jun-09 261.4 200
Sources: World Bank web-site
b) ADB Most of the recent projects assisted by ADB are mainly for the road sector.
Currently ADB is completing a technical assistance (TA-4508 (PAK): Facilitating PPP Initiatives in National Highway Development). This technical assistance (TA) aims at supporting the NHA to design appropriate mechanisms to accelerate national highway and motorway development through increasing private sector financing. The primary task of the TA is to review and analyze the existing policy, regulatory & institutional frameworks for private sector involvement in financing, constructing, operating and maintaining national highways and motorways. ADB is now proceeding with another TA to promote the private partner participation in the following steps.
In addition, ADB has proposed that funds be established to provide the financial resources for road maintenance of the local road network. According to ADB, while the road network controlled by the National Highway Authority has financial resources for the maintenance, the local road network does not have sufficient financial resources. In order to enhance the financial resources for the maintenance of the local road network, ADB has recommended

Pakistan Transport Plan Study in the Islamic Republic of Pakistan (PTPS)
6-6
that local governments establish road maintenance funds for the local road network. However, in order to realize this recommendation, there still remain a lot of issues to be resolved and the recommendation is now under discussion among the stakeholders.
Table 6.1.10 shows a list of recent financial assistance of ADB since 2000.
Table 6.1.10 List of Financial Assistance of ADB
Project ID Project Name Approval
Date Closing
Date
Total Project Costs
(Million USD)
Committed Amount
(Million USD)LOAN: PAK32058-01 Road Sector Development Project 19-Dec-01 Dec-07 236 150
LOAN: PAK32058-03
Punjab Road Development Sector Project 31-Oct-02 N/A 150 150
LOAN: PAK34333-01
Balochistan Road Development Sector Project 20-Nov-03 N/A 267.3 185.7
LOAN: PAK34333-02
Community Development and Poverty Reduction Project 20-Nov-03 N/A 1.25 1.0
LOAN: PAK36052-01
NWFP Road Development Sector and Sub regional Connectivity 18-Nov-04 Jun-10 423.6 301.2
LOAN: PAK37559-01
Sub regional Connectivity and Trade Facilitation I
2005 (Expected) N/A 290 290
Grant: PAK38617-01
Enhancing Road Improvement Benefits to Poor Communities in NWFP
28-Apr-05 28-Apr-08 1.0 1.0
Sources: ADB web-site

Pakistan Transport Plan Study in the Islamic Republic of Pakistan (PTPS)
6-7
6.1.2 Possible Investment Budget for the Master Plan
(1) Case of Investment Level for Sustainable Development
According to the JBIC/ADB/World Bank Joint Study “Infrastructure in East Asia: The Way Forward”, the fund requirement for the transport sector is US$23.5billion for Manila by 2015, US$10.3billion for Jakarta by 2020 and US$14.0billion for Ho Chi Minh by 2020 (excluding maintenance of existing infrastructure). This is equivalent to 2.6%, 0.7% and 2.5% of GRDP. The low requirement for Jakarta is mainly due to the existing accumulation of infrastructure (railways, expressways, etc). Though largely different by city, if 1-4% of GRDP is continuously invested in urban transport infrastructure (including maintenance of existing infrastructure), urban transport system can be sustained. Therefore, the “2.5% of GDP” can be regarded as one of the criteria of the investment level for the sustainable development of urban transport system.
If this criterion is applied to the national transport system and kept until 2025, the amount of total investment in the sector from 2005/06 to 2004/25 is estimated at around Rs. 6.4 trillion. Table 6.1.11 shows the estimated investment level in the GDP Middle Growth Case discussed in section 4.2.
Table 6.1.11 Case of “2.5% of GDP” Investment (2005/06-2024/25)
(Unit: Million Rs.)
Federal Government
Self Financing / Corporation
Public-Private / Private Financing Total
Railway 681,350 0 0 681,350 Road 2,481,164 0 352,363 2,833,527 Port & Shipping 145,678 368,851 820,804 1,335,332 Airways 0 1,456,410 75,516 1,531,926 Total 3,308,192 1,825,260 1,248,683 6,382,135 Source: Prepared by JICA Study Team with Data from the MTDF
(2) Case of MTDF
The MTDF 2005/10 envisages investments of Rs. 558 billion1 in the transport sector, which equals 1.46% of the predicted GDP (Market Price) in the same period (total amount of GDP from 2005/06 to 2009/10). If this trend continues until 2025, the amount of total investment in the sector from 2005/06 to 2024/25 is estimated at around Rs. 3.7 trillion. Table 6.1.12 shows the estimated investment level in the GDP Middle Growth Case.
Table 6.1.12 Investment Level under MTDF (2005/06-2024/25) (Unit: Million Rs.)
Federal Government
Self Financing / Corporation
Public-Private / Private Financing Total
Railway 398,146 0 0 398,146Road 1,449,865 0 205,903 1,655,768Port & Shipping 85,126 215,537 479,636 780,299Airways 0 851,051 44,128 895,179Total 1,933,138 1,066,588 729,666 3,729,392Source: Prepared by JICA Study Team with Data from the MTDF
1 The entire amount of allocation the MTDF 2005/10 envisages is RS. 573 billion, which includes the miscellaneous
non-investment expenditures.

Pakistan Transport Plan Study in the Islamic Republic of Pakistan (PTPS)
6-8
(3) Investment Level from 2000/01 to 2004/05
Based on the discussion so far, the assumed investment level for each case has a huge gap of Rs. 2.6 trillion (Rs. 6.4 trillion in the “2.5% of GDP” Investment Case and Rs. 3.7 trillion in the MTDF Case). On the other hand, the investment in the road & railway sector is greatly constrained by the financial resources of the Government. According to the investment level in the past, realizing the “2.5% of GDP” Investment Case seems to be extremely difficult.
From 2001/02 to 2004/05, while the total GDP (market price) in this period can be estimated at Rs. 21 trillion, the investment in the transport sector in the same period amounted to Rs. 182 billion, which equals only 0.86% of the estimated total GDP. If this trend continues until 2025, the amount of total investment in the sector from 2005/06 to 2024/25 is estimated at around Rs. 2.2 trillion. Table 6.1.13 shows the estimated investment level in the GDP Middle Growth Case.
Table 6.1.13 Investment Level under MTDF (2005/06-2024/25) (Unit: Million Rs.)
Federal Government
Self Financing / Corporation
Public-Private / Private Financing Total
Railway 233,447 0 0 233,447 Road 850,105 0 120,728 970,833 Port & Shipping 49,913 126,377 281,226 457,516 Airways 0 499,000 25,874 524,874 Total 1,133,464 625,377 427,828 2,186,669 Source: Prepared by JICA Study Team with Data from the MTDF
Therefore, under the current situation, the “2.5% of GDP” Investment Case requires strong and deliberate decisions from the Government.
(4) Proposed Investment Level
Establishing a sustainable funding mechanism for infrastructure development enables the investment level to get closer to the “2.5% of GDP” Investment Case. However, a sudden jump from the current level to 2.5% can hardly be expected, so 1.46% of the MTDF is assumed for 2006 – 2010 and thereafter the rate should be gradually raised toward 2.5%. As a result, the average proportion of GDP in transport sector investment for the period of 2006 – 2025 would be 2.0%. The cumulative investment amount would be Rs 5,106 billion (US$ 8.5 billion) which is regarded as an appropriate investment amount for the said period (Table 6.1.14).
Table 6.1.14 Target Investment Level at 2.0% of GDP (Unit: Million Rs.)
Federal Government
Self Financing / Corporation
Public-Private / Private Financing Total
Railway 545,080 0 0 545,080 Road 1,984,931 0 28,1890 2,266,822 Port & Shipping 116,542 295,080 656,643 1,068,266 Airways 0 1,165,128 60,412 1,225,541 Total 2,646,554 1,460,208 998,946 5,105,708 Source: Prepared by JICA Study Team with Data from the MTDF
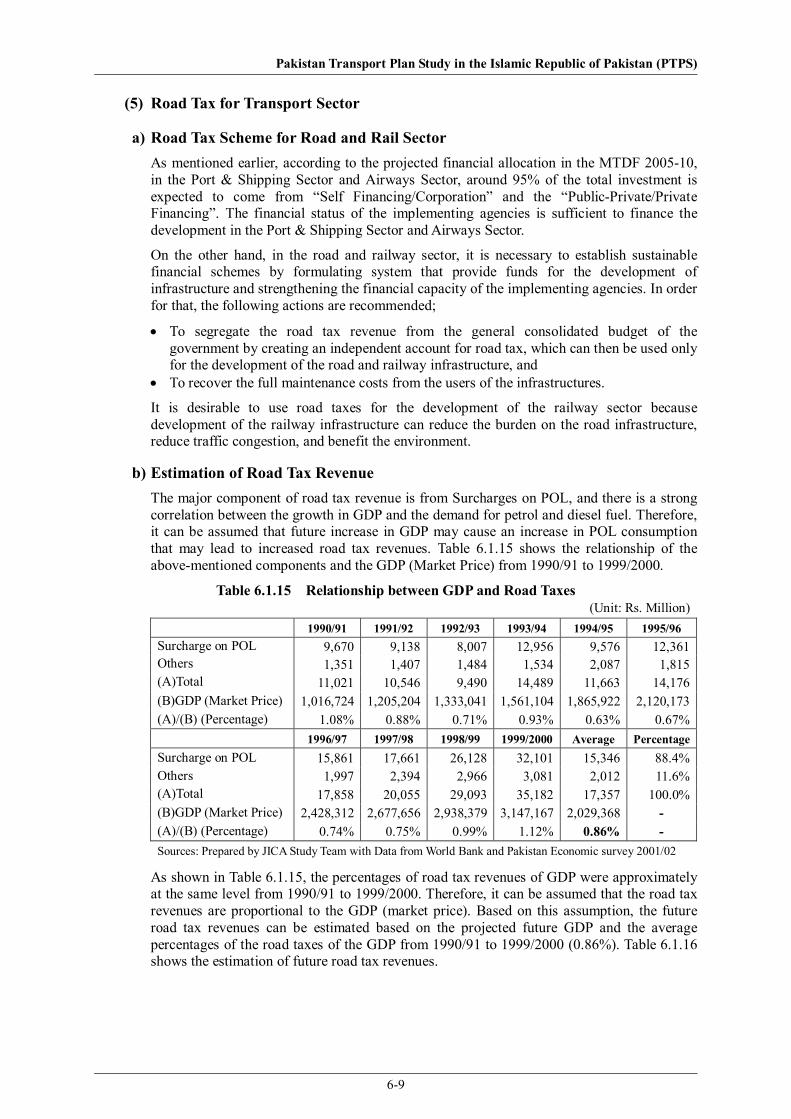
Pakistan Transport Plan Study in the Islamic Republic of Pakistan (PTPS)
6-9
(5) Road Tax for Transport Sector
a) Road Tax Scheme for Road and Rail Sector As mentioned earlier, according to the projected financial allocation in the MTDF 2005-10, in the Port & Shipping Sector and Airways Sector, around 95% of the total investment is expected to come from “Self Financing/Corporation” and the “Public-Private/Private Financing”. The financial status of the implementing agencies is sufficient to finance the development in the Port & Shipping Sector and Airways Sector.
On the other hand, in the road and railway sector, it is necessary to establish sustainable financial schemes by formulating system that provide funds for the development of infrastructure and strengthening the financial capacity of the implementing agencies. In order for that, the following actions are recommended;
• To segregate the road tax revenue from the general consolidated budget of the government by creating an independent account for road tax, which can then be used only for the development of the road and railway infrastructure, and
• To recover the full maintenance costs from the users of the infrastructures.
It is desirable to use road taxes for the development of the railway sector because development of the railway infrastructure can reduce the burden on the road infrastructure, reduce traffic congestion, and benefit the environment.
b) Estimation of Road Tax Revenue The major component of road tax revenue is from Surcharges on POL, and there is a strong correlation between the growth in GDP and the demand for petrol and diesel fuel. Therefore, it can be assumed that future increase in GDP may cause an increase in POL consumption that may lead to increased road tax revenues. Table 6.1.15 shows the relationship of the above-mentioned components and the GDP (Market Price) from 1990/91 to 1999/2000.
Table 6.1.15 Relationship between GDP and Road Taxes (Unit: Rs. Million)
1990/91 1991/92 1992/93 1993/94 1994/95 1995/96 Surcharge on POL 9,670 9,138 8,007 12,956 9,576 12,361Others 1,351 1,407 1,484 1,534 2,087 1,815(A)Total 11,021 10,546 9,490 14,489 11,663 14,176(B)GDP (Market Price) 1,016,724 1,205,204 1,333,041 1,561,104 1,865,922 2,120,173(A)/(B) (Percentage) 1.08% 0.88% 0.71% 0.93% 0.63% 0.67% 1996/97 1997/98 1998/99 1999/2000 Average PercentageSurcharge on POL 15,861 17,661 26,128 32,101 15,346 88.4%Others 1,997 2,394 2,966 3,081 2,012 11.6%(A)Total 17,858 20,055 29,093 35,182 17,357 100.0%(B)GDP (Market Price) 2,428,312 2,677,656 2,938,379 3,147,167 2,029,368 - (A)/(B) (Percentage) 0.74% 0.75% 0.99% 1.12% 0.86% - Sources: Prepared by JICA Study Team with Data from World Bank and Pakistan Economic survey 2001/02
As shown in Table 6.1.15, the percentages of road tax revenues of GDP were approximately at the same level from 1990/91 to 1999/2000. Therefore, it can be assumed that the road tax revenues are proportional to the GDP (market price). Based on this assumption, the future road tax revenues can be estimated based on the projected future GDP and the average percentages of the road taxes of the GDP from 1990/91 to 1999/2000 (0.86%). Table 6.1.16 shows the estimation of future road tax revenues.

Pakistan Transport Plan Study in the Islamic Republic of Pakistan (PTPS)
6-10
Table 6.1.16 Road Tax Estimation (Unit: Rs. Billion)
Fiscal Year 2005/04 -2009/10
2010/11-2014/15
2015/16 -2019/20
2020/21 -2024/25 Total
GDP Middle Growth Case 323 448 608 805 2,183 Sources: Prepared by JICA Study Team
c) Proposed Investment Level for Infrastructure Development On the other hand, the total amount of investment to be financed by the government for the development of the road & railway sectors is calculated at approximately Rs. 2.5 trillion in the “2.0% of GDP” Investment case and 1.8 trillion in the MTDF Case. Table 6.1.17 shows the amounts of the investment costs to be financed by the government in each case, which is accompanied by percentages of estimated road tax revenues.
Table 6.1.17 Comparison between Estimated Revenues and Financing from Budget (Unit: Rs. Million)
Funding Required from Budget
Road Railway Total
Percentages of Estimated Revenues
“2.5% of GDP” Investment Case 2,481,164 681,350 3,162,514 144.8% “2.0% of GDP” Investment Case 1,983,998 544,824 2,528,822 115.8% MTDF Case 1,449,865 398,146 1,848,011 84.6% Sources: Prepared by JICA Study Team with Data from the MTDF
According to Table 6.1.17, the investment level in the case of “2.0% of GDP” exceeds the projected road tax revenues by 16% and requires extra resources. One of the ways to achieve the extra resources is to issue government bonds etc. However, interest payments are one of the reasons that are forcing the budgetary expenditure to be inflexible. Therefore, it may be difficult for the government to raise funds through extra borrowings to compensate the gap between the investment level in the case of “2.0% of GDP” and the road tax revenues.
On the other hand, the investment level in the MTDF case can be realized with 85% of the projected road tax revenues. However, the remaining 15% of the projected road tax revenues should not be used for other purposes because the road tax revenues collected from road users must be returned to the transport sector through infrastructure development. Otherwise the road users will bear an unnecessary financial burden, which may put the development of the transport sector at risk.
Accordingly, it can be concluded that projected road tax revenues shown in Table 6.1.16 (Rs. 2.2 trillion) can be regarded as the future investment level. Table 6.1.18 shows the allocation of this proposed investment level. The percentages of road sector and railway sector investment in Table 6.1.18 are based on the same proportions of investment allocation as the MTDF. Therefore, it is recommended to revise the percentages of the investment allocation based on the development policy of the transport sector.
Table 6.1.18 Resource Allocation under Proposed Investment Level (Unit: Rs. Million)
Road Railway Total 2004/05 - 2009/10 253,112 69,507 322,619 2010/11 - 2014/15 351,478 96,519 447,997 2015/16 - 2019/20 476,773 130,926 607,699 2020/21 - 2024/25 631,691 173,468 805,159
Total 1,713,055 470,421 2,183,475 Percentages 78.5% 21.5% 100.0%
Sources: Prepared by JICA Study Team with Data from the MTDF

Pakistan Transport Plan Study in the Islamic Republic of Pakistan (PTPS)
6-11
6.1.3 Financial Reform of Road and Rail Sectors
(1) Financial Reform of NHA
a) Road Maintenance Account (RMA) By strengthening the function of the RMA, the funds for maintenance of existing roads can be separated from the National Budget, which is often influenced by the fluctuating political situation of Pakistan. This indicates that it is possible for maintenance funds for existing roads to be guaranteed from the revenues of the NHA, while the expansion of the road network shall be based on the transport policy of Pakistan with financing from the National Budget. In order to strengthen this scheme, it is recommended to establish the Road Development Account to efficiently control and monitor the funding for the development. Figure 6.1.1 shows a concept of the above-mentioned system.
Sources: Prepared by JICA study team
Figure 6.1.1 Introduction of Road Development Account for the NHA
This scheme is based on the idea that the government issues funds to the NHA for the development of the road network through the RDA, while the NHA maintains the road with the RMA which accumulates toll revenues from road users. By setting the RDA, the Government or the NHA can control the efficiency of the road development work with monitoring the cash flow of the RDA. On the other hand, by strengthening the function of the RMA, it will become easier to use the toll revenues from road users only for the maintenance of existing road network.
The arrow in Figure 6.1.1 from the RDA to the RMA does not mean cash flows, rather, it shows information on the depreciation costs to be recovered from toll revenues. The depreciation costs are expected to occur in the accounting process of the RDA because the fixed assets acquired with the fund of the RDA are recorded as a book balance of the RDA. On the other hand, since the depreciation costs are to be a part of the replacement costs of the existing facilities, the depreciation costs have to be recovered from toll revenues. However, since the depreciation costs are expected to occur in the book balance of the RDA, the amount of the depreciation costs to be recovered from toll revenues cannot be recognized in the RMA, which leads to a cash shortage for future replacement. In order to avoid this problem, it is necessary to include the amount of the depreciation costs in the calculation of the toll revenues required to balance the budgets of the RMA.
b) Accumulated Debt of NHA At present, the government finances the NHA with loans for the development of the road network and expects the NHA to repay the loans with its toll revenues. In other words, the government intends to recover the development costs of the road network with the toll
Ministry of Finance
National Highway Authority (NHA)
Road Maintenance Account (RMA)
Road Development Account (RDA)
Funds for Development
Tolls etc.
Road Users
Information on Depreciation Costs

Pakistan Transport Plan Study in the Islamic Republic of Pakistan (PTPS)
6-12
revenues of the NHA. Under the current scheme of funding to the NHA, the financial burden caused by the development of the road network over commits the RMA, which may cause a cash shortage for the maintenance of the existing road network.
In addition, as mentioned earlier, the cash injections for the road network development are expected to be recovered by increasing road taxes and not from NHA’s toll revenues. Therefore, the cash injection to the NHA for the network development should not be in the form of loans. In order to avoid those problems, it is recommended to convert the debts of the NHA to equity, which indicates the shares of the government, not the obligation of the NHA. Figure 6.1.2 shows a summary of the recommended scheme.
Sources: Prepared by JICA study team
Figure 6.1.2 Flow of Funds for the NHA after the Financial Reform
Even though the repayment of cash injections to the NHA is not required under this scheme, there are several ways for the government to recover the cash injection in the future.
The Ministry of Finance (MOF) is currently conducting the “Available Options for Sustainable Financing of NHA’s Programme” to determine feasible options for the sustainable financing for the NHA. In the draft report of the study conducted by the MOF, the revenue surplus shall be positive after 2012, and cumulative surplus shall be positive after 2020 as shown in Table 6.1.19.
Table 6.1.19 Estimation of Revenue Surplus (Unit: Billion Rs.)
FY 2005 2006 2007 2008 2009 2010 2011 2012 2013Revenue Surplus after Maintenance 0.5 9.0 -12.8 -12.9 -13.0 -13.0 -13.0 -0.5 0.4 Cumulative Surplus 0.5 9.5 -3.3 -16.2 -29.2 -42.2 -55.2 -55.7 -55.3
FY 2014 2015 2016 2017 2018 2019 2020 2021 2022Revenue Surplus after Maintenance 1.4 2.6 4.0 5.6 7.5 9.6 12.1 15.0 18.3 Cumulative Surplus -53.9 -51.3 -47.3 -41.7 -34.2 -24.6 -12.5 2.5 20.8 Sources: Prepared by JICA Study Team with Draft Report of “Available Options for Sustainable Financing of NHA’s Programme”
Since the commutative cash surpluses are expected to show positive figures from 2021 (see Table 6.1.19) the government and the NHA can choose whether to (1) pay dividends, (2) fund some development out of revenue, or (3) buy back its own equity (share buy-backs being the equivalent to repaying loan principal.) to recover the cash injections after the NHA’s toll revenues grow sufficiently.
National Highway Authority(NHA)
Information on Depreciation Costs
Road Network
Ministry of Finance
Road Development Account (RDA)
Equity
Development
Road Maintenance Account (RMA)
Road Users
Toll etc.
Maintenance
Road Taxes

Pakistan Transport Plan Study in the Islamic Republic of Pakistan (PTPS)
6-13
(2) Financial Reform of Pakistan Railways (PR)
a) Separation of Accounts by Business Units In order to clarify the possible inefficiency and improve the operation & maintenance (O&M) and investments, a new accounting system should be introduced, which separates the accounts by business units. Figure 6.1.3 shows a concept of the new accounting system.
Sources: JICA study team
Figure 6.1.3 Concept for New Accounting System
The existing accounts of the PR can be separated into the Operator Account, the Infrastructure Account and the Pension Payment Account.
Under this proposed accounting system, tariff revenues from railway users are collected in the Operator Account, which treats the cash flow of the O&M and investment activities with regards to rolling stocks. The Track Access Charges shall be charged to the Operator Account from the Infrastructure Account, based on the usage of the infrastructures. The Track Access Charges accumulated in the Infrastructure Account are used for the O&M of the existing infrastructure. In the case of expansion of the railway network, the government allocates the necessary funds to the Infrastructure Account.
When the above-mentioned accounting system is introduced, it is recommended to set account managers who are responsible for the Profits & Losses of the Operator Account and the Infrastructure Account. In the above-mentioned accounting system, if the Operator Account and the Infrastructure Account create losses, the government is required to provide necessary financial support. In this case, it becomes evident that the compensations for each account are due to the inefficient management by the account managers. In order to obviously evaluate the performance of the account managers, it is recommended to replace the present financial systems with a modern commercial accounting practice which is compliant with International Accounting Standards (IAS).
With regards to the Pension Payment Account, even though the Pension Payment is not the costs related to the current business operation, the PR is obligated to pay for it. Therefore, theoretically, those costs need to be charged to the Operator Account and the Infrastructure Account. The increase in the Pension Payments may bear severely on the Operator Account and the Infrastructure Account, which may lead to the fund shortages for the O&M and investments. Therefore, in order to avoid the financial burdens of those Accounts, the
Expenditures for O&M and Investments
Financial Support
for Investments
Financial Support
Expenditures for O&M and Investments
Accounts of PR (Existing Accounting System)
Account of O&M and Investments for Infrastructures
Account of O&M and Investments for Operators
Railway Users Employees and Suppliers Government
Tariff Revenues
Account of Pension Payment
Track Access Charges

Pakistan Transport Plan Study in the Islamic Republic of Pakistan (PTPS)
6-14
government should consider creating a separate account for the Pension Payments, which can then be compensated by the National Budget.
By separating the accounts shown above, it will become easier to analyse the causes of losses. In addition, the separation of the accounts can contribute to creating possible measures to improve the O&M and investments activities as follow.
• With regards to the O&M and investment activities of the Operators, it can be considered to take measures for privatization or private financing.
• With regards to the O&M of the infrastructures, it can be more efficient through partial private participations etc.
• The development of the railway networks shall be based on the clear transport policy with financing from the National Budget.
• The payment of pensions shall be funded by the government.
The concept of the above-mentioned accounting system is based on the scheme of the Road Sector that the government issues funds to the NHA for the development of the road network, while the NHA maintains the road with the toll revenues from road users. Therefore, after developing the recommended accounting system, it can be considered to privatize the Operator Account and create a new scheme that the government issues funds to the Investment Account for the development of the railway network, while the O&M of the railway network is funded by the Track Access Charges accumulated in the Investment Account.
In order to realize the above-mentioned measures, the accounting system should be improved as the first step.
b) Privatization of Operator Account The O&M and investment activities of the Operators can be conducted or financed by private companies, as well as the road sector. In the road sector, while the users of the infrastructures are private, the public organizations (governments or governmental implementing agencies) concentrate on financing and controlling the infrastructure development. It is also possible in the railway sector that the public organizations concentrate on the development of railway infrastructures by segregating the Operator Account from the governmental account through privatization and permitting new operators to use the railway infrastructures with the Open Access Policy. Figure 6.1.4 shows the concept of the privatization of the Operator Account and private financing with the Open Access Policy.

Pakistan Transport Plan Study in the Islamic Republic of Pakistan (PTPS)
6-15
Sources: JICA study team
Figure 6.1.4 Business Structure of the Railway Sector after Privatization of Operators
As described in Figure 6.1.4, the Operator Account privatized from the governmental account shall compete against new operators under the proposed scheme and this competition is expected to promote the improvement of business efficiency. In addition, the segregation of the Operator Accounts is expected to reduce the governmental financial burden accompanied by the O&M and Investments activities in the Operator Accounts. Under this scheme, the governmental organizations are expected to maintain the railway infrastructures in good condition, introduce the Open Access Policy, and set an adequate level of the Track Access Charges.
6.1.4 Private Sector Involvement in Transport Sector
(1) Introduction
The Government of Pakistan (GOP) formulated a ten year investment plan for the transport sector (2005-2010). Of the total investment requirement around 48% is expected to be from the self financing/Corporation and the public-private/private sector. The importance of the financial self-reliance of implementing agencies and private sector participation in the development of the transport sector is highlighted in the Medium Term Development Framework 2005-20010(MDTF).
In Pakistan, there are several projects that have been implemented under a BOT or BOO basis and most of them are in the port and shipping subsectors. In the aviation subsector privatization is well advanced by PIA and it is only a matter of time before the CAA will be going through the institutional reform. In the railway subsector, sweeping reform is taking place and the opportunities for private sector involvement will be enhanced. Lastly, the private sector involvement in highways and motorways has not been successful and it remains questionable whether the BOT or PPP can finance the targeted projects.
Tariff Revenues
TrackAccess
Charges
Accounts of PR (Governmental Accounts)
Expenditures for O&M and Investments
Account of O&M and Investments for
Infrastructures
Account ofO&M and Investments
for Operators
Railway Users
Employees and Suppliers
OperatorsPrivatized from PR
New Other Operator 1
New Other Operator 2
New Other Operator 3
Privatization
Pakistan Transport Plan Study in the Islamic Republic of Pakistan (PTPS)
6-16
(2) Port and Shipping Subsctor
Private financing, including on a BOT or BOO basis, have so far been successfully promoted by Karachi Port Trust (KPT) and Qasim Port Authority (PQA) for the development, construction, and operation of terminals and berths. For example, Karachi International Container Terminal (KICT) has been in operation since 1998 and it was originally leased out by KTP to APL, Pakistani company, on a BOT basis for 20 years. Moreover, a Pakistan International Container Terminal (PICT) was the first private terminal to be owned and operated by a Pakistani company. However, it was leased to Trustees of the Port of Karachi for 21 years from June 2002.
At present, PQA is promoting privatization for the port development, and the following privately operated terminals have been established: Iron Ore and Coal Berth (IOCB): This berth was build by PQA and has been leased to Pakistan Steel: PQA is responsible for maintenance. IOCB commenced operation in 1980 and the equipment for unloading and transferring the ore and coal to Pakistan Steel has been installed and is maintained by Pakistan Steel. The berth has been leased to Pakistan Steel.
Qasim International Container Terminal (QICT): The agreement was signed in 1995 between PQA and a group of companies led by P&O Port-Australia, and QICT commenced operation in 1997. Berth Nos.5 to 7 of the marginal wharf including a 400m back up space has been leased to the owners of QICT on a BOO basis.
FOTCO Oil Terminal: The agreement was signed between PQA and FOTCO in 1992. The terminal was constructed on a BOO basis, and the charges for a minimum of 4 million tons of heavy furnace oil per year have been guaranteed by the GOP. Engro Vopak Terminal: The agreement was signed between PQA and Engoro Chemical, Pakistan and VOPAC Holland in 1998. The terminal was constructed on a BOO basis.
Only Marginal Wharf berths No. 1 to 4 are under direct management of PQA. Berth No.1 is being used for liquid bulk handling and berths Nos. 2 to 4 for dry bulk.
(3) Aviation Subsector
Pakistan International Airlines (PIA) was incorporated in Pakistan in 1956 under the Pakistan International Airline Corporation Act. 1956. In 2004, PIAC sold 5.74% of its share via an IPO. The second offering of 5% shares of PIA was offered. CAA was planning to build the new Islamabad International Airport on a BOT basis. It has acquired a large tract of land for the new airport construction. It is unknown, however, whether the CAA is pursuing the BOT idea or not.
Currently, CAA operates more than 40 airports within Pakistan. International trend is that most airports are increasingly operated by private sector or local authorities. Usually, the private sector will be involved in the larger, busier airports where income from commercial services to passengers is greater than income from aircraft landing fees. The private sector will not be involved in the airport where commercial opportunities do not exist, and as an alternative the government brings in the local authorities to run the operation.
CAA, a public corporation, has three roles: Regulator, Developer and Operator. This creates a conflict of interest for the government in the aviation sector. The CAA role needs to be limited to a regulator. In the UK, for example, the Civil Aviation Authority sets safety standards and undertakes air traffic control in UK air-space, but it does not operate any commercial airports. These airports are operated by British Airport, a private company and local authorities.
CAA’s role as regulator, financier, developer, and operator creates a conflict of interest and the government need to start thinking about reforming the management of Pakistan’s aviation sector. To make Pakistan’s CAA function as the regulator that sets safety standards for aircraft, airports and staff and that controls the use of air-space like the UK Civil Aviation

Pakistan Transport Plan Study in the Islamic Republic of Pakistan (PTPS)
6-17
Authority, opportunities for private sector involvement will be enhanced. The idea of the private sector participation in the new Islamabad International under a BOT or PPP arrangement presents a challenge for the privatization of the aviation industry in Pakistan.
(4) Railway Subsector
Private sector participation in the railway industry has not been successful so far. In order to increase private sector participation the government published an “Open Access Policy (OAP)” in 1996 for effective utilization of railway infrastructure through “unbundling” the railway services. The goal of the government was to rebuild the railway industry’s commercial capabilities and reputation for quality services. GOP solicited private sector bids to transport fuel oil by rail on behalf of Pakistan State Oil (PSC) to upcountry private power stations. There was no positive reaction from the targeted private sector. In April 1997, the government went a step further to privatize Pakistan Railways. In the GOP’s plan, PR was to be restructured into three core businesses― freight, passenger and infrastructure, plus residual entity― and sold to the public. The plan did not succeed and instead impacted negatively on the operation of PR and infrastructure development and conservation.
A sweeping institutional reform for PR has been under consideration and the plan calls for a new public corporation with more autonomy and powers in its governance. The new enterprise will be able to provide the opportunities for private sector involvement in operations of freight transport and railway related industries.
(5) Road Subsector
GOP has, over the past decade, attempted to attract private sector investments into highways and motorways but it has not been successful. There are reasons attributing to the unsuccessful attempts, including (i) poorly developed domestic capital market and lack of access to long term debt, domestic and international; (ii) a fragile macro-economic situation, (iii) absence of a legislative framework. (iv) lack of experience in BOT and PPP projects in both public and private sectors; (iv) inherent risks of investment in the public works, particularly, in highways and motorways, and (v) absence of criteria for project selection.
In the Five Year Plan of NHA, Rs.91 billion is envisaged to be financed by BOT/PPP for its highways and motorway projects. In the past, NHA attempted to attract private capital for the construction of M-2: Islamabad-Lahore Motorway (367 km) on a BOT basis. A concession agreement was executed with Daewoo as the sponsor/contractor but the motorway was completed by traditional public financing through a direct loan of US$667 million from Daewoo by the GOP’s guarantee. Five years after completion of the M-2, NHA still owes Daewoo US$793 million. Construction of M-3: Pindi Bhattian – Faisalabad Motorway (53 km) was also initiated on a BOT formula but the BOT contract was terminated for technical reasons. The motorway was completed by the original contractor, again through a traditional public finance. Currently, NHA are negotiating the construction of M-4: Faisalabad–Multan Motorway (243 km) on a PPP basis.
To accelerate the national highways and motorways development by private sector involvement, the NHA has enlisted the following projects in its Five Year Plan that will be financed on a BOT/PPP basis. The total value of these projects is estimated at US$820 million, contributing 25% of the Five Year Plan
(i) Karachi-Hyderabad Motorway (M-9) (ii) Faisalabad-Khanewal Motorway (M-4) (iii) Karachi-Kakar Motorway (M-7) (iv) Peshawar Northern By-Pass (v) Rawalpind By-Pass & Tarnol Interchange (vi) Lakpass Tunnel (vii) Shahdara Flyover (viii) Karachi Northern By-Pass

Pakistan Transport Plan Study in the Islamic Republic of Pakistan (PTPS)
6-18
(6) Problems in the Selection of the BOT/PPP Projects
NHA needs to recognize that by the application of a BOT/PPP concept to the highways, unless they are willing to participate in equity, it will change the NHA’s role as the investor/borrower, since this role has to be delegated to private sector investors. By delegation of all the risks, including financing, the construction, operation and maintenance of highways and motorways will be allocated to private sector investors. This will considerably increases the project cost (sometimes up to 30%-40%) due to, among other things: (i) private sector borrowing from commercial banks and capital markets always costs more than sovereign borrowing, (ii) a considerable amount of operational and management expenses, i.e. quality control, surveying, permission and licensing fees, etc. (these costs are hidden among normal costs related to financing every day’s activities of NHA administration) and (iii) the main contractor/investor, accepting lump sum, turnkey, fixed price construction contract conditions, is tempting to accelerate the reimbursement of their equity or part of it by construction works.
A key element that should always be evaluated carefully, in this respect, is the estimated time period by which the projects would probably have to be delayed until such an opportunity arose. On that basis, for the time period under consideration the “socio-economic” benefits at stake, i.e. the cost of the project not being implemented at an optimal date, could be calculated. The period starts in the year when traditionally used parameters characterizing project efficiency such as net present value (NPV) or internal rate of return (IRR) exceed previously approved and generally acknowledged threshold values which characterizes “matured” projects. The amount of “socio-economic benefit in jeopardy” should be compared to the cost increase caused by private sector involvement in financing the project. If, and when, the ratio of the benefits in jeopardy and the cost increase is above 1.0 or exceeds a previously identified and approved limit say 1.5, then, the selection of the project is justified.
The motorway concessions are generally evaluated using quite sophisticated cost-benefit or multicriterial analysis, providing a set of efficiency indicators(NPV, IRR, Benefit-cost Ratio, etc.) measured against approved earlier threshold values of these indicators attributed to project classified as matured, economically viable or socio-economically justified. The methodology of economic and financial evaluation aiming at preparing transport infrastructure investment decisions are slightly different in case of infrastructure projects intended to be financed entirely publicly or through PPP based on limited recourse financing. In the former case capital recovery or depreciation are not counted generally among maintenance and operation expenditures, since NHA is not obliged to follow corporate accounting practice.
In practice, this comparative analysis can not performed due to the lack of professional expertise and experience in the both public authorities and private sector as well. The economic benefits analyses, furthermore, need to cover the commercial and financial analysis as if they are corporate projects with a cash flow and other essential criteria. Carrying out economic benefit analysis combined with political and strategic benefits may not be enough to be criteria of investor’s terms and conditions to participate in road projects equitable agreement, need to be counted in the financial and commercial analysis.
For the private sector to show interest, a venture must be profitable. For roads, this implies a good income from tolls and perhaps government subsidies as well in the form of “shadow traffic” or a government guarantee on debt service like the case of the M-2. Toll levels are commonly constrained by the existence of alternative routes that are free. The Kohat tunnel illustrates this point. Many trucks, even laden trucks, struggle over the hill rather than pay the toll to use the tunnel. NHA is already tolling all the national highways and motorways. PPP is not a solution to funding roads. Unless the criteria for the selection of the BOT/PPP projects are established and applied diligently, the costs increase by financing on a BOT/PPP basis will impact negatively on NHA budget.

Pakistan Transport Plan Study in the Islamic Republic of Pakistan (PTPS)
6-19
6.2 Transparent Prioritization 6.2.1 Administrative Framework
(1) Introduction
Transport infrastructure plays a key role in the nation’s economic and social development and the economic development of Pakistan heavily depends on the improvement and modernization of key transport systems. High economic loss from congestions and poor quality roads and maintenance and inability to fill the gap between supply and demand for transport services and supporting infrastructure have been of grave concern to the Government of Pakistan (GOP), and these problems need to be addressed by improving governance in the transport sector.
The development of an efficient transport system has been hindered due to multiple reasons: One of them is the resource constraints and others include: (i) multiple objectives for medium-term and long-term investments, resulting in misplaced priorities, (ii) poorly justified investments, (iii) lack of implementation capacity and (iv) insufficient private sector participation. Over the past five years the GOP has taken a number of actions to address these key constraints such as the finalization of a new Ten-Year Plan (2005-2010) or MTDF, the formulation of an integrated transport policy, the revitalization of railways and the improvement of new trade and transport facilitation.
To strengthen the implementation capacity of federal agencies, provincial governments need to be supported by an integrated national transport policy, streamlined decision-making process and procedures for investment programs and co-ordination mechanisms at various levels. Research and development and institutional and regulatory reforms are also required. Last but not least, the creation of an environment for private sector investment, particularly direct foreign investment (DFI), and institutional and regulatory reforms required for creating market force and attracting private sector participation in railways, national, provincial and urban road networks.
(2) Administration of Transport Sector
At present, responsibility for transport is divided among four federal ministries, four provincial governments and seven autonomous authorities:
• Ministry of Communications (MOC) - responsible for the national road sub sector, • Ministry of Railways (MOR) - responsible for railways • Ministry of Defence (MOD) - responsible for airports and civil aviation, and • Ministry of Port and Shipping (MOPS) responsible for ports and shipping.
Post and Telecommunications, which was under MOC has been merged into the Ministry of Information and Technology (MOIT). Until 2001 MOC and MOR were separate ministries and they were merged into a single ministry for a brief period of time and they were separated again in 2002. Under these federal ministries there are number of autonomous and semi-autonomous organizations, i.e. National Highway Authority (NHA) under MOC, Karachi Port Trust (KPT), Qasim Port Authority (QPA) and Pakistan National Shipping Corporation (PNSC) under MOPS, and Civil Aviation Authority (CAA) and Pakistan International Airlines (PIA) under MOD, all are accountable to their respective federal ministries.
At the Provincial level, Communications and Works departments of 4-provinces (Punjab, Sindh, NWFP, Balochistan) are responsible for the provincial road network. Following the implementation of the Devolution Plan, a majority of the intra-district provincial road networks have been devolved to the districts.

Pakistan Transport Plan Study in the Islamic Republic of Pakistan (PTPS)
6-20
(3) Structural Problems of Transport Administration
In the absence of a single ministry to deal with all modes of transport the decision concerning the sector development programmes/projects and their prioritization needs to be taken by the central government. Currently, the formulation of development programmes and projects in the transport sector is highly compartmentalized and not based on intra-sectoral priorities. There are multiple federal ministries, provincial governments and autonomous authorities that are responsible for the administration of the transport sector (hereinafter referred collectively to as the “Implementation Agencies”). There is no forum of debates amongst these government administrations to ensure an integrated and coordinate approach to the formulation of development programmes and projects. Instead, these sponsoring ministries and provincial governments have been competing for PSDP allocation based on an “urgent” basis to obtain budgetary support and external assistance, often ignoring the implications on the other sector developments. The result of the lack of inter- and intra-sectoral coordination, as the MTDF points out, is huge economic losses. Beside economic loss, the uncoordinated approach to the selection of the projects and mismanagement of investments hinders social development and causes ecological degradation.
Problems could be caused by, to a certain extent, the deficiencies of the implementation capacities but, to a greater extent, to the misallocation of PSDP that have resulted from the lack of inter and intra-sectoral prioritization, lack of monitoring and auditing of the implementation of programmes. In spite of the fact that the transport sector has accounted for 20-30% of PSDP in recent years, Pakistan’s public transport systems continue to suffer from poorly targeted investments, neglect of essential maintenance, traditional labour and uncommercial practices and obsolete general purpose distribution systems that have led to severe capacity bottlenecks, high transport costs, poor safety standards and low levels of services. As MTDF points out the industrial and commercial growth and export competitiveness are handicapped by an inadequate and outmoded infrastructure.
6.2.2 Decision-Making Regarding PSDP
Public Service Development Programmes (PSDP) is an annual budgeted programme that is approved by the Central Government. National transport projects can be carried out under the endorsement of PSDP.
(1) Programme Approving Bodies
Sponsoring Federal Ministries submit their programme proposals to Planning and Development Division and passed on to the Approval Bodies for examination and approval. The approved programmes become the PSDP.
a) The National Economic Council (NEC) NEC is headed by the Prime Minister (PM). Its members include Minister of Commerce & Industry, Minister of Petroleum & Natural Resources, Minister of Water and Power, Minister of Education, Minister of Environment, Advisor to PM for Finance & Economic Affairs, Special Assistant to PM Social Sector, Chairman Board of Investment, Chairman Privatization Commission, Chairman Planning Commission, Governor of State Bank and Cabinet Secretary, Special invitations to secretaries and other members.
b) Annual Plan Coordination Committee (APCC) APCC is headed by Deputy Chairman Planning Commission and its members include Finance Division, Planning Division, Economic Assistance Division (EAD), Federal Ministries and Provincial Governments.

Pakistan Transport Plan Study in the Islamic Republic of Pakistan (PTPS)
6-21
c) Priority Committee Priority Committee is headed by Additional Secretary Budget Financial Division (Chairman) and its members include Finance Division, EAD and Implementation Agencies.
(2) Approval Process of PSDP
PSDP covers all social and economic sectors, i.e. infrastructure, social development and finance. Infrastructure includes water, power, energy and transport sectors. Transport sector is comprised of roads, railways, ports and shipping and aviation sub-sectors. Proposals for investment programs are prepared independently by the Implementation Agencies and reviewed and approved by a centralized review and approval mechanism: Priority Committee, Annual Plan Coordination Committee (APCC) and the National Economic Council (NEC). Projects of the Implementation Agencies must be included in the PSDP and they are scrutinized by Central Development Working Party (CDWP) and Executive Committee of National Economic Council (ECNEC) before they are funded.
Figure 6.2.1 Approval Process Regarding PSDP
6.2.3 Decision Making Regarding Projects
(1) Project Approving Bodies
a) Executive Committee of National Economic Council (ECNEC) ECNEC is headed by the Federal Minister of Finance and its members include Federal Ministers of economic ministries, Provincial Governors/Chief Ministers or their nominees and Provincial Ministers concerned. The functions of the ECNEC are:
• To sanction development schemes in the public and private sectors • To allow moderate changes to the plan and the plan allocations
NEC (National Economic Council)
PSDP
APCC (Annual Plan Co-ordination Committee)
MOF (Ministry of Finance)
Revenue/ CBR
Finance EAD (Economic Assistance Division)
Donors
Priority Committee
Planning Commission
Implementation Agencies
Implementation Agencies: - Federal Ministries, - Provincial Governments, and - Autonomous Organizations
Source: JICA Study Team
Pakistan Transport Plan Study in the Islamic Republic of Pakistan (PTPS)
6-22
• To supervise the implementation of economic policies laid down by the NEC or the Government
b) Economic Coordination Committee (ECC) of the Cabinet ECC is headed by the Federal Minister for Finance and Federal Ministers of economic ministries as its members. It attends to all urgent day to day economic matters and coordinates the economic policies initiated by the various Divisions of the Government. It keeps vigilance on the monetary and credit situation and makes proposals for the regulation of credit in order to maximise production and exports and to prevent inflation. It gives approval to the projects in private sector and public sector energy projects.
c) Central Development Working Party (CDWP) The development projects exceeding a certain financial limit prepared by Federal Ministries, Provincial Governments, Autonomous Organizations, etc. are scrutinized for the purpose of approval by the CDWP which is headed by the Deputy Chairman, Planning Commission and which includes as its members the Secretaries of the federal ministries concerned with the development and the heads of Planning Departments of the Provincial Governments. Federal Ministries which are permanent members of the CDWP should not be represented below the rank of Additional Secretary. Similarly, the concerned Federal implementation agencies should be represented at the level of Head of the Department or Additional Secretary. The schemes approved by CDWP costing above Rs.500 million are submitted to ECNEC for final approval.
d) Departmental Development Working Party (DDWP) It a body for approving development project/programmes for federal Ministries/ Division/ Department according to their approved financial limit which is set at Rs. 40 million. It is headed by the respective Secretary/Head of Department and includes representatives of finance division and concerned Technical Section in the Planning and Development Division
e) Provincial Development Working Party (PDWP) Each province has a PDWP which is headed by the Chairman, Development Board/Additional Chief Secretary (Development) and includes Secretaries of the Provincial Department Concerned with development, as its members. PDWP scrutinise various projects for inclusion in the Annual and Five Year Plan. It is competent to approve projects up to Rs.5 billion. Projects exceeding this limit are submitted to the CDWP and ECNEC for approval. All projects requiring foreign funding or federal government financing or federal government guarantees are submitted to CDWP and ECNEC for approval.
(2) Approval Process and Procedures for Projects
Federal projects are approved in accordance with the process illustrated below:

Pakistan Transport Plan Study in the Islamic Republic of Pakistan (PTPS)
6-23
Figure 6.2.2 Approval Process and Procedures of PTPS Projects
a) Federal Projects Submission of Projects to Approving Bodies Projects sponsored by the Federal Ministries/Autonomous organizations apply for funding of projects that are included in the PSDP by submitting to the Planning and Development division an original of PC-I/PC/II. The PC-I is a proposal for development Projects while PC-II is Feasibility Study of Proposed Development Projects.
A copy of the PC-I/PC-II is sent to the respective Financial Advisor of Financial Division for comments before submitting the same to the members of the DDWP/CDWP. A project proposal by the Federal Ministries/Autonomous organizations must be supported by a statement that the project has been seen and approved by the Secretary of the Ministry concerned.
Processing of Projects As soon as a copy of PC-I/PC-II is received by a member of the Planning Commission, DDWP and CDWP, its examination must be conducted expeditiously so that the same is approved/rejected in accordance with the time schedule. So far as the Planning and Development Division is concerned the schedule is as under:
• Registration and circulation of projects to all the Sections of the Planning Commission and other members of CDWP = 1 day
• Finalization of comments for consideration by CDWP=4-6 weeks
The Planning and Development Division has to ensure that PC-I/PC-II has been prepared correctly and according to the prescribed procedures. In case, the PC-I is found to be deficient it will be returned to the sponsors with the approval of Secretary (Planning)/Deputy Chairman, Planning Commission under intimation to all members of the CDPW.
Procedure for Meetings of Approving Bodies The CDWP and ECNEC meet regularly every month and every six weeks, respectively. The procedure for approving projects should be streamlined so that a project is approved within 2 months. The Planning and Development Division provide the secretariat for CDWP.
Projects up to Rs. 40 Million
Project Rs. 40 to Rs. 500 Million
Projects over Rs. 500 Million
DDWP Sanction
ECNEC Sanction
CDWP Sanction
Implementation Agencies Submission of PC- I & PC- II
Planning Communication Appraisal and evaluation of
PC- I & P- II MOF
Donors
EAD
ECNEC = Executive Committee of National Economic Council DDWP=Departmental Development Working Party CDWP=Central Development Working Party MOF= Ministry of Finance PDD= Planning and Development Division
Source: JICA Study Team EAD = Economic Assistance Division

Pakistan Transport Plan Study in the Islamic Republic of Pakistan (PTPS)
6-24
The minutes of the CDWP meeting are recorded by the Planning and Development Division and circulated to those represented at the meeting and other agencies concerned. The agencies represented on the CDWP are, however, expected to take action required by them without waiting for the minutes. The minutes of CDWP are treated as confidential. The minutes/record of discussion of ECNEC are also treated as secret. However, discussions of ECNEC in respect of PSDP projects would be unclassified unless specially classified by the Planning and Development Division.
The approved project becomes eligible for funding from MOF. Funds are released quarterly to the accounts of Implementation Agencies. For a project requiring foreign funding it will be channelled through Economic Assistant Division (EAD) to Donors.
b) Provincial Projects Provincial Development Working Party (PDWP) has the power to approve a project up to Rs.5 billion. Provincial Ministries submit PC-I/PC-II to Provincial Planning and Development Department for approval by the PDWP. The approval of a project costing over Rs.5 billion or requiring foreign funding or federal government financing or guarantees requires the approvals of CDWP and ECNEC. In this case the PDWP makes recommendation to CDWP through Planning Commission. CDWP evaluates the project and makes recommendation to ECNEC for approval. After ECNEC’s approval the project will be sent back to PPDD for submission to MOF and/or EAD. The diagrams below show the process and procedures regarding provincial projects up to Rs. 5 billion.
Source: JICA Study Team
Figure 6.2.3 Approval Process Regarding Provincial Projects up to Rs. 5 billion
Provisional projects valued at over Rs. 5 billion or that require foreign funding or federal government financing or federal government guarantee require the approval of CDWP and ECNEC. Projects costing below Rs.5 billion requiring foreign funding or federal government guarantee are processed through the above bodies and passed on to the Planning and Development Division where they are examined by the various Technical Sections concerned and a Working paper is prepared and placed before the CDWP. ECNEC then approves them by the recommendation of CDWP. The basic principle of review of projects, both at the federal and provincial levels, is that projects are examined jointly and simultaneously rather than in succession. (Refer to “Procedure for Preparation and Approval of development Schemes” approved by NEC in July, 1959).In accordance with the Procedure, copies of PC-I/PC-II have to be sent by the sponsoring provincial governments to the Planning and Development Division and other members of the CDWP for simultaneous examination.
PPDD Appraisal, evaluation of PC-I & PC-II
Implementation Agencies: Submission of PC – I & PC - II
Projects up toRs. 5 billion
PDWP Sanction
MOF
PDWP = Provincial Development Working Party MOF= Ministry of Finance PPDD = Provincial Planning and Development Department

Pakistan Transport Plan Study in the Islamic Republic of Pakistan (PTPS)
6-25
Source: JICA Study Team
Figure 6.2.4 Approval Process Regarding Provincial Projects above Rs.5 billion
6.2.4 Issues for Decision-Making on Transport Sector
(1) Characteristics of Decision Making for Projects and Programmes
A close examination of the process and procedure for the decision making concerning the programs and projects reveal that there are no institutional checks and balances that determine the intra-sectoral priorities with a ‘bottom-up’ approach to the budgeting system. Priority Committee, APCC and NEC review the development programmes from the angle of the budgetary, regional, political and strategic compatibilities and conformities while CDWP and ECNEC function as institutional checks and balances and determine inter-sectoral priorities. Determination of intra-sectoral priorities are, therefore, left to be unchecked or passed over to the Cabinet or Prime minister. In the absence of an approved national transport policy the prioritization of investments in transport sector largely depends on an ad hoc and highly political decision.
(2) Needs for a National Transport Policy and a Intra-Sector Co-ordination
The central government decision-making process for investments in the transport sector may have developed deficiencies like poorly targeted investments and maintenance neglect, etc. These deficiencies are also caused by the absence of approved national transport policy and the intra-sectoral coordination mechanisms. The sector development and investment plan needs to be prepared based on long-term objectives and within the framework of an approved national transport policy. Furthermore, the formulation of the investment programmes need to be initiated by the sector’s Implementation Agencies and presented to a high level forum for debate so as to define the needs and requirements and determine the priority. In the absence of a single ministry the decision on the investments may be politicized and the competition among the Implementation Agencies for PSDP allocation intensifies as the resource constraints increase.
Whether a national transport policy and an intra-coordination mechanism are the issues to be addressed immediately or not there is an advantage tohaving an approved national transport policy and coordination mechanism. Under the new arrangements the central government will be able to focus more on the programmes rather than on individual projects. The
Provincial Planning and Development: Appraisal, evaluation
of PC-I & PC-II
Implementation Agencies: Submission of PC – I & PC - II
Projects over Rs. 5 billion or foreign funding or federal government financing or guarantee
PDWP Sanction
MOF
Planning Commission
CDWPSanction
ECNECSanction
EAD Donors
ECNEC = Executive Committee of National Economic CouncilCDWP = Central Development Working Party) PDWP = Provincial Development Working Party MOF= Ministry of Finance EAD = Economic Assistance Division PPDD = Provincial Planning and Development Department

Pakistan Transport Plan Study in the Islamic Republic of Pakistan (PTPS)
6-26
attention of the government on planning, coordination, financing and regulating on programme basis is urgent in the case of the transport sector, and it must cover major areas, particularly neglected ones such as highway safety, urban transport systems, R&D, human resource development, institution building and organizational reform.
6.2.5 Institutional Reform
(1) Introduction
The transport sector is currently administered by four federal ministries, four provincial government and six autonomous authorities. The absence of a single ministry “Ministry of Transportation” that encompasses all subsectors has created negative effects on the improvement and modernization of key transport systems in Pakistan. It is a well known fact that the railways and roads have been competing since 1976 while the Karachi and Qasim Ports have coordination and cooperation problems. Under these circumstances it is necessary to establish a forum where these competing federal agencies can meet regularly and debate the issues and problems relating to transport.
One of the negative effects of the misallocation of PSDP and maintenance neglect is the current situation where the maintenance backlog has become an alarming proportion and the condition of 47% of the national highway network which caters to more than 70% of the total inland traffic, is classified as “poor”. Improvement on the NHA management of maintenance now needs to concentrate on the research and development in construction materials and design standards applicable to Pakistan.
(2) Negative Effect of Transport System on National Economy
The formulation of development programmes and projects in transport sector is highly compartmentalized. There is no institutional mechanism that facilitates the coordination amongst the federal ministries, autonomous authorities and provincial governments responsible for the transport sector to ensure an integrated and coordinated approach to the formulation of sector development programmes. The MTDF makes a case by stating that “the performance of the transport system has been poor, with high economic losses from congestion and poor quality roads and a mismatch between supply and demand for transport and supporting infrastructure. There are logistics constraints, which impede competitiveness of the country’s trade and industrial development. It is estimated that the inadequate and inefficient transport system is imposing a cost to the economy in excess of Rs.220 billion annually or 8.5% of the GDP, constraining economic growth, reducing export competitiveness, and hindering social development” (Prefer to MTDF p.442).
The sorry state of the transport system described in MTDF should not be taken lightly. Beside the enormous economic loss the negative effects of unplanned system and mismanagement of investments hinder social development and ecological degradation. Problems could be caused by, to a certain extent, the deficiencies of implementation capacity but, to a greater extent, to the monitoring and auditing the implementation of programmes. The absence of an integrated transport policy and lack of inter-and intra-sectoral coordination are also root causes of the negative effects of investment. In any account, the Government, considering the financial constrains, needs to take radical steps to minimize the losses and liabilities caused by the transport administration such as those pointed out by MTDF. The transport system should contribute to rather than hinder economic growth and the problems will persist unless steps are taken to remove the root causes. Some of the measures which are imperative would be the institutionalization of intra-sectoral coordination and cooperation throughout the PSDP and PSDP project approval process.
(3) Needs for a National Transport Policy
Lack of the co-ordination efforts by the federal ministries, provincial governments and autonomous authorities in charge of transport systems could be one of the causes for the

Pakistan Transport Plan Study in the Islamic Republic of Pakistan (PTPS)
6-27
inability of the government in the optimum utilization of the financial capacity of the country. In this regard, MTDF stated that “The development of an efficient transport sector has also been hindered due to misplaced priorities and the absence of an approved transport policy” (Refer to MTDF p.442.).
The role of an approved national transport policy can play in the PSDP and PSDP projects should not be underestimated. The design of the Policy needs to focus, first, on the few major areas to achieve maximum return on the investments already made. The policy need to be based on the scientific principles and techno-economic reality. A well conceived policy will provide a framework for the planning, financing and implementing sector development and a base on which the distribution of tasks amongst measures the central government, federal ministries, provincial governments and autonomous authorities for the mitigation of the negative effects caused by the past mismanagement of investments.
Furthermore, the problems of the current state of the transport system are, to a large extent, due to the PSDP and PSDP projects approval process and the implementation capacities. Decision-makers, in this regard, need to factor in the capacities of the implementation agency in allocating funds and this will require a strengthening of monitoring and evaluation of project implementation. Should a national transport plan and intra-coordination mechanisms be timely and properly constituted, the central government will be able to focus on the programme rather than individual projects with more attention on the critical areas such as traffic safety, urban transport systems, human resource development, R&D, institution building and regulatory reforms.
(4) Need to establish a Transport Coordination Mechanisms
The centralized mechanisms for review and approval of PSDP are mainly concerned with checks and balance of inter-sectoral and macro-economic contexts. Once the development programs for each subsector are allocated, other centralised project review and approval mechanisms (CDWP and ECNEC) provide institutional checks and balances and determine inter-sectoral priorities. The coordination among the ministries must be done before the PSDP and debated on the matters relating to the integration of all modes of transportation on which the sectoral prioritization of investment are based.
Issues and problems of intra-sectoral co-ordination was addressed in the past studies. For example, a national transport plan study undertaken by JICA in 1995 expressed1 concern over the lack of intra-sectoral coordination and cooperation and recommended restructuring of a number of ministries into a single Ministry to handle all modes of transport. The rationale behind the proposal was that such a restructuring would provide, at the ministerial level, a forum for debate of transport related issues and the pursuit of an integrated transport policy and create a platform for liaison with other ministries and with the Planning Commission on the transport needs and implications of other sectors of the economy.
A similar proposal was made in 1999 by the World Bank and, in its “Transport Sector Development Initiative2 (TSDI)” to create of a ‘National Transport Policy Board’ and a unified ‘Ministry of Transport’ that encompasses all subsectors in order to fill the gap.
The ADB, in a study3 conducted by a short-term consultant in 2003, put forward a set of recommendations, including the establishment of a high-level ‘Transport Council’ to a working-level ‘Transport Coordination Committee’. Subsequently, ABD organized a Technical Assistance in 2004 to assist the Government in the formulation of a comprehensive transport policy as a follow up to the findings of the TSDI. No progress has been made to date.
1 Study on National Transport Plan in the Islamic Republic of Pakistan, JICA 1995, Final Report/Volume II, p.11-61 2 Transportation Sector Development Initiative, World Bank 1999 3 “National Transport Policy-Assessment of Critical Transport Sector Needs” ADB 2003

Pakistan Transport Plan Study in the Islamic Republic of Pakistan (PTPS)
6-28
To address the issues and problems of a national transport policy and coordination the JICA study proposed the following institutions.
(5) The Establishment of Transport Coordination Mechanisms
It is recommended that in order to remedy the current status of the transport system and create sustainable planning and implementation for sector development programmes, a three-tiered coordination mechanism be created consisting of (i) a high-level Transport Policy Council, (ii) a working-level Transport Coordination Committee, and (iii) an Institute for Transport Policy Studies.
a) Purposes and functions Transport Policy Council The Council shall consist of Chairman, Planning Commission, Minister, Ministry of Communication, Minister, Ministry of Railways, Minister, Ministry of Defence, Minister, Ministry of Ports and Shipping and Provincial Governors/Chief Ministers or their nominees from four provincial governments. The Council is to formulate a national transport policy and strategy and to facilitate coordination among the sectors in accordance with the national transport mandate.
Transport Coordination Committee The Committee consists of a Deputy Chairman, Planning Commission, Joint Secretaries, Ministry of Communication, Ministry of Railways, Ministry of Defence, Ministry of Port and Shipping, representative from Finance Division, Economic Assistance Division (EAD), Provincial Governments and autonomous authorities.
Institute for Transport Policy Studies (ITPS) The Institute is to provide a secretariat to support the Council and Committee and carry out research and development to provide technical support to the Council and Committee in the policy formulation and coordination.
The new Institute will have four functional departments; Research, Information, Planning and Administration:
• Research Department will focus on the research and analyses of the problems and needs of the country’s transport sector development. It will also conduct research and studies on the international practices of the improvement and modernization of transport systems, including the institutional and regulatory reforms, privatization, private sector project financing (BOT and PPP). It will be responsible for the organization of seminars and workshops and the publication of annual research report and bulletins.
• Information Department will focus on the collection and dissemination of information and data relating to transport and traffic and the establishment of a data bank in which all transport and road traffic related statistics, including traffic volumes, number of traffic accidents, vehicular registrations and driving licenses, etc. are kept. The Data Bank will also keep all the results and findings of transport and traffic studies conducted by bilateral and multi-lateral aid agencies.
• Planning Department will focus on the financial, economic and technical evaluation of sector development programs and projects, including the implementation capacities. It will also provide technical and substantive support to the Council during the formulation of a national transport policy.
• Administration Department will be responsible for the accounting, human resource development and public relations, including conduct of transport projects, planning course/Technical Lectures/Seminars in cooperation with the Research Department.

Pakistan Transport Plan Study in the Islamic Republic of Pakistan (PTPS)
6-29
Source: JICA Study Team
Figure 6.2.5 Transport Policy and Coordination Mechanisms
b) Utilization of the National Transport Research Centre (NTRC) The existing National Transport Research Centre (NTRC) was established in 1974 as a technical support section of the Planning Commission to provide the needed research and development for planning and approval of transport projects. The mission statement of NTRC was to achieve self-sufficiency in the fields of transport planning, road engineering and road safety through indigenous R&D work. NTRC was collecting information and data relating to transport sector for the country. This included historical data regarding road designs, vehicular accident and driving licenses. NTRC also acted as a counterpart to a various national and international agencies including this and past JICA Studies on Pakistan Transport Plan.
It would be a logical move to restore the much needed R&D activities in Pakistan’s transport development and, in establishing a new national institute as a part of the new transport policy and coordination mechanism, the existing qualified professional staff and assets of the NTRC could be transferred to the new Institute except for those involved in the R&D on pavement design. The NRTC’s existing road research staff and material testing facility could be transferred to the proposed Highway Research and Training Centre.
Transport Policy Council
Institute for Transport Policy Studies
Transport Coordination Committee
Research Department Information Department Planning Department Administration Department
Research and Studies: Transport Systems
Seminar, workshop & Int’l Conference
Publication of bulletin & Annual Report
Data Bank: Transport and Traffic Statistics
Study on Project Implementation Cap.
Library and Documentation
National Transport Policy Analysis
Regulatory and Institutional Reform
Evaluation and Analysis of Projects
Accounting and personnel
Public Relations Business Development
Contract and Agreement

Pakistan Transport Plan Study in the Islamic Republic of Pakistan (PTPS)
6-30
6.3 Pursuit of Road Safety 6.3.1 Current Situation
(1) Regional Traffic Safety
Motor vehicle crashes are currently ranked ninth among the world's disease burdens, and is projected to rank third by 2020. Developing countries are the site of nearly three quarters of the ten million motor vehicle crashes annually. Asia and the Pacific region suffer 44% of the world’s road deaths but have only 16% of the total motor vehicles. (Reference “Report on Vulnerable Road Users in the Asian and Pacific Region”, ADB, 1998).
These numbers are based on official statistics and under-reporting of road fatalities is extensive, in some cases (e.g. China) it is estimated that the actual number of road deaths is over 40% greater than reported.
Bangladesh has the highest rate of deaths per vehicle population whilst Malaysia is reported to have the highest fatality risk as a percentage of the population. (See below)
Motorisation has increased at a rapid rate in Asia, largely with the growth in motorcycles. The number of motor vehicles doubled in Pakistan over the last 20 years. The personal risk of being killed in a road crash has more than doubled in most Asian countries.
05
101520253035
Malays
ia
Thaila
nd
Sri Lan
kaInd
ia
Indon
esia
Nepal
Pakist
an
Bangla
desh
Philipp
ines
DEATHS PER 100,000 POPULATION
-55
152535
4555
Bangla
desh
Sri Lan
kaInd
ia
Pakist
an
Thaila
nd
Malays
ia
Indon
esia
Philipp
ines
DEATHS PER 10,000 MOTOR VEHICLES
Figure 6.3.1 Traffic Accidents Death Rate in the World
(2) Economic Costs
Road deaths and injuries should be reduced for humanitarian reasons but on economic grounds alone they consume financial resources. Road safety appraisals illustrate the economic benefits of investing in national road safety programs, apart from the humanitarian aspects.
A previous study (Four acre and Jacobs, 1977) estimated road crashes cost on average of 1% of a country’s GNP, but a higher range, 1 to 3% has been suggested by the World Bank and others.
The calculated cost of road crashes can vary with the valuation method used, and at least six different methods have been proposed. (Hills and Jones-Lee 1981, 1983). This is significant, as the cost attributed to road accidents must be balanced against the expenditure on prevention or minimisation of traffic injury and or fatalities. Two general approaches are:
• ‘gross output’ or ‘human capital’ (HC) method (loss of potential earnings) • ‘willingness to pay’ (WTP) method
If accident costs and values are intended for use in cost-benefit analyses then the most appropriate method is willingness to pay. However, there is difficulty in obtaining reliable empirical estimates. In this case the gross output approach is preferable but it must be modified to capture the ‘humane’ aspect by a further allowance for ‘pain, grief and suffering’ of those involved in road crashes. It is generally accepted that the annual cost of road crashes

Pakistan Transport Plan Study in the Islamic Republic of Pakistan (PTPS)
6-31
is about 1% in developing countries, 1.5% in transitional countries, and 2% in highly motorised countries.
(3) Non-Reporting of Accidents
A study on motor vehicle injuries in Pakistan has found that 61% to 86% of such injuries may go uncounted in official police statistics. (“Injury Prevention”, A. Hyder, Johns Hopkins Bloomberg School of Public Health, September 2000.) The study's results indicate that the numbers of motor vehicle crashes, injuries and fatalities in the country have increased steadily during the 40-year period after 1956, and that commercial vehicles contribute disproportionately to these injuries.
The investigation shows that the total number of motor vehicle crashes increased 14-fold between 1956 and 1996, while the number of lives lost in crashes increased 16 times. The report also stated that buses and public service vehicles, which in Pakistan account for 12 to 35% of the total number of registered vehicles in any given year, are involved in over 60% of motor vehicle crashes and 90% crash deaths.
Interviews with motor vehicle crash survivors showed that 14% of crashes were investigated and registered by the police, whereas a previous study found that 39% were investigated by the local city police.
Since commercial vehicles travel many more kilometers annually than cars, their risk for crashes is heightened. As commercial vehicle production has not kept pace with population growth existing vehicles in this category are increasingly overloaded, further contributing to increased injury and fatality rates per crash.
In the event of an accident, the injured are treated by the local emergency response services. This means that an accident on a motorway or national highway may have to wait several hours for fire brigade and ambulance facilities to arrive. Motorway police, and regular police, have no facilities or training to deal with medical or hazardous situations.
(4) Legal Situation
The need for strengthened legislation has been recognized and action was taken through Ordinance No. XL of year 2000 with the passing of the National Highways Safety Ordinance, 2000. This ordinance is supplemented by the “Highway and Motorway Code” which is a booklet issued by the National Highways and Motorway Police, under the Ministry of Communications. It updates and replaces the Pakistan Highway Code of 20 years earlier. This is a general guide meant to be used by driving schools in teaching persons to drive and pass the driving test. It is not clear that this extends to all roads and all road users who come under the authority of the district and city police forces.
6.3.2 Policies for Road Safety
(1) Main Issues Requiring Action in Pakistan
The NHA have recognized that there are many issues requiring action and detail them in their Annual Report. These include:
• Fragmentation of responsibility for road safety issues • Lack of reliable credible information and data • Inadequate coordination of remedial measures
NHA have identified several fundamental factors as being responsible for the high accident rate:
• Road conditions particularly surface, shoulders and markings • Need for many single lane roads to be minimum of two vehicle width, with adequate
shoulders, and provisions for night driving

Pakistan Transport Plan Study in the Islamic Republic of Pakistan (PTPS)
6-32
• Poor driving standards particularly at night when drivers use high beam or extra lights with no regard for oncoming traffic
• No proper driving instruction program or driving test procedure • Weak enforcement of traffic rules and regulations • No effective vehicle registration system, poor licensing system and weak inspection
system for old vehicles for road worthiness/safety • Overloading of vehicles: too many passengers on public transport and too heavy a load on
commercial vehicles • Public travelling on trucks and other forms of commercial vehicles
(2) Remedial Measures
The following measures have been identified as necessary steps to improve traffic safety, reduce fatalities and injuries.
a) Actions by Federal Government • A public awareness campaign to change attitude of drivers and general road users • Consensus building between authorities (NHA, police) and commercial road users to
reach agreement on practical and acceptable measures to reduce overloading • Provision of affordable financing scheme to allow commercial transporters to replace old
vehicles with new • Consistent training of highway (NHA) provincial and local traffic police
b) Actions by Provincial Governments • Initiate improved vehicle registration system to prevent prolonged use of over age
vehicles • Improve vehicle licensing procedure • Improved road worthiness testing so vehicles which have been structurally modified after
registration are identified • Improvement of driving instruction schools • Enforcement of driving test procedures to obtain licence under uniformed and consistent
rules • Improve personal licensing procedure
c) Actions by NHA • Improve signage and use internationally accepted symbols • Ensure signs are not just nominated in English but in local language; maybe better to use
internationally accepted signage and symbols. • More safety measures on roads such as lane markings, “cats eyes”, safety barriers and
hard shoulders • Adequate provision of crossing points for pedestrians such as foot bridges or underpasses
with provision for movement of animals and hand drawn vehicles.
d) Actions by Police • Stronger enforcement of traffic rules and regulations • Local police and motorway police to be provided with more facilities and training to deal
with medical or hazardous situations • Enforcement of passenger number restrictions and stopping places of public transport • Enforcement of prevention of overloading of buses, commercial vehicles and use of
trucks as passenger vehicles • Enforcement of speed limits • Removal of encroachments that effectively reduce carriageway width • Strict control of agricultural vehicles on highways, particularly at night, with adequate
lights and rear markings such as reflectors • Use of correct lighting on vehicles at night: that is red lights on rear and white lights on
front, not the opposite; prohibition of bright lights on rear of vehicles; enforcement of use
Pakistan Transport Plan Study in the Islamic Republic of Pakistan (PTPS)
6-33
of dipped headlights; and unnecessary use of spotlights on front of vehicles. • Strict control of use of agricultural vehicles for goods movement and carrying of
passengers on narrow urban / rural roads • Provision of new, or strengthening of existing, emergency response services such as
ambulances, paramedics, fire brigade and hazardous situation response teams. • Training
The above aspects give a comprehensive list of issues to be addressed. It may be appropriate to hold seminars and training exercises for specific groups, such as:
• Traffic safety education in primary, junior and high schools • Periodic Traffic Safety Campaigns by the police in cooperation with local people and
NGOs such as ARUP • Seminars for authorities such as police and administrators • Round Table working groups with road users such as commercial operators and
transporters

Pakistan Transport Plan Study in the Islamic Republic of Pakistan (PTPS)
6-34
6.4 Intermodal Facilities Development 6.4.1 Current Situation
(1) Introduction
In an efficient strategic transportation environment multi-modal terminal/facilities are essential and have a definite role to play. These facilities provide an interface between long haul and short distance movements of people and goods. For an efficient and cost effective use of transport infrastructure it is important to make use of high capacity transport systems for medium to long distances, where as for shorter journeys of people from these multi-modal facilities to inner city area or for the distribution of goods to local shops/markets or even homes, the use of low capacity transport systems is most desirable.
The location, design and operation of these facilities need to be optimized to keep the cost of transport down. In the case of strategic transportation (inter-city - which is the subject of this study) such terminals have a vital role to play. For the movement of freight, these terminals include seaports, rail goods yards and freight terminals, and dry ports (inland freight terminals with facilities for customs clearance and processing of documentation). In the case of passenger transportation such terminals include airports, railway stations, and long distance bus terminals.
Seaports, airports and railway stations have been studied and discussed under the respective headings of these transportation systems. This section is therefore devoted to cargo/freight centres (dry ports) and passenger terminals.
(2) Freight Terminals in Pakistan
Pakistan has two major seaports and both of these are located at the southern end of the country. The rest of the country relies on these ports for imports and exports. But the majority of the country’s population centres and industrial heartland (except the port city of Karachi) lies in the province of Punjab at a distance of 600 to 1200 km from the ports. This requires efficient movement of goods over land for import and export over land.
Because of excessive bureaucracy, the cost of “land access to/from port” within Pakistan could easily be several times the cost of maritime transportation to the origin/destination country. The main reasons and issues for this could be summarized as:
• Lack of containerization, mostly due to lack of container handling equipment inland, and lack to transportation facilities for the movement of containers. Therefore, it is essential that country’s inland transportation infrastructure matches that of the maritime infrastructure.
• Non-Simplification of trade/customs documents: In Pakistan this seems an impossible task, as in most cases it is considered a job creation scheme, whether any document(s) is necessary or relevant is neither understood by authorities, and neither does the public have the right to question the “Government” officials. e.g. someone clearing goods at Lahore airport may have to make several cost charges at several points, as each agency has its own levies and does not trust an other agency/department to collect levies on their behalf, with the inherent reason of receiving “commissions” at each stage of payments.
• Lack of Efficient Freight Forwarding Agencies – for efficient collection and delivery of goods where a third party collects and deliver goods. In Pakistan this “third party logistics” is almost in its infancy, and mostly used for domestics movement of goods, and a little for import and export. However, there are agencies that will handle your goods and carry out custom clearance for both import and or export.
In the past (early seventies) the port handling and customs clearance was so poor that it lead to ports being clogged with goods needing approval for both import and export. As result, ships had to wait for days, further adding to the cost of transportation, and Pakistan

Pakistan Transport Plan Study in the Islamic Republic of Pakistan (PTPS)
6-35
continuously lost its competitiveness in import and export. Mainly in order to alleviate the clogging of the port rather than to improve the efficiency of inland transport, the Government started to set up dry ports further inland, where customs clearance “blessings” could be obtained rather than only at the port.
There are several such ports dotted around Pakistan, some closer to big cities, some within the city (e.g. Lahore), while the location of others had benefits to some third parties, and had nothing to do with the efficient handling and carriage of goods. In order to understand the operation of these ports traffic surveys were conducted at ten (10) dry ports in Pakistan. Table below summarises the survey results. It can be seen that none of these ports handled “large” volumes of goods by any standards. The highest volumes were observed at Lahore, Faisalabad, and Port Qasim itself. Even the traffic at Karachi dry port was found to be less than that observed at other Inland sites, given that Karachi is the biggest metropolis of Pakistan.
PTPS study examined these results. As the traffic volumes were so low at all these centres, only qualitative and collective judgments could made about their location, use, operation, and future role as a part of this strategic study. Any close analysis and approach would need further detailed analysis and more data collection, for that “dry port”. This was considered to be not necessary for this study.
Table 6.4.1 Summary of Dry Port Traffic Survey Results
Dry Port City Survey Date Total (In+Out) Trucks Trucks Interviewed Lahore 30-August-05 245 34 Karachi 3-September-05 206 88 Quetta 5-September-05 40 40 Peshawar 1-September-05 43 32 Multan 10-September-05 24 16 Rawalpindi 6-September-05 10 10 Hyderabad 31-August-05 33 21 Port Qasim 3-September-05 244 100 Faisalabad 2-September-05 251 33 Source: PTPS Traffic Surveys
(3) Long Distance Bus Terminals
In almost every city of Pakistan there is a long distance bus terminal. The main reason is that most of the inter-city travel is by public bus, due to low car ownership, high cost and low access and poor service of railway, and very high cost travel by Air.
The main traffic survey carried out for PTPS revealed that on almost all major/minor intercity roads about one-third of the traffic is public buses. This proves the points made in the above paragraph, about the use of buses as almost the only means of inter-city travel.
The operation of intercity public buses is almost entirely in private hands, with little or no government subsidy. However, the fares are set by the Government, and generally obeyed by the operators. Such intercity bus services are also available in a variety of level of services. That varies from non-stop comfortable/ convenient air conditioned services to over crowded buses with passengers occupying every inch of space, including the roof. In any case the majority of these services operate out of bus terminals. The high-end of the market tend to have their own terminal, operated by the bus company exclusively for their own company buses.
Whereas the lower end of the market operations start and stop from Public bus terminals, usually provided and operated by city authorities. These terminals are usually located with reasonable access to local intra-city transport services. In the case of Lahore, a nice terminal was built and operated by the city authorities in the mid-1960s. Now it is considered a disgrace for such a historic city, and what makes it current condition seem even more

Pakistan Transport Plan Study in the Islamic Republic of Pakistan (PTPS)
6-36
unbearable is its close proximity to world class monuments such as Badshahi Mosque and Lahore fort. Hence a lot could be proposed for such termini. The surveys and comments from passengers noted during the interviews from other cities were also less than encouraging.
6.4.2 Policies for Intermodal Facility Development
(1) Freight Terminal
• Only in the case of Lahore could it be said that the city needs a better, well planned, and operationally efficient “freight terminal”. Such a center should combine the handling of both international and domestic goods movement operation at one location. The location of such a terminal would have to be out side the city, and not within the city link to the existing terminal. The most suitable location from a simple qualitative assessment is somewhere north of the River Ravi with access to National Highway N-5, Motorway M-2, and the Lahore – Sheikhupura Road and, especially, the railway Junction of Lahore. As from such a location the terminal could serve both the domestic market of Lahore and at the same time act as a regional collection and distribution centre for the Northern areas of Lahore district, and the districts of Narowal, Gujranwala, Sheikhupura. These districts do have considerable industrial outputs for transportation to the rest of Pakistan and abroad. The main advantage of this location is the excellent road and rail accessibility it offers for the movement of long haul operation and at the same time access to Metropolitan Lahore would be easy and convenient.
• In order to promote refrigerated transport, investment in cold storage warehouses is necessary at the two ports in Karachi and freight terminals in major large cities. As the capital cost of cold storage facilities and the maintenance cost are expensive in general, it is necessary to establish a multi-modal transport system for refrigerated transport, namely, “cold chain”. Railway should be included in the cold chain and cold storage warehouses should be constructed in dry depots of Pakistan Railways.
(2) Long Distance Bus Terminal
• General amenities at these locations should be improved for convenience of passengers and for the access/egress of local distribution modes of transport.
• Relocation of such terminals is not necessary the answer, the answer lies in controlling the activities which takes place within the confines of the bus terminal area, which could easily be carried out elsewhere, such as overnight parking, routine maintenance and oil change, etc etc.
• Their operation could be enhanced by making them public/private control, where private sector has vested interest in its up-keep and smooth operation.
• A single bus terminal from which both low and higher class services could operate is also more favourable than allowing the high-end of the market its own luxury confines. In such cases some cross-subsidy for social reason could provide a wider choice of services to more customers. Thus improving the access to public of all types of services.
• Bus Terminal location(s) could be more than one for a single city depending upon its geographical size, location, geographical constraints of access to/from inter-city bus routes, and the volume of demand from each direction or inter-city route.
• Location of local distribution modes is also essential, and should be fully taken into consideration. An integrated intercity-bus and local mass transit system could be ideally planned, located and operated by single public/private authorities for the best interest of the public at large.

Pakistan Transport Plan Study in the Islamic Republic of Pakistan (PTPS)
6-37
6.5 Cross Border Facilities Development 6.5.1 Current Situation
(1) Introduction
Pakistan has common borders with four countries, namely, Iran in the west, Afghanistan in the north, China in the north east and India in the east. The main overland trade routes with these countries are:
1. Taftan (Balochistan) (Pak-Iran border)
2. Chaman (Balochistan) (Pak-Afghan (South))
3. Torkham (NWFP) (Pak-Afghan (North))
4. Sust (Gilgit, N.A.) (Pak-China)
5. Wagah (Punjab) (Pak-India)
The movement of vehicles from neighbouring countries is regulated by bilateral agreements on a reciprocal basis. In all cases, vehicles of Pakistan and neighbouring countries are allowed up to the nearest custom posts which are, in all cases, located well inside the countries. The conditions at each location are briefly described below.
a) Taftan (Pak-Iran) The customs post for Taftan is located at Quetta. Iranian trucks are allowed up to Quetta, 635 km inside the country and Pakistani trucks are allowed up to Zahidan, 100 km inside Iran. They operate on Carnet de Passages en Douane, issued by Automobile Associations of the two countries on a reciprocal basis. The vehicles to and from Quetta are escorted by Customs staff stationed for that purpose. However, some scrap from Iran is downloaded at Taftan where NLC has built a scrap yard. There is a nominal Customs staff at Taftan to check documents and arrange escort for movement to Quetta. The Immigration authorities check passports and visas at the border. Security at the border is provided by paramilitary forces, FC, rangers, etc. stationed at the border who are responsible for opening and closing of the gate at the mutually agreed timings on both sides. The border is open from dawn to dusk.
Pakistan and Iran are also linked by rail. There is a broad gauge line from Quetta to Zahedan (732 km). There are two passenger trains a month, running from on the 1st and 15th of every month from Quetta to Zahedan and 3rd and 17th from Zahedan to Quetta1. However, they carry few passengers, as buses on the route take much less time (less than 12 hours) and charge less.
In addition, there are two or more goods trains a month with 40-50 wagons of 20 ton capacity. Customs formalities by Pakistan Customs are performed at Taftan Station on the Pakistan side of the border and on Iran side of the station by Iranian Authorities.
b) Chaman (Pak-Afghan) At Chaman, Custom’s post is located in the city 3.5 km away from the border. On the Afghanistan side, the nearest town is Spin Boldak, 8.5 km inside Afghanistan, but the main Custom Post is at Kandahar where most of the imports and exports are processed. Afghan trucks are allowed upto Chaman in Pakistan and Pakistani trucks can go up to Kandhar. However, due to security conditions in Afghanistan, few Pakistani trucks go to Afghanistan. Most of the goods are carried by Afghan trucks.
Chaman is also linked by rail by a broad gauge from Quetta. Out of the distance of 142 km, 60 km are double track from Gulistan to Chaman. The rail passes under the Khojak Pass through the longest tunnel in Pakistan. There is a daily passenger train service in each
1 Pakistan Railways, Time and Fare Table, Nov. 2004 – April 2005.

Pakistan Transport Plan Study in the Islamic Republic of Pakistan (PTPS)
6-38
direction and numerous goods trains, according to traffic requirements.
Transit trade of Pakistan moves by rail only in accordance with the Agreement of 1965, which recognises two border points only, namely, Torkham and Chaman. Goods arriving by train are transhipped at railway yard where a separate customs post is located. Onward, goods vehicles are escorted by Customs Authorities up to the Afghan border.
c) Torkham (Pak-Afghan) Torkham handles the largest amount of cross border traffic in the country. Its Custom post is located in the west of Peshawar beyond the famous Khyber Pass. As for Chaman, Afghan trucks can come up to Peshawar from where goods are transshipped to rail or road vehicles. They carry mainly dry/fresh fruits, vegetables, poultry, marble, minerals and so on. Similarly, Pakistan trucks can go up to the nearest Afghan custom post at Jalalabad. However, in view of current security situation in Afghanistan, few do that. The major cargo items are cement, steel, oil, machinery, etc.
Peshawar is the main rail head in the north. All Afghan transit goods which arrive from Karachi by rail are moved to transit sheds at city and cantonment stations from where they are loaded on trucks for onward movement. A truck terminal is also located near a cantonment railway station for other than transit goods to and from Afghanistan. Customs clearance is done at city and cantonment railways stations and truck terminal/dry port in the city.
The vehicles cleared by Customs in Peshawar are sealed and escorted to the border. There is some custom staff at the border as well for receipt and dispatch of vehicles. They check seals and in certain cases goods as well and let the vehicles cross the gate. The security and opening/closing of gates is the responsibility of paramilitary forces stationed there for that purpose. The gate is open from dawn to dusk.
Because of traffic congestion, trucks are not allowed on roads in the city during daytime. They have to wait for to enter and leave the city, sometimes up to 12 hours.
Photo: Torkham Border Post
d) Sust (Pak-China) The Pak-China border is located at the Khunjerub Pass, 4,600 m above sea level. Sust is a Custom and Immigration post 75 km from the border at 1,800 m altitude. The border is snow covered in winter and becomes impassable frequently. Smooth traffic movement is only assured in summer only (May-November). There is only security staff at the border who check gate passes and let the vehicles go.
As for other places, Chinese trucks are allowed up to Sust and Pakistan trucks can go up to

Pakistan Transport Plan Study in the Islamic Republic of Pakistan (PTPS)
6-39
the nearest custom post in China, 100 km inside the country. However, the movement of vehicles is more restricted here. Only vehicles of designated transport agencies of the two countries can operate vehicles. The agency responsible on the Pakistan side is Northern Area Transport Corporation (NATCO). They also operate passenger coaches. Similarly, there is a Chinese state agency operating trucks and coaches.
Return loads are not allowed by either country. Chinese vehicles bring their goods to Sust and go back empty. Similarly, Pakistani vehicles go up to Chinese the nearest Chinese Custom Post and come back empty. A warehouse has been built at Sust with the help of China where transhipment is carried out.
Photo: Khyber Pass
e) Wagah (Pak-India) Wagah is located 28 km from Lahore city centre. The only trade allowed at Wagah is some Pakistani vegetables and poultry and Afghan dry and fresh fruits to India. The goods are unloaded on the Pakistan side, inspected by custom staff there and carried by hand by Pakistani security cleared labour across no man’s land and then handed over to Indian labour for clearance by their Customs and onward movement. At present, only relief goods from India for the large earthquake that hit the Kashmir area of Pakistan on October 8th, 2005 are allowed back-to-back loading/unloading. The border is open from dawn to dusk.
There is also passenger traffic including regular buses connecting Lahore and Delhi two times a week both by Pakistani and Indian bus companies (four round trips in total). They cross the border on foot, completing custom and immigration formalities on both sides. Tourist cars can pass the border based on the usual Carnet de Passage procedure.
A significant amount of import and export goods are carried by rail. Wagah rail station is located some two km west of Wagah road crossing. There are two trains both incoming and outgoing every week. Pakistani and Indian rolling stock is used on a six-month rotation basis. Each train consists of 10 passenger cars (capacity 600 per train) and 2-3 freight cars (one 20 foot container per car). Although there are no legal constraints on the cargo items imported/exported, no high value or manufactured goods are being traded. Customs formalities of this traffic are carried out at Wagah railway station on the Pakistan side and Atari Railway station on the Indian side.

Pakistan Transport Plan Study in the Islamic Republic of Pakistan (PTPS)
6-40
(2) Present Traffic Volume
a) Cross-border Traffic Table 6.5.1 summarizes the results of the PTPS field survey which was conducted from August 30th to September 8th, 2005 on five (5) cross-border points between Pakistan and neighbouring countries.
Table 6.5.1 No. of Vehicles Counted and Goods Tonnage Estimated Across Border Posts, 2005
Taftan Chaman Torkham Sust Wagah Total (Iran) (Afghan) (Afghan) (China) (India) No. of Vehicles/day motorcycle 0 0 0 0 0 0 car 0 0 27 0 0 27 minibus 0 0 16 4 0 20 large bus 0 0 24 2 0 26 light truck 4 16 91 9 0 120 medium truck 4 10 86 0 3 103 heavy truck 21 36 19 1 7 84 container truck 0 1 138 34 1 174 agriculture equipment 0 0 0 1 0 1 total 29 63 401 51 11 555 Goods Tonnage/day motorcycle - - - - - - car - - - - - - minibus - - - - - - large bus - - - - - - light truck 20 20 426 45 0 511 medium truck 27 79 645 0 30 781 heavy truck 420 689 127 20 140 1,396 container truck 0 12 784 383 12 1,191 agriculture equipment - - - - - - total 467 800 1,982 448 182 3,879 Note: both incoming and outgoing directions Source: PTPS field survey
Judging from the results, the volume of cross-border traffic remains relatively low. Only Torkham has higher levels of traffic, with about 400 vehicles a day and 700,000 tons of goods per year. This accounts for about 70% and 50% of the total Pakistani cross-border traffic for vehicles and goods tonnage, respectively. Particularly with India, road traffic volume is still minimal despite the current government initiatives to improve the relationship between Pakistan and India.
Bus and/or passenger coach are also operated across the border. Although details are yet to be confirmed, the following is known:
• With Iran, passenger buses operate several times a month between Quetta and Zahedan • With Afghanistan, a bus is operated reportedly once a day through Chaman between
Quetta and Kandahar. But this was not recorded in the PTPS traffic count survey. Through Torkham, five (5) regular bus services are available daily between Peshawar and Kabul. PTPS survey counted 16 minibuses and 24 large buses a day for both directions.
• With China, the PTPS survey counted four (4) minibuses and two (2) large buses a day for both directions. Although the Pak-China agreement on transit traffic refers to regular passenger coach services, their frequency is unknown.
• With India, there are four (4) regular round bus services between Lahore and Delhi through Wagah.

Pakistan Transport Plan Study in the Islamic Republic of Pakistan (PTPS)
6-41
Regarding rail traffic, the following is known:
• With Iran, there are two (2) regular round services of passenger trains a month through Taftan between Quetta and Zahedan. More goods trains are operated on the same route.
• With Afghanistan, one (1) round trip by a passenger train and several round trips by goods trains are operated every day up to the Chaman border. No train services are available at the Torkham border (upto Peshawar only).
• With China, there is no railway link. • With India, there are two (2) round trips of passenger cum goods trains a week between
Lahore and Delhi.
b) Commodity Trade with Neighboring Countries Table 6.5.2 shows the commodity trade in 2003 between countries of the Region.
Table 6.5.2 Commodity trade between countries of the Region, 2003 US$ Million
(from) / (to) PAK IND IRA AFG CHI KAZ KYR TAJ TRM UZB Rest Total Pakistan 77 94 492 433 9 7 0 1 3 11,579 12,695India 332 928 144 3,585 74 38 4 19 15 57,890 63,029Iran 99 261 227 1,764 49 28 75 129 70 31,086 33,788Afghanistan 47 40 1 1 0 0 120 209China 1,503 3,674 1,863 26 1,572 245 21 79 147 429,098 438,228Kazakhstan 252 9 411 49 1,720 164 76 37 138 10,071 12,927Kyrgyzstan 1 1 7 6 69 56 19 2 16 405 582Tajikistan 3 4 15 0 18 7 3 0 74 673 797Turkmenistan 4 9 38 81 4 49 0 32 0 3,503 3,720Uzbekistan 5 27 109 0 200 90 39 133 0 3,122 3,725 Rest of the World 13,303 73,099 22,172 580 404,966 6,503 193 521 2,183 2,501 Total 15,549 77,201 25,638 1,605 412,760 8,409 717 881 2,450 2,964 Source) compiled from Commodity Trade Statistics Database, UN and World Development Indicators, WB
Pakistan’s commodity trade with adjacent countries of the Region is not active so far. The largest amount of exports to neighbouring countries is to Afghanistan, but this is still only about 4% of total exports. The largest amount of imports from neighbouring countries is from China, which accounts for about 10% of the total. Most of the trade with China is seaborne, and it has little to do with cross-border transport.
The trade with double-landlocked Central Asian States is still at a very low level except for the imports to Pakistan from Kazakhstan. This is considered to be oil and other mineral products.
Apart from Pakistan, the regional trade seems to be dominated by China. Its trade with India, Iran and Kazakhstan is significant and is growing rapidly.
(3) Current institutional Arrangement
As to cross-border transport, Pakistan has entered a bilateral or multilateral agreement with neighboring countries as briefly described below:
a) With Afghanistan Pakistan first entered a transit cross-border trade agreement with Afghanistan in 1958. However, in 1965, a new agreement came into force. Actually the new one is an amendment of the old one, but a mixture of both is used as customs formalities at present. The new agreement stipulates the following, among others:
• guarantee to each other the freedom of transit to/from their territories • designates two routes, i.e. Peshawar – Torkham and Chaman – Spin Boldak

Pakistan Transport Plan Study in the Islamic Republic of Pakistan (PTPS)
6-42
• impose no taxes, duties and charges of any kind except actual transport and administrative expenses
• for Pakistani government to provide earmarked sheds and open spaces in Karachi Port Area for transit goods to/from Afghanistan
• recognize the importance of the Kabul – Torkham – Peshawar route (suggesting the possibility to extend the railway from Landi Khana to Torkham)
• appoint liaison officers on both sides • ensure the most favourable treatment with each other
Although not stated clearly, it is assumed that the mode of transport would be rail. In this context, this agreement has been already outdated at present where road transport is dominant everywhere.
In addition, there is reportedly a “sister” agreement regarding Afghan transit cargo to India. Although the signed document cannot be found anywhere, actual practises follow this agreement; the only possible route is Torkham – Wagha, and the transportable goods are limited to dried and fresh fruits from Afghanistan.
b) With China, Kyrgyzstan and Kazakhstan Pakistan, China, Kyrgyzstan and Kazakhstan have agreed in 1995 to the following points on land transit trade:
• Border posts and Land Routes
a. Border posts
Pakistan :Sust and Karachi seaports. China :Khunjerab, Torugard and Khorgos Kyrgyzstan :Torugard and Ak-Jol Kazakhstan :Kordai and Khorgos
b. Land Routes
Karachi Seaports (Pakistan) to Peshawar (N-55) or Karachi Seaports to Islamabad/Rawalpindi Dry Port (N-5 or Motorways) to Hassanabdal - Gilgit - Sust (Pakistan) - Khunjerab (China) - Kashgar - Torugart(China) - Torugart (Kyrgyzstan) - Bishkek - Ak-Jol (Kyrgyzstan) - Kordai (Kazakhstan) - Almaty - Khorgos (Kazakhstan) - Khorogos (China), and Vice versa.
• No vehicle duties and taxes on transit transport except for the cost of rendered services • Uniform customs procedures and formalities • Providing sheds and open spaces at points of entry/exit in addition to the efforts of
infrastructure improvement • Equal national treatment in relation to freight and other charges • Right to apply all prohibitions and restrictions deriving from national legislation of each
country • Free transit not only to member countries but also non-member countries • Appointment of liaison officers in each country
However, the Khunjerab Pass which links Pakistan with China has an altitude of 4,600 m and it often becomes impassable from November to May due to snow and ice. Moreover the both sides of this pass are high steep mountain areas that make road maintenance extremely difficult. Due to these natural conditions, which are hard to overcome, the role of this agreement is quite limited for Pakistan. For other member countries, this agreement seems to be very effective in view of the current surge of goods from China to Central Asian Countries.
In addition, prior to this agreement, Pakistan tried to enter an agreement with China in 1993 on the general rules of international road transport. Although this agreement is yet to come

Pakistan Transport Plan Study in the Islamic Republic of Pakistan (PTPS)
6-43
into force, vigorous negotiations are being done at present with the Chinese government. Principles and basic procedures as to permission issuance for regular and non-regular transport services are stipulated there.
c) With India There is no agreement between Pakistan and India as to cross-border trade. However, actual trade is being carried out as stated earlier, though at a minimal scale. This has reportedly become possible through ad-hoc communications between the two countries.
Regarding railways, however, there is a fairly long history of negotiations on cross-border rail operations. In 1976, both governments finally entered into an agreement to resume railway operations across the border after long discussions. It remained valid until 1991 when a new agreement was reached. It was reviewed again in 2001, but soon after this, on December 31st, 2001, railway operations were suspended due to political conflict. After two (2) years, in December 2003, a new agreement was reached and rail operations were resumed from the beginning of 2004.
The following is an outline of the 2003 agreement:
• to resume international train operations between Lahore and Amritzar in January 2004 • to carry international traffic only • to limit train running between sunrise and sunset • to share the rakes for running passenger services equally by the two railways • to limit the weight of passenger luggage below 35 kg per person (50 kg for first class) • other detailed procedures relating to rates, fares, document processing, problem solving,
penalties, mechanical fitting, etc.
According to a report of Gulf News of January 7, 2006, India and Pakistan agreed on January 6, 2006 to reopen a second railroad link on February 1 between Khokrapar, a border town of Sindh province and Munabao, a desert town in western India. The passenger train would be called ‘Thar Express’, named after the desert that straddles the border of the region. To begin with, it would be a weekly service and trains will alternate every six months: a Pakistani train will cross into India to Munabao for the first six months of the year, followed by an Indian train for the remaining six months.
In addition, the commencement of new regular bus services is now under negotiation between Pakistani and Indian governments. It is expected to become valid soon.
d) With Iran There are two (2) agreements between Pakistan and Iran. One is about cross-border railway operation agreed in 1959 and the other is regarding road transport across the border agreed in 1987.
The outline of the old agreement on railway operation is:
• The North Western Railway located in Lahore transferred the section it operated inside Iran (Zahedan to Pak-Iran border) to Iranian State Railways. The Iranian Railways in turn transferred the control of the section to the North Western Railway with all immovable assets. The North Western Railway is responsible for train operation on the section including the supply of rolling stock.
• The schedule of Standard Dimensions relating to the broad gauge shall be used. • Mirjawa shall be the only junction for mechanical interchange and joint billing. • The Iranian State Railways shall make payment for power for running, coaches, shunting,
repair, relief train, etc. • For passengers and freight, Iranian portion is collected by the Iranian State Railways at
Mirjawa and Pakistani portion by the North Western Railway at Mirjawa as well. • The Iranian State Railway will not charge for coals for railway use on the section.

Pakistan Transport Plan Study in the Islamic Republic of Pakistan (PTPS)
6-44
• Other procedural matters.
The 1987 agreement for cross-border road traffic and transport between the two (2) countries does not include transit movement. Its outline is:
• Internal transport is prohibited. • Each authorized company of either country is allowed to appoint its representative at the
final destination in the other country. • Drivers need to have an international driving license. • The trucks used are exempted from charges and taxes levied on foreign vehicles. • The route of transportation is limited to Quetta – Taftan – 72 Post – Mirjawa – Zahedan. • Other rules on vehicle weight and dimensions, violations, joint commission, etc.
6.5.2 Policies for Cross Border Facility Development
(1) Conditions to Accelerate Cross-border Transport
In general, the conditions which determine the magnitude or importance of cross-border transport are:
• Natural • Political/institutional • Economical (complementarity and potential growth) • Social/cultural • Competition with sea and air routes
a) Natural Conditions Pakistan generally has severe constraints in natural conditions with the neighbouring countries.
• The only exception is with India. The border area is well populated, flat and equipped with roads and railways. Moreover, the largest activity centers of both countries are located near the border; Lahore and Delhi.
• The border area with Afghanistan is mountainous, both for the Torkham route and Chaman route. The bald rocks of the mountains are extremely fragile and the roads and railways are poorly maintained. However, activity centers are located relatively near the border (Kabul/Jalalabad and Peshawar for Torkham route, and Kandahar and Quetta for Chaman route).
• With Iran, the natural conditions of the border area are not so friendly to cross-border traffic. Several hundred kilometers of desert lies on both sides of the border, and the border is located very far from the activity centers of both countries.
• China border is the most prohibitive, having the Khunjerab Pass of 4,600m high which practically restricts cross-border movement only to summer. Moreover, the area lying on both sides of the border is steep mountains or hazardous desert for more than 1,000 km. Road maintenance is very difficult due to frequent landslides and falling rocks. Furthermore, there is no alternative potential route over the Pamir Plateau.
b) Political Environment The political environment surrounding Pakistan and the surrounding countries is a delicate matter. Pakistan has good political relations with China, partially because of the need to stand together as a counterpoise to India. Although the interrelations with Afghanistan and Iran are stable so far, their attitude on cross-border trade is protectionist in general. The interrelation with India has long been quite hostile and remains so at present despite the recent initiatives taken by both governments.
Reflecting the history of political conflict to some extent, the institutional arrangement on cross-border trade is poor if existing, as described in the previous sections. In most cases, the existing agreements impose a number of irrational constraints on cross-border movements.

Pakistan Transport Plan Study in the Islamic Republic of Pakistan (PTPS)
6-45
Some cover only a fragment of entire cross-border transport while some others are outdated.
Although the political environment is one of the absolute determinants of quality and quantity of cross-border transport, it is not a matter for planning nor projection. Political decisions have to come first.
c) Economical Condition The economical conditions of both countries determine the magnitude of cross-border trade if other conditions are the same. This is related not only to the economic scale but the mutual complementarity of the economies of the related nations. Table 6.5.3 compares GDP and trade volume of neighboring countries with Pakistan. Although this is quite indicative, the following can be pointed out:
• The trade volume between Pakistan and Afghanistan is almost equivalent to 10% of Afghanistan’s GDP. Hence cross-border trade is more critical to Afghanistan than to Pakistan.
• The trade between Pakistan and India is negligible compared to the economic scale of both nations.
• The trade of Pakistan with China and Iran is still small and identical in relative terms compared to their GDP. In absolute terms, however, China is 10 times larger than Iran or Pakistan.
• The trade of Pakistan with Central Asian States is still underdeveloped. Considering that Pakistan has an agreement with China and Afghanistan in relation to transit trade, the future possibility of increasing trade between Pakistan and CAS would be large.
Table 6.5.3 Comparison of GDP and Trade Volume with Pakistan of Neighboring Countries
A
GDP 2003 (US$ million)
B Trade Volume with
Pakistan 2003 (US$ million)
A-B
India 600,637 409 1,469 Iran 137,144 193 711 Afghanistan 4,708 539 9 China 1,417,000 1,936 732 Kazakhstan 29,747 261 114 Kyrgyzstan 1,909 8 239 Tajikistan 1,553 3 518 Turkmenistan 6,201 5 1,240 Uzbekistan 9,949 8 1,244 Source) World Development Indicators, WB and Commodity Trade Statisti
d) Social/cultural Socially and culturally, Afghanistan is the nearest to Pakistan. Iran and CAS come next because of the common religion. China is quite different in social/cultural features from Pakistan though its Xinjiang Wigur Province has an Islamic tradition. Social/cultural characteristics of India seem to be similar to Pakistan by appearance and by history. However, both people deny this resemblance.
e) Competition with Sea and Air Routes Pakistan has sea and air routes between Iran, India and China as an alternative means to land cross-border transport. Particularly for bulky or high-value goods and long-distance passengers, sea and air are much more economical and efficient than land transport. For Afghanistan and CAS, however, land transport can play a vital role. For these landlocked or doubly landlocked countries, cross-border transport is essential except for long-distance

Pakistan Transport Plan Study in the Islamic Republic of Pakistan (PTPS)
6-46
city-to-city passengers and high-value goods. Moreover, land transport of this type contributes to vitalize the life of people living in poor remote border areas.
Table 6.5.4 Comparison of Cross-border Trade
Natural Political Economical Social/ cultural
Modal Competitio
India *** * *** * ** China * *** ** * * Afghanistan * ** ** *** *** Iran ** ** ** ** *
Note) *** favorable ** fair * bad
(2) Preceding Examples in Asia
The following describes briefly some preceding trials for improving cross-border transport.
a) Asian Highway The concept of Asian Highway (AH) was advocated at first in the 1950s by the UN. The purpose was to contribute to accelerate the social and economic developments as well as to boost international and regional trade and tourism by linking Asian countries by road. Due, however, to the lack of fund and geopolitical situation affected by the Cold War, the road development was not smoothly conducted except for some countries. It was the late 1980s when bright signs were observed. As a result of the dissolution of the Cold War and the introduction of market mechanisms in socialist countries, globalization has become highlighted and infrastructure of international communication and transportation became important tools for promoting trade and attracting foreign direct investment. This tailwind has revitalized the Asian Highway. Particularly when China, Mongolia and Myanmar became members of AH in 1988-1990, the region restarted the efforts to realize the Asian Highway Network.
Led by ESCAP, the AH now has 32 member countries from Japan on the east end to Turkey on the west end. Pakistan has long been a member country since its foundation in 1959. Donors have been vigorously supporting the development of AH roads inside Pakistan. The AH network is now composed of numerous roads amounting to about 141,000 km.
b) The GMS Cross-Border Transport Agreement The GMS Cross-Border Transport Agreement (GMS Agreement) initially advocated by the Asian Development Bank is a multilateral instrument to facilitate cross-border transport. The GMS Agreement includes references to existing international conventions that have demonstrated their usefulness in a number of countries. Similar initiatives are also undertaken by ASEAN. The GMS Agreement covers all the relevant aspects of cross-border transport facilitation.
These include:
a. single-stop/single-window customs inspection b. cross-border movement of persons (i.e., visas for persons engaged in transport
operations) c. transit traffic regimes, including exemptions from physical customs inspection,
bond deposit, escort, and phytosanitary and veterinary inspection d. requirements that road vehicles will have to meet to be eligible for cross-border
traffic e. exchange of commercial traffic rights f. infrastructure, including road and bridge design standards, road signs and signals
The GMS Agreement will apply to selected and mutually agreed upon routes and points of entry and exits in the signatory countries (Cambodia, China, Lao, Myanmar, Thailand and
Pakistan Transport Plan Study in the Islamic Republic of Pakistan (PTPS)
6-47
Vietnam). Although some countries seem to be reluctant to proceed, bilateral talks are still continuing.
c) Central Asian Republics Economic Cooperation (CAREC) The CAREC initiative, supported by ADB, intends to enhance economic cooperation among Kazakhstan, Kyrgyzstan, Uzbekistan, Mongolia and the Xinjian Uygur Autonomous Region of China. In its phase I program 1997-1998, infrastructure needs and policy issues that impede cross-border trade were identified, and in the phase II (1999-present), several projects selected in the previous phase have been assessed for implementation focusing mainly on trade, road railway and electric power.
However, most countries of this region have trade-restrictive policies due to their similarity of economic structure, and the deteriorated infrastructure and political instability in some countries further adds difficulties in promoting cross-border trade. As a result, the share of intraregional trade in total trade has decreased during the period 1998 to 2003; 3.4 to 1.8% for Kazakhstan, 24.8 to 16.6% for Kyrgyzstan and 32.6 to 22.4% for Tajikistan. Obstacles for cross-border trade are numerous. In addition to high customs tax and import quotas imposed by Kazakhstan, China, etc., there are transit fees, high loading/unloading cost and corrupt border practises.
Hence, the CAREC initiative has not been so successful so far. However, the volume of cross-border trade has been rapidly increasing in these years between China and CAS countries particularly Kazakhstan, and cross-border infrastructure is being improved as well. Moreover, CAREC countries have taken steps to simplify the procedures of cross border transport. A transit agreement was signed in March 2004 between Kyrgyzstan and Kazakhstan, and a similar agreement is being negotiated between Tajikistan and Kyrgyzstan.
6.5.3 Recommendations
• Since it is impossible to have a clear perspective for the future on the political environment surrounding cross-border transport of Pakistan, it would be more realistic for the Pakistan government to concentrate on the interrelation between:
- Afghanistan and Central Asian States in the short term, and
- India in the medium to long term.
• The outdated and prohibitive agreements with neighbouring countries regarding cross-border trade and transit trade should be amended and updated. With Afghanistan, the 1958 and 1965 agreements on transit traffic should be amended to cover both road and rail, and both bilateral and transit traffic. The fees, taxes and procedures needed on the border should be clearly and transparently stipulated so that arbitrary judgement of customs officers can be avoided. In addition, the border offices of both Pakistan and Afghanistan should be linked directly by data communication to avoid duplication of document processing and declaration of different figures (weight, value, etc) at both sides. With India, the same arrangement should be taken as well in principle. However considering the hostility seen at present even between the labourers of both sides, at least back-to-back loading/unloading of trucks should be allowed immediately to avoid ridiculous inefficiency.
• At present, the time required for goods transportation by truck is reportedly 25 days from Karachi Port to Jalalabad in Afghanistan. Out of these 25 days, only 1-2 days are consumed in the Torkham Pak-Afghan border. This means that cross-border transport cannot be enhanced solely by improving the cross-border facility. Strengthening of port functions and road/rail development/improvement must be pursued in combination with the proposed enhancement of cross-border facilities.

Pakistan Transport Plan Study in the Islamic Republic of Pakistan (PTPS)
6-48
Figure 6.5.1 illustrates the existing international corridors and the future new international corridors. Recently, the government of Pakistan launched “National Trade Corridor Improvement Program (NTCIP)”, which intends to strengthen the existing international corridor for transport of import and export goods. The development of multi-modal facilities should be incorporated in the program.
Sust
Torkham
Chaman
Taftan
Iran
Afghanistan
China
India
Gwadar
Karachi/Qasim
Qilli Ghulam Khan
Barmer
Muna Boa
Wagha
CExisting International Corridor
Existing Cross-border Trade Facilities
The Future New International Corridor
Source: JICA Study Team
Figure 6.5.1 Proposed Corridor Development of Cross Border Route

Pakistan Transport Plan Study in the Islamic Republic of Pakistan (PTPS)
6-49
6.6 Institutional Capacity Enhancement 6.6.1 Institutional Capacity of Road Administration
Mismanagement of investments has led to inadequate road rehabilitation and maintenance, resulting in rapidly deteriorating roads and a large and ever increasing maintenance backlog. There is also an urgent need to develop management and professional skills in the institutions that are tasked with managing the road network. The need for institutional strengthening and well designed road sector development plans are particularly apparent at the provincial level, where the greater portion of the network exists. Institutional deficiencies of the national and provincial road administrations are not unique from other sub-sectors: i.e. over-staffing, low salary structure, lack of management and operational improvements, absence of research and development, and highly centralized decision-making. What is unique is the NHA’s role; it has a dual function as both financier as well as executor. This may have contributed to problem of poorly justified investments, maintenance neglect and the selection of projects without confirming the scope of the work to the need, checking cost inflation, insuring quality control, doing research and development to protect investments. Governments, in the past, provided infrastructure, operated transport and regulated the system. These are conflicting roles to being financier, executor, auditor, and regulator at the same time. There is a need to re-organize NHA so that it becomes only a financing and regulatory agency and the project execution functions can be transferred to the provincial departments of Communications and Works. NHA will be able to exercise strict financial and quality control checks.
(1) NHA’s Mismanagement of Investments
The NHA project portfolio (Rs. 276 billion) is a product of unplanned and uncoordinated investments in the transport sector during the early 1990s. The centralized project review and approval mechanisms – CDWP and ECNEC – which are supposed to provide institutional checks and balance and determine inter-sectoral priorities, were compromised and totally bypassed by the powerful National Highway Council (NHC) headed by the Prime Minister to enable rapid approval of politically high profile projects. In addition to dualization and rehabilitation of existing national highways, the NHA’s ambitious highway expansion program included a grandiose motorways construction program. New projects were poorly justified and prioritized with a bias towards capital construction over asset conservation. A proliferation of new projects without completing ongoing projects and ineffective management of project implementation has resulted in very limited economic benefits from the investments, significant deterioration in traffic conditions along some heavily travelled national highway sections, delays in completion and the subsequent increase in construction costs.
(2) Governance Improvement
Amendment to the NHA Act 1991 has restored the centralized review and approval of all NHA’s projects by the CDWP/ECNEC. The 2001 amendment removed the Board’s power to approve projects of more than Rs.60 million and for projects over Rs.100 million the NHA Executive Board is required to submit PC-I to CDWP and ECNEC for review and approval like other implementing agencies. During the past five years NHA management has been strengthened, streamlined and right sized. Overall agency staffing has been reduced from 1900 to 1400. Standard Operating Procedures have been developed and a system of enhanced staff accountability and merit based promotions has been introduced. In addition, NHA has recruited a chartered accountant and other financial management professionals from the market to strengthen its financial management capacity.
Pakistan Transport Plan Study in the Islamic Republic of Pakistan (PTPS)
6-50
(3) Implementation Capacity
At present, NHA management has three-tiers: Policy, Management and execution. Policy is set by the Chairman, Board members and NHA’s Diector General (Administration). Management is carried out by Board members, NHA’s General Managers and Directors. Execution of physical tasks is carried out by NHA’s General Managers, Directors, Deputy Directors and Assistant Directors. NHA is in charge of enforcement on only 9,000 of the total road network of 258,000 km in the country. This represents about 3% of the entire road network yet the traffic on the motorways and national highways is 75% of the commercial road traffic in the country.
(4) Maintenance Management
a) Control and Enforcement of Overloading Overloading of trucks has caused extensive damage to the highway network. Overloading control and enforcement efforts over the past two decades have been very limited and largely ineffective. Overloading, coupled with high summer time temperatures have proven the inapplicability of the commonly accepted international standards of pavement designs.
b) Maintenance Backlog A persistent bias in favour of capital construction, together with the modal shift from rail to road and significant increase in vehicle axel loads has caused a rapid and premature deterioration of the road network. The national highway network has developed a huge maintenance backlog now requiring Rs. 30 billion per annum to restore it to acceptable conditions.
c) Financing of Development Program NHA’s development programme is approved annually by the central government. Financing is currently provided by the Government in the form of Cash Development Loans (CDLs). The government allowed NHA to borrow Rs.140 billion in the form of the CDLs at an interest rate of 13%, resulting in the outstanding Rs.23 billion “Foreign re-lent loans”, US$58 million of foreign direct loans from Turkish Exim Bank for the construction of the M-1 Motorway and US$667 million from a Korean contractor (Daewoo) for the M-2 Motorway by government guarantees (payment of US$188 million has been made so far but a balance of US$793 million still remains) and US$200 million from the World Bank’s National Highway Improvement program (NHIP) loan. According to a recently published report, at the end of this financial year, NHA will be in arrears of loan payments by Rs.100 billion. (Refer to the Final Report Available Options for Sustainable Financing of NHA’s Programme, January 2005 prepared by Dr. Ronald R. Alan, Consultant)
d) Financing of Maintenance Cost Maintenance of the national highway network is funded annually by grants from the federal government separately from PSDP. The fund, however, is insufficient to cover the needs of maintenance of national highways. In order to supplement the fund for maintenance NHA has been taking various measures including increasing revenues by toll rate escalation. At the same time, NHA has been requesting funds from external assistance that focuses on the reconstruction and improvements of national highways, i.e. National Highway Improvement Program (NHIP) by the World Bank.

Pakistan Transport Plan Study in the Islamic Republic of Pakistan (PTPS)
6-51
6.6.2 Institutional Reform of Road Administration
(1) Maintenance Management
Current situation where the maintenance backlog has become an alarming proportion and according to the results of the 2004-05 RAMD Study on pavement conditions by NHA, the condition of 47% of the national highway network, which caters to more than 70% of the total inland traffic, is classified as “poor”. (The level of deteriorations on provincial roads is less critical in comparison with those on the national highway network). At the rate of deterioration of the network, road administration needs to focus on the network maintenance management and devote a substantial portion of its financial and human resources to capital development. The maintenance management programme needs to be supported by accelerated research and development efforts and tighten the quality and cost control though the enforcement of new design standards and material specifications which will be developed by new research and development efforts on an urgent basis.
(2) Research and Development
Problems of pavement deterioration can be slowed down through pavement thickness design and material specifications for the local environment and traffic conditions. NTRC, the research wing of MOC, launched a comprehensive research program of test sections covering flexible and semi-rigid pavement for evolution of pavement thickness design procedures specifically for Pakistan. NHA, faced with the problems of pavement deteriorations has not utilized the existing research centre. Instead, it has accepted the technical and financial assistance to create two separate research centres under the NHA, one by the World Bank and the other by JICA. The World Bank’s research centre will be a part of NHIP. Meanwhile, the existing National Transport Research Centre (NTRC) has within the premises a pavement testing facility and qualified professionals specializing in pavement design and materials. To avoid duplication and wasting the financial and human resources, the existing and proposed R&D facilities need to be combined into a single research and training centre. The facilities and professionals of the NTRC Road Research Section need to be transferred to the new centre as the first step of the consolidation.
(3) Private Sector Participation in National Highways and Motorways
With so many projects competing for PSDP allocation of additional financial resources, and to achieve the objectives defined by economic policy, there is no choice but to pursue a BOT approach in full knowledge of the cost inflation. NHA has been the main recipient of public sector funding and external assistance, bilateral and multilateral. Under these circumstances, it might be questioned whether it is worthwhile for NHA to invite the private sector to join in the financing of multi-million dollar motorway constriction in the hope that by doing so these already matured projects may be implemented sooner than if they were to wait for public funding opportunities. The key element that should always be evaluated carefully, in this respect, is the estimated time period by which the projects would probably have to be delayed until such an opportunity arose. On that basis, for the time period under consideration the “socio-economic” benefits at stake, i.e. which would be lost if the project was not implemented at an optimal date, could be calculated. The period starts in the year when traditionally used parameters characterizing project efficiency such as net present value (NPV) or internal rate of return (IRR) exceed previously approved and generally acknowledged threshold values which characterize mature projects. That amount is the “socio-economic benefit in jeopardy” and should be compared to the cost increase caused by private sector involvement in financing the project. If, and when, the ratio of the benefits in jeopardy and the cost increase is above 1.0 or exceeds a previously identified and approved limit, say 1.5, then, the selection of the project is justified.

Pakistan Transport Plan Study in the Islamic Republic of Pakistan (PTPS)
6-52
6.6.3 Railway Administration
(1) Institutional Reform for the Pakistan Railways
PR was organized as a subordinate department of the Ministry of Railways and this form of organization proved increasingly ineffective in coping with competition, as PR’s pre-eminent position was increasingly challenged in the post deregulation era.
In 1995, the JICA Study on National Transport Plan in the Islamic Republic of Pakistan recommended the creation of a Pakistan Railway Corporation, similar to PIA, with Ministerial representation on the board. The ownership and overall direction of the railway would remain in the public sector, but day-to-day running of the railway would be passed on to commercially oriented managers with clearly defined targets and responsibilities. The study concluded that, ultimately, given the hope for gain in railway productivity and profitability, such a structure would be suitable for the privatization of the railways, if that was politically desirable.
In 1997, GOP announced its strategy for the privatization of Pakistan Railways. The strategy is to restructure PR into three core businesses-Passenger, Freight and Infrastructure. A new public entity-Railway Resettlement Agency will be created to retain all surplus assets and liabilities, including labour, real estate, debts and environmental clean up obligations. In addition, a new Railway Regulatory Authority will be established under a new regulatory framework to regulate the largely private sector rail industry. This plan failed and impacted negatively on the morale of the PR employees. In 2004, after 10 years of JICA recommendation and unsuccessful attempts at privatizing PR in 1997, GOP decided to create the Pakistan Railways Corporation. The objectives and reasons were:
• To promote railway as the preferred mode of transport in the country; • To grant Pakistan Railways Corporation sufficient autonomy to operate and to enable it to
compete against other modes of transport effectively; • To allow the Corporation to procure finances directly from banks/market on suitable
terms.
The new Board consists of a Chairman, a CEO, and nine directors: three from the GOP, three from the Corporation and three from the private sector. The CEO will be recruited from the private sector. The GOP provides the Board with more autonomy and power over its governance.
(2) Management Reorganization
The institutional reform calls for:
• Shifting from the strong social service aspects of the management structure to a commercially oriented railway,
• Increasing performance by creating lines of business management which enhance management responsibilities and accountabilities and enable profit centre accounting,
• Curtailment of surplus employees is among the top priorities • Create a sustainable financing structure
Financial structure of PR has been ad hoc and unsustainable with no value-for-money testing, or monitoring to underpin budgetary support. During the 1990s no investments were made in the railway infrastructure except the procurement of locomotives. In the absence of clear long-term plans or short-term goals and the “Shock Treatment” of 1998, the railway has failed to achieve sufficient PSDP allocation to cover maintenance of the rolling stock and rail structure. As a result, the infrastructure and rolling stock are obsolete and require a substantial amount of investment to function as one of the key transport systems of the country. Reform of Pakistan Railways is discussed in the Chapter 8.

Pakistan Transport Plan Study in the Islamic Republic of Pakistan (PTPS)
6-53
6.7 Environmental Consideration 6.7.1 EIA Regulations
In 1997, the National Assembly passed the 1997 Pakistan EP Act, which subsumed the 1983 ordinance. This act requires IEEs and EIAs for all developmental projects.
Environmental impact assessment of all development projects whether public or private is a legal requirement under section 12 of PEPA 1997, which became operational in 2001. Project categories, which require an IEE, are listed in Schedule 1 (See Table 6.7.1) and the projects for which an EIA is required are in Schedule 2.
The Pakistan EPA Review of IEE and EIA Regulations, 2000 (The 2000 Regulations) prepared under PEPA 1997 define the procedures for IEEs and EIAs, and give legal status to the Pakistan Environmental Assessment Procedures, prepared by the Federal EPA in 1997.
The number of EIA reports submitted to EPAs has increased from 6 in 2000 to 29 in 2004 and the number of IEE’s from 31 in 2000 to 189 in 2004.
Mandatory list for EIA or IEE regarding the transport sector is as follows.
Table 6.7.1 Mandatory List for EIA / IEE
List of Projects Requiring an EIA (Schedule 2) List of Projects Requiring an IEE (Schedule 1) ■ Mining & Mineral Processing
· Major mineral development including; mining & processing of coal, gold, copper, iron, and precious stones
· Major smelting plants · Major non-ferrous metals, iron and steel
rolling
■ Mining & Mineral Processing · Commercial extraction of sand, gravel,
limestone, clay and other minerals not included in Schedule A.
· Crushing, grinding and separating processes· Minor smelting Plants
■ Transport · Major Ports and Harbors development · Major Airports · Federal or Provincial Highways or major
roads greater than 5 crore rupees in value. Maintenance (rebuilding or reconstruction of existing roads is excepted from the requirement of an EIA).
· Major railway works
■ Transport · Ports and Harbors Development for ships
less than 500 gross tons · Federal or Provincial Highways (except
maintenance, rebuilding or reconstruction of existing metalled roads) less than 5 crore rupees in value.
■ Environmentally Sensitive Areas · Any project which will be situated in an
environmentally sensitive or critical area should be carefully investigated, and the results communicate to the Responsible Authority, who will advise whether an EIA is necessary (see “Guidelines for sensitive and critical areas”).
■ Any other projects that the EPA may require ■Any other projects that the EPA may require.
6.7.2 EIA Procedure
No proponent of a project can proceed unless it has filed an Initial Environmental Examination (IEE) with the Federal Agency and received approval. No proponent of a project which is likely to cause adverse environmental effects can proceed unless an EIA has been approved by the Federal Agency.
After filing the IEE, the Federal Agency must respond within 10 working days and state if the submission is acceptable or not, or if an EIA is required. If acceptable, the agency is required to review the IEE and approve it within 45 days. If an EIA is required, the Agency

Pakistan Transport Plan Study in the Islamic Republic of Pakistan (PTPS)
6-54
must review the EIA and give approval subject to conditions, within 90 days, require that the EIA be re-submitted after any stipulated modifications, or reject the project.
Every review of an EIA must be carried out with public participation but no commercially confidential information will be disclosed during the public participation unless such disclosure is in the public interest. The Federal Agency must communicate its approval or otherwise within four months from the date the IEE or EIA is first filed. If the submission is complete and complies with procedure, but no response is given, then the IEE or EIA shall be deemed approved. The Federal Government can, at its discretion, extend the four month period if justified by the nature of the project.
The Federal Agency must maintain separate registers for IEE and EIA projects, which contain brief particulars of each project and a summary of decisions taken. These registers are to be open to the public.
6.7.3 Environmental Management Plan
The project proponents will be responsible for ensuring implementation of the environmental mitigation measures recommended in the IEE or EIA. An Environmental Management Plan (EMP) should be prepared during the EIA/planning phase and should include specific mitigation measures, environmental monitoring requirements, institutional arrangements and budget.
The EMP is a crucial document and should be prepared during the IEE/EIA. It must be approved by the EPA and included in the contractual obligations imposed on the contractor.
Implementation of the EMP during construction is the responsibility of the contractor. The contractor is responsible for environmental monitoring and reporting. The project proponent must ensure that the performance of the contractor is in accordance with EMP. The contractor should submit a report on EMP implementation annually.
6.7.4 JICA and Pakistan EPA Guidelines
A comparison has been made between JICA guidelines and the requirements of the Pak-EPA. There are no significant differences.
JICA does include Strategic Environmental Assessment (SEA), which the Pak-EPA does not; however, MOE would like to see this included at a policy level. Resettlement is included in both guidelines, however MOE admit they do not have capacity to assess such issues.
At technical levels there are no essential differences. A comparison is given below in Table 6.7.2.

Pakistan Transport Plan Study in the Islamic Republic of Pakistan (PTPS)
6-55
Table 6.7.2 Comparisons of Requirements of JICA and Pak-EPA Environmental Guidelines
Scope of Impacts to be Assessed in Environmental Assessment JICA Pak - EPA
Direct and immediate impacts of projects Site selection Derivative, secondary and cumulative impacts Indirect impacts on natural resources Environmental impacts of a trans-boundary or global scale e.g. global warming Project Related Impacts
Impacts on natural environment: Impacts on natural environment: Air Air quality
Water, water usage Water quality, water supply, storm water management, ground water, flooding
Soils, ground subsidence, sedimentation, geographical features Soil stability, soil erosion, sedimentation
Waste Safe storage of materials on construction site
Accidents Construction hazards, traffic accidents, disaster response plan
Ecosystems, biota Flora and fauna (biota), destruction of habitats (ecosystems), loss of species
Noise & vibration Noise & vibration Social considerations Social considerations: Migration of people, social institutions & infrastructure local decision-making institutions; existing social infrastructures and services
Displacement of existing uses, breakdown of community cohesion; provide replacement community facilities
Involuntary resettlement Adequate resettlement and compensation to allow viable lifestyle to continue.
Local economy, employment and livelihood distribution of benefits and losses and equality in the development process
Economic issues, loss of livelihood
Land use and utilization of local resources Landscape, visual amenity, induced land change Cultural heritage Cultural heritage Infectious diseases such as HIV/AIDS. Health, spread of disease Local conflict of interests, vulnerable social groups: poor, indigenous peoples, gender, children’s rights
6.7.5 Current EIA Issues
(1) Key Issues
An overview of the key environmental issues facing Pakistan is presented below:
The amount of “available water” in Pakistan has been decreasing at an alarming rate and is approaching the “water scarcity level” of 1,000m3 per capita. Fresh water resources are polluted from discharge of untreated industrial and municipal wastes. Rivers are allegedly polluted by discarded waste from road construction and soil run off during heavy rain.
Air pollution is increasing, especially in urban areas. Pakistan EPA surveys detected levels of suspended particulate matter six times higher than WHO guidelines. ‘Smog’ seriously affects almost the entire province of Punjab during December and January every year.
Noise pollution has become a serious issue in major urban centres.
Degradation and encroachment into natural forests, rangelands, freshwater and marine ecosystems are destroying habitats leading to loss of biodiversity. At least four mammal species, including tiger, swamp deer, lion and rhinoceros, are known to have become extinct from Pakistan, while at least 10 ecosystems of particular value for species richness and uniqueness of their floral and fauna are critically threatened. Deforestation loss is

Pakistan Transport Plan Study in the Islamic Republic of Pakistan (PTPS)
6-56
occurring at a rate of 0.2-0.5% per annum. New roads opening up such protected areas are thought to worsen this situation.
Pakistan is an energy inefficient country. It uses approximately the same energy to generate $1 of GNP as the USA.
The above situation has arisen due to a number of factors including high population growth rate, prevailing poverty, unplanned urban and industrial expansion, insufficient emphasis on environmental protection in the government policies, lack of public awareness and education and lack of institutional capacity and resources for effective environmental management. (Reference Draft National Environmental Policy 2005-15, Ministry Of Environment, Government of Pakistan, March 2005)
(2) Guiding Principles
The following guiding principles have been adopted to address these environmental concerns:
• Principle of sustainable development. • Principle of equitable access to environmental resources. • Creation of demand for a better environment. • Respect and care for the environment. • Integration of environment into planning and implementation of policies, programs and
projects. • Changing personal attitudes and behaviors. • Precautionary principle. • Polluter pays principle. • Substitution principle. • Improving the efficiency of usage of environmental resources. • Decentralization and empowerment. • Extensive participation of communities, stakeholders and the public. • Accountability and transparency. • Increased coordination and cooperation among federal and provincial governments,
NGOs, private sector and academia. • Increased regional and international cooperation.
(3) Benchmarks and Targets
The current environmental benchmarks and future targets are;
• Increase renewable energy production (wind, solar, bio-gas etc.) • Increase forest cover from the current level of 4.8% to 5.7% in 2010 and 6% in 2015. • Increase land area protected for the conservation of wildlife from current level of 11.3%
to 11.5% in 2010 and 12% in 2015. • Finalize standards for ambient air quality and noise by 2006. • Increase the number of petrol and diesel vehicles using CNG fuel from 280,000 currently
to 800,000. • Reduce, by 2010, the percentage of sulphur in high speed diesel fuel oil from 1% to 0.5%. • Establish 40 ambient air quality and 25 water quality monitoring stations by 2015. • Phase out two-stroke rickshaws by replacing them with four-stroke rickshaws or
alternative modes of transport.
(4) Institutional Issues
The requirements for protection of the environment during construction of any major transportation projects are well defined in law and the legal procedures are laid down in regulations. These regulations give details of the procedures to be followed in the preparation

Pakistan Transport Plan Study in the Islamic Republic of Pakistan (PTPS)
6-57
of an IEE or EIA, the timing of the preparation, the authorities to be consulted, the responsibilities of all parties involved, and the follow up procedure necessary to ensure that agreed remedial measures are implemented correctly.
The Project Proponents such as NHA or the Provincial Highway Authorities do not have the capability to produce such documents. They need to hire a consultant to do this but even so, it would be better if each project proponent had an environmental officer of environmental cell embedded in its organization to supervise consultants.
Even when the IEEs/EIAs are prepared the Provincial EPAs or the Federal EPA and Ministry of Environment do not have the capability to review the documents adequately or dispute statements made.
The IEEs/EIAs should contain an EMP (Environmental Management Plan) which is to be implemented by the contractor. However, often contractors complain that they were not involved in the preparation of the EMP so regard its implementation as impractical. This is an invalid argument as the implementation of the EMP is required in the contract, and by agreeing to the contract, the contractor accepts responsibility for implementing the EMP.
The implementation of the EMP should be enforced by the EPA but the project proponent is responsible for checking that the contractor is following the EMP requirements. The contractor should submit regular reports to the project proponent who should forward these to the EPA. In the event of non compliance, the project proponent should discipline the contractor by regulating payment.
Enforcement of the conditions stipulated in the IEE/EIA is difficult and often contractors do not follow the EMP requirements. The improvement to Murree Road has been given as an example where contractors were dumping left over spoil material in the river and increasing sediment levels.
On a more general level, the Federal Ministry of Environment would like to be more involved in decision-making at a strategic level as it feels decisions on projects have already been made before it is consulted.
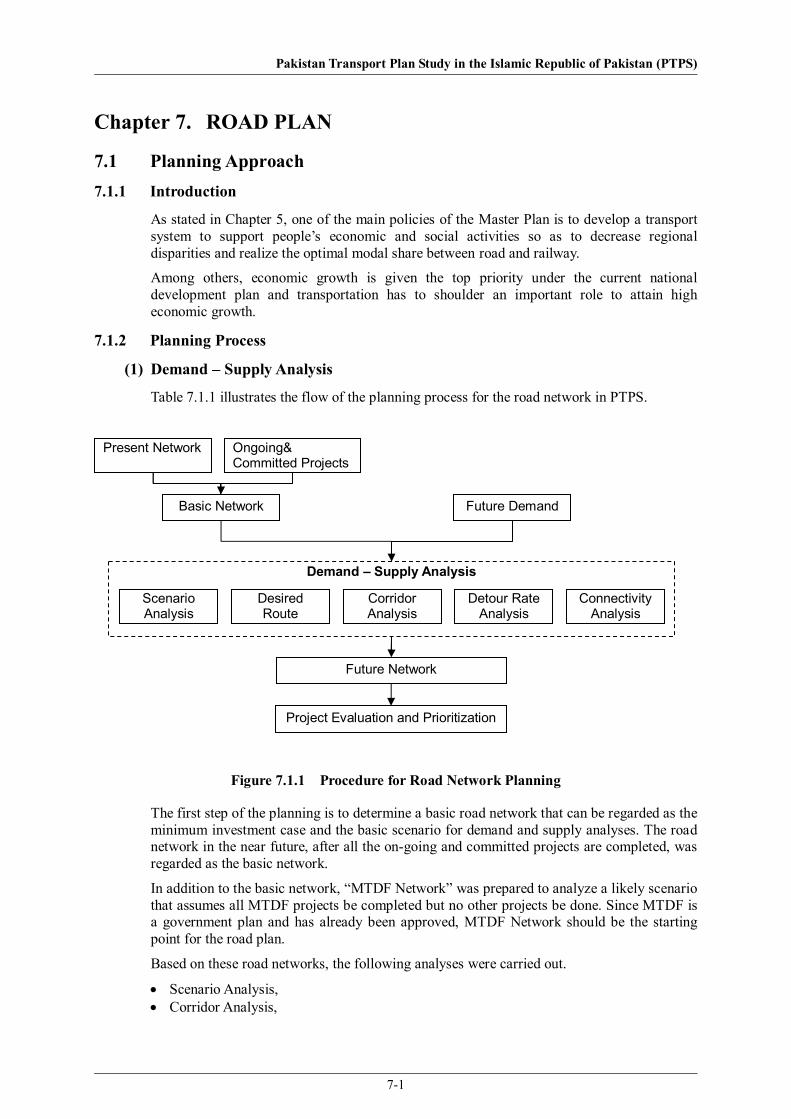
Pakistan Transport Plan Study in the Islamic Republic of Pakistan (PTPS)
7-1
Chapter 7. ROAD PLAN
7.1 Planning Approach 7.1.1 Introduction
As stated in Chapter 5, one of the main policies of the Master Plan is to develop a transport system to support people’s economic and social activities so as to decrease regional disparities and realize the optimal modal share between road and railway.
Among others, economic growth is given the top priority under the current national development plan and transportation has to shoulder an important role to attain high economic growth.
7.1.2 Planning Process
(1) Demand – Supply Analysis
Table 7.1.1 illustrates the flow of the planning process for the road network in PTPS.
Figure 7.1.1 Procedure for Road Network Planning
The first step of the planning is to determine a basic road network that can be regarded as the minimum investment case and the basic scenario for demand and supply analyses. The road network in the near future, after all the on-going and committed projects are completed, was regarded as the basic network.
In addition to the basic network, “MTDF Network” was prepared to analyze a likely scenario that assumes all MTDF projects be completed but no other projects be done. Since MTDF is a government plan and has already been approved, MTDF Network should be the starting point for the road plan.
Based on these road networks, the following analyses were carried out.
• Scenario Analysis, • Corridor Analysis,
Demand – Supply Analysis
Present Network Ongoing& Committed Projects
Basic Network Future Demand
Scenario Analysis
Future Network
Project Evaluation and Prioritization
Corridor Analysis
Detour Rate Analysis
Desired Route
Connectivity Analysis

Pakistan Transport Plan Study in the Islamic Republic of Pakistan (PTPS)
7-2
• Desired Route Analysis, • Detour Rate Analysis, • Connectivity Analysis
Scenario Analysis
This analysis includes several scenarios. “Do-Minimum Scenario” shows what will happen if no project is implemented other than the on-going and committed projects. Similarly, “MTDF Scenario” shows the future situation with MTDF Network.
Corridor Analysis
This analysis compares traffic demand and capacity of transport corridors. If traffic demand exceeds the capacity along a corridor, capacity expansion of the corridor can be identified as an important transport issue. Based on the corridor analysis, future requirements of additional capacity of highway corridors are identified and proper measures such as widening of existing roads and new road construction are selected for each corridor. By doing this, new road projects are planned.
Desired Route Analysis
This analysis clarifies the desirable routes that road users prefer, on the assumption that all roads have unlimited capacity and therefore no congestion occurs.
Detour Rate Analysis
This analysis picks up pairs of two large cities between which the shortest route is very far compared to the distance in a straight line. It is economically desirable that large cities are mutually connected with a short route. For a pair of two large cities with a high detour rate, a possibility of a short cut route should be looked for.
Connectivity Analysis
This analysis identifies necessary alternative routes between large cities. Highways should be continuous along a corridor, so connectivity is one of factors to examine in a road network. In addition, the highway network should be stable, ensuring against a disaster or an accident. Every pair of two large cities should be connected with plural routes in order to provide a vehicle with an alternative route on any occasion.
(2) Road Network Formulation
The master plan road network was proposed based on the result of the demand - supply analysis. In formulating the road network, various factors such as regional development and natural resource exploitation were considered. Necessary projects for the master plan network were identified.
(3) Project Evaluation and Prioritization
The identified projects were evaluated economically (and financially if necessary), in order to determine their priority.
7.1.3 Ongoing and Committed Projects
In order to make the base network, on-going and committed projects were identified. Currently there are a number of road projects being carried out. In addition, there are new projects that have already been committed by authorized agencies and will start soon. Figure 7.1.2 shows the locations of these projects by donor agencies, and project sections are described in Table 7.1.1.

Pakistan Transport Plan Study in the Islamic Republic of Pakistan (PTPS)
7-3
Table 7.1.1 List of Ongoing and Committed Projects No. Project Name No. Project Name
Ongoing Projects 250 Bridge over River Chenab at Shershah 10 Makran Coastal Road (Balochistan) 260 Interchange at Khangah Dogran on M-2 20 Islamabad – Pashawar Motorway (M-1) 270 Interchange at Sial More on M-2 30 Pindi- Bhattan Motorway (M-3) 280 Lala Musa – Gulyana Thotha Rai Bahadur Road 40 Karachi Northern Bypass 290 Nowshera – Chakdara, Dir-Chitral N-45 50 Lyari Expressway 470 N-5 Rehabilitation Project 60 Islamabad-Muzaffarabad Road 540 Kalat –Quetta – Chaman Section (N-25) 72 Indus Highway Project (Phase-III) 551 Peshawar-Torkhan Dual Carriageway 80 Mansehra – Naran – Jalkhad Road 552 Malana Junction-Sarai Gambia Dualization
100 Rahim Yarkharn Bahalwalpur (N-5) 553 Badabher – Dara Adam Khel 110 Okara Bypass 554 Sarai Gambia-Bannu-Miran Shah-Ghulam Road 120 Karian – Rawalpindi (N-5) 650 Kohat Tunnel Access Road, JBIC 130 Chablat Nowshera (N-5) 670 Karao-Wad Section, JICA 140 Lowari Tunnel & Access Road Committed Projects 150 Bridge on River Jhelum at Azad Pattan AJK 480 Rehabilitation of 518km of N-5, WB 160 Improvement of N-65 Dera Allah Yar Nutal Section 530 Gujranwala-Hafizabad-Pindi Battian, WB 170 Improvement of N-65 Nutal-Sibi-Dhadar Section 561 Hub – Uthal Section N25, ADB 180 Improvement of KKH (N-35), NWFP 562 Multan – Muzaffargarh, ADB 190 D.I.Khan Mugharl Kot Section (N-50) 563 Khanozai-Mughalkot N50, ADB 200 Improvement of N-70 Qila Saifullar Loralai Bewata 564 Hassanabdal-Abbotabad-Mansera, ADB 210 Ratodero-Shahdakot-Khuzdar Section (M-8) 565 Sukkur-Jaccobabad, ADB 220 Gwadar – Khuzdar Road (M-8) 566 Tarnol-Fatejangh-Jand, ADB 230 Khori-Quba Seed Khan Section 567 Qila Saifullah – Loralai –Wiagum Rud, ADB 240 Realignment of N65 near Jaccobabad 570 Malakand Tunnel/Bypass, ADB
!(
!(
!(
!(
220561
290
4010
563
200
690
100
20
72
110
80
120554
60
190
170
540
530
230
562
564
552
670
30
470
902
565210
210
160
551
480
280
553
50
130
240
150
140
250
260
650
!( PSDP
PSDP
ADB
JBIC/JICA
WB
Figure 7.1.2 Location of Ongoing/Committed Projects

Pakistan Transport Plan Study in the Islamic Republic of Pakistan (PTPS)
7-4
7.2 Demand- Supply Analysis 7.2.1 Growth in Travel Demand
Forecast growth in travel demand to 2025 is expected to be more than 3-fold. Growth rate is expected to be higher in the 1st decade than in the following 10 years, and the demand for both freight and personal travel by road is expected to double over the next ten years.
Table 7.2.1 Growth of Transport Demand (Interzonal Transport)
Passenger or ton (mill/year) Pax-km or ton-km (bill/year) Year 2005 2015 2025 2005 2015 2025
Passenger 780 1,455 2,497 154 293 517 Freight 241 440 748 99 185 329 Note: Projection by JICA Study Team
On the other hand, on-going and committed projects will not be enough to increase the road network capacity to such a degree to meet with future demand. Figure 7.2.1 illustrates the road network after the on-going and committed projects are completed with information of the number of lanes. It is noticeable that after a number of on-going and committed projects, the network will not be greatly expanded from the existing network, and most of roads will still be 1-lane or 2-lane.
No. of Lanes/Dir. 6 4 2 1
Figure 7.2.1 Road Network after current projects

Pakistan Transport Plan Study in the Islamic Republic of Pakistan (PTPS)
7-5
7.2.2 Scenario Analysis
Traffic assignment was carried out to calculate traffic volume on roads for the following scenarios:
• Do-Minimum Scenario: Only on-going and committed projects are carried out.
• MTDF Scenario: Only and all MTDF projects are carried out.
• Modal Shift Scenario: All the necessary projects for the target modal share are carried out as well as all MTDF projects.
The results are shown in Figure 7.2.2, Figure 7.2.3, and Figure 7.2.4. The daily traffic volume is expressed as the width of each link and volume to capacity ratio is expressed as grey colours of four categories. Although daily capacity does not necessarily mean the ultimate capacity of a road in a day, there are some important findings as:
• Ongoing and committed projects can provide necessary capacity to some extents in 2010 as shown in Figure 7.2.2 [1]. Other projects are required in addition to these projects to improve service level at some points.
• MTDF projects provide sufficient capacity in 2010 as shown in Figure 7.2.2 [2]. and it will be able to provide necessary capacity to some extents up to 2015 as shown in Figure 7.2.3 [1]. However, MTDF will not be able to provide minimum service in 2025 as shown in Figure 7.2.3 [2].
• If the target modal share is achieved, the road network by MTDF is sufficient up to 2015 as shown in Figure 7.2.4 [1], but the level of service will be still low in 2025 as shown in Figure 7.2.4.
Volume Capacity Ratio
- 0.5
0.5 - 0.75
0.75 - 1.0
1.0 -
Volume Capacity Ratio
- 0.5
0.5 - 0.75
0.75 - 1.0
1.0 -
Do-Minimum Scenario, 2010 MTDF Scenario, 2010
[2][1]
Source: JICA Study Team
Figure 7.2.2 Traffic Assignment for Do-Minimum and MTDF Scenario (2010)

Pakistan Transport Plan Study in the Islamic Republic of Pakistan (PTPS)
7-6
Volume Capacity Ratio
- 0.5
0.5 - 0.75
0.75 - 1.0
1.0 -
Volume Capacity Ratio
- 0.5
0.5 - 0.75
0.75 - 1.0
1.0 -
MTDF Scenario, 2015 MTDF Scenario, 2025
[2][1]
Source: JICA Study Team
Figure 7.2.3 Traffic Assignment for MTDF Scenario (2015, 2025)
Volume Capacity Ratio
- 0.5
0.5 - 0.75
0.75 - 1.01.0 -
Volume Capacity Ratio
- 0.5
0.5 - 0.75
0.75 - 1.0
1.0 -
Modal Shift Scenario, 2015 Modal Shift Scenario, 2025
[2][1]
Source: JICA Study Team
Figure 7.2.4 Traffic Assignment for Modal Shift Scenario
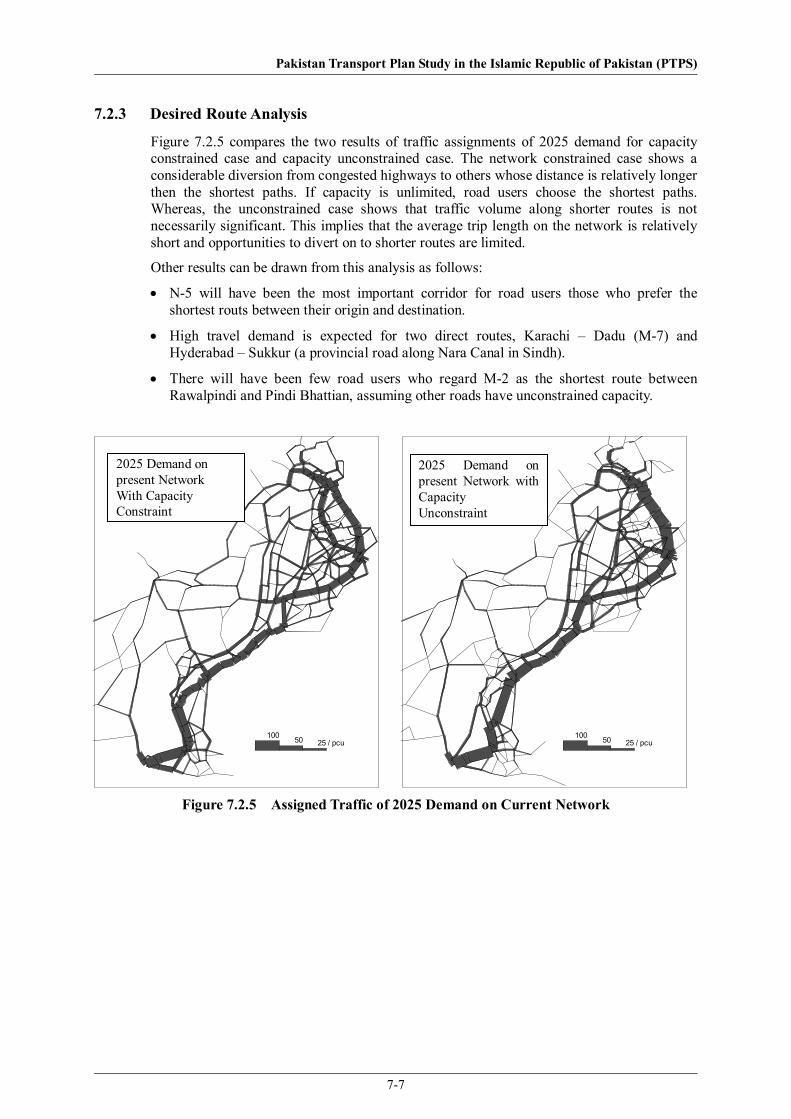
Pakistan Transport Plan Study in the Islamic Republic of Pakistan (PTPS)
7-7
7.2.3 Desired Route Analysis
Figure 7.2.5 compares the two results of traffic assignments of 2025 demand for capacity constrained case and capacity unconstrained case. The network constrained case shows a considerable diversion from congested highways to others whose distance is relatively longer then the shortest paths. If capacity is unlimited, road users choose the shortest paths. Whereas, the unconstrained case shows that traffic volume along shorter routes is not necessarily significant. This implies that the average trip length on the network is relatively short and opportunities to divert on to shorter routes are limited.
Other results can be drawn from this analysis as follows:
• N-5 will have been the most important corridor for road users those who prefer the shortest routs between their origin and destination.
• High travel demand is expected for two direct routes, Karachi – Dadu (M-7) and Hyderabad – Sukkur (a provincial road along Nara Canal in Sindh).
• There will have been few road users who regard M-2 as the shortest route between Rawalpindi and Pindi Bhattian, assuming other roads have unconstrained capacity.
25 / pcu100 50
25 / pcu100 50
Figure 7.2.5 Assigned Traffic of 2025 Demand on Current Network
2025 Demand on present Network With Capacity Constraint
2025 Demand on present Network with Capacity Unconstraint

Pakistan Transport Plan Study in the Islamic Republic of Pakistan (PTPS)
7-8
7.2.4 Corridor Analysis
Figure 7.2.6 depicts the travel demand for 2005, 2015 and 2025 by three histogram bars, and the cross line defines the current capacity along each corridor. The analysis across 10 major corridors in Pakistan illustrates that:
• All corridors west of the Indus have sufficient capacity to 2015, but four corridors out of five would need additional capacity to meet the projected 2025 demand.
• The scenario to the east of the Indus reflects that the current network capacity would only be sufficient for the next five years or so. Beyond that additional capacity is essential, and on three out of four corridors the additional capacity requirement is more than double the current capacity.
8
6
3
1
4
710
5
9
2
Figure 7.2.6 Demand and Supply Gap on Screen Lines
pcu/day30,000
2005 year20152025
Present Capacity

Pakistan Transport Plan Study in the Islamic Republic of Pakistan (PTPS)
7-9
7.2.5 Detour Rate Analysis
Detour rates were calculated among the 12 largest cities. City pairs with higher detour rate are shown in Figure 7.2.7. The cities having good connection with other cities are Lahore, Islamabad, Sialkot and Gujranwala. On the other hand, Peshawar and Quetta are connected to other major cities at a long distance (high detour rate). Road network should be improved to lessen those higher rates.
Table 7.2.2 Distance and Detour Rate among Major Cities Population1998
1 2 3 4 5 6 7 8 9 10 11 12
1 Karachi 9,339 - 1,033 941 1,147 737 147 1,072 1,106 596 974 1,124 6832 Lahore 5,443 1.20 - 119 270 314 900 71 377 714 168 110 3513 Faisalabad 2,009 1.22 1.19 - 257 207 815 132 321 595 83 184 2634 Islamabad 1,939 1.21 1.01 1.21 - 422 1,034 201 144 691 187 192 5005 Multan 1,197 1.24 1.02 1.26 1.24 - 615 339 423 426 239 391 916 Hyderabad 1,167 1.19 1.18 1.20 1.18 1.21 - 943 1,006 553 855 996 5537 Gjranwala 1,133 1.19 1.02 1.02 1.07 1.11 1.17 - 318 714 142 52 3918 Peshawar 983 1.25 1.15 1.37 1.16 1.41 1.22 1.19 - 599 238 324 5129 Quetta 565 1.21 1.20 1.21 1.16 1.25 1.28 1.18 1.21 - 576 759 458
10 Sargodha 458 1.23 1.02 1.31 1.23 1.29 1.20 1.14 1.46 1.24 - 183 31411 Sialkot 422 1.18 1.06 1.01 1.17 1.09 1.15 1.02 1.20 1.18 1.15 - 44312 Bahawalpur 408 1.23 1.32 1.32 1.23 1.03 1.21 1.16 1.35 1.37 1.28 1.14 -
Note: Detour rate is defined as the ratio of road distance between two cities to the distance of a straight line directly connected the two cities.
CitiesDetour Rate
Distance between two cities measuredin straight line (km)
Detour Rate1.25 - 1.301.30 - 1.401.40 -
Quetta
IslamabadPeshaw ar
Sargodha Gujranw ala
Faisalabad
Sialkot
Karachi
Hyderabad
Multan
Lahore
Bahaw alpur
Figure 7.2.7 Geographical Distribution of High Detour Rates

Pakistan Transport Plan Study in the Islamic Republic of Pakistan (PTPS)
7-10
7.2.6 Implications of the Analyses on Road Planning
The implications of the analysis on the road planning are summarized as follows.
• M-7 and a new road between Hyderabad and Sukkur along Nara Canal can be nominated as new shortcut road of N-5.
• Road capacity of N-5 and N-55 in Sindh Province should be expanded as early as possible. Construction of new roads or dualization of N-55 can be considered.
• Road capacity of N-5 and M-2 between Rawalpindi and Lahore should also be expanded. Access control of N-5 and traffic control in urban area are important because construction of new roads may be difficult along this corridor.
• New bridges are necessary for the River Indus, Jhelum, Chenab, Ravi and Sutlej. River crossing demand is very high in Punjab Province.
• M-4 will significantly reduce the detour rate between Multan and Faisalabad, and can be given high priority.

Pakistan Transport Plan Study in the Islamic Republic of Pakistan (PTPS)
7-11
7.3 Development Plan 7.3.1 Pakistan Motorway Network
Currently, 10 motorways (M1 – M10) of 2,667 km are planned or already operated. In addition to these, 9 more motorways (M11 – M19) with total extension of 2,140 km were identified and proposed by the PTPS. Table 7.3.1 and Figure 7.3.1 detail the current, committed, and indicative motorway network of Pakistan, as modeled by PTPS. The network development has two salient features: 1) It diversifies the demand away from the current single N/S corridor of N5, and 2) in the case of failure of one corridor, the alternative routes could be used effectively.
M-9M-9M-9M-9M-9M-9M-9M-9M-9M-10M-10M-10M-10M-10M-10M-10M-10M-10
M-1
8M
-18
M-1
8M
-18
M-1
8M
-18
M-1
8M
-18
M-1
8
M-7
M-7
M-7M-7
M-7M-7
M-7
M-7
M-7
M-8M-8M-8M-8M-8M-8M-8M-8M-8
M-17M-17M-17M-17M-17M-17M-17M-17M-17
M-6M-6M-6M-6M-6M-6M-6M-6M-6
M-5
M-5
M-5M-5
M-5M-5
M-5
M-5M-5
M-4M-4M-4M-4M-4M-4M-4M-4M-4
M-1M-1M-1M-1M-1M-1M-1M-1M-1
M-15M-15M-15M-15M-15M-15M-15M-15M-15
M-1
1M
-11
M-1
1M
-11
M-1
1M
-11
M-1
1M
-11
M-1
1
M-1
3M
-13
M-1
3M
-13
M-1
3M
-13
M-1
3M
-13
M-1
3
M-2
M-2
M-2
M-2
M-2
M-2
M-2
M-2
M-2
M-12M-12M-12M-12M-12M-12M-12M-12M-12ShahdaraLahore
Talagang
Karachi
M-3
M-3
M-3M-3
M-3M-3
M-3
M-3
M-3
M-14M-14M-14M-14M-14M-14M-14M-14M-14
M-1
6M
-16
M-1
6M
-16
M-1
6M
-16
M-1
6M
-16
M-1
6
M-1
9M
-19
M-1
9M
- 19
M- 1
9M
-19
M-1
9M
-19
M- 1
9
Islamabad
Peshawar
Quetta
Chitral
Dir
saidu
Dasu
Manasehra
HavelianParachinar
ThalKohat
DadarKagan
Madyan
Kalam
Barenis
Gujar Khan
J helum
SialkotShakargar
J and
Miran Shah
WanaTankKulachi
Lakki
Karak
MianwaliKhushab
KasurZhob
Musa Khel Bazar Okara
Pakpattan
BahawalnagarVihari
KhanewalMultan
Fort AbbasBahawalpur
KhanpurChachran
Mailsi
Kot Addu
Qamr ud Dim Kerez
Qila Saifullah
LoralaiZiaratPishin
Marnai DukiKohlu
MawandTalhKahan
Dera Bugti
Sibi
Panjpai
Nushki
Khuzdar
Wad
Besima
Kharan
DalbadinNok KundiKuh i Taftan
Surab
Nag
WashukQila Ladgashi
PnajgurParom
MandTurbat
J iwani Gwadar Pasni Ormara
Awaran
Uthal
Bela
J acobabadShuikarpurSukkarKhairpurlarkana
SarahNaushehro FirozDadu
J amao head
SangharTandu Adam
Hyderabad PithoroKhokhropar
ThattaMirpur Sakro
J atiBadin Mithi
Diplo Nagar Parkar
Umarkot
Drosh
Chaman
Chilas
Pidi Bhatt
Samundari
Kalabagh
Kati Bandar
Hoshab
Lachi
Figure 7.3.1 Location of Proposed Motorway Network
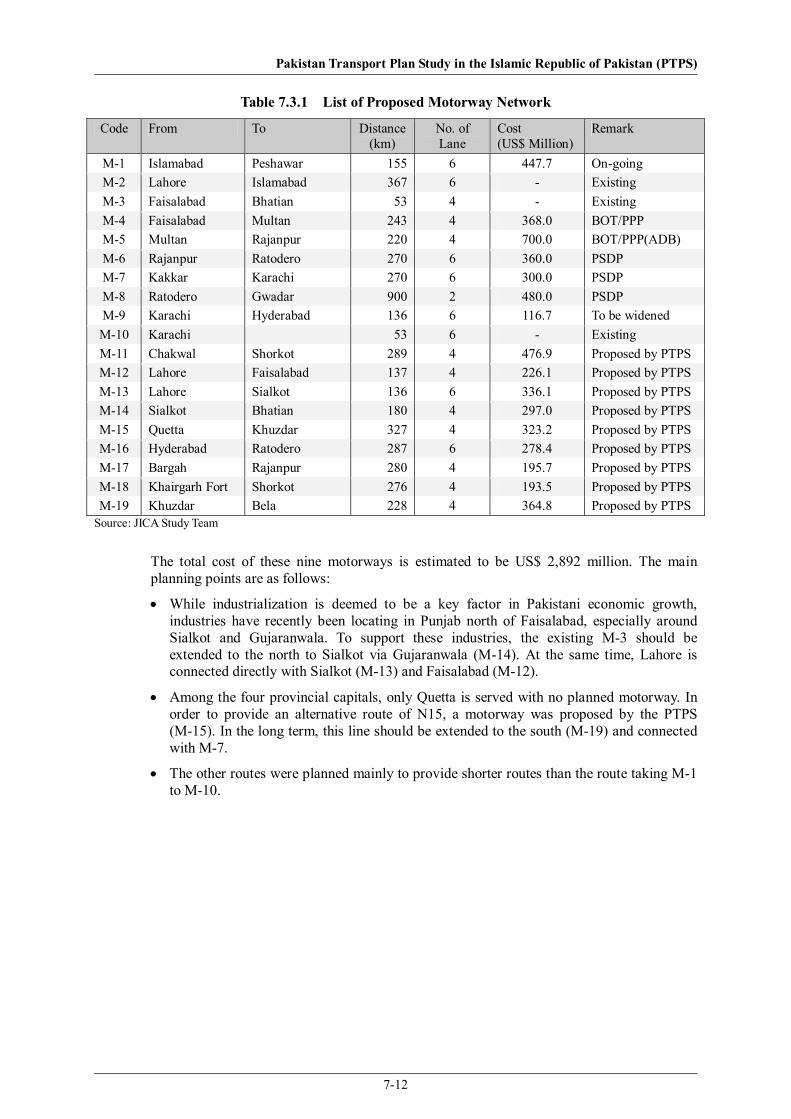
Pakistan Transport Plan Study in the Islamic Republic of Pakistan (PTPS)
7-12
Table 7.3.1 List of Proposed Motorway Network
Code From To Distance(km)
No. of Lane
Cost (US$ Million)
Remark
M-1 Islamabad Peshawar 155 6 447.7 On-going M-2 Lahore Islamabad 367 6 - Existing M-3 Faisalabad Bhatian 53 4 - Existing M-4 Faisalabad Multan 243 4 368.0 BOT/PPP M-5 Multan Rajanpur 220 4 700.0 BOT/PPP(ADB) M-6 Rajanpur Ratodero 270 6 360.0 PSDP M-7 Kakkar Karachi 270 6 300.0 PSDP M-8 Ratodero Gwadar 900 2 480.0 PSDP M-9 Karachi Hyderabad 136 6 116.7 To be widened M-10 Karachi 53 6 - Existing M-11 Chakwal Shorkot 289 4 476.9 Proposed by PTPS M-12 Lahore Faisalabad 137 4 226.1 Proposed by PTPS M-13 Lahore Sialkot 136 6 336.1 Proposed by PTPS M-14 Sialkot Bhatian 180 4 297.0 Proposed by PTPS M-15 Quetta Khuzdar 327 4 323.2 Proposed by PTPS M-16 Hyderabad Ratodero 287 6 278.4 Proposed by PTPS M-17 Bargah Rajanpur 280 4 195.7 Proposed by PTPS M-18 Khairgarh Fort Shorkot 276 4 193.5 Proposed by PTPS M-19 Khuzdar Bela 228 4 364.8 Proposed by PTPS
Source: JICA Study Team
The total cost of these nine motorways is estimated to be US$ 2,892 million. The main planning points are as follows:
• While industrialization is deemed to be a key factor in Pakistani economic growth, industries have recently been locating in Punjab north of Faisalabad, especially around Sialkot and Gujaranwala. To support these industries, the existing M-3 should be extended to the north to Sialkot via Gujaranwala (M-14). At the same time, Lahore is connected directly with Sialkot (M-13) and Faisalabad (M-12).
• Among the four provincial capitals, only Quetta is served with no planned motorway. In order to provide an alternative route of N15, a motorway was proposed by the PTPS (M-15). In the long term, this line should be extended to the south (M-19) and connected with M-7.
• The other routes were planned mainly to provide shorter routes than the route taking M-1 to M-10.

Pakistan Transport Plan Study in the Islamic Republic of Pakistan (PTPS)
7-13
7.3.2 Highway Network
The highway network configuration in Pakistan has almost been completed. However, most sections except N-5 are single lane roads (one lane per direction), which has a limited capacity as well as problems to secure safe traffic. Therefore, the main focus of road investment will be “widening” rather than “new construction”.
By 2025, many highways will need widening into dual-2 carriageway due to heavy demand exceeding present capacity, especially in Punjab province. Figure 7.3.2 shows the highways to be widened and improved. They will be examined at the evaluation stage for their economic viability and appropriate timing of implementation.
Is lamabad
Lahore
Peshawar
Quetta
Karachi
Chitral
Dir
saidu
Mardan
Dasu
ManasehraAbbottabad
Parachinar
ThalKohat
Attock C it
Dadar
Kagan
Madyan
Kalam
Barenis
Gujar Khan
Jhelum
Gujrat
Gujranwala
SialkotShaka
Phalia
Chakwar
Jand
Miran Shah
WanaTank
Kulachi
Lakk i
Karak
Mianwali
JauharabadSargodha
Chiniot
Faisalabad
KasurJhang
BhakkarDera Ismail Khan
Zhob
Musa Khel BazarShorkot
Okara
Pakpattan
BahawalnagarVihari
KhanewalMultan
Fort AbbasBahawalpur
Ahmadpur EastLiaquatpur
Khanpur
Raimyar Khan
Mails i
Kot Addu
Qamr ud Dim Kerez
Qila Saifullah
LoralaiZiaratPishin
MarnaiDuk i
Kohlu
MawandTalh
KahanDera Bugti
Dera Murad Jamali
Sibi
SpezardPanjpai
Kalat
Nushk i
Khuzdar
Wad
Bes ima
Kharan
DalbadinNok KundiKuh i Taftan
Surab
Nag
WashukQila Ladgashi
Pnajgur
Parom
MandTurbat
J iwani GwadarPasni
Ormara
Awaran
Uthal
Bela
Jacobabad
ShuikarpurSukkar
Khairpurlarkana
Sarah
Naushehro FirozDadu
NawabshahSanghar
Tandu Adam
Hyderabad PithoroKhokhropar
Thatta
Sonmiami
Mirpur SakroJati
BadinMithi
DiploNagar Parkar
Umarkot
Drosh
Chaman
Chilas
Pidi Bhatt
Samundari
Kalabagh
Kati Bandar
Hoshab
Lachi
Figure 7.3.2 Highway Improvement and Widening Plan
Improvement / Widening of Highway
4 lane Highway
2lane Road

Pakistan Transport Plan Study in the Islamic Republic of Pakistan (PTPS)
7-14
7.3.3 Cross River Development
The density of bridges over the vast network of rivers in Punjab could be considered, to be low for such a populous area by any standards. This is particularly true for the river Indus. In order to improve the cross-river interaction of communities for more balanced regional growth and increased flow of goods, WB is currently studying nine candidate locations to select four sites for new bridges. In addition provincial authorities have also indicative plans to enhance cross-river community interaction by proposing nine bridges in Punjab province for implementation in the medium to long term future.
Islamabad
Lahore
Peshawar
Quetta
Karachi
Chitral
Dir
saidu
Mardan
Dasu
ManasehraHavelian
Parachinar
ThalKohat
DadarKagan
Madyan
Kalam
Barenis
Gujar Khan
J helum
Gujrat
Gujranwala
SialkotShakar
Phalia
Chakwar
J and
Miran Shah
Wana TankKulachi
Lakki
Karak
MianwaliJ auharabad
Sargodha
ChiniotFaisalabad
KasurJ hang
BhakkarDera Ismail Khan
Zhob
Musa Khel BazarShorkot Okara
Pakpattan
BahawalnagarVihari
KhanewalMultan
Fort AbbasBahawalpur
Ahmadpur EastLiaquatpur
KhanpurRaimyar Khan
Mailsi
Kot Addu
Qamr ud Dim Kerez
Qila Saifullah
LoralaiZiaratPishin
Marnai DukiKohlu
MawandTalhKahan
Dera Bugti
Dera Murad J amali
Sibi
Panjpai
Kalat
Nushki
Khuzdar
Wad
Besima
Kharan
DalbadinNok KundiKuh i Taftan
Surab
Nag
WashukQila Ladgashi
PnajgurParom
MandTurbat
J iwaniGwadar Pasni Ormara
Awaran
Uthal
Bela
J acobabadShuikarpurSukkarKhairpurlarkana
SarahNaushehro FirozDadu
NawabshahSanghar
Tandu Adam
Hyderabad PithoroKhokhropar
Thatta
Sonmiami
J atiBadin Mithi
Diplo Nagar Parkar
Umarkot
Drosh
Chaman
Chilas
Samundari
Kalabagh
Kati Bandar
Hoshab
Lachi
Figure 7.3.3 Existing and Proposed Bridges
No. of Bridges
Existing 48
Planned 17

Pakistan Transport Plan Study in the Islamic Republic of Pakistan (PTPS)
7-15
7.3.4 Bypass Schemes
(1) Needs of Bypass
Most medium to small cities of Pakistan have developed along the major arterial roads. In almost all cases the development has been gradual from small town to large town, and medium size city to large city, just growing totally unplanned as ribbon development. The increase in road space has hardly kept pace with the growth in communities. To alleviate the traffic congestion, bypass schemes have been implemented in a number of cities, and numerous new schemes have been planned. The densities of by passes in the figure below illustrate the insatiable need for such highway schemes. This is also considered a quick fix to major traffic problems.
Proposed by PTPSExisting as of Dec. 2005
Islamabad
Lahore
Peshawar
Quetta
Karachi
Chitral
Dir
saidu
Mardan
Dasu
ManasehraHavelianParachinar
ThalKohat
DadarKagan
Madyan
Kalam
Barenis
Gujar Khan
J helum
Gujrat
Gujranwala
SialkotShaka
Phalia
Chakwar
J and
Miran Shah
Wana TankKulachi
Lakki
Karak
MianwaliJ auharabad
Sargodha
ChiniotFaisalabad
KasurJ hang
BhakkarDera Ismail Khan
Zhob
Musa Khel BazarShorkot Okara
Pakpattan
BahawalnagarVihari
KhanewalMultan
Fort AbbasBahawalpur
Ahmadpur EastLiaquatpur
KhanpurRaimyar Khan
Mailsi
Kot Addu
Qamr ud Dim Kerez
Qila Saifullah
LoralaiZiaratPishin
Marnai DukiKohlu
MawandTalhKahan
Dera Bugti
Dera Murad J amali
Sibi
Panjpai
Kalat
Nushki
Khuzdar
Wad
Besima
Kharan
DalbadinNok KundiKuh i Taftan
Surab
Nag
WashukQila Ladgashi
PnajgurParom
MandTurbat
J iwaniGwadar Pasni Ormara
Awaran
Uthal
Bela
J acobabadShuikarpurSukkarKhairpurlarkana
SarahNaushehro FirozDadu
NawabshahSanghar
Tandu Adam
Hyderabad PithoroKhokhropar
Thatta
Sonmiami
J atiBadin Mithi
DiploNagar Parkar
Umarkot
Drosh
Chaman
Chilas
Samundari
Kalabagh
Kati Bandar
Hoshab
Lachi
Figure 7.3.4 Location of Existing and Proposed Bypasses
No. of Cities
National Highway Provincial Highway
Existing 61 4
Proposed 26 9
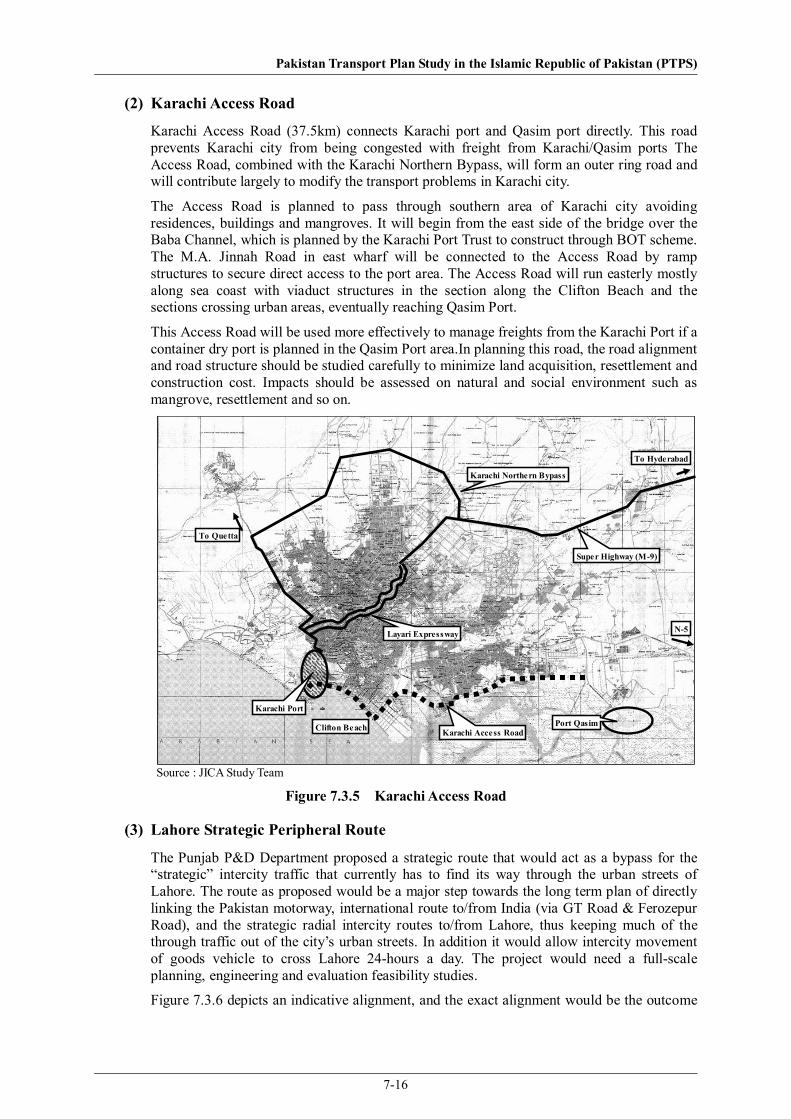
Pakistan Transport Plan Study in the Islamic Republic of Pakistan (PTPS)
7-16
(2) Karachi Access Road
Karachi Access Road (37.5km) connects Karachi port and Qasim port directly. This road prevents Karachi city from being congested with freight from Karachi/Qasim ports The Access Road, combined with the Karachi Northern Bypass, will form an outer ring road and will contribute largely to modify the transport problems in Karachi city.
The Access Road is planned to pass through southern area of Karachi city avoiding residences, buildings and mangroves. It will begin from the east side of the bridge over the Baba Channel, which is planned by the Karachi Port Trust to construct through BOT scheme. The M.A. Jinnah Road in east wharf will be connected to the Access Road by ramp structures to secure direct access to the port area. The Access Road will run easterly mostly along sea coast with viaduct structures in the section along the Clifton Beach and the sections crossing urban areas, eventually reaching Qasim Port.
This Access Road will be used more effectively to manage freights from the Karachi Port if a container dry port is planned in the Qasim Port area.In planning this road, the road alignment and road structure should be studied carefully to minimize land acquisition, resettlement and construction cost. Impacts should be assessed on natural and social environment such as mangrove, resettlement and so on.
Port Qasim
Super Highway (M-9)
N-5
To Hyderabad
Karachi Northern Bypass
To Quetta
Layari Expressway
Karachi Access Road
Karachi Port
Clifton Beach
Source : JICA Study Team
Figure 7.3.5 Karachi Access Road
(3) Lahore Strategic Peripheral Route
The Punjab P&D Department proposed a strategic route that would act as a bypass for the “strategic” intercity traffic that currently has to find its way through the urban streets of Lahore. The route as proposed would be a major step towards the long term plan of directly linking the Pakistan motorway, international route to/from India (via GT Road & Ferozepur Road), and the strategic radial intercity routes to/from Lahore, thus keeping much of the through traffic out of the city’s urban streets. In addition it would allow intercity movement of goods vehicle to cross Lahore 24-hours a day. The project would need a full-scale planning, engineering and evaluation feasibility studies.
Figure 7.3.6 depicts an indicative alignment, and the exact alignment would be the outcome

Pakistan Transport Plan Study in the Islamic Republic of Pakistan (PTPS)
7-17
of a comprehensive feasibility study. Table 7.3.1 gives the indicative costs and phased development programme for the entire route. These costs are based on the ultimate design of a motorway standard dual-3 road, with grade separated interchanges. However, it could be built in phases, where section C and D could be built as dual-2 and later expanded to be dual-3, when the dual section is near capacity.
Figure 7.3.6 Location Map of Lahore Strategic Peripheral Route
South-West Section ‘A’ (Length ~18 km)
This approximately 18km section would provide a direct link from Multan Road with Ferozepur road. In addition it would also intercept other major radial routes (Raiwind road) and a number of key local radial roads. This section would also enhance the accessibility of the fastest growing medium to high income urban area of Lahore.
It would have four major interchanges, including three where it crosses major intercity roads: Multan Road, Raiwind Road and Ferozepur Road. Seven other major links of carriageway width of 30 to 50 meters have been proposed in the City Master Plan, which would cross the proposed alignment. Some of these roads are currently under construction as the area is being developed by public and private entrepreneurs
South-East Section ‘B’ (Length ~22 km)
This section is between Ferozepur Road and G.T. Road. Both of these roads are expected to have direct links to India and are being upgraded to dual-3 lane configuration to carry the expected heavy demand. Other intercity routes that would have interchanges include: Harike Road and Bedian Road. Areas close to Ferozepur Road and G.T. Road are mostly industrial and low income housing. The central part would pass through the low density, high income and high vehicle ownership area of Defense Housing. This section would also have direct access route to Lahore International Airport and the current dryport of Mughalpura.

Pakistan Transport Plan Study in the Islamic Republic of Pakistan (PTPS)
7-18
This section is proposed to have three major interchanges, and may include additional access and egress ramps for radial routes. This section is intended to be the second major phase of the project, after the completion of Phase I.
West South-West Section ‘C’ (Length 22 km)
This section on the west side of the Ravi River is considered to be third priority section. It would stat form Faizpur Interchange on Lahore Bypass (M2) to Multan Road on the east side of Ravi, passing through Nankana District via Sharqpur Town area. This section is considered important, because Multan Road section between Shahpur Interchange and Defense Road has commercial landuse on both sides and is already congested.
This section would therefore also act as a bypass for through traffic currently using Multan road and Bund road between Niaz beg and M2 Ravi Bridge. This section would need a new dual-3 bridge over River Ravi, and interchanges at Multan Road, M2 and one for local area of Sharqpur.
North-Eastern Section ‘D’ (Length 22 km)
This section is considered to be of lowest priority, as the immediate hinterland is mostly flood plain and it is not planned for development in the near to medium term future. Therefore it placed in Phase IV of the entire route development programme. This section would provide a direct route from G.T Road in the east to N5 and M2 in the north at Kala Shah Kaku.
In the long term this section would relieve the pressure on the remainder of the peripheral route, and would be needed in the long term. There would be at least one interchange with access road from the Bund Road. Interchanges would be required at G.T Road and N5/Kala Shah Kaku Interchanges. A bridge over Ravi to the north is also planned, and the cost is included in the Table 7.3.2.
Table 7.3.2 Lahore Strategic Peripheral Route Development Plan
Project Phasing ( Years ) Section Length
(km) Total Cost 1 2 3 4 5 6 7
A 18 6,240 2,840 1,700 1,700 B 22 5,810 3,260 2,550 C 22 4,640 3,780 860 D 21 6,650 5,800 850 Total 83 23,340 2,840 3,260 3,780 7,500 4,250 860 850
Section A Multan Road to Ferozepur Road
Section B Ferozepur Road to G.T. Road (East)
Section C Faizpur Interchange to Multan Road via Sharqpur on the West Bank of Ravi
Section D G.T. Road East to G.T. Road West at Kala Shah Kaku, the northern section across Ravi
Sec. A – D Cost without Interchanges = 15,680
Sec. A – D Interchange Cost= 7,660 Source: Punjab Province

Pakistan Transport Plan Study in the Islamic Republic of Pakistan (PTPS)
7-19
7.3.5 Road Maintenance
This section discusses road maintenance mainly quoting the discussion from the Transport Note No. TRN-4 (World Bank, June 2005).
(1) Importance of Road Maintenance
In Pakistan, more emphasis has been placed in the past on new construction to extend the road network rather than maintaining the road infrastructure assets. The allocated fund for maintenance was always insufficient to meet the minimum level of demand from road administrators, and as the consequence, maintenance backlogs have been accumulated. The deteriorated roads cannot be brought back to the original level of service at reasonable expenditure, which leads to a need for major rehabilitation or reconstruction.
As is generally understood, postponing of road maintenance results in high direct and indirect costs. If road defects are repaired promptly, the cost is modest. The repair costs progressively rise in line with the years of neglecting of repair. If defects are neglected, an entire road section may fail completely, requiring full reconstruction at three times or more the cost of maintenance. Delayed maintenance causes indirect costs as well. It results in increased vehicle operation costs and threatened road safety.
At NHA, it is increasingly recognized that greater emphasis and more spending on road maintenance are necessary to preserve the national road infrastructure asset. A road fund was established in 2001 with the World Bank support, and NHA has increased its spending on maintenance, however, NHA should spend more to reduce the backlog of maintenance.
(2) Type of Maintenance
Road maintenance comprises “activities to keep pavement, shoulders, slopes, drainage facilities and other structures and property within the road margins as near as possible to their as-constructed or renewed condition” (Permanent International Association of Road Congress: PIARC 1994). Maintenance must be done regularly with a goal to preserve the assets, not upgrade them. It includes minor repairs and improvements to eliminate the cause of defects and to avoid excessive repetition of maintenance efforts.
For management and operational convenience, road management is generally classified as routine, periodic, or urgent.
1) Routine Maintenance
Routine maintenance aims “to ensure the daily passability and safety of existing roads in the short-run and to prevent premature deterioration of roads” (PIARC 1994), and comprises small-scale works conducted regularly. Frequency of activities varies but is generally once or more per week or month. Typical activities include roadside verge cleaning, and grass cutting, cleaning of silted ditches and culverts, patching, and potholes repair.
2) Periodic Maintenance
Periodic maintenance covers activities on a section of road at regular and relatively long intervals, aiming at preservation of the structural integrity of the road. The maintenance operations tend to be large scale, requiring specialized equipment and skilled personnel. It costs more than routine maintenance and requires specific identification and planning for implementation and often even design. Activities can be classified as preventive maintenance and include resurfacing, overlay, and pavement reconstruction. Resealing and overlay works are generally undertaken in response to measured deterioration in road conditions. Repaving is needed about every eight years.
3) Urgent Maintenance
Urgent maintenance is undertaken for repairs that cannot be foreseen but require immediate attention, such as collapsed culverts or landslides that block a road.

Pakistan Transport Plan Study in the Islamic Republic of Pakistan (PTPS)
7-20
Maintenance does not include rehabilitation, building shoulders, or widening of roads. If the sections to be rebuilt constitute more than 25 percent of the road length, the work is rehabilitation, not maintenance.
(3) Maintenance Cost
Maintenance costs vary with road condition, traffic volume, geographic location, climate conditions, work methods, technical equipment and other factors.
NHA has established a system to prepare an annual maintenance program using the World Bank’s HDM-IV. Yearly data of road condition, traffic condition, etc. are collected, by subletting the work to local consultants.
It is understood that at the provincial level, ADB is supporting the assessment of medium-term road maintenance needs with a similar approach as NHA, assessment of funding sources, and design and implementation of funding mechanism. Before establishment of the system, the worldwide routine and periodic maintenance costs data from the World Bank’s ROCKS (Road Costs Knowledge System) Database (refer to Table 7.3.3) can be referred to as a guideline for preparation of the maintenance plan. The Transport Note No. TRN-4 suggests to start assuming US$500 per kilometre per year for routine maintenance at the municipal level and US$500 – 750 per kilometre per year for maintenance at the national level.
Table 7.3.3 Worldwide Road Maintenance Cost Data – ROCKS Unit: US$/km
Work Class Work Type Predominant Work Activity Average Minimum MaximumUnsealed 2-lane Highway 1,037 277 2,027Routine Routine
Maintenance Bituminous 2-lane Highway 2,289 347 5,580Light Grading 110 51 205Grading Heavy Grading 522 323 876
Gravel Resurfacing
Regravelling 14,912 1,879 65,038
Bituminous Pavement
Fog Seal 8,946 2,805 15,783
Slurry seal 10,337 3,526 27,520Single Surface Treatment 18,876 5,295 38,607
Surface Treatment Resurfacing Double Surface Treatment 27,502 10,684 45,277
Asphalt Overlay ‹ 40 mm 41,676 12,878 82,320
Periodic
Asphalt Mix Resurfacing Asphalt Overlay 40-59 mm 68,070 21,021 126,131
Source: World Bank’s ROCKS Website
In developed countries, it is said that a budget equivalent to 2-2.5 percent of the value of road infrastructure should be dedicated to road maintenance each year in order to maintain an optimum level of service. However, the actual expenditure does not reach this level even in the developed countries. According to the recent survey conducted in several European Union countries, the UK makes the largest investment, but it is about 1.8 percent of the total network value.
In Pakistan, the appropriate investment level for road maintenance should be determined through accumulation of its own data and analysis, and maintenance criteria should be determined.
In order to address the under-financing problem of road maintenance, the Government of Pakistan has started an off-budget financing arrangement by establishing a road fund called Road Maintenance Account. The NHA has introduced a fee-for-service concept on the national highways. Toll revenues and receipts from all sources specifically earmarked for road maintenance are channelled through the road fund. However, NHA still has difficulty to secure the required fund for road maintenance.
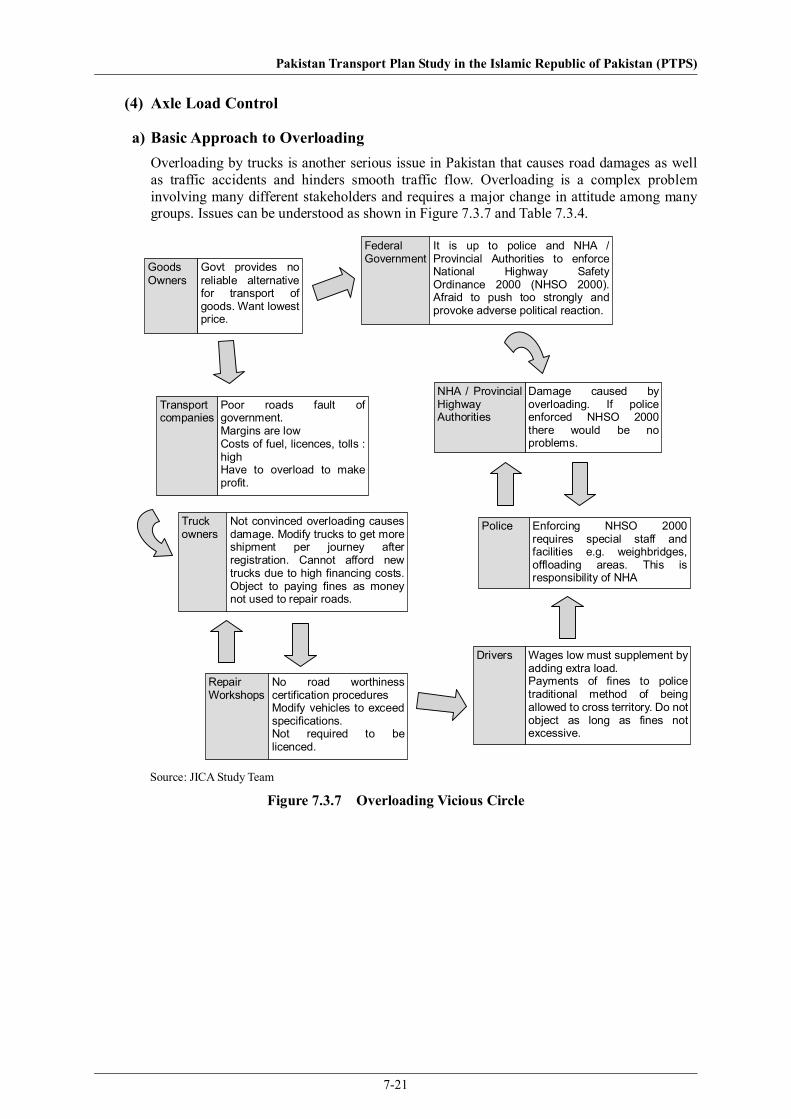
Pakistan Transport Plan Study in the Islamic Republic of Pakistan (PTPS)
7-21
(4) Axle Load Control
a) Basic Approach to Overloading Overloading by trucks is another serious issue in Pakistan that causes road damages as well as traffic accidents and hinders smooth traffic flow. Overloading is a complex problem involving many different stakeholders and requires a major change in attitude among many groups. Issues can be understood as shown in Figure 7.3.7 and Table 7.3.4.
Goods Owners
It is up to police and NHA / Provincial Authorities to enforce National Highway Safety Ordinance 2000 (NHSO 2000). Afraid to push too strongly and provoke adverse political reaction.
Federal Government
Govt provides no reliable alternative for transport of goods. Want lowest price.
Poor roads fault of government. Margins are low Costs of fuel, licences, tolls : high Have to overload to make profit.
Transport companies
Wages low must supplement by adding extra load. Payments of fines to police traditional method of being allowed to cross territory. Do not object as long as fines not excessive.
Drivers
Damage caused by overloading. If police enforced NHSO 2000 there would be no problems.
NHA / Provincial Highway Authorities
Not convinced overloading causes damage. Modify trucks to get more shipment per journey after registration. Cannot afford new trucks due to high financing costs. Object to paying fines as money not used to repair roads.
Truck owners
Enforcing NHSO 2000 requires special staff and facilities e.g. weighbridges, offloading areas. This is responsibility of NHA
Police
No road worthiness certification procedures Modify vehicles to exceed specifications. Not required to be licenced.
Repair Workshops
Source: JICA Study Team
Figure 7.3.7 Overloading Vicious Circle

Pakistan Transport Plan Study in the Islamic Republic of Pakistan (PTPS)
7-22
Table 7.3.4 Overloading Vicious Circle
Stakeholder Responsibility Attitude & Status Action Required
Goods Owners Pay for shipment of goods
Complain there is no reliable alternative for transport of goods. Want lowest price.
Consider alternative transport of goods e.g. railways.
Transport companies
Service providers
Consider poor condition of roads to be fault of poor design / construction by government. Complain margins are so low and costs of fuel, licenses, tolls, protection money so high they have to overload to make profit.
Transport companies to be registered. Use only registered vehicles.
Truck owners Compelled by law to register trucks.
Not convinced overloading causes damage. Modify trucks to get more shipment per journey after registration. Cannot afford new trucks due to high financing costs. Object to paying fines as money not used to repair roads.
Register trucks, maintain annual licences and road worthiness certificates. Employ qualified drivers and check their credentials. Pay fair wages to drivers.
Drivers Drive trucks and deliver goods.
Wages are so low must supplement by adding extra load sometimes unknown to owner. Consider payments of fines to police traditional method of being allowed to cross-territory. They are unaware of laws. Do not object as long as fines not excessive.
Extra training for drivers. Risk loss of license if break regulations.
Federal Government
Legal Regulations. Passed National Highway Safety Ordinance 2000 (NHSO 2000)
It is up to police and MOC / Provincial Authorities to enforce laws. Afraid to push too strongly and provoke adverse political reaction.
Improve alternatives for goods transport e.g. railways, containers.Provide soft loans to transporters for new vehicles. Set up central authority to regulate road transport sector. Centralizes licensing procedures
NHA / Provincial Communications, Works and Services Departments
Construct and maintain roads
Overloading causes damage. If police enforced NHSO 2000 there would be no problems.
Enforce registration of vehicles. Enforce Road worthiness certification process.
Police – Highway Police, traffic police and regular police are very different bodies.
To enforce NHSO 2000
Enforcing NHSO 2000 requires special staff and facilities e.g. weighbridges, offloading areas. This is responsibility of police, NHA and provincial authorities.
Enforce NHSO 2000 with special staff, weighbridges, offloading areas in collaboration with NHA et al. Set up central registry of offenders. Suspend licenses of habitual offenders.
Repair Workshops
Modify vehicles to exceed specifications. Not required to be licensed.
As there are no real roadworthiness certification procedures not concerned.
Only modify vehicles in accordance with regulations on roadworthiness certifications. Failure to do so results in loss of licenses.
Source: JICA Study Team

Pakistan Transport Plan Study in the Islamic Republic of Pakistan (PTPS)
7-23
b) Supporting Projects Overloading is a complex problem involving many different stakeholders. It is a longstanding traditional practice and requires a major change in attitudes among many groups.
Active Steps Required:
Effective registration of vehicles with the government
New vehicles are legally required to be registered. This registration procedure must include the use and capabilities of the vehicle, e.g. number of persons permitted to be carried on a passenger vehicle, or tare weight and permitted load weight on a commercial vehicle. This data should be recorded on the registration documents and shown on a plate attached to the vehicle.
Transporters to be required to keep records of goods shipped
Transporters should be required to keep records of manifests giving details of good moved and produce these if demanded to show they are operating within legal limits.
Road worthiness test centres to check for vehicle modifications to chassis and load bearing capacities
Vehicles are often modified after registration with strengthened chassis and larger vehicle bodies, but brakes are not improved. Commercial vehicles are required to obtain fitness certificates from the Motor Vehicle Inspection (MVI) Branch of the Police every 6 months under the West Pakistan Motor Vehicle Ordinance 1965. This test should be used to detect modified vehicles and if detected they should be required to reregister.
Weighbridges and inspectors for checking of laden/unladen weight, mechanical fitness, tyre pressure permits, driver’s license, registration books
Weighbridge operators are often persuaded to permit vehicle to proceed by financial inducement or intimidation as the vehicle belongs to an influential person. Weighbridges should be linked to a central registry so individual vehicles can be identified by number plates and the data once recorded cannot be tampered with to avoid prosecution.
Training for drivers in maintenance, understanding of traffic laws and the need for its observance
Many drivers do not have any proper training or licenses. This needs to be rectified with checks on drivers’ credentials.
Loading capacities of trucks and trailers to be visibly marked.
This should be carried out at the registration stage and cross checked by the MVI.
Road markings and signs acknowledging low literacy rate amongst drivers
Many drivers are illiterate and cannot read road signs. Symbols which are internationally recognized and easily understood should be adopted.

Pakistan Transport Plan Study in the Islamic Republic of Pakistan (PTPS)
7-24
Transport companies given soft loans to purchase modern trucks.
Loans for vehicles are currently given at extortionate interest rates and this is cited as a reason for not replacing old vehicles. Viable loans could be offered linked to companies and drivers performance.
Promoting use of containers to prevent open body trucks “overloading by volume”
Encouragement of the use of containers to replace the old open topped Bedford trucks would enforce a height restriction on vehicles.
Trucking business being under the control of a single ministry
Fragmentation of responsibility and authority is an issue. A single authority controlling all roads would preclude this.
Regulations governing truck repair workshops
Repair shops regularly modify trucks outside their design parameters. Workshops preparing vehicles for the MVI inspection should be licensed and checked.
Training of regular police in traffic issues
Traffic police have just been established in Islamabad. Some 200 police officers have been trained in traffic management issues by the Motorway Police and commenced operation in December 2005. However they only control the Capital Area. Similar units should be created in all major cities and their authority eventually extended to all roads.
Coordination between all stakeholders to implement requirements of National Highways Safety Ordinance 2000
It is noted that on 23.11.2005 a meeting was held in the Federal Ministry of Communications, attended by all the provincial highway departments, at which all these issues were discussed. Implementation plans were put forward and it now remains to be seen if the necessary finances are made available.
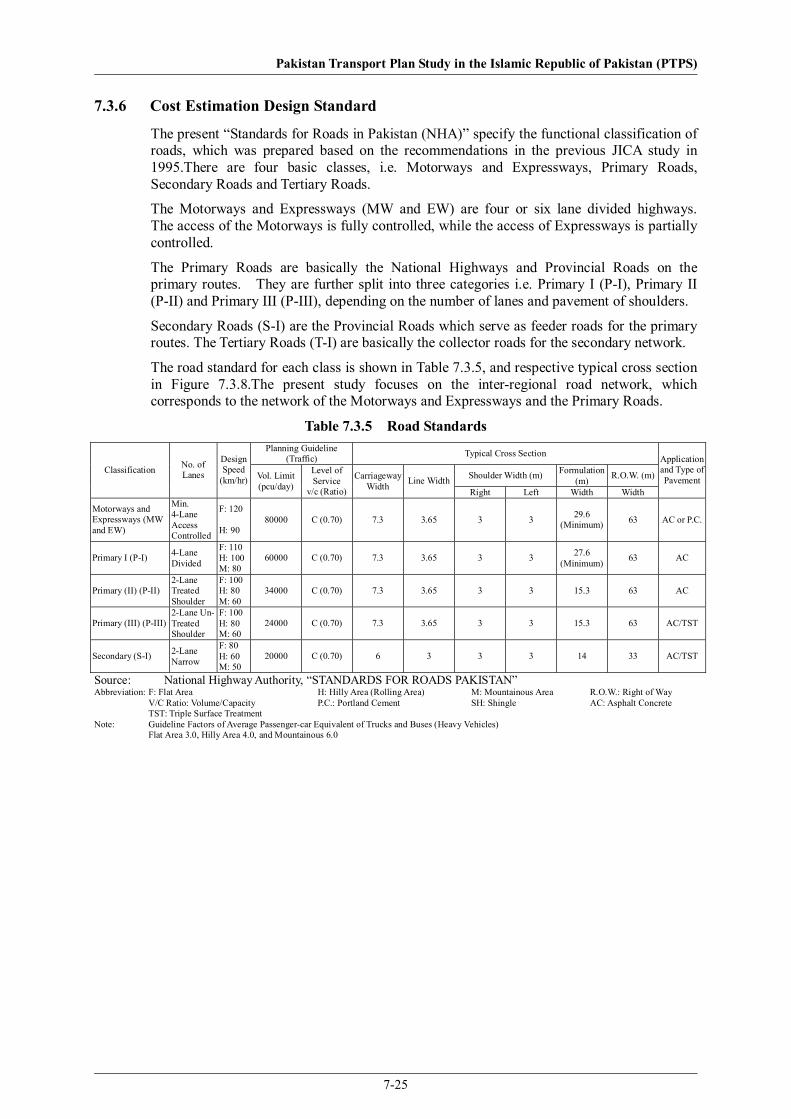
Pakistan Transport Plan Study in the Islamic Republic of Pakistan (PTPS)
7-25
7.3.6 Cost Estimation Design Standard
The present “Standards for Roads in Pakistan (NHA)” specify the functional classification of roads, which was prepared based on the recommendations in the previous JICA study in 1995.There are four basic classes, i.e. Motorways and Expressways, Primary Roads, Secondary Roads and Tertiary Roads.
The Motorways and Expressways (MW and EW) are four or six lane divided highways. The access of the Motorways is fully controlled, while the access of Expressways is partially controlled.
The Primary Roads are basically the National Highways and Provincial Roads on the primary routes. They are further split into three categories i.e. Primary I (P-I), Primary II (P-II) and Primary III (P-III), depending on the number of lanes and pavement of shoulders.
Secondary Roads (S-I) are the Provincial Roads which serve as feeder roads for the primary routes. The Tertiary Roads (T-I) are basically the collector roads for the secondary network.
The road standard for each class is shown in Table 7.3.5, and respective typical cross section in Figure 7.3.8.The present study focuses on the inter-regional road network, which corresponds to the network of the Motorways and Expressways and the Primary Roads.
Table 7.3.5 Road Standards Planning Guideline
(Traffic) Typical Cross Section
Shoulder Width (m) Formulation (m) R.O.W. (m)Classification No. of
Lanes
Design Speed
(km/hr) Vol. Limit (pcu/day)
Level of Service
v/c (Ratio)
Carriageway Width Line Width
Right Left Width Width
Application and Type of Pavement
Motorways and Expressways (MW and EW)
Min. 4-Lane Access Controlled
F: 120 H: 90
80000 C (0.70) 7.3 3.65 3 3 29.6 (Minimum) 63 AC or P.C.
Primary I (P-I) 4-Lane Divided
F: 110H: 100M: 80
60000 C (0.70) 7.3 3.65 3 3 27.6 (Minimum) 63 AC
Primary (II) (P-II) 2-Lane Treated Shoulder
F: 100H: 80 M: 60
34000 C (0.70) 7.3 3.65 3 3 15.3 63 AC
Primary (III) (P-III) 2-Lane Un- Treated Shoulder
F: 100H: 80 M: 60
24000 C (0.70) 7.3 3.65 3 3 15.3 63 AC/TST
Secondary (S-I) 2-Lane Narrow
F: 80 H: 60 M: 50
20000 C (0.70) 6 3 3 3 14 33 AC/TST
Source: National Highway Authority, “STANDARDS FOR ROADS PAKISTAN” Abbreviation: F: Flat Area H: Hilly Area (Rolling Area) M: Mountainous Area R.O.W.: Right of Way V/C Ratio: Volume/Capacity P.C.: Portland Cement SH: Shingle AC: Asphalt Concrete TST: Triple Surface Treatment Note: Guideline Factors of Average Passenger-car Equivalent of Trucks and Buses (Heavy Vehicles) Flat Area 3.0, Hilly Area 4.0, and Mountainous 6.0

Pakistan Transport Plan Study in the Islamic Republic of Pakistan (PTPS)
7-26
AC Pavement (t=50mm*2=100mm)
Base Course (t=150mm)
Sub-base Course (t=300mm)
1000
29600
Motoreway & Expressway
CL
40007300
36503650
30004000 7300
3650 3650
3000 1000
AC Pavement (t=50mm*2=100mm)
Base Course (t=150mm)
Sub-base Course (t=300mm)
1000
Primary - I
27600
4000730036503650
400036503650
7300 20002000 1000
CL
AC Pavement (t=50mm*2=100mm)
Base Course (t=150mm)
Sub-base Course (t=300mm)
1000
Primary - II15300
40004000 730036503650
CL
Primary - III
Surface Treatment
15300
7300
Sub-base Course (t=300mm)
Base Course (t=150mm)
AC Pavement (t=50mm*2=100mm)
1000
1000 3000 1000300036503650
LC
Figure 7.3.8 Typical Cross Sections
7.3.7 Cost Estimation
(1) Road Infrastructure
Construction costs of newly proposed projects were estimated by the following method, which was used in the previous JICA study. Per kilometre construction cost was inflated based on comparison of the unit rates of major work items between two points of time, i.e. 1994 in the previous study and 2005 in the present study, based on the following conditions:
• Typical cross section for each class is as explained in 6.3.6. Since there is no significant difference in the road standard and cross sections from those assumed in the previous study, per kilometre quantities of major work items are considered to remain unchanged.
• Pavement thickness selection was also referred to the result of the previous study which calculated the thickness of each layer in accordance with Road Notes 29 and 31 and referring to the AASHTO method. The following grouping of design traffic expressed in cumulative number of standard axles also referred to the previous study.

Pakistan Transport Plan Study in the Islamic Republic of Pakistan (PTPS)
7-27
Table 7.3.6 Category of Cumulative Standard Axles Group Cumulative Number of Standard Axles
for 10 years (in million) A - 0.1 B 0.1 - 1.0 C 1.0 - 6.0 D 6.0 - 10.0 E 10.0 - 40.0 F 40.0 -
Source: JICA Study Team
The present unit rates of major work items were obtained from NHA. Table 7.3.7 shows a comparison of the unit rates consisting of labor, materials and equipment costs plus overhead and profit between 1994 and 2005. The 2005 rates are 0.9 and 3.6 times higher than the 1994 rates.
Table 7.3.7 Comparison of Unit Rates (Unit Rs.)
2005 Province Item Unit 1994Balochistan Punjab Sind NWFT
Estimation of this study
Ratio2005/1994
Earth Work Clearing/Grubbing m2 6 9.40 9.30 9.40 9.27 9 1.50 Embankment (Common Ex.) m3 123 146.08 144.14 145.04 144.28 145 1.18 (Rock Ex.) m3 - 353.50 349.91 351.89 349.94 351 - (Borrow Ex.) m3 120 157.12 155.13 159.17 155.17 157 1.31 Cutting (Common) m3 47 102.51 101.03 101.54 101.46 102 2.17 (Rock) m3 74 271.07 265.87 268.16 266.36 268 3.62 Pavement Wearing Course (Ac) m3 3758 6,149.57 6,179.06 6,147.67 6,045.42 6,130 1.63 Tack Coat m2 12 11.25 11.81 11.05 11.79 11 0.92 Prime Coat m2 33 29.24 28.64 28.75 28.46 29 0.88 Base Course (Agg.) m3 517 810.33 914.71 872.08 777.35 844 1.63 Sub Base (Agg.) m3 353 645.37 705.51 689.19 543.20 646 1.83 D. Surface Treatment m2 113 111.76 114.91 110.99 112.70 113 1.00 T. Surface Treatment m2 84 135.43 139.60 134.67 136.54 137 1.63 AC Base m3 3,180 5,434.23 5,482.24 5,440.85 5,346.47 5,426 1.71 Drainage/Structures Ls/km *1 *1.5 1.50Bridges m2 *0.18 Safety/Traffic Facilities Ls/km *0.5 *0.75 1.50Note :*indicate million Rs. Source :National Highway Authority (NHA), 2005 http://www.nha.gov.pk/Info/Csr.asp
Per kilometre construction cost was calculated based on the sum of the inflated cost of earthworks, pavement works, minor bridge/structure works and safety facilities, added by general items cost (5-10%) and physical contingency (10-15%). The estimated per kilometre costs for new roads and improvement categories of projects are shown in Table 7.3.8 and Table 7.3.9.
Construction costs of long bridges over the Indus River and its tributaries and viaducts were estimated separately.
The project costs were estimated as the sum of construction cost, engineering cost (assumed

Pakistan Transport Plan Study in the Islamic Republic of Pakistan (PTPS)
7-28
10% of construction cost), land acquisition and compensation cost and administration cost (assumed to be 2% of construction cost).
Table 7.3.8 Per Kilometer Construction Cost for New Roads (Million Rs./km)
Classification of Highways/Roads Items MW and EW P-I P-II P-III S-I Clearing/Grubbing 0.30 0.30 0.18 0.18 0.17 Earth Work 12.18 9.74 5.90 5.90 5.31 Pavement C.S. AXLES-C 6.82 C.S. AXLES-D 7.96 7.94 7.12 C.S. AXLES-E 20.61 19.78 11.36 11.34 10.01 C.S. AXLES-F 28.72 28.39 15.67 15.64 Drainage/Structures 3.00 3.00 1.50 1.50 1.50 Safety/Traffic Facilities 1.50 1.50 0.75 0.75 0.75 Total C.S. AXLES-C 16.73 C.S. AXLES-D 18.74 18.72 17.07 C.S. AXLES-E 46.99 39.47 22.65 22.63 20.40 C.S. AXLES-F 57.13 49.37 27.60 27.57 Source: JICA Study Team, based on the previous JICA study in 1995 Note: The above figures are in case of flat terrain. These figures are multiplied by 1.70 and 2.30 are in case of rolling and mountainous terrain.
Table 7.3.9 Construction Cost per Kilometre for Road Improvement
Group Classification Design ClassExit.-Prop.
C. Standard Axles
Unit Cost (Rs Million/km)
E 35.40 F 46.53 PII-PI
Mean 40.97 E 35.66 F 46.79 PIII-PI
Mean 41.22 E 35.91 F 47.05
Construction Due to Capacity Deficiency
Duel Carriageway/ Widening and Rehabilitation
SI-PI Mean 41.48
Source: JICA Study Team, based on the previous JICA study in 1995 Note: The above figures are in case of flat terrain. These figures are multiplied by 1.15 and 1.30 are in case of rolling and mountainous terrain.
(2) Vehicle Fleet
As has been estimated in Chapter 3.5, about 700,000 new buses and 1.6 million new trucks will have to be introduced over 20 years (2005/06 – 20025/26). The total procurement cost of these vehicles is estimated at about Rs. 5,517 billion.

Pakistan Transport Plan Study in the Islamic Republic of Pakistan (PTPS)
7-29
7.4 Master Plan Projects 7.4.1 Candidate Projects
(1) New Projects in MTDF
All the new projects in MTDF1 other than on-going and committed projects should be included in the Master Plan. There are 54 projects in this group, consisting of 5 motorway projects, 12 bridge projects, 4 bypass projects, 2 tunnel projects, and others. The total project cost is estimated at about Rs. 330 billion.
The new projects in MTDF are listed in Table 7.4.1, and Figure 7.4.1 shows the location of these projects.
700
450
830
460
510
810
610
350
640
340
380
840
620
370
600
566
580
360
660
390
520
630
420
590
590
860
400
850
310
890
410
330
497496
495
494493
491
492
870
820
680
661
335
420
570
420Bridge, Tunnel, Urban
Road
Source: JICA Study Team (Projects were mapped from the MTDF lists.)
Figure 7.4.1 Location of New Projects in the MTDF
1 The project list of road in MTDF was updated several times. JICA Study Team could not follow all the changes. The projects in “New Projects in MTDF” include such projects once listed in project lists of old version but excluded from the later version.

Pakistan Transport Plan Study in the Islamic Republic of Pakistan (PTPS)
7-30
Table 7.4.1 List of New Projects in MTDF No. Name1) Type2) Cost 310 Improvement of Quetta Western Bypass I 225.5 340 Five Bridges on Gilgit Skardu Road, S-1 N 214.7 350 Noshki- Dalbadin Section (165 Km) (N 40) Balochistan I 1,986.0 360 Jhalkhad- Chillas Road (63 Km) N-15 I 1,827.3 370 KKH-Skardu Road S-1 (167 Km) I 4,000.0 380 Ghaggar Phatak Bridge to Kotri N-5 N 2,850.0 390 Jand-Kohat National Highway N-80 (46 Km) I 1,000.0 400 Link Road from M-1 GT Road to Hazara Road Bypassing Hassanabdal N 500.0 335 Bridge over River Indus at Larkana N 2,500.0 410 Dhakpattan Bridge (P.M directive) N 520.0 415 Dadu Ratodero (150 Km) Fence+Ser. Rd N-55 I 3,750.0 330 Bridge over River Indus at Chund (Riwaz) N 700.0420 Other Projects (Interchanges on M-2,Urban Areas Development etc) N 3,000.0 450 Widening & Improvement of Hosahb-Nag-Bsima Surab (459 Km) I, W 12,100.0 460 Karachi-Hub-Dureji-Kakar Motorway (M-7) 270 Km N 18,000.0 491 Bridge between Kotri Bridge and Sajjawal Bridge N 2,500.0 492 Bridge between Kotri Bridge and Dadu Moro N 2,500.0493 Bridge between Kandhkot and Ghotki N 2,500.0494 Ravi cum Road bridge over Indus linking Chachran with Mithanokot N 2,500.0495 Bridge over Indus linking Taunsa and Leiah N 2,500.0496 Bridge over Indus at Kalur Kot N 2,500.0497 Bridge over Indus linking Mianwali with Isa Khel N 2,500.0500 ITS & Corridor Management along the Corridor 6,000.0 830 Ratodero-Rajanpur Motorway Section (M-6), 270 Km N 21,600.0 520 N-5 (Gujranwala-Kharian-Sara e Alamghir, 98 Km) service road along with fence I 4,200.0 600 Lakpass-Noshki Section (120 Km), N-40 I, W 3,600.0 640 Improvemant of N-65 Quetta- Dhadhar Section (127 Km) I, W 6,350.0 580 National Highway N-45 (Chakdara-Dir, Kalkatak- Chitral) 120 Km I, W 6,000.0 590 Murree- Kohala-Muzaffarabad-Chakothi (S-2)Road N-75, 120 Km I, W 6,000.0 610 Hydrabad-Khokhrapar (222 Km) I, W 8,880.0 620 Chakdara- Kalam Road (130 Km) I, W 6,500.0 630 Khwaza Khela- Besham Road (66Km) I, W 3,300.0 690 Ratodero-Sehwan (200 Km) N-55 I, W 6,000.0 660 N-70 (D.G Khan-Sakhi Sarwar-Bewata, 165km) incl. Ghazi Ghat Bridge. I, W 6,200.0 680 Bridge over River Indus at Khushalgrah (N-80) N 3,500.0 700 Rehab/Improv/Widening of KKH (Mansehra-Khunjarab, 712km) I, W 18,500.0 810 Faisalabad-Multan Motorway M-4 N 22,080.0 820 Periodic Overlay on M2 & Realignment of Slat Range I 11,840.0 510 Khanewal-Lodharan-Uch Sharif-Mithankot-Rajanpur Motorway M-5 N 42,000.0 840 Karachi-Hyderabad Motorway M-9 (136km) W 7,000.0 850 Peshawar Northern Bypass (26km) N 3,078.1 860 Rawalpindi Bypass (28km) & Tarnol Interchange N-5 N 3,489.1 870 Lakpass Tunnel (N-25) N 570.5 890 Shahdara Flyover N-5 N 4,500.01) Names are not necessarily the same as indicated in MTDF. 2) I: Improvement, N: Construction, W: Widening, D: Dualization Source: MTDF, NHA, JICA Study Team

Pakistan Transport Plan Study in the Islamic Republic of Pakistan (PTPS)
7-31
(2) Proposed Projects in PTPS
For network development, PTPS proposes new motorways, dualization of provincial highways, new bridges on major rivers, and new bypass roads at major cities other than those included in MTDF. This involves nine motorways at a total cost of Rs. 183.7 billion, 23 provincial road projects at Rs. 516.8 billion, 19 bypass projects at Rs. 45.5 billion, and 11 bridges at Rs. 12.1 billion. In addition to these projects, port access roads in Karachi, the second Kohat Tunnel and other highway projects are proposed. The total cost of the proposed projects in PTPS is estimated at about Rs. 830 billion.
The projects are listed in Table 7.4.2 and the location is indicated in Figure 7.4.2. The costs were estimated based on unit costs calculated in Chapter 6.4.2.
955
990
905
915
974
951
910
925
920
956
987 958
945
900
957
972
986940
930 954
985
952935
973
901
971
1002
975
967
981
953
966
980
983
982
964969
968
963
962
961
330
Bridge, Tunnel, Urban
Road
Note: Locations of bypass projects are excluded. Source: JICA Study Team
Figure 7.4.2 Location of Proposed Projects in PTPS

Pakistan Transport Plan Study in the Islamic Republic of Pakistan (PTPS)
7-32
Table 7.4.2 List of Proposed Projects in PTPS Code Name Type Cost
Motorways 951 M11 (Chakwal – Shorkot, 289km, 4-lane) N 29,645 952 M12 (Lahore – Faisalabad, 137km, 4-lane) N 8,673 953 M13 (Lahore – Sialkot, 136km, 6-lane) N 12,575 954 M14 (Sialkot – Bhatian, 180km, 4-lane) N 11,395 955 M15 (Quetta – Khuzdar, 327km, 4-lane) N 32,143 956 M16 (Hyderabad – Ratodero, 287km, 6-lane) N 29,336 957 M17 (Bargah – Rajanpur, 280km, 4 lanes) N 20,526 958 M18 (Khairgarh Fort – Shorkot, 276km, 4-lane) N 20,273 959 M19 (Khuzdar – Bela, 228km, 4-lane) N 19,087
Sub-total 183,653 Highways
985 N55 Dualization (Kohat – D.I.Khan) W 14,230986 N55 Dualization (D.I.Khan – D.G.Khan) W 9,600987 N55 Dualization (Rajanpur – Ratodero) W 11,630959 N55 (Dadu - Kotri) 4-lane W 10,000 974 N65 Dualization I 23,6451002 Lahore Peripheral Road N 24,299
Sub-total 93,404 Tunnel
655 Second Kohat Tunnel N 6,000 Sub-total 6,000 Bridges
961 Bridge on River Chanab at Garh Maharaja, District Jang N 1,000 962 Bridge on River Sultaj to link Chistan Burewala Road N 500 963 Bridge on River Chanab near Head Mohammadwala N 600964 Jhelum, Gatalian Mirpur Bridge N 1,250 330 Bridge on River Chanab at Chund N 700966 Bridge on River Ravi near Qutab Shahara N 500 967 Bridge on River Ravi at Syedwala N 600968 6-Lane Bridge (4-lanes for roadway and two lanes for LRT Lahore – Shahdrah) N 950969 Victoria Bridge Linking Malikwal - Pind Dadan Khan. N 1,000 982 Bridge on River Indus (Khanote – Hala old) N 2,500 983 Bridge on River Indus (Dault pur – Shehwan) N 2,500
Sub-total 16,360 Port Access Road
981 Karachi Port Access I 15,000 980 Qashim Port Access I 3,878
Sub-total 18,878 Improvement/ Construction of Provincial Roads
900 Punjab East-West Corridor- 1 (Sheikhpura - Mianwali) I 55,068 915 Punjab North-South Corridor- 1 (Chakwal - Muzaffaragarh) I 70,122 905 Punjab East-West Corridor- 2 (Kasur - Bhakkar) I 60,618 910 Punjab East-West Corridor- 3 (Sulemanki - Multan) I 69,420 935 Sialkot – Sheikhupura – Sialkot Road I 14,838 945 Lahore – Jaranwala – Faisalabad (Bypass) – Jhang Road I 31,770 940 Fasalabad – Samundari – kacha Khu Road I 22,818 925 Punjab North-South Corridor-2 (Mianwali – Muzaffaragarh) I 11,232 930 Sialkot – Wazirabad – Pindi Bhattan Road I 24,648 920 Bahawalpur – Bahawal Nagar – Sulemanki Road I 34,722 971 Pind D. Khan – Jhelum Road W 4,462 972 Hyderabad – Badin – Thatta W 11,048 975 Lower Topa – Mansehra Road I 11,616 973 Mianwali – Shakardarra – Lachi Road W 6,517 990 Sindh Coastal Highway C 20,309
Sub-total 454,586Source: JICA Study Team
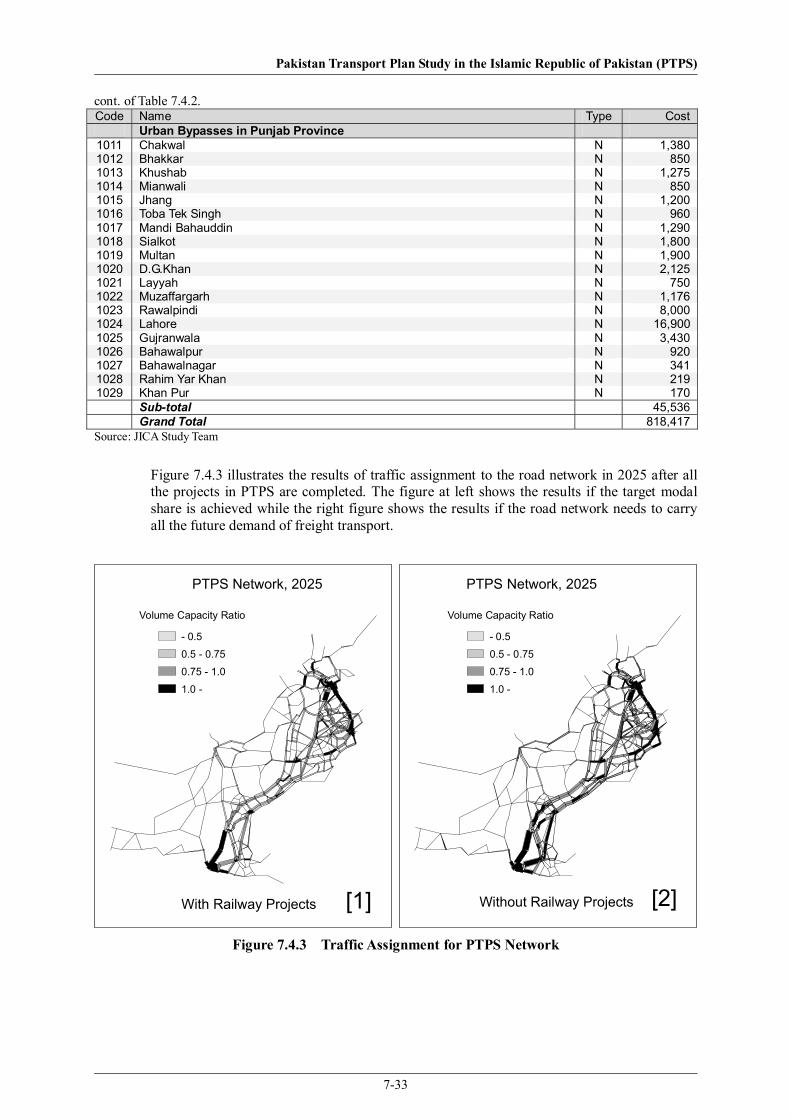
Pakistan Transport Plan Study in the Islamic Republic of Pakistan (PTPS)
7-33
cont. of Table 7.4.2. Code Name Type Cost
Urban Bypasses in Punjab Province 1011 Chakwal N 1,380 1012 Bhakkar N 850 1013 Khushab N 1,275 1014 Mianwali N 850 1015 Jhang N 1,200 1016 Toba Tek Singh N 960 1017 Mandi Bahauddin N 1,290 1018 Sialkot N 1,800 1019 Multan N 1,900 1020 D.G.Khan N 2,125 1021 Layyah N 750 1022 Muzaffargarh N 1,176 1023 Rawalpindi N 8,000 1024 Lahore N 16,900 1025 Gujranwala N 3,430 1026 Bahawalpur N 920 1027 Bahawalnagar N 341 1028 Rahim Yar Khan N 219 1029 Khan Pur N 170
Sub-total 45,536 Grand Total 818,417
Source: JICA Study Team
Figure 7.4.3 illustrates the results of traffic assignment to the road network in 2025 after all the projects in PTPS are completed. The figure at left shows the results if the target modal share is achieved while the right figure shows the results if the road network needs to carry all the future demand of freight transport.
Volume Capacity Ratio
- 0.5
0.5 - 0.75
0.75 - 1.0
1.0 -
Volume Capacity Ratio
- 0.5
0.5 - 0.75
0.75 - 1.0
1.0 -
PTPS Network, 2025 PTPS Network, 2025
[1] [2]With Railway Projects Without Railway Projects
Figure 7.4.3 Traffic Assignment for PTPS Network
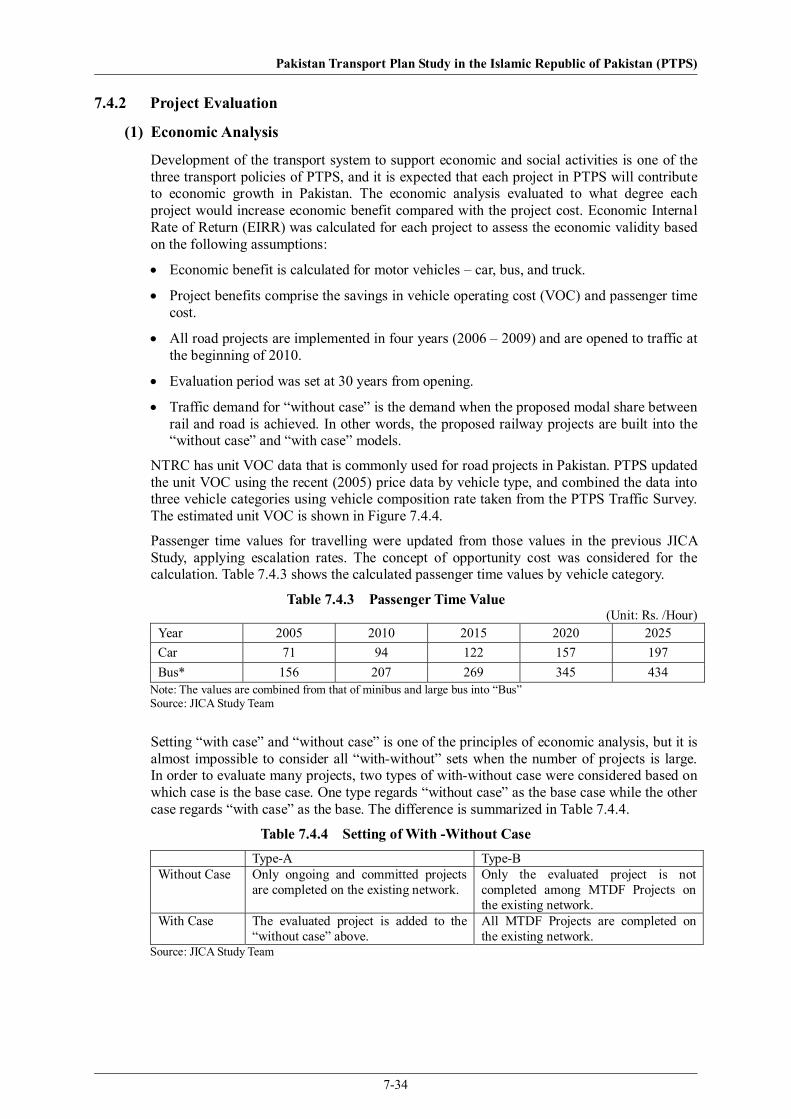
Pakistan Transport Plan Study in the Islamic Republic of Pakistan (PTPS)
7-34
7.4.2 Project Evaluation
(1) Economic Analysis
Development of the transport system to support economic and social activities is one of the three transport policies of PTPS, and it is expected that each project in PTPS will contribute to economic growth in Pakistan. The economic analysis evaluated to what degree each project would increase economic benefit compared with the project cost. Economic Internal Rate of Return (EIRR) was calculated for each project to assess the economic validity based on the following assumptions:
• Economic benefit is calculated for motor vehicles – car, bus, and truck.
• Project benefits comprise the savings in vehicle operating cost (VOC) and passenger time cost.
• All road projects are implemented in four years (2006 – 2009) and are opened to traffic at the beginning of 2010.
• Evaluation period was set at 30 years from opening.
• Traffic demand for “without case” is the demand when the proposed modal share between rail and road is achieved. In other words, the proposed railway projects are built into the “without case” and “with case” models.
NTRC has unit VOC data that is commonly used for road projects in Pakistan. PTPS updated the unit VOC using the recent (2005) price data by vehicle type, and combined the data into three vehicle categories using vehicle composition rate taken from the PTPS Traffic Survey. The estimated unit VOC is shown in Figure 7.4.4.
Passenger time values for travelling were updated from those values in the previous JICA Study, applying escalation rates. The concept of opportunity cost was considered for the calculation. Table 7.4.3 shows the calculated passenger time values by vehicle category.
Table 7.4.3 Passenger Time Value (Unit: Rs. /Hour)
Year 2005 2010 2015 2020 2025 Car 71 94 122 157 197 Bus* 156 207 269 345 434
Note: The values are combined from that of minibus and large bus into “Bus” Source: JICA Study Team
Setting “with case” and “without case” is one of the principles of economic analysis, but it is almost impossible to consider all “with-without” sets when the number of projects is large. In order to evaluate many projects, two types of with-without case were considered based on which case is the base case. One type regards “without case” as the base case while the other case regards “with case” as the base. The difference is summarized in Table 7.4.4.
Table 7.4.4 Setting of With -Without Case Type-A Type-B Without Case Only ongoing and committed projects
are completed on the existing network. Only the evaluated project is not completed among MTDF Projects on the existing network.
With Case The evaluated project is added to the “without case” above.
All MTDF Projects are completed on the existing network.
Source: JICA Study Team

Pakistan Transport Plan Study in the Islamic Republic of Pakistan (PTPS)
7-35
Car
0.00
2.004.006.00
8.0010.00
12.0014.00
10 20 30 40 50 60 70 80 90 100
Vehicle Speed (km/hour)
Very good Fair Very BadRs./km
VOC (Rs./km)
Speed Very Fair Verykm/hr Good Bad
10 11.44 11.56 12.7420 7.58 7.71 8.8030 6.06 6.19 7.2540 5.25 5.39 6.4650 4.83 4.98 6.1260 4.68 4.85 6.1070 4.75 4.93 6.3480 5.01 5.20 6.8390 5.43 5.64 7.55
100 6.03 6.25 8.47VOC by speed by road condition
Bus
0.00
10.00
20.00
30.00
40.00
50.00
10 20 30 40 50 60 70 80 90 100
Vehicle Speed (km/hour)
Very good Fair Very BadRs./km
VOC (Rs./km)
Speed Very Fair Verykm/hr Good Bad
10 33.67 35.29 43.2820 22.61 24.23 31.8730 18.32 19.94 27.3940 16.02 17.66 25.0650 14.74 16.41 23.9060 14.12 15.83 23.5770 14.03 15.78 23.9180 14.38 16.17 24.8490 15.11 16.97 26.33
100 16.21 18.13 28.33VOC by speed by road condition
Truck
0.00
5.00
10.00
15.00
20.00
10 20 30 40 50 60 70 80 90 100
Vehicle Speed (km/hour)
Very good Fair Very BadRs./km
VOC (Rs./km)
Speed Very Fair Verykm/hr Good Bad
10 13.86 14.16 17.4220 9.43 9.73 12.4330 7.45 7.76 10.0540 6.33 6.65 8.6850 5.74 6.08 8.0060 5.57 5.93 7.8870 5.76 6.15 8.2980 6.29 6.72 9.1890 7.14 7.61 10.56
100 8.31 8.82 12.40VOC by speed by road condition
Source: JICA Study Team
Figure 7.4.4 Vehicle Operating Cost (Economic) by Vehicle Type by Road Condition

Pakistan Transport Plan Study in the Islamic Republic of Pakistan (PTPS)
7-36
(2) Evaluated Projects
A number of traffic assignments were carried out based on the PTPS traffic model (refer to Chapter 4) to calculate the total VOC and the total travel time by vehicle category for each with case and the without case. Since the model was designed to calculate inter-district traffic volume, it is difficult or impossible to estimate intra-district or urban traffic. Therefore, traffic assignment has not been carried out for some projects such as bypass projects and small projects.
Table 7.4.5 shows the list of projects for traffic assignments. Some small projects were combined into other projects. For example, Khushalgarh Bridge project and Jand-Kohat Road project were combined into one project because the access road (Jand-Kohat) should only be improved together with construction of the Khushalgar Bridge. In addition to the individual projects, traffic assignment was carried out for the MTDF road network and the PTPS road network.

Pakistan Transport Plan Study in the Islamic Republic of Pakistan (PTPS)
7-37
Table 7.4.5 List of Road Projects for Traffic Assignment
Code Name Cost Rs.Million Mark*
335 Bridge over River Indus at Larkana 2500.0 M 350 Noshki-Dalbadin Section (165km) (N40), Balochistan 1986.0 M 380 N5: Ghaggar Phatak Bridge-Kotri 2850.0 M 450 Widening & Improvement of Hosahb-Nag-Bsima-Surab (459km) 12100.0 M 460 M-7 (Karachi-Hub-Dureji-Kakar Motorway) 270km 18000.0 M 492 Bridge, San-Sakarand 2500.0 M 493 Bridge (Khandhkot-Ghotki) 2500.0 M 494 Ravi cum Road Bridge (Chachran-Mithankot) 2500.0 M 495 Bridge (Taunsa-Leiah) 2500.0 M 496* Bridge (Kalur Kot ) & Access Road (50km) 3500.0 M 510 M-5 (Khanewal-Lodharan-Uch Sharif-Mithankot-Rajanpur) 42000.0 M 580 N-45 (Chakdara-Dir, Kahkatak-Chitral) 120km 6000.0 M 590 Muree-Kohala-Muzaffarabad-Chakothi (S-2), N-75 6000.0 M 600 Lakpass-Noshki (120km) 3600.0 M 610 Hyderabad-Khokhrapar (222km) 8880.0 M 631 Khwaza Khela-Besham, Chakdara-Kalam Road (630+620) 9800.0 M 640 Improvement of N-65 Quetta-Dhadhar Section (127km) 6350.0 M 655 2nd Kohat Tonnel project 7755.0 P 660 Muzaffargarh-D.G.Khan-Sakhi Sarwar-Bewata Section N70(165km) 6200.0 M 681 Khushalgarh & Jand-Kohat Road (680+390) 4500.0 M 700 KKH 18500.0 M 810 Faisalabad-Multan Motorway M-4 22080.0 M 830 M-6 21600.0 M 840 M-9 7000.0 M 900 Panjab East-West Corridor-1 (Sheikhpura-Mianwali Road) 55068.0 P 901 Mianwali-Lakki Road (973+497) 9016.6 P 905 Punjab East-West Corridor-2 (Kasur, Okara, Jhang, Bhakkar) 60618.0 P 910 Punjab East-West Corridor-3 (Head Sulemanki - Sultan Multan) 69420.0 P 915 Punjab North-South Corridor-1 (Chakwal-Khusab-Muzaffaragarh) 70122.0 P 920 Bahawalpur, Bahawal Nagar Sulemanki Road 34722.0 P 925 Punjab North-South Corridor-2 (Mianwali-Muzaffaragarh) 11232.0 P 930 Sialkot Wazirabad Pindi Bhattian Road 24648.0 P 935 Sialkot Gujranwala Sheikhupura Road 14838.0 P 940 Faisalabad, Samundari, Kacha Khu Road 22818.0 P 945 Lahore Jaranwala Faisalabad (Bypass) Jhang Road 31770.0 P 951 M11 29644.5 P 952 M12 8673.0 P 953 M13 12574.6 P 954 M14 11395.3 P 955 M15 51229.5 P 956 M16 29336.2 P 957 M17 20526.0 P 958 M18 20272.9 P 959 M08 10000.0 P
960 Bridge: Garh Maharaja-Shorkot, Chistian-Burewala, Head Mohammadwala, Lahore (961+962+963+330+967+968+969+966) 5350.0 P
971 Pind D.Khan-Jhelum (4-Lane) 4462 P 972 Hyderabad-Badin-Thatta (4-Lane) 11048.3 P 973 Mianwali-Shakardarra-Lachi 6516.6 P 974 N65 Dualization 23644.6 P 975 Lower Topa-Mansera Road 11616 P Note : * M – MTDF Projects, P – PTPS Projects : MTDF Road Network consists of existing road, on-going, committed, and MTDF Projects. : PTPS Road Network consists of MTDF Road Network + PTPS Projects. Source: JICA Study Team

Pakistan Transport Plan Study in the Islamic Republic of Pakistan (PTPS)
7-38
(3) Economic Indicators
EIRR was calculated as well as Benefit-Cost Ratio (B/Cs) and Net Present Value (NPV) for road projects at a discount rate of 12% as shown in Table 7.4.6. Since each project was evaluated on the assumption that no other new projects would be carried out, it should be noted that the calculated values of EIRR is different from the EIRR values when each project is evaluated individually based on different assumptions for the “without-case”.
Major points of the result are:
• M-7 (construction) shows a high EIRR at 52.3% and the largest NPV.
• Similarly, M9 (widening) shows a high EIRR at 35.3% and large NPV.
• Among the bridge projects over the Indus River, the Khushalgarh Bridge has the highest EIRR at 22.1%.
• Dualization projects of provincial roads have low EIRRs, except for Mianwali- Muzaffaragarh Road.
• Among the new motorway projects, M-16 shows high performance with EIRR at 23.0% and high NPV, as does the M-8 (M-19) project.
• M-11 and M-17 have EIRR near 15% and barely positive NPV.
• Motorway projects having low EIRR are M-11, M-12, M-14, M-15, and M-17.
• M-5, whose project cost is high at Rs. 42 billion, shows low EIRR
• KKH, whose traffic demand is small, shows low EIRR.
• Hosahb-Nag-Bsima Surab Road, where traffic demand is small and the project is not expected to increase traffic volume, shows very small B/C at 0.2.
Viewpoints for priority setting may be drawn from those points.
• M-7 and other projects having high EIRR such as bridge projects should be carried out in the MTDF period. Since some bridges compete with each other, it is necessary to consider the combination of the projects.
• Several MTDF Projects are not economically feasible, and some of them can be carried out after the MTDF period. However, most of such projects have strategic importance for regional development. Therefore, it is necessary to evaluate these projects against other criteria.
• On the other hand, several PTPS Projects that are economically feasible (e.g. 2nd Kohat Tunnel Project) should be candidates for short-term projects.
• Project costs for dualization of provincial roads are expensive compared to the economic benefit. It is necessary to divide the projects into several components so that the projects can be realized in a staged manner.

Pakistan Transport Plan Study in the Islamic Republic of Pakistan (PTPS)
7-39
Table 7.4.6 Calculation of Economic Indicators Type-A* Type-B*
Code Name1) EIRR %
B/C NPV Rs. Million
EIRR %
335 Bridge over Indus (Larkana) 13.3 1.2 402 22.9350 N40 (Noshki-Dalbadiin) 22.0 2.9 3,299 22.2380 N5 (Ghaggar Phatak Bridge-Kotri) 47.1 21.0 50,409 23.4450 Hosahb-Nag-Bsima Surab -2.7 0.2 -8,983 2.4460 M-7 (Karachi-Hub-Dureji-Kakar) 52.3 13.8 203,738 55.5492 Bridge, Sansakarand 16.3 1.6 1,332 21.1493 Bridge (Khandhkot-Ghotki) 6.7 0.5 -1,050 21.8494 Ravi cum Road Bridge (Chachran-Mithankot) 17.8 1.7 1,504 26.1495 Bridge (Taunsa-Leiah) 13.3 1.1 313 19.8496 Bridge (Kalur Kot ) & Access Road (50km) 8.7 0.7 -951 13.3510 M-5 (Khanewal-Lodharan-Rajanpur) 7.9 0.6 -14,137 13.2580 N-45 (Chakdara-Dir, Kahkatak-Chitral) 3.1 0.4 -3,243 13.5600 N-75 Muree-Kohala-Muzaffarabad-Chakothi 4.8 0.5 -1,640 18.5610 Hyderabad-Khokhrapar 3.6 0.4 -4,973 11.3
630+ Khwaza Khela-Besham, Chakdara-Kalam Rd. 7.8 0.6 -3,222 12.8640 N-65 Quetta-Dhadhar Section -2.6 0.2 -4,742 12.1660 N-70 (Muzaffargarh -Bewata) 6.5 0.6 -2,471 13.2681 Khushalgarh Bridge & Jand-Kohat Road 22.1 2.7 6,690 27.6690 N55, Ratodero – Sehwan 15.4 1.5 2,590 33.3700 KKH 0.8 0.2 -12,584 5.0810 Faisalabad-Multan Motorway M-4 15.6 1.5 8,964 20.6830 M-6 15.3 1.5 9,453 26.9840 M-9 35.3 8.8 48,259 12.7655 2nd Kohat Tonnel project 11.3 0.9 -557 900 Sheikhpura-Mianwali Road 3.0 0.3 -34,025 901 Mianwali-Lakki Road 5.0 0.5 -3,997 905 Kasur, Okara, Jhang, Bhakkar 2.8 0.3 -37,759 910 Head Sulemanki – Sultan Multan -2.5 0.2 -52,032 915 Chakwal-Khusab-Muzaffaragarh 2.6 0.3 -41,634 920 Bahawalpur, Bahawal Nagar Sulemanki Road 4.6 0.4 -19,415 925 Mianwali-Muzaffaragarh 15.7 1.5 4,658 930 Sialkot Wazirabad Pindi Bhattian Road -4.6 0.1 -18,856 935 Sialkot Gujranwala Sheikhupura Road N.A. 0.0 -12,872 940 Faisalabad, Samundari, Kacha Khu Road 8.8 0.7 -6,236 945 Lahore Jaranwala Faisalabad Jhang Road 3.7 0.4 -18,358 951 M11 6.3 0.5 -12,734 952 M12 8.1 0.6 -2,770 953 M13 11.5 0.9 -749 954 M14 1.1 0.2 -7,908 955 M15 N.A. 0.0 -45,185 956 M16 23.0 2.9 50,372 957 M17 8.2 0.6 -7,263 958 M18 11.6 1.0 -859 959 M8 27.1 4.5 30,767 960 7-Bridges 27.1 4.0 14,163 971 Pind D. Khan – Jhelum (4-Lane) 13.4 1.2 696 972 Hyderabad-Badin-Thatta (4-Lane) 8.9 0.7 -3,401 973 Mianwali – Shakardarra – Lachi 12.8 1.1 492 974 N65 Dualization -13.6 0.1 -19,223 975 Lower Topa-Mansera Road -1.4 0.2 -8,120 980 Qasim Port Access 17.6 1.9 631
These PTPS
Projects were not evaluated because
With-Case of Type B consists of only MTDF
Projects and no PTPS
Projects are
included.
Name1): Some names are shorten from the original names in accordance with the width of the column. Type-A: Without Case = Existing Network + Ongoing & Committed Projects With Case = Existing Network + Ongoing & Committed Projects + The Project for evaluation Type-B: Without Case = MTDF Network – The Project for evaluation With Case = MTDF Network Source: JICA Study Team
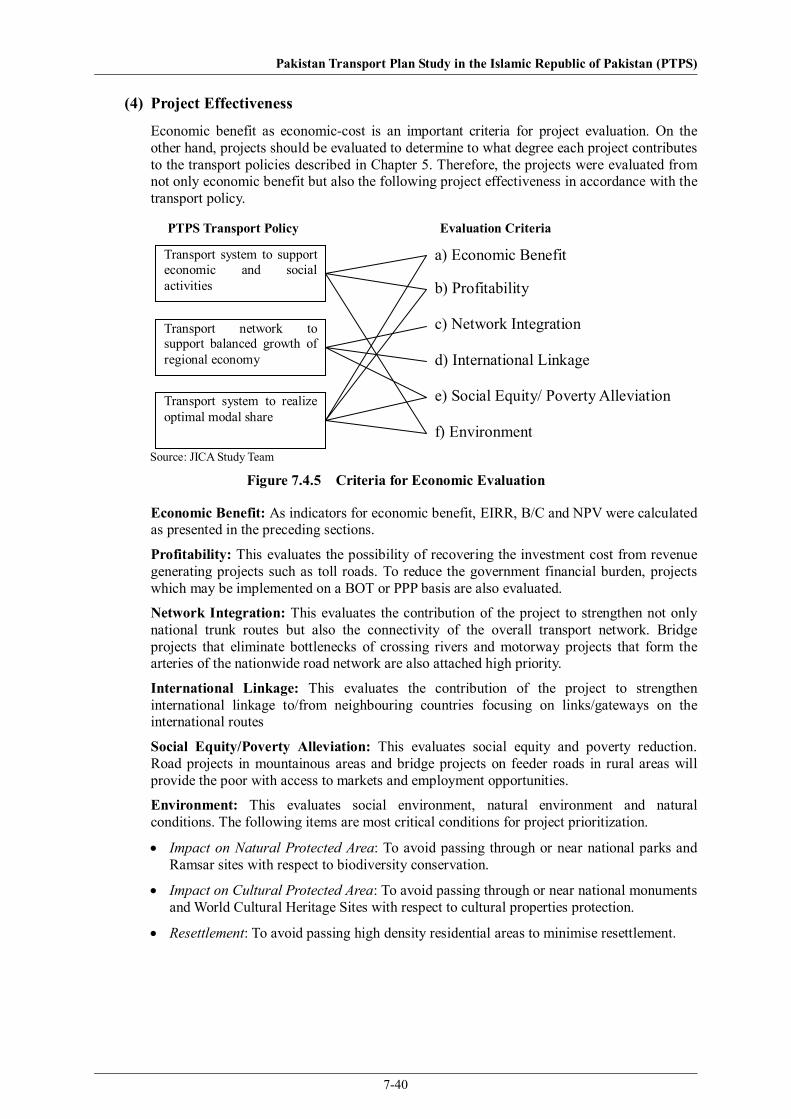
Pakistan Transport Plan Study in the Islamic Republic of Pakistan (PTPS)
7-40
(4) Project Effectiveness
Economic benefit as economic-cost is an important criteria for project evaluation. On the other hand, projects should be evaluated to determine to what degree each project contributes to the transport policies described in Chapter 5. Therefore, the projects were evaluated from not only economic benefit but also the following project effectiveness in accordance with the transport policy.
Source: JICA Study Team
Figure 7.4.5 Criteria for Economic Evaluation
Economic Benefit: As indicators for economic benefit, EIRR, B/C and NPV were calculated as presented in the preceding sections.
Profitability: This evaluates the possibility of recovering the investment cost from revenue generating projects such as toll roads. To reduce the government financial burden, projects which may be implemented on a BOT or PPP basis are also evaluated.
Network Integration: This evaluates the contribution of the project to strengthen not only national trunk routes but also the connectivity of the overall transport network. Bridge projects that eliminate bottlenecks of crossing rivers and motorway projects that form the arteries of the nationwide road network are also attached high priority.
International Linkage: This evaluates the contribution of the project to strengthen international linkage to/from neighbouring countries focusing on links/gateways on the international routes
Social Equity/Poverty Alleviation: This evaluates social equity and poverty reduction. Road projects in mountainous areas and bridge projects on feeder roads in rural areas will provide the poor with access to markets and employment opportunities.
Environment: This evaluates social environment, natural environment and natural conditions. The following items are most critical conditions for project prioritization.
• Impact on Natural Protected Area: To avoid passing through or near national parks and Ramsar sites with respect to biodiversity conservation.
• Impact on Cultural Protected Area: To avoid passing through or near national monuments and World Cultural Heritage Sites with respect to cultural properties protection.
• Resettlement: To avoid passing high density residential areas to minimise resettlement.
Transport system to support economic and social activities
Transport network to support balanced growth of regional economy
Transport system to realize optimal modal share
a) Economic Benefit
b) Profitability
c) Network Integration
d) International Linkage
e) Social Equity/ Poverty Alleviation
f) Environment
PTPS Transport Policy Evaluation Criteria

Pakistan Transport Plan Study in the Islamic Republic of Pakistan (PTPS)
7-41
(5) Rating
The proposed projects were evaluated in view of each criterion and graded in accordance with the rating shown in Table 7.4.7. EIRR is the basis for the rating of Economic Benefit Criteria. If EIRR was not calculated, the ratings of the similar projects were applied for such projects. In order to set the priority of the projects, the ratings were translated to points as shown in the “Point” column. The points were added up to calculate the total points. The results are shown in Table 7.4.8 and Table 7.4.9.
Table 7.4.7 Rating of Criteria for Project Evaluation
Criteria Rating Point1 Economic Benefit a:
b:c:d:e:
Very High (EIRR >= 40) High (40 > EIRR >= 20) Good (20 > EIRR >= 12) Acceptable Level (12 > EIRR >= 6) Low (6 > EIRR)
20 15 10 5 0
2 Profitability a:b:c:
Significant Limited None
3 1 0
3 Network Integration a:b:c:
Significant Moderate Insignificant
6 3 0
4 International Linkage a:b:c:
Strong Moderate None
6 3 0
5 Social Equity/Poverty alleviation
a:b:c:
Significant Less significant Neutral/Negative
6 3 0
6 Environment a: No expected serious adverse impacts 3 b: Expected moderate adverse impacts which require
detailed survey in F/S or design stage. 1 - Natural Protected Area
- Cultural Protected Area- Resettlement c: Expected serious impacts* 0
Note: * “Rating c” is not necessarily mean as an unacceptable project from the view of environmental conservation. These evaluations are without mitigation measures, and providing some mitigation measure may improve the project prioritization. For example “Rating c” with mitigation measures becomes “b” or “a”. Source: JICA Study Team

Pakistan Transport Plan Study in the Islamic Republic of Pakistan (PTPS)
7-42
Table 7.4.8 Evaluation of MTDF New Road Projects
NaturalProtected
Area
CulturalProtected
Area
Resettle-ment
350 N-40 (Noshki- Dalbadin Section), 165Km 1,986 b c b b a a a a 36
460 M-7 (Karachi-Hub-Dureji-Kakar) ,270Km 18,000 a a a c c b b c 31
492 Bridge between Kotri Bridge andDadu Moro 2,500 b c a c b a a b 31
840 N-9 (Karachi-Hyderabad), 136km 7,000 a a b c c a b c 30
681 Khushalgrah Bridge & Jand-KohatRoad 4,500 b b a c c a a b 29
850 Peshawar Northern Bypass (26km) 3,078 c b a b b a a c 29
310 Improvement of Quetta WesternBypass 226 c c a a b b b b 28
494 Ravi cum Road Bridge over Indus(Chachran - Mithanokot) 2,500 c c a c b a a a 28
870 Lakpass Tunnel (N-25) 567 d c a a a b a b 28
410 Dhakpattan Bridge 520 d c a a b a a b 27
520 N-5 Service Road (Gujranwala-Kharian-Sara e Alamghir Section) 4,200 b c c b b a a c 27
610 Hyderabad-Khokhrapar (222 Km) 8,880 d c b a a a a b 27
380 N-5 (Ghaggar Phatak Bridge - Kotri) 2,850 a b c c c b b a 26
496 Bridge over Indus at Kalur Kot 2,500 d c a b b a a a 26
810 M-4 (Faisalabad-Multan) 22,080 c a a b c a b c 26
890 Shahdara Flyover N-5 4,500 b b b b c a b c 26
340 Five Bridges on Gilgit Skardu Road,S-1 215 d c a c a b a a 24
450 Hosahb-Nag-Bsima Surab Road, 459Km 12,100 e c b a a a a a 24
480 Rehabilitation of 518 Km of N-5 14,610 b c c c c a a a 24
631 Khwaza Khela- Besham/ Chakdara-Kalam Road (66Km) 6,500 d c b b a a a b 24
495 Bridge over Indus linking Taunsa andLeiah 2,500 d c a c b a a a 23
690 Ratodero-Sehwan (200 Km) N-55 6,000 c c b c b a a b 23
860 Rawalpindi Bypass (28km) & TarnolInterchange N-5 3,489 c b b b c a a c 23
360 N-15 (Jhalkhad- Chillas Road), 63Km 1,827 e c a b a b a a 22
500 Intelligent Transportation System(ITS) Corridor Management 6,000 c c b c c a a a 22
335 Bridge over River Indus at Larkana 2,500 c c a c c b a b 21
400 Hassanabdal Bypass 500 c c a c c a b b 21
491 Bridge between Kotri Bridge andSajjawal Bridge 2,500 d c a c b b a a 21
493 Bridge between Kandhkot and Ghotki 2,500 e c a b b a a a 21
600 Lakpass-Noshki Section (120 Km), N-40 3,600 e c b b a a a a 21
700 KKH (Mansehra-Khunjarab), 712 Km 18,500 e c b a a c a a 21
580 N-45 (Chakdara-Dir, Kalkatak-Chitral), 120 Km 6,000 e c b a a a b c 19
370 KKH-Skardu Road S-1, 167 Km 4,000 e c b c a a a a 18
510 M-5 (Khanewal-Lodharan-Uch Sharif-Mithankot-Rajanpur) 42,000 d c a c c a a c 17
420 Other Projects (ICs on M-2,UrbanArea Development etc) 3,000 c c b c c b b b 16
660 N-70 (D.G Khan-Sakhi Sarwar-Bewata) & Ghazi Ghat Bridge. 6,200 e c a c b a a b 16
640 Improvemant of N-65 Quetta-Dhadhar Section (127 Km) 6,350 e c b b a b b b 15
820 Periodic Overlay on M2 &Realignment of Slat Range 11,840 e b c c c a a a 10
TotalScore
(points)
Project Evaluation and RatingEnvironment
EconomicIndicator
NetworkIntegration
InternationalLinkage
Social/Equity/Poverty
ProfitabilityID Project NameTotalCost
(M Rps.)
Source: JICA Study Team

Pakistan Transport Plan Study in the Islamic Republic of Pakistan (PTPS)
7-43
Table 7.4.9 Evaluation of PTPS Road Projects in Order of Total Score
NaturalProtected
Area
CulturalProtected
Area
Resettle-ment
956 M16 29,336 b a a c b a a b 34
655 2nd Kohat Tunnel Project 6,000 c c a b a a a b 32
960 7 Bridges in Panjab 700 b c a c b a a b 31
987 N-55 Dualization (Rajanpur-Ratodero) 11,630 b c b c b a a b 28
953 M13 12,575 c b a b b a b c 27
959 N55 (Dadu-Kotri) 4-lane 10,000 b c b c b a b b 26
973 Mianwali-Shakardarra Lachi 6,517 c c a c b a a b 26
957 M17 20,526 c b a c c a a b 24
901 Mianwali-Lakki Road 2,500 d c a b b b a a 24
980 Qasim Port Access 800 b c c c c a a a 24
925 Punjab North-South Corridor-2(Mianwali-Muzaffaragarh) 11,232 c c b c a b a c 23
971 Pind D. Khan-Jhelum (4-Lane) 4,462 c c b c b a a b 23
830 Ratodero-Rajanpur Motorway Section(M-6), 270 Km 21,600 c b a c c b a b 22
958 M18 20,273 c b a c c b a b 22
975 Lower Topa - Mansera Road 11,616 e c a b a a a b 22
981 Sindh Coastal Highway 20,309 e c a b a b a a 22
900 Punjab EW Corridor (Sheikhpura-Mianwali) 55,068 d c a c b a a b 21
920 Bahawalpur-Bahawal Nagar-Sulemanki Road 34,720 e c b a a b a b 20
910 Punjab EW Corridor (H. Sulemanki -Pak Pattan-Vehari-Multan) 69,420 e c b a b a a c 18
986 N-55 Dualization (D.I.Khan-D.G.Khan) 9,600 d c b c b a a b 18
940 Faisalabad, Samundari, Kacha KhuRoad 22,820 d c b c b a a c 17
951 M11 29,645 d b a c c b a b 17
952 M12 8,673 d b a c c a b c 16
905 Punjab EW Corridor(Kasur-Okara-Jhang-Bhakkar) 60,620 d c b c b a b c 15
945 Lahore Jaranwala Faisalabad(Bypass Jhang Road 31,768 d c b c b a b c 15
955 M15 & M19 51,300 e b a a c b b c 15
954 M14 11,395 e b a c c a a c 13
985 N-55 Dualization (Kohat-D.I.Khan) 14,230 e c b c b a a b 13
915 Punjab North-South Corridor-1(Chakwal-Khushab-Muzaffaragarh) 70,122 e c b c b a a c 12
930 Sialkot-Wazirabad-Pindi BahattianRoad 24,648 e c b c b a a c 12
935 Sialkot Gujranwala SheikhupuraRoad 6,440 e c b c b a a c 12
972 Hyderabad-Badin-Thatta (4-Lane) 11,048 d c c c b b b b 11
974 Dualization of N65 23,645 e c b c b b b b 9
Project Evaluation and RatingTotalScore
(points)EconomicIndicator Profitability Network
IntegrationInternational
Linkage
Social/Equity/Poverty
EnvironmentID Project Name
TotalCost
(M Rps.)
Source: JICA Study Team

Pakistan Transport Plan Study in the Islamic Republic of Pakistan (PTPS)
7-44
7.4.3 Implementation Schedule
(1) Short-Term Projects
The Medium Term Development Framework (MTDF), including five-year investment plan for the road sector, was approved by the Government, and NHA has revised the five-year plan. The first budgetary year has started and some projects have already been commenced. Accordingly, the projects in the revised MTDF should be given high priority for the short-term plan. Meanwhile, some projects that were newly proposed in PTPS proved to be economically feasible even if they are started in the next five years, and some were given a high score in the project evaluation in 7.4.2. However, since the very new projects need several years to start, such projects should be excluded as candidates for short-term projects. Another important factor is budget constraint, because PTPS proposes to increase investment in the railway sector. Figure 7.4.6 shows the accumulated cost of new PTPS proposed projects if they are selected from the candidate project list in ranking order. The total project cost of the top 16 is less than the target investment level and these projects are proposed to be the priority projects in the short-term projects. It is recommended not to select such projects with ranking lower than 16.
0
100
200
300
400
500
600700
800
1 6 11 16 21 26 31Rank
Rs.
Bill
ion
PTPS - MTDF (excl. BOT/PPP)
PTPS (excl. BOT/PPP): Rs. 408,714 Million: Proposed resource allocation in 5 years for road sector MTDF (excl. BOT/PPP): Rs. 185,048 Million : Road Maintenance Cost Rs. 37,329 Million Source: JICA Study Team
Figure 7.4.6 Accumulated Project Cost by Ranking
(2) Mid-Term and Long-Term Projects
The remaining projects were assigned as Mid-Term Projects and Long-Term Projects considering the maturity of the projects, traffic demand, balance of budget allocation, regional balance and other factors. Table 7.4.10 shows the implementation schedule of projects for the road sector.

Pakistan Transport Plan Study in the Islamic Republic of Pakistan (PTPS)
7-45
Table 7.4.10 Implementation Schedule No Projects Estimated cost Master Plan (M/P) Beyond the M/P
(Rs. Million) 2005/06 - 2009/10 2010/11 - 2014/15 2015/16 - 2024/25 2025/26-On-going
10 Makran Coastal Road Balochistan 15,010
20 Islamabad Peshawar Motorway (M-1) 26,862
30 Pindi Bhattian Motorway (M-3) 6,877
40 Karachi Northen Bypass 2,928
50 Layari Express Way 5,081
60 Islamabad -Muzaffarabad Road 7,660
70 Indus Highway Project (Phase III) 6,557
80 Mansehra Naran Jalkhad Road (N-15) 3,821
90 Hala-Moro Section (N-5) 2,583
100 Rahim YarKhan Bahalwalpur Section N-5(166 KM) 7,283
110 Okara Bypass 3,912
120 Kharian Rawalpindi(N-5) 5,174
130 Chablat Nowshera (N-5)including flyover atNowshera Cantt 3,700
140 Lowari Tunnel & Address Road 7,984
150 Bridgr on River Jhelum at Azad Pattan AJK 71
160 Improvement of N-65 Dera Allah Yar NutalSection 771
170 Improvement of N-65 Nutal-Sibi -DhadarSection 1,710
180 Improvement of KKH (N-35) NWFP 552
190 D.I.Khan Mughal Kot Section (N-50) 1,903
200 Improvement of N-70 Qila Saifullah LoralaiBewata 2,841
210 Ratodero-Shahdakot-Khuzdar Section (M-8) 1,421
220 Gawadar -Turbat -Hoshab Section(Gawader, Khudar Road (650 km) 16,640
230 Khori-Quba Seed Khan Section 4,000
240 Realignment of N65 Near Jaccabad & DeraAllah Yar Town 478
250 Bridge over River Chenab at Shershah 1,023
260 Interchange at Khanqah Dogran on M-2 144
270 Interchange at Sial More on M-2 74
280 Rehabilitation and Widening of existingroad Lala Musa- Gulyana Thotha Rai 60
290 Nowshera-Chakdara-Dir-Chitral N-45(81Km) 1,620
300 Feasibility Studies 700
470 N-5 Rehabilitation Project 19,943
540 Kalat- Quetta-Chaman Section of N-25(247) 6,671
551 Peshawar-Torkham Dual Carriageway (46Km)
552 Malana junction- Sarai Gambila Dualization(117 Km)
553 Badabher- Dara Adam Khel, Rehab ofExisting road (28km)
554 Sarai Gambila-Bannu-Miran Shah-GhulamKhan (118km)
650 Kohat Tunnel Access Roads 6,627
670 N-25 Karao-Wad Section 2,500
12,787
Source: JICA Study Team

Pakistan Transport Plan Study in the Islamic Republic of Pakistan (PTPS)
7-46
cont. of Table 7.4.10
No Projects Estimated cost Master Plan (M/P) Beyond the M/P(Rs. Million) 2005/06 - 2009/10 2010/11 - 2014/15 2015/16 - 2024/25 2025/26-
C ommitted Projects
480 Rehabilitation of 518km of N-5 14,610
530 Gujranwala - Kharian - Sara e AlamgirSection N5, service road along with fence 6,000
561 Hub - Uthal Section N-25 (85km) 31,242
562 Multan-Muzaffargarh includingMuzaffargah Bypass (36.2km) N-70
563 Khanozai-Mughalkot Section N-50 (333km)
564 Hassanabdal-Abbottabad-Mansera SectionN-35 (90km)
565 Sukkur-Jaccobabad Section incl. ShikarpurBypass N-65 (65km)
566 Tarnol-Fatehjangh-Jand Section N-80(103km)
567 Qila Saifullah-Loralai-Wiagum Rud SectionN-70 (124km)
570 Malakand Tunnel/Bypass 6,000
MTDF New Road Projects310 Improvement of Quetta Western Bypass 226
340 Five Bridges on Gilgit Skardu Road, S-1 215
350 Noshki- Dalbadin Section (165 Km) (N 40)Balochistan 1,986
360 Jhalkhad- Chillas Road (63 Km) N-15 1,827
370 KKH-Skardu Road S-1 (167 Km) 4,000
380 Ghaggar Phatak Bridge to Kotri N-5 2,850
390 Jand-Kohat National Highway N-80 (46Km) 1,000
400 Link Road from M-1 GT Road to HazaraRoad Bypassing Hassanabdal 500
335 Bridge over River Indus at Larkana 2,500
410 Dhakpattan Bridge (P.M directive) 520
415 Dadu Ratodero (150km) Fence+Ser. Rd.N-55 3,750
420 Other Projects (Interchanges on M-2,UrbanAreas Development etc) 2,300
450 Widening & Improvement of Hosahb-Nag-Bsima Surab (459 Km) 12,100
460 Karachi-Hub-Dureji-Kakar Motorway (M-7)270 Km 18,000
491 Bridge between Kotri Bridge and SajjawalBridge 2,500
492 Bridge between Kotri Bridge and DaduMoro 2,500
493 Bridge between Kandhkot and Ghotki 2,500
494 Ravi cum Road bridge over Indus linkingChachran with Mithanokot 2,500
495 Bridge over Indus linking Taunsa and Leiah 2,500
496 Bridge over Indus at Kalur Kot 2,500
497 Bridge over Indus linking Mianwali with IsaKhel 2,500
500 ITS & Corridor Management along theCorridor 6,000
830 Ratodero-Rajanpur Motorway Section (M-6), 270 Km 21,600
520 Gujranwala - Kharian - Sara e AlamgirSection N5, service road along with fence 4,200
600 Lakpass-Noshki Section (120 Km), N-40 3,600
640 Improvemant of N-65 Quetta- DhadharSection (127 Km) 6,350
580 National Highway N-45 (Chakdara-Dir,Kalkatak- Chitral) 120 Km 6,000
Source: JICA Study Team

Pakistan Transport Plan Study in the Islamic Republic of Pakistan (PTPS)
7-47
cont. of Table 7.4.10
No Projects Estimated cost Master Plan (M/P) Beyond the M/P(Rs. Million) 2005/06 - 2009/10 2010/11 - 2014/15 2015/16 - 2024/25 2025/26-
590 Murree- Kohala-Muzaffarabad-Chakothi (S-2)Road N-75, 120 Km 6,000
610 Hydrabad-Khokhrapar (222 Km) 8,880
620 Chakdara- Kalam Road (130 Km) 6,500
630 Khwaza Khela- Besham Road (66Km) 3,300
690 Ratodero-Sehwan (200 Km) N-55 6,000
660 N-70 (D.G Khan-Sakhi Sarwar-Bewata,165km) incl. Ghazi Ghat Bridge. 6,200
680 Bridge over River Indus at Khushalgrah (N-80) 3,500
700 Rehab/Improv/Widening of KKH(Mansehra-Khunjarab, 712km) 18,500
810 Faisalabad-Multan Motorway M-4 22,080
820 Periodic Overlay on M2 & Realignment ofSlat Range 11,840
510 Khanewal-Lodharan-Uch Sharif-Mithankot-Rajanpur Motorway M-5 42,000
840 Karachi-Hyderabad Motorway M-9 (136km) 7,000
850 Peshawar Northern Bypass (26km) 3,078
860 Rawalpindi Bypass (28km) & TarnolInterchange N-5 3,489
870 Lakpass Tunnel (N-25) 571
890 Shahdara Flyover N-5 4,500
(PTPS New Addition)Motorways
951 M11 (Chakwal – Shorkot, 289km, 4-lane) 29,645
952 M12 (Lahore – Faisalabad, 137km, 4-lane) 8,673
953 M13 (Lahore – Sialkot, 136km, 6-lane) 12,575
954 M14 (Sialkot – Bhatian, 180km, 4-lane) 11,395
955 M15 (Quetta – Khuzdar, 327km, 4-lane) 32,143
956 M16 (Hyderabad – Ratodero, 287km, 6-lane) 29,336
957 M17 (Bargah – Rajanpur, 280km, 4 lanes) 20,526
958 M18 (Khairgarh Fort – Shorkot, 276km, 4-lane) 20,273
950 M19 (Khuzdar – Bela, 228km, 4-lane) 19,087
Highways
985 N55 Dualization (Kohat – D.I.Khan) 14,230
986 N55 Dualization (D.I.Khan – D.G.Khan) 9,600
987 N55 Dualization (Rajanpur – Ratodero) 11,630
959 N55 (Dadu - Kotri) 4-lane 10,000
974 N65 Dualization 23,645
1002 Lahore Peripheral Road 24,299
655 Second Kohat Tunnel 6,000
Bridges
961 Bridge on River Chanab at Garh Maharaja,District Jang 1,000
962 Bridge on River Sultaj to link ChistanBurewala Road 500
963 Bridge on River Chanab near HeadMohammadwala 600
964 Jhelum, Gatalian Mirpur Bridge 1,250 Source: JICA Study Team

Pakistan Transport Plan Study in the Islamic Republic of Pakistan (PTPS)
7-48
cont. of Table 7.4.10
No Projects Estimated cost Master Plan (M/P) Beyond the M/P(Rs. Million) 2005/06 - 2009/10 2010/11 - 2014/15 2015/16 - 2024/25 2025/26-
330 Bridge on River Chanab at Chund 700
966 Bridge on River Ravi near Qutab Shahara 2,660
967 Bridge on River Ravi at Syedwala 2,700
968 6-Lane Bridge (4-lanes for roadway andtwo lanes for LRT Lahore – Shahdrah) 950
969 Victoria Bridge Linking Malikwal - PindDadan Khan. 1,000
982 Bridge on River Indus (Khanote – Hala old) 2,500
983 Bridge on River Indus (Dault pur –Shehwan) 2,500
Port Access Road
981 Karachi Port Access 15,000
980 Qashim Port Access 3,878
Improvement/ Construction of Provincial Roads
900 Panjab East-West Corridor- 1 (Sheikhpura- Mianwali) 55,068
901 Mialnwali-Lakki Road 5,378
915 Panjab North-South Corridor- 1 (Chakwal -Muzaffaragarh) 70,122
905 Panjab East-West Corridor- 2 (Kasur -Bhakkar) 60,618
910 Panjab East-West Corridor- 3 (Sulemanki -Multan) 69,420
935 Sialkot – Sheikhupura – Sialkot Road 14,838
945 Lahore – Jaranwala – Faisalabad (Bypass)– Jhang Road 31,770
940 Fasalabad – Samundari – kacha Khu Road 22,818
925 Panjab North-South Corridor-2 (Mianwali –Muzaffaragarh) 11,232
930 Sialkot – Wazirabad – Pindi Bhattan Road 24,648
920 Bahawalpur – Bahawal Nagar – SulemankiRoad 34,722
971 Pind D. Khan – Jhelum Road 4,462
972 Hyderabad – Badin – Thatta 11,048
975 Lower Topa – Mansehra Road 11,616
973 Mianwali – Shakardarra – Lachi Road 6,517
990 Sindh Coastal Highway 20,309
Urban Bypasses in Punjab Province
1011 Chakwal 1,3801012 Bhakkar 8501013 Khushab 1,2751014 Mianwali 8501015 Jhang 1,2001016 Toba Tek Singh 9601017 Mandi Bahauddin 1,2901018 Sialkot 1,8001019 Multan 1,9001020 D.G.Khan 2,1251021 Layyah 7501022 Muzaffargarh 1,1761023 Rawalpindi 8,0001024 Lahore 16,9001025 Gujranwala 3,4301026 Bahawalpur 9201027 Bahawalnagar 3411028 Rahim Yar Khan 2191029 Khan Pur 170
Source: JICA Study Team

Pakistan Transport Plan Study in the Islamic Republic of Pakistan (PTPS)
8-1
Chapter 8. RAILWAY PLAN
8.1 Planning Approach 8.1.1 Role of Railway Transport at Present
Railway transport has a long history beginning in 1861 and has occupied a principal position in land transport in the past. Most of the passengers and freight were previously transported by rail, whereas road transport serviced only short-distance feeder transport needs and transport on routes not having enough demand to justify construction of railways.
However, transport by automobiles, having capability of door-to-door transport and time flexibility, has grown as a competitor of railway transport, and occupied a main position in land transport instead of railways. Recently, with the development of aviation, long-distance transport of high-end clients and products is shifting to air transport.
Now, road transport deals with all types of passenger and cargo including short-distance, long-distance, multi-direction and point-to-point transport. Therefore, road transport is a vital mode as a fundamental land transport means.
However, railway has the following advantages;
• “Safe, punctual, comfortable and fast” as advantages in the service aspect • “Inexpensive, low environmental impact, saving natural resources and saving space” as
advantages in the social aspect
However, railway transport units are large because trains are composed of a number of heavy vehicles. In addition, railways require independent infrastructure, operating organization and operation/maintenance staff. Therefore, railways can only provide the advantages in the social aspect for the mass transport and still be commercially viable. Additionally, railways can only provide the advantages in the service aspect after the management is in sound condition.
Therefore, the raison d’etre of railways only exists for mass transport, in which railway can exercise its advantages and be economically viable, and therein railways can survive as competitive businesses.
Besides, since railway does not have advantages such as door-to-door through transport and time flexibility, railways can not compete with automobiles at the same cost level, even though railways have the above advantages in the service aspect. This situation has been changing in the recent past, because of worsening problems with global warming due to CO2 emissions and political restrictions are imposed on. However, if transport cost is high, it is difficult to politically force shippers into shifting to railway transport.
In these days, despite the existence of highways and roads, the reason for investment in railway is to establish an efficient transport system. This system has low environmental impact and specializes in the followings;
• Middle/long-distance high-speed intercity passenger transport • Commuter transport in metropolitan regions (Remarks: Commuter transport1 in large city
areas such as Karachi and Lahore can be one of the important roles of railways, but they hardly exist at present.)
• Middle/long-distance high-speed mass freight transport as a main part of multimodal transport (Remarks: This must be direct container/bulk transport between centres. Since automobiles and trucks excel in feeder transport, normally, general cargo, which incurs expense for transhipment, is not suitable for railway transport.)
1 Commuter transport is out of scope of this Study; however, to formulate future plans on improvement and management reform of railway, this category should be taken into consideration.

Pakistan Transport Plan Study in the Islamic Republic of Pakistan (PTPS)
8-2
Accordingly, future investment in railways shall concentrate intensively on the above.
For railways as means of future land transport, the Pakistan Railways possesses good route alignments like the main line, which coincide with the principal stream of people and products, and has the advantages that land and road beds, which account for major part of the cost for the infrastructure of railways, were already constructed.
8.1.2 Profitable Market
(1) Profitability by Business Units
Notwithstanding its price competitiveness, the railway business is now losing market share year by year. It is envisaged that this may be caused by the fact that the demand for railway’s service are gradually being decreased as the rapidly developing motor transport erodes railway’s share of the transport market.
Table 8.1.1 shows the calculation of unit profits of the PR by business units.
Table 8.1.1 Unit Profits of PR by Business Units
1999/2000
2000/01
2001/02
2002/ 03
2003/ 04 Average
(A) Revenues for Passengers etc, (Rs. Million) 5,604 6,408 7,375 8,335 9,146 7,374 (B) Revenues for Freight (Rs. Million) 3,969 4,715 4,790 5,071 4,566 4,622 (C) Passenger-Kilometres (Million) 18,498 19,590 20,783 22,306 23,045 20,844(D) Ton-Kilometres (Million) 3,753 4,520 4,573 4,820 4,769 4,487 Unit Revenues (Rs.) (E)=(A)/(C) Passenger Services 0.303 0.327 0.355 0.374 0.397 0.351 (F)=(B)/(D) Freight Services 1.057 1.043 1.047 1.052 0.957 1.031 Unit Costs (Rs.) (G) Passenger Services 0.484 0.493 0.482 0.512 0.522 0.499 (H) Freight Services 0.493 0.488 0.500 0.510 0.535 0.505 Unit Profits (Rs.) (E)-(G) Passenger Services -0.181 -0.166 -0.128 -0.139 -0.125 -0.148 (F)-(H) Freight Services 0.565 0.555 0.548 0.542 0.423 0.526 Sources: Prepared by JICA Study Team with Data from P.R. Yearbook 2000/01, 2003/04
According to Table 8.1.1, the unit profits of the freight services continue to show positive figures, even though the positive figures are in decline. On the other hand, the unit profits of the passenger services continue to show negative figures. As mentioned later, the continuous losses of the passenger services are caused by the unprofitable train operations on light traffic lines (see the detailed analysis in the next section). Therefore, one of the ways for the PR to maintain profitability is to reduce the unprofitable passenger services and increase the freight services by reforming the business structure. With regards to the passenger services, it is necessary to reduce the unprofitable runs and channel the business resources into the main corridors. With regards to the freight services, it is necessary to expand the business opportunity by developing container transport services to meet the freight transport demands.

Pakistan Transport Plan Study in the Islamic Republic of Pakistan (PTPS)
8-3
(2) Unprofitable Passenger Services
The train operations with negative marginal profits (revenues - variable costs) cannot contribute to recovering the fixed costs. Therefore, the trains with negative marginal profits can be regarded as unprofitable trains.
One of the benchmarks to identify the unprofitable trains is the number of passengers or coaches per train. A necessary number of passengers per train for the positive marginal profits can be calculated by dividing the average costs per train-kilometer by the average revenues per passenger-kilometer, because it can be assumed that the revenues are in proportion to the number of passenger-kilometer, while the variable costs are in proportion to train-kilometer. Table 8.1.2 shows this calculation, based on the data from the year 2000/01 to 2003/04.
Table 8.1.2 Calculation of Necessary Number of Passengers per Train
FY Average per Year (2000/01-2003/04)
(A)Total Variable Costs Total (Millions) 10,296.9 (B)Train Kilometer (Thousands) 37,335.0 (C)=(A)/(B)Variable Costs per Train Kilometers (Rs.) 275.8 (D)Revenues from Passengers (Rs. Million) 7,815.9 (E)Passenger-Kilometer (Million) 21,430.8 (F)=(D)/(E) Unit Revenues of Passenger Services (Rs.) 0.36 (C)/(F) 756 Sources: Prepared by JICA Study Team with Data from P.R. Yearbook 2003/04
According to Table 8.1.2, in order to maintain the positive marginal profits, it is necessary to carry more than 756 passengers per train. This means that 11.7 coaches per train are needed for positive marginal profits1. Accordingly, the trains, which carry 11coaches or less, cannot contribute to recovering the fixed costs. By reducing the train operations with negative marginal profits, the PR can improve the financial status of the passenger services. Table 8.1.3 shows the comparison of the basic data between the main corridors and the other branch lines in 2003/04.
Table 8.1.3 Comparison of Basic Data of Passenger Services
Main Corridor Branch Line Total (A) Average Number of Coaches per Train 12.6 8.0 10.8 (B) Estimated Financial Status
Revenues (Rs. Million) 6,451.20 2,694.70 9,145.90 Variable Costs (Rs. Million) 5,615.50 3,679.20 9,294.70 Marginal Profits (Rs. Million) 835.7 -984.5 -148.8
Sources: Prepared by JICA Study Team
As seen in the line (A) in Table 8.1.3, the average number of coaches per train is 12.6 in the main corridor, while the average number of coaches per train is 8.0 in the other branch lines. According to the above-mentioned analysis that the trains which carry 11coaches or less cannot contribute to recovering the fixed costs, it is deemed that the train operations on the branch lines cannot contribute to making profits. The line (B) in the table shows the estimated breakdown of the financial situation of the passenger services. Therefore, it can be concluded that the PR should reduce the train operations on the branch lines and concentrate
1 In the year 2003/04, the number of passenger kilometres was 23,045 million and the number of coach
kilometres was 355.6 million. Therefore, it can be assumed that one train can carried around 65 passengers (23,045 millions / 355.6 millions = 64.8).

Pakistan Transport Plan Study in the Islamic Republic of Pakistan (PTPS)
8-4
on the passenger service on the main corridor to maintain its profitability.
On the other hand, this analysis is based on the present situation of the PR. There might be some room to reduce the necessary number of passengers or coaches for the positive marginal profits by increasing the tariff levels and/or decreasing the operation costs. Therefore, by improving the business efficiency of the passenger services, the train operations on the branch lines can also contribute to making profits.
However, as mentioned earlier, the analysis, so far, is based on the existing data. More detailed data will create more precise analysis, which leads to more useful decision making. Therefore, it is recommended to remodel the present financial systems with modern commercial accounting practice, in order to precisely grasp the financial & accounting data of the railway business.
8.1.3 Target Market
In order to make the railway competitive to other modes of transport including airlines an aggressive management improvement and a huge amount of capital investments in infrastructure improvement and development will be required. For the passenger transport it is important to factor in the “public service” components in the business plan as the railway remains a “affordable” means of mode of transport system for the country’s population, but the freight operation can maximize its advantages in services, i.e. high-speed mass freight transport and focus on the creation of profit-centres by the container and bulk traffics on the Karachi-Lahore mainline as a start.
(1) Container Transport
First, since container transport has potential demand, it is essential for the Pakistan Railways to establish a container transport system as early as possible.
In 2003/04 the number of containers handled at Karachi and Qasim Ports amounted to 1,244,000 TEUs and has grown steadily since. There were 637,000 TEUs of imported containers and 109,000 TEUs of bonded containers were transported to up-counties, and those transported by railway are only 17,000 TEUs.
The container transport system need to include the following: high power locomotives, high performance wagons, stable infrastructures, suitable container stations at the port side, modern logistic centres in the up-country side, a sophisticated operation system, a computerized sales system, etc. In order to develop container transport, a time table for train operation should be established and published in advance so that users of container trains are able to make out an accurate transport schedule. In addition, an appropriate operation adjustment system which minimizes delays is essential for freight transport as well as for passenger transport.
The Pakistan Railways offers container transport services between Karachi/Qasim ports and dry ports at Lahore, Faisalabad, Rawalpindi, Peshawar and Quetta. Dry ports in up-countries are sufficient for present needs. However, improvement and expansion of these facilities are desirable for the future development of railway container transport.
(2) Bulk Transport
It is also necessary to build a bulk transport system. The main commodity of railway bulk transport has been petroleum; however, transport of petroleum by railway will be terminated within a few years because the pipeline for petroleum transport will be commissioned. Instead of petroleum, the following commodities (coal, cement, aggregate, fertiliser and grain) will become the main commodities for railway bulk transport.

Pakistan Transport Plan Study in the Islamic Republic of Pakistan (PTPS)
8-5
8.1.4 Improvement of Management
Railways today are competitive with road transport in land transport and aviation in inland transport. Now that a limited amount of national budget will be invested in railways hereafter, the following efforts are absolutely necessary;
• Streamlining of management to win out in cost competition, and • Establishment of a management structure to demonstrate the advantages in the service
aspect.
If management, service and facilities remain inefficient and if railway loses competitiveness and can not play a role as transport means, further investment from the precious budget will come to nothing.
The Pakistan Railways has not changed its management, service, facilities and rolling stock in accordance with the change in transport structure. In addition, although unsuited business has already lost demand, insufficient management and facilities still have being preserved.
First of all, the Government of Pakistan should get back to the basics that railways exist for the purpose of transport. Railways do not exist to maintain vested interests including employment. Employment and welfare are different policies of the government. The preservation of the vested interests (of policymakers, staff and beneficiaries of welfare services) should not be the goal of policy.
The improvement of railway management is a vital condition to make investments aiming at the establishment of sustainable railway. In these days, the railway company should be managed independently and with self-responsibility under the customer-oriented management concept in a competitive environment.
Government expenditure should cover, primarily, the capital charge for infrastructure (including the cost of the maintenance backlogs from the past) based on the transport and environmental policies that determine the roles of the railways and roads in the transport system.
As for the infrastructure, railways have to be able to conduct on their own account the infrastructure management (on-ground train operation and drawing up of diagrams) and the maintenance of infrastructure, which are common to all types of transport.
Railways have to be able to conduct the following activities on their account: the purchase and maintenance of rolling stock, business activities such as train operations, sales, services for passengers and handling of cargo, railway transport business and capital charges for them. If railways are not able to provide transport service on their own account under the condition that sound and sustainable infrastructure is secured from the viewpoint of the function, maintenance level and usage cost of infrastructure, then the role of railways is deemed ended, and railways should pull out of the transport service. (It can be seen that such transport service has not reached the level of mass transport in which railway can demonstrate its advantages and road transport is able to serve as the fundamental transport mode.)
As long as railways management is self-sustaining and with self-responsibility, the fare should be decided on a commercial basis. Although the charges for freight transport is on commercial basis, that of passenger transport is regulated. If the government choose to provide transport service at a low fare as part of a welfare policy, the government should compensate for the resulting deficit as a public service obligation. In this case, the government should choose, not exclusive to railway, the optimal transport mode to accomplish the goal of the welfare policy.
Railways should abolish the obligation of cross-subsidies such as support for light-traffic lines. Since railways are not in a monopoly like the old days, cross-subsidies raise the transport cost and weaken the competitiveness of railway. Therefore, cross-subsidies should be avoided. If a line shall be maintained or newly constructed with an eye to the future under

Pakistan Transport Plan Study in the Islamic Republic of Pakistan (PTPS)
8-6
the policy target of “balanced development of the nation’s land”, not only the capital charge, but also the expenses should be paid out or compensated by the government under the policy.
8.1.5 Development of the Corridor and a High-Speed Freight Transport System
In order to increase the passenger and freight transport capacity and create profit centres it is essential to focus on the revitalization of the infrastructure on the Corridor linking Karachi to Lahore, Rawalpindi and Peshawar. The Corridor links the landlocked Punjab with the country’s international ports located in the Karachi area. The concentration of Pakistan’s population and economic, industrial, commercial and transport activities in the narrow 1,700 km corridor provides traffic densities ideal for development of high-speed freight transport services
The development of the Corridor and a high-speed freight system first on the Karachi-Lahore mainline by container and bulk transport system will, in addition to the improvement of railway infrastructure, require the procurement of a large quantity of high performance locomotives, high performance wagons and rehabilitations/expansions of container/bulk stations, logistic centres, dry ports, etc.
8.1.6 On-going and Proposed Projects
As mentioned, the Pakistan Railways has many backlogs of projects desirable to be carried out.
The Medium Term Development Framework (MTDF) 2005-10 and Public Sector Development Program (PSDP) 2005-06 list on-going projects and new projects. The total amount of budgets for the five years is Rs. 59,549 million and that for the fiscal year 2005/06 is Rs. 9,849 million. However, it is questionable whether the selected projects are to be given proper priority or not. For example, the projects for improvement and reinforcement of signalling systems are left out from the list. Recently, a serious accident occurred at Sharhad. It is the time to take up the project.
Current investment projects, on-going or proposed, are listed in Table 8.1.4, together with improvement of the signalling systems proposed by the study team.

Pakistan Transport Plan Study in the Islamic Republic of Pakistan (PTPS)
8-7
Table 8.1.4 Current Investment Projects Estimated cost (Rs. Million) No. Projects Total - 2004/05 2005/06 - Remarks
On-going M 1 P 3
Procurement/manufacture of 175 passenger coaches
7,776 5, 953 1,823
M 2 P 2
Procurement 69 DE locos
11,151 4,188 6,963
M 3 P 1
Track rehabilitation and modernization of sleeper factory
11,192 5,686 5,506
M 4 P 4
Recommissioning of 55 DE Locos 879 232 647
M 5 P 6
Replacement of breakdown cranes and procurement of relief train
(M 5)407(P 9)395
(M 5)285(P 9)285
(M 5)121 (P 9)110
M 6 P 5
1,300 high capacity wagons 5,870 1,727 4,143
M 7 P 9
Doubling of track Lodhran - Multan - Khanewal
3,297 434 2,864 Including signalling system
M 8 P 8
Rehabilitation of 450 passenger coaches
2,145 1,300 845
M 9
Other projects 148 122 26
P 7
Strengthening of bridges 112 112
P10
Underpass at Renala at railway crossing No.147
26 10 16
P11
Conversion of Mirpur Khas - Khokhropar section from metre gauge to broad gauge
1,000 300 700 In MTDF allocated as “New” (M10)
Sub total of MTDF Sub total of PSDP
42,86543,844
19,92720,227
22,937 23,617
New M10 Conversion of Mirpur Khas -
Khokhrapar section from metre gauge to broad gauge
700 300 400 In PSDP allocated as “On-going” (P11)
M11 P12
Dualization of track from Khanewal to Raiwind
5,712 5,712
M12
Dualization of track from Shahdara Bagh to Lala Musa
1,288 1,288
M13
Upgrading and improvement of track from Khampur to Lala Musa
3,500 3,500 Continued beyond 2009/10
M14
Doubling of track from Lahore to Faisalabad section
3,840 3,840
M15 Procurement/manufacture/ and assembling of 75 diesel locomotive
12,700 12,700 Continued beyond 2009/10
M16
Procurement/manufacture/ and assembly of 1,000 freight wagons
4,800 4,800 Continued beyond 2009/10
M17 Procurement/manufacture/ and assembly of 150 passenger coaches
5,977 5,977
M18
Railway yard and railway linkage from Gwadar Port to container yard
2,500 2,500
M19
Rail link to Gwadar Port 12,000 12.000 Continued beyond 2009/10
M20 Up-gradation Rohri - Quetta - Taftan 15,000 15,000 Continued beyond 2009/10
M21
Feasibility study for rail link from Kundian to Peshawar
10 10
M22 Feasibility study for rail link from Bostan to Peshawar
10 10
M23 Provision of road over bridge at Chowrangi Chowk EPZ Karachi (50%)
250 250 Continued beyond 2009/10
Sub total of MTDF Sub total of PSDP
68,2875,712
300 68,517 5,712
Total Total of MTDF
Total of PSDP 111,15249,556
20,22720,227
91,454 23,617
Total 11,778 11,778 Source : Medium Term Development Framework (MTDF) 2005-10 Public Sector Development Program (PSDP) 2005-06 Pakistan Railways (Information for the Study) Note : “M 1” means “No.1” in MTDF, “P 1” means “No.1” in PSDP

Pakistan Transport Plan Study in the Islamic Republic of Pakistan (PTPS)
8-8
8.2 Demand- Supply Analysis 8.2.1 Target Demand for Passenger Transport
Currently passenger transport numbers of the Pakistan Railways is steady for express services for middle/long distance intercity transport. The number of railway passengers, which had been decreasing due to motorization, reached the bottom in 1998/99, and now it is on a track of recovery.
Target demand for passenger transport in the master plan is set out assuming that the role and share will be constant and demand will increase corresponding to the economic development of the Country.
Target demand for passenger transport for railway development planning is shown below (Table 8.2.1). Target demand for each line is set out based on the increase factors of Table 8.2.1 and estimated current passenger traffic density (Passenger-km of section / section length / day) shown in Table 8.2.2. (As the Pakistan Railways have no such statistics, this is estimated for reference on the assumption that passenger-km of a section is roughly in proportion to coach-km of the section.)
Table 8.2.1 Target Demand for Railway Passenger Transport
Assumed Passenger Demand Year Passenger-km (million) %
2004/05 24,238 100 2010/11 28,124 116 2015/16 33,185 137 2025/26 47,219 195
Source: Demand forecast of the Study 2004/05 (Actual): PR Year Book
8.2.2 Target Demand for Freight Transport
At the present, the Pakistan Railways does not offer suitable freight transport services which customers demand. Therefore, the actual current transport volume cannot be used as a basis of future demand.
Target demand in the master plan of the Pakistan Railways is set out based on traffic survey and a policy of expected future modal split in this Study. The target demand was calculated based on the modal split model for possible demand in freight transport by rail as explained in Chapter 4. Figure 8.2.1 illustrates the possible demand in 2015 and 2025.
20152015
20252025
Figure 8.2.1 Possible Demand in Freight Transport by Rail (Tonnage)

Pakistan Transport Plan Study in the Islamic Republic of Pakistan (PTPS)
8-9
Table 8.2.2 Estimated Passenger Traffic Density of Each Lime
Start End Rout-km1 Karachi Kotri 165 42.0 6,930 562.0 92,730 2,224,835,571 6,095,440 36,942 2 Kotri Hyderabad 9 42.0 378 560.0 5,040 120,922,800 331,295 36,811 3 Hyderabad Padidan 175 38.0 6,650 524.0 91,700 2,200,123,173 6,027,735 34,444 4 Padidan Rohri Jn. 123 36.0 4,428 510.0 62,730 1,505,056,997 4,123,444 33,524 7 Samasatta Jn. Lodhran Jn. 28 38.0 1,064 508.0 14,224 341,271,014 934,989 33,392 6 Khanpur Samasatta Jn. 123 36.0 4,428 496.0 61,008 1,463,741,707 4,010,251 32,604 5 Rohri Jn. Khanpur 215 36.0 7,740 492.0 105,780 2,537,939,250 6,953,258 32,341
13 Pattoki Lahore Jn. 84 28.0 2,352 356.0 29,904 717,475,282 1,965,686 23,401 12 Okara Pattoki 46 26.0 1,196 344.0 15,824 379,659,205 1,040,162 22,612 11 Khanewal Jn. Okara 201 24.0 4,824 326.0 65,526 1,572,140,360 4,307,234 21,429
9 Multan Cantt Khanewal Jn. 49 28.0 1,372 302.0 14,798 355,042,778 972,720 19,851 48 Faisalabad Chack Jhumra Jn. 20 34.0 680 280.0 5,600 134,358,667 368,106 18,405
8 Lodhran Jn. Multan Cantt 86 20.0 1,720 268.0 23,048 552,981,885 1,515,019 17,616 16 Lala Musa Rawalpindi 157 26.0 4,082 232.0 36,424 873,907,159 2,394,266 15,250 10 Lodhran Jn. Khanewal Jn. 90 16.0 1,440 216.0 19,440 466,416,516 1,277,853 14,198 54 Chak Jhumra Jn. Lahore 122 22.0 2,684 210.0 25,620 614,690,902 1,684,085 13,804 15 Wazirabad Jn. Lala Musa 32 22.0 704 190.0 6,080 145,875,124 399,658 12,489 14 Lahore Jn. Wazirabad Jn. 100 22.0 2,200 186.0 18,600 446,262,716 1,222,638 12,226 47 Shorkot Cantt Faisalabad 107 16.0 1,712 174.0 18,618 446,694,583 1,223,821 11,438 46 Khanewal Jn. Shorkot Cantt 63 18.0 1,134 172.0 10,836 259,984,021 712,285 11,306 19 Rohri Jn. Sukkur 4 18.0 72 160.0 640 15,355,276 42,069 10,517 21 Habib Kot Jacobabad 51 16.0 816 144.0 7,344 176,201,795 482,745 9,466 57 Lahore Narowal 86 16.0 1,376 136.0 11,696 280,617,673 768,816 8,940 20 Sukkur Habib Kot 29 16.0 464 128.0 3,712 89,060,602 244,002 8,414 28 Hyderabad Mirpur Khas Jn. 67 18.0 1,206 126.0 8,442 202,545,691 554,920 8,282 22 Jacobabad Sibi Jn. 156 12.0 1,872 108.0 16,848 404,227,647 1,107,473 7,099 52 Malakwal Jn. Lalamusa 73 18.0 1,314 98.0 7,154 171,643,197 470,255 6,442 51 Sargodha Jn. Malakwal Jn. 75 18.0 1,350 92.0 6,900 165,549,072 453,559 6,047 23 Sibi Jn. Quetta 141 10.0 1,410 90.0 12,690 304,466,337 834,154 5,916 17 Rawalpindi Attock City Jn. 82 12.0 984 84.0 6,888 165,261,160 452,770 5,522 18 Attock City Jn. Peshawar Cantt. 91 10.0 910 80.0 7,280 174,666,267 478,538 5,259 26 Dadu Larkana Jn. 103 10.0 1,030 78.0 8,034 192,756,702 528,101 5,127 59 Wazirabad Jn. Sialkot Jn. 43 10.0 430 76.0 3,268 78,407,879 214,816 4,996 45 Jand Jn. Attock City 58 10.0 580 76.0 4,408 105,759,465 289,752 4,996 42 Kundian Jn. Daud Khel Jn. 49 10.0 490 76.0 3,724 89,348,514 244,790 4,996 60 Sialkot Jn. Narowal Jn. 62 8.0 496 68.0 4,216 101,152,882 277,131 4,470 25 Kotri Jn. Dadu 181 8.0 1,448 68.0 12,308 295,301,156 809,044 4,470 44 Daud Khel Jn. Jand Jn. 88 8.0 704 64.0 5,632 135,126,431 370,209 4,207 41 Kot Adu Jn. Kundian Jn. 231 8.0 1,848 64.0 14,784 354,706,881 971,800 4,207 40 Multan Cantt Kot Adu Jn. 87 8.0 696 64.0 5,568 133,590,903 366,002 4,207 27 Larkana Jn. Habib Kot 63 8.0 504 64.0 4,032 96,738,240 265,036 4,207 38 Pakpattan Kasur Jn. 140 8.0 1,120 62.0 8,680 208,255,934 570,564 4,075 50 Shorkot Cantt Sargodha Jn. 166 8.0 1,328 56.0 9,296 223,035,387 611,056 3,681 55 Chak Jhumra Jn. Sargodha Jn 88 8.0 704 56.0 4,928 118,235,627 323,933 3,681 39 Kasur Jn. Lahore 68 6.0 408 50.0 3,400 81,574,905 223,493 3,287 49 Chack Jhumra Jn. Wazirabad Jn. 135 8.0 1,080 42.0 5,670 136,038,150 372,707 2,761 36 Jacobabad Kot Adu Jn. 428 4.0 1,712 40.0 17,120 410,753,639 1,125,352 2,629 37 Lodhran Jn. Pakpattan 204 4.0 816 38.0 7,752 185,990,783 509,564 2,498 43 Daud Khel Jn. Mari Indus 9 6.0 54 36.0 324 7,773,609 21,298 2,366 53 Lahore Shorkot Cantt. 261 6.0 1,566 34.0 8,874 212,910,502 583,316 2,235 61 Pind Dadan Khan Malakwal Jn. 19 8.0 152 32.0 608 14,587,512 39,966 2,103 66 Rawalpindi Jand Jn. 118 4.0 472 26.0 3,068 73,609,355 201,669 1,709 56 Sargodha Jn Kundian 132 4.0 528 24.0 3,168 76,008,617 208,243 1,578 65 Rawalpindi Havelian 88 2.0 176 16.0 1,408 33,781,608 92,552 1,052 63 Khewra Malakwal Jn. 24 4.0 96 16.0 384 9,213,166 25,242 1,052 67 Kohat Cant. Jand Jn. 61 2.0 122 8.0 488 11,708,398 32,078 526 64 Gharibwal Malakwal 22 2.0 44 8.0 176 4,222,701 11,569 526 62 Bhera Malakwal Jn. 29 2.0 58 8.0 232 5,566,288 15,250 526 35 Amruka Samasata Jn. 257 2.0 514 8.0 2,056 49,328,825 135,147 526 24 Quetta Chaman 242 1.7 415 6.8 1,646 39,482,254 108,171 447 70 Wagah Lahore Jn. 24 0.6 14 6.0 144 3,454,937 9,466 394 69 Sibi Khost 133 2.0 266 6.0 798 19,146,110 52,455 394 58 Narowal Chak Amru 53 0.3 15 2.4 127 3,051,861 8,361 158 34 Larkana Jn. Jacobabad 136 0.3 41 2.1 286 6,852,292 18,773 138 30 Pithoro Jn. MirpurKhas 36 0.4 14 1.6 58 1,381,975 3,786 105 31 Hyderabad Jn. Badin 100 0.3 29 1.5 150 3,598,893 9,860 99 29 Khokhropar Pithoro Jn. 90 0.3 26 1.2 108 2,591,203 7,099 79 32 Mirpur Khas Nawabshah 129 0.1 17 0.5 69 1,650,692 4,522 35 68 Quetta Khu-i-Taftan 633 0.1 84 0.5 317 7,593,664 20,805 33 33 Mirpur Khas Pithoro Jn. 192 0.1 27 0.4 77 1,842,633 5,048 26
Total (per Day) 7,832 90,417 9,441.0 960,508 63,137,274 Total (per YEAR)*365= 33,002,076 3,445,977 350,585,457 23,045,105,000
(in Year Book: 31,944,000) 23,045,105,000 Coach-Km/day
960,508 23,993
Sr.No
No. ofTrain/day
No. ofCoach/day
Passenger-km/km/day
(assumption)
Train-km/day
Coach-km/day
Passenger-km/year
(assumption)
Passenger-km/day
(assumption)
Section
Primary A >20,000 Primary B 20,000-8,000 Secondary 8,000-4,000 Tertiary and MG 4,000-2,000 2,000-1,000 1,000>

Pakistan Transport Plan Study in the Islamic Republic of Pakistan (PTPS)
8-10
The target demand for freight transport for railway development planning is shown below in Table 8.2.3.
Table 8.2.3 Target Demand for Railway Freight Transport
Assumed Freight Demand
Total Ton-km Maximum Sectional Transport Volume of Karachi – Lahore Year
Ton-km (billion) % Thousand Ton (Total of Both Directions) %
2005/06 6 --- N.A. --- 2015/16 37 100 90 100 2025/26 111 300 280 311 Source: Demand forecast of JICA Study Team
Based on the demand, the number of necessary rolling stocks by the fiscal year of 2014/15 and from 2015/16 to 2024/25 is calculated as shown in Table 8.2.4.
Table 8.2.4 Rolling Stock Procurement Plan DL
3000HPDL Smaller Pas. EL Frt. EL Pas.
Coach Frt. Wagon
Number to remain out of the existing at the end of 2014/15* 216 256 1,290 2,850
Necessary number at the end of 2014/15 336 436 2,370 3,900
Number to be procured by 2014/15 ** 120 180 1,080 1,050
Number to be present at the beginning of 2015/16 336 436 2,370 3,900
Number to remain out of the above at the end of 2024/25 254 333 2,117 3,320
Necessary number at the end of 2024/25 254 333 150 180 3,347 7,920
Number to be procured 2015/16 to 2024/25 ** 150 180 1,230 4,600
Source: Estimation of Study Team Remarks: DL 3000HP; Diesel locomotives of 3,000 HP engine DL Smaller; Diesel locomotives of less than 2,400 HP engine Pas. EL; Electric locomotives for mainly passenger trains Frt.. EL; Electric locomotives for heavy freight trains Pas. Coach; Coaches for passenger transport Frt. Wagons; High performance wagons for freight transport * Including the rolling stock not yet commissioned but already listed in MTDF ** “Procure” means purchase, manufacture, assembly and heavy rehabilitation.

Pakistan Transport Plan Study in the Islamic Republic of Pakistan (PTPS)
8-11
8.3 Development Plan 8.3.1 General
The investment in railways should satisfy the target demand and be suitable to lay the foundation for reform and revitalisation of the railways and in accordance with the following premises:
• To specialise in the transport field in which railways have advantages • To develop infrastructure in order to strengthen the capacity in accordance with demand,
to improve transport service and to operate effectively; • To secure a high safety level, and • To purchase and rehabilitate rolling stock in accordance with demand, and to increase
transport volume.
The development plan up to the year 2025 shall be divided into the following three stages; short-term, medium-term and long-term. The target year of the short-term plan is the fiscal year 2009/10, the same as MTDF 2005-10. And that of the medium-term and long-term plans shall be the fiscal years 2014/15 and 2024/25 respectively.
Basically, the short-term plan is being promoted along MTDF2005-10, which has already started. MTDF2005-10 includes the on-going projects listed in the Emergency Repair Plan (ERP).
Projects in the short-term, medium-term and long-term plan are composed of the investments in infrastructure and rolling stock. The investments in infrastructure are executed on the basis of the policies for transport, environment and national land development. The investments in rolling stock and service facilities are to be conducted using operating enterprises on their own responsibility, because with road transport as a competitor of railways, operating enterprises procure their carriages (automobiles, trucks and so on) on their own responsibility.
As long as sustainable infrastructure is secured, operating enterprises are able to establish business plans, purchase rolling stock and realise transport business. In other words, the railway routes with demands for mass transport, to which this scheme is applicable, are the routes generating a good effect of the investments in infrastructures.
The short-term plan should put emphasis to complete intensively the structural improvement of the section between Karachi and Lahore in the main corridor. The section has enough potential demand of mass transport to sustain railway transport business; however, service level is different from the level of customers’ demand and the actual transport volume of the main corridor does not reach at the level of the potential demand due to the lack of investment and maintenance in 1990s.
The medium-term plan includes the rehabilitation of important sections after the section between Karachi - Lahore and the further reinforcement and improvement of infrastructure and service between Karachi - Lahore. At the same time, during the period of medium and long-term plan, structures such as bridges will be rehabilitated in accordance to the urgency and importance of sections.
By the year 2025, the signalling systems, which are aging and have no spare parts, will be renewed in continuing lines. The signalling systems include lower-standard system responding to the role of line.
The electrification plan between Karachi and Lahore will be established according to the growth of transport demand, taking account of supply and demand of high-power locomotives.

Pakistan Transport Plan Study in the Islamic Republic of Pakistan (PTPS)
8-12
Management reform of the Pakistan Railways should be done in parallel with the investments. Infrastructure investments should be executed with a view to promote the reform. The relationships between management reform and investments in infrastructure and rolling stock / service facilities are shown in Figure 8.3.1.
It is desirable to gradually promote the investments in rolling stock in step with demand and the progress of infrastructure improvement. And it is necessary to replace aging rolling stock.
<Infrastructure><Rolling Stock and Service facilities>
<Management>
Short-term Plan (First Step) Management Reform (preliminary)*Completion of structural improvement * Establishment of high-speed freight * Establishment of public corporation of the most important section transport system (container and bulk) ・ Clarification of corporate finance (Karachi - Lahore) * Gradual enhancement/revamping ・ Curtailment of non-core business - Improvement of safety and reliability according to demand ・ Curtailment of past liabilities and - Enhancement of transport capacity * Replacement of aging rolling stock pension (especially of high-speed freight) * Reinforcement of salaes system by the ・ Curtailment of suplus employees - Reduction of travelling time infroduction of IT (for passenger and ・ Dissolution of maintenance backlogs ・ Renewal/improvement of signalling freight) * Capital investment system ・ Development of infrastructure ・ Entire track doubling (enhancement: double tracking & track ・ Completion of track strengthening strengthening) ・ Emergency rehabilitation of structures (modernization: improvement of ・ Renewal/improvement of tele- signalling systems) communication system * Curtailment of light-traffic lines
Midium-term Plan (Second Step) Management Reform (completion)* Improvement/reinforcement of important * Gradual enhancement/revamping * Self-directed/self-sustaining management section according to demand - Operation ・ Renewal of signalling system and * Replacement of aging rolling stock - Infrastructure management telecommunication system - Infrastructure maintenance ・ Track rehabilitation * Curtailment of accumulated liabilities ・ Partial track doubling after the public corporation* Rehabilitation of structures * Investment by the governemnt for capital (in medium/long-term plan according to charge for the development of infrastructure importance and urgency)
Long-term Plan (Third Step)* Continuation of the second step * Gradual enhancement/revamping* M odernization of continuing branch lines according to demand ・ Rehabilitation of signalling system and * Replacement of aging rolling stock telecommunication system (measures for spare parts and mulfanction of interlocking, installation of ATP) ・ Rehabilitation of track and structures* Construction of new lines for regional development *Electrification between Karachi - Lahore * Introduction of electric locomotives (taking account of the growth of demand * Diversion of high-power diesel electric and the supply-demand of locomotives) locomotives to other sections - Enhancement of transport capacity (supply-demand plan without surplus) - Further reduction of travelling time (reinforcement of track maintenance
system are needed)
Figure 8.3.1 Relationships between Management Reform and Investments
Figure 8.3.2 illustrates the development plan by stage.

Pakistan Transport Plan Study in the Islamic Republic of Pakistan (PTPS)
8-13
Figure 8.3.2 Development Plan of Railway System and Container Terminals
8.3.2 Short-term Plan (First Stage)
(1) Structural Improvement between Karachi and Lahore
Most of the traffic by railway is transported through the section between Karachi and Lahore (1,219km) in the main corridor (Karachi – Multan – Lahore – Rawalpindi – Peshawar) and it is expected to be so in the future as well. There is a large potential demand for high-speed container transport through the route from Karachi/Qasim port to the Punjab region including Lahore, Faisalabad and Multan, and Rawalpindi/Islamabad, Peshawar and Afghanistan.
First of all, the Pakistan Railways should complete the structural improvements and the modernisation of infrastructure of the section between Karachi and Lahore. Furthermore, the Pakistan Railways should gradually invest in rolling stock and establishes a freight transport system mainly composed of high-speed container and bulk transport and reinforces the competitiveness of high-speed inter-city passenger transport by the improvement of service quality such as increased frequency and speed. And as a result, the position of railways in land transport will be ensured.
LodhranS amasata
Multan
Khanpur
Kot AdduS horkot Cant
D.G.Khan
Faisalabad
Attok City Rawalpindi
P eshawar
HyderabadKotri
Karachi
Lala Musa
Lahore
BahawalnagarKhanewalQuetta
Chaman
S ibi
J acobabad
Rohri
Khokhropar
Kuh-i-Taftan
Badin
Kolpur
: First Stage (2006-2010)
: Second Stage (2010-2015)
: Third Stage (2015-2025)
: Container Terminal
Source: JICA Study Team
Gwadar

Pakistan Transport Plan Study in the Islamic Republic of Pakistan (PTPS)
8-14
Container transport currently operates only one round trip a day. In order to establish the high-speed container transport system and to turn potential demand into actual demand, the Pakistan Railways should set the number of regular and scheduled container trains to meet the demand in the same manner as passenger trains, and thereby should sell the service of container transport. More than five round trips (assumed based on the number of imported containers) of high speed container trains with enough loads from Karachi/Qasim port could be operating now, if the Pakistan Railways were able to offer such transport service.
Besides, it is desirable to efficiently conduct the bulk transport on a regular and scheduled basis, since bulk transport of coal and so on is incorporated into the operating system of customers.
The present maximum and average train speed of freight trains (55 km/hr and 22 km/hr respectively) does not meet customers’ needs; however, taking economical efficiency into account, heavy freight trains (about 1,800tons) do not need to run at high speed like passenger trains, and an acceptable speed of freight trains is 70-80 km/hr as against the 100-120 km/hr of passenger trains. (Though it is possible to operate freight trains at the same high speed as passenger trains, it is necessary either use 2 locomotives or to decrease the volume of freight. In this regard, if customers require freight service at high speed, and moreover, they pay increased charges for high-speed freight service, high-speed freight transport is feasible.)
Actually, under the current infrastructure, it is impossible to set as many regularly scheduled high-speed freight trains as passenger trains on the existing diagram. The reasons are the followings;
• When exchanging and overtaking in a single track section, the travelling time of passenger trains, which currently prevail over freight trains, becomes longer if their priority is equal with freight trains. Therefore, the service level of passenger transport comes down, and the competitiveness weakens. (The operation of a small number of high-speed freight trains as the first step in the establishment of high-speed freight transport system has only small influence on the operation of passenger trains and does not cause any problems.)
• When the number of freight trains is increased, waiting for exchanging and overtaking in the single-track section also is increased. This situation makes travelling time longer.
• The travel time of freight train can not be reduced without lowering the service level of passenger trains, even if high performance wagons are introduced.
In order to fully establish the high-speed freight transport system, it is necessary to take the following measures and thereby to get rid of causes for the increase of travelling time of passenger trains.
• Renewal and improvement of the signalling systems • Completion of track strengthening work • Track-doubling work all along the main corridor (245km of single track section
remaining between Khanewal and Raiwind out of 1,219km) • Improvement of telecommunication systems
Their effects are shown as below;

Pakistan Transport Plan Study in the Islamic Republic of Pakistan (PTPS)
8-15
Renewal and improvement of signalling ・ Improvement of safety/reliabilitysystem ・ Enhancement of transport capacity
(reduction of train operation time)・ Reduction of arrival time (reduction of waiting time)・ Reduction of operational expenses (curtailment of operating staff and maintenance staff)
Entire double tracking ・ Enhancement of transport capacity (dissolution of bottleneck)・ Reduction of arraival time (reduction of waiting time)
Completion of track strengthening ・ Enhancement of transport capacity (reduction of train operation time by spee-up, and balancing out of waiting time by increased frequency)・ Reduction of arrical time (speed-up)・ Reduction of operational expenses (curtailment of operating staff and maintenance staff)
Figure 8.3.3 Effects of Project
(2) The Infrastructure Investment Plan
a) Renewal and Improvement of Signalling Systems The old style and aging signalling system is one of the three major infrastructure defects in the section between Karachi and Lahore. Together with the remaining single track section and unfinished track strengthening, the old style and aging signalling system is an obstacle to the development of the Pakistan Railways.
An automatic block system is only installed in the section between Karachi City and Hyderabad (179 km). And the relay interlocking system has only been adopted sporadically. Most of the signals are semaphores. In addition, automatic train protection (ATP), which is a back-up system to prevent accidents caused by human errors such as oversight, has not been installed at all.
As stated above, despite the fact that 80% of the route between Karachi and Lahore is double-tracked and has high-standard tracks, the transport capacity, the service level of transport and the safety are not adequate due to the old style and aging signalling systems. In addition, despite having the potential demand, the Pakistan Railways does not utilize the double track adequately. And the present transport operation requires a large number of staff, and therefore, the management is inefficient. The improvement and reinforcement of the signalling system need to be done urgently.
Therefore the renewal and improvement of the signalling system between Karachi City and Lahore as early as possible is necessary. This project is not listed in MTDF 2005- 10. However, after the serious accident at Sarhad on 13 July 2005, the Ministry of Railway and Pakistan Railways have been moving to execute.
The section for the renewal and improvement of the signalling system is: Karachi City – Lodhran – Multan/Shujabad (both) – Khanewal – Lahore – Shahdra Bagh, including the

Pakistan Transport Plan Study in the Islamic Republic of Pakistan (PTPS)
8-16
branch line to Moghalpura. Its contents are as follows;
• Installation of an automatic block system for entire section (The system between Karachi City and Hyderabad is to be rehabilitated.)
• Installation of relay interlocking devices or computerised interlocking devices at all stations (The relay interlocking devices, which have been installed already, are to be rehabilitated.)
• Adoption of coloured light signals • Installation of an automatic train protect system (ATP) • Adoption of a centralised train control system (CTC) • Automatic warnings and barriers for at-grade crossings
b) Completion of Double-tracking Only the 245 km section between Khanewal and Raiwaind is remaining as a single-track section. (The improvement of the single-track section between Lodhran and Khanewal via Multan is under construction for completion at the end of the year 2005/06.)
The remaining single-track section causes the following issues;
• This section is the bottleneck of the section between Karachi City and Lahore where the demand stays constant. The transport capacity is limited to the level of the bottleneck section. This means the existing double-track section is not utilized efficiently.
• The average speed of express trains slows greatly due to the waiting time for train exchange. Once delayed, unexpected waiting time amplifies further delay of the train operation.
• Due to the waiting for train exchange and being overtaken, average speed of freight trains is quite slow.
• Even if the system of high-speed freight transport is established, it will be difficult to significantly reduce the travelling time of high-speed freight train under the circumstances.
It is desirable to complete the double-tracking work urgently in order to improve the transport capacity of the entire route and the transport efficiency and service level by reduction of travelling time as well as to establish a system of high-speed freight transport.
The single-track section is located in flatland with low embankments would be adequate. There are no large rivers, and it is not necessary to construct large structures. Bridge piers for the double track over small rivers have already been constructed. Land has been secured.
Under these circumstances, there are no difficulties in cost or construction.
The double-tracking project is recognized as an on-going project in MTDF2005 -2010 and PSDP2005/06, and the commencement of the project is scheduled for 2005/06. It is desirable to construct the project on the schedule.
The improvement of the signalling system for this section is included in the signalling system project.
c) Electrification The Khanewal – Lahore section was electrified 35 year ago. The renewal of electrification facilities for the section is included in another plan, or in the electrification project in the section between Khanewal and Samasata. The contents of the project are the extension and rehabilitation of the existing electrified section. The priority of this electrification project is lower than the double-tracking project. From the viewpoint of the efficient usage of capital, the electrification project is not a project that can be constructed simultaneously with the double-tracking project. It is also impossible to conduct the electrified train operation on one track out of double track, and it is necessary to halt the electrified train operation for a while.
All electric locomotives are aging because they were introduced 35 years ago. Since then, no

Pakistan Transport Plan Study in the Islamic Republic of Pakistan (PTPS)
8-17
new electric locomotives have been introduced. There are few electric locomotives in use now. Since diesel locomotives haul most trains even in the electrified section, not problems are expected with availability of locomotives if electric locomotives are not in use. Even if the double-track section is electrified and new electric locomotives are commissioned, the operational efficiency of these locomotives is low because it is necessary to change to diesel locomotives at Khanewal. From the investment viewpoint, the project of new electric locomotives is of low investment efficiency. At the same time, the operational efficiency of diesel locomotives also becomes low.
d) Track Strengthening and Rehabilitation In the most important section, Karachi – Lahore, track strengthening and rehabilitation work has been executed due to its priority; however, there is a section that is as yet uncompleted. Though replacement of rails and installation of prestressed concrete sleepers are almost finished, reinforcement of ballast thickness is less advanced. Rails, sleepers and ballast are important components of railway track. Due to the insufficient thickness, ballast does not function properly as a shock absorber, and the inadequate thickness of ballast causes damage to the track, and in addition causes an increase in maintenance work. Therefore, it is necessary to complete the track strengthening and rehabilitation work urgently.
At the beginning of track rehabilitation, 100RS (100lb/yard, or about 50kg/m) rail was used, but currently UIC54 (54kg/m) rail is used.
The progress of the work on the Karachi – Lahore section up to June 30, 2005 is shown below.
• Replacement of rails : 97 % • Installation of PC sleepers : 97 % • Reinforcement of ballast thickness : 23 %
Currently, it is possible to operate trains at the speed of 105 km/hr for almost the entire section between Karachi and Lahore; however, it is necessary to complete the track strengthening and rehabilitation work in order to operate trains at the speed of 120 km/hr as the first step toward high-speed passenger service.
The increased frequency of regular and scheduled freight trains creates and increases the waiting time of passenger trains. Since increases in maximum trains speed resulting from the track strengthening will offset the increase of travelling time of passenger trains, it is possible thereby to avoid a deterioration in passenger transport service. Therefore, track strengthening is needed for the establishment of a high-speed freight transport system.
Only after the track strengthening, it will be possible to ensure an acceptable level of track maintenance by carrying out constant maintenance works and thereby, sound management of transport service can be provided. Inadequate track structure needs a lot of maintenance staff and has a higher cost or speed restrictions, which cause a deterioration of service level. As long as the timing of speed restrictions and accrual of extra maintenance expenses are unforeseeable, it is difficult to establish proper railway management procedures.
In addition to the reinforcement of the physical structure of the track, the establishment of a track maintenance system is also required to keep the track in a good condition and to continuously provide transport service. In fact, it is necessary to accomplish the following tasks as part of the track strengthening; the securing of track maintenance machines such as a multiple tie-tamper, the development of a maintenance depot for effective usage of track maintenance machines and appropriate staff allocation.
e) Other Investment Projects in Infrastructure at the First Stage It is desirable to execute the following project in the first stage simultaneously with the structural improvement of the Karachi - Lahore section.

Pakistan Transport Plan Study in the Islamic Republic of Pakistan (PTPS)
8-18
• Inspection and establishment of a long-term plan for rehabilitation and renewal of structures along all the lines
• Renewal and improvement of the telecommunication system for the Karachi - Lahore section
• Urgent rehabilitation of structures in dangerous condition along all the lines • Urgent rehabilitation of track and signalling systems along all the lines
The Pakistan Railways has a history of more than 100years, and this also means that more than 100 years has passed since the construction of some of structures. There are various conditions of the structures such as; adequate to use as it is, requiring reinforcement and repair, and requiring replacement. And, from the viewpoint of safe train operation, there are various conditions such as; having no problem for the present, adequate to use at a slow speed, adequate to use with constant inspection, and requiring urgent measures. The urgent issues are to completely inspect aged structures and to establish a long-term plan for rehabilitation and renewal according to the importance of the lines and the condition of the structures. If there are structures requiring urgent rehabilitation or replacement, the rehabilitation or replacement will be done in the short-term plan.
In addition to the signalling system, the telecommunication system is also aging and decrepit and needs to be improved or rehabilitated. Telecommunication facilities are essential for smooth train operation control and back-up for safe train operation. Both passenger transport and freight transport require the strengthening of the telecommunication system for the improvement of service to increase sales and to provide information service and for the reinforcement of competitiveness. It is easy to lay down fibre-optic cables along the side of the track. In addition, in parallel with the development of the telecommunication network for the railways, it is possible to develop the telecommunication business nationwide by laying down capacious fibre-optic cables. First of all, it is desirable to urgently renew and improve the telecommunication system of Karachi - Lahore section.
In other sections also, infrastructures are aging and decrepit due to the shortage of investment and maintenance. Therefore, it is necessary to inspect and urgently rehabilitate the important infrastructures for train operation such as tracks and signalling systems.
(3) Investment Plan for Rolling Stock
a) Fundamentals of the Investment in Rolling Stock The rolling stock of the Pakistan Railways are aging and do not have enough performance to maintain present transport capacity due to the lack of investment and maintenance in the 1990s. And the rolling stock can not respond to the enhancement of transport capacity and the change of transport structure.
The progression of aging of rolling stock, the shortage of spare parts and wastage of parts raises the failure rate, and reduces the availability factor. In addition, frequent failure during train operation causes deterioration in the quality level of transport service. Currently the Pakistan Railways copes with such situation by maintenance works. However, the maintenance work causes an increase in operation expenses due, in part, to the increase in maintenance staff. The Pakistan Railways is faced with the deterioration of service and efficiency today.
Especially in freight transport, despite the fact that the role of the railways is specialized in high-speed mass transport between centres by container or bulk transport, not only the number, but also the quality of rolling stock is far from adequate for the high-speed mass transport between centres. There were only 130 wagons for high-speed container transport at the end of the year 2004/05, and the Pakistan Railways provides only one round trip a day for high-speed container transport.
There should be enough rolling stock to meet the transport demand and if there is enough

Pakistan Transport Plan Study in the Islamic Republic of Pakistan (PTPS)
8-19
demand to justify the continuing role of the railways and furthermore that the infrastructures are well-maintained, railways should be able to procure their rolling stock with their own funds.
Consequently, given that the structural improvement of infrastructure will be promoted, it is possible to procure rolling stock with various finance sources, including private funds, in order to establish the high-speed transport system over the Karachi – Lahore section, which has potential demand for high-speed mass transport by container or bulk transport.
b) Locomotives i) Importance of introduction of laboursaving-type locomotives
In the near future, accompanied with economic growth, employment cost will become more expensive than at present, therefore, labour saving is necessary for continuation of the railway. It is important to introduce labour saving-type locomotives, such as inverter-control induction/synchronous motor type locomotives from now on. If not, in the future railway operating enterprises will suffer lack of skilled workers for locomotive maintenance when transport demand increase vastly, even though at present they have many workers at rather low salaries.
ii) 3000HP high-power diesel locomotives
3000HP high-power diesel locomotives are the main locomotives that are essential for intercity high-speed passenger transport and high-speed freight transport on the Main Line. Currently, the Pakistan Railways owns 115 of the 3000HP locomotives.
3000HP high-power diesel locomotives are absolutely necessary to establish the high-speed container freight transport system in the section between Karachi and Lahore. And it is necessary to increase the number of the locomotives for the increased frequency of trains contributing to reducing the congestion of intercity high-speed passenger transport, the improvement of service, and the reinforcement of competitiveness.
Presently, the procurement of 44 locomotives is in progress under “the project for procurement of 69 Chinese locomotives” listed as on-going project in MTDF 2005-10, and 21 diesel locomotives have already been commissioned as of the end of 2004/05.
Furthermore, the procurement of 30 locomotives is planned under “the project for procurement of 75 locomotives” listed as new projects in MTDF 2005-10.
Although 36 of the GMU-30 locomotives currently held are 30 years old, the Pakistan Railway will maintain and retain them because no replacement plan has been approved yet. There is a rehabilitation plan including replacement of engines, but this plan is not listed in MTDF 2005-10.
As the structural improvement of the Karachi – Lahore section progresses by intensive investments in infrastructure, it is necessary to execute the above plans for investments in rolling stock.
The number of 3000HP high-power diesel locomotives for the intercity high-speed passenger transport between Karachi and Lahore and the high-speed freight transport between Karachi and up-country mainly by container or bulk transport will be 138 nos. This figure can meet immediate demand.
iii) 2000(2400)HP middle-size diesel locomotives
2000HP middle-size diesel locomotives are used for middle/short-set passenger trains, slow freight trains and lines with weight restrictions.
Since locomotives with axle load of 22.86 tons are not allowed to run in sections other than the Karachi - Lahore section (including via Faisalabad) or have speed restrictions imposed due to the aging of tracks and structures, 2000HP middle-size diesel locomotives are in use.

Pakistan Transport Plan Study in the Islamic Republic of Pakistan (PTPS)
8-20
The axle load is 17.78/17.27 tons. Some of the 2000HP middle-size diesel locomotives, including China-made locomotives, are of heavy axle load, and those are not able to run on unimportant lines.
The Pakistan Railways owns 276 of the 2000HP middle-size diesel locomotives, out of which 48 locomotives are of heavy axle load. There are 9 locomotives, of which the age exceeds 30 years (excluding rehabilitated locomotives).
Presently, the procurement of 25 of the locomotives is in progress under “the project for procurement of 69 Chinese locomotives” listed as an on-going project in MTDF 2005-10, and 7 diesel locomotives have been already commissioned by the end of 2004/05.
Furthermore, the procurement of 30 of the locomotives is planned under “the project for procurement of 75 locomotives” listed as new projects in MTDF 2005-10.
In addition, the rehabilitation of 55 locomotives is planned under “the plan for recommissioning of 55 locomotives” listed as new projects in MTDF 2005-10. This figure meets the demand of sections other than the Karachi - Lahore section.
iv) 1500HP or less small-size diesel locomotives
1500HP small-size diesel locomotives are used for short-set passenger trains on branch lines. The axle load is 16.76 tons or less. There are 76 locomotives and their age is about 30 years. There are 57 locomotives of 1200HP or less, mainly used for shunting. Their age is over 40 years.
The procurement of 15 of this type of locomotive is planned under “the project for procurement of 75 locomotives” listed as new projects in MTDF 2005-10.
Short-set passenger trains on branch lines may have come to the end of their role in railways. And all currently held small-size diesel locomotives are aging. However, since this type of locomotive is not only for current short-set passenger trains on branch lines, but also for other light works, it is necessary to supplement a few numbers of this type of locomotives.
c) Passenger Coaches Currently, passenger trains mainly engage in middle/long-distance intercity high-speed transport. Short-distance local transport has shifted almost totally into automobiles. In this regard, railway lost its role. Consequently, future investments are mainly for the increased frequency of intercity high-speed trains and the improvement of service. The issue is to increase of the number of passenger coaches and the refurbishment of accommodations.
Passenger coaches are classified as economy class and upper class such as air-conditioned lower, air-conditioned lower special and air-conditioned parlour. In expectation of the improvement of national living standard and the service level of competitors, it is important to increase the number of, refurbish, improve and renew passenger coaches. The reinforcement of upper-class service leads to an increase in income and contributes to making railway management stable.
In case the service level does not meet customers’ needs and competitions, even though service life of coaches is still remaining, it is easy to refurbish the accommodation of coaches. And rehabilitation including refurbishment of accommodation of old passenger coaches also is applicable.
In order to determine the appropriate type of passenger coaches, it is important to understand customers’ needs through marketing activities. It is desirable to consider the following items;
• Whether the Pakistan Railways should expand sleeper compartment service or not, instead of the current uncertain rule depending on congestions?
• Are berths available during the night time? • Should the Pakistan Railways set out sleeper service to raise income if there is enough
space?

Pakistan Transport Plan Study in the Islamic Republic of Pakistan (PTPS)
8-21
• Whether economy and air-conditioned lower class are specialized in sitter service to improve comfort or not?
• Do customers prefer compartments or not? • Whether the Pakistan Railways should provide comfortable service exclusive to sitter for
middle-distance intercity transport or not? • Is small-capacity and expensive air-conditioned sleeper class is competitive with
aviation?
The procurement of 175 passenger coaches is in progress under the project of “Procurement/manufacture of 175 passenger coaches” listed as on-going project in MTDF 2005-10. And 108 passenger coaches have already been commissioned as of the end of 2004/05.
In addition, the rehabilitation of 450 passenger coaches is in progress under the project of “Rehabilitation of 450 passenger coaches”. This project includes the conversion to air-conditioned lower special. By the end of 2004/05, 317 coaches had been converted.
Furthermore, the procurement of 150 passenger coaches is planned under the project of “Procurement, manufacture and assembly of 150 passenger coaches”
After 2005/06, 217 coaches will be added, or an increase of 11%. It is desirable to procure or manufacture passenger coaches after 2005/06 as well, responding to the growth in transport volume and congestion reduction.
d) Freight Wagons Currently, railway freight transport is composed of direct railway transport between centres by block train and then distribution by truck. The Pakistan Railways have few wagons for container or bulk transport, or high-speed container wagons or commodity specialized high-speed wagons. Few high-power locomotives are allocated for freight transport. Therefore, the Pakistan Railways currently hardly ever operates long-distance high-speed mass transport.
The Pakistan Railways has no freight wagons for container or bulk transport other than commissioned ones out of the 1300 wagons from China. Covered wagons require loading and unloading of general cargo by manpower, and have no future. And covered wagons will be replaced with container wagons in the future. It is necessary to urgently increase the number of containers and wagons appropriate for each commodity and to develop efficient freight transport, in which way railways can demonstrate its advantages.
Most of the wagons currently in hand are four-wheelers. The maximum speed of this type of wagons is limited to 55 km/hr. In addition, running stability is lacking, and almost all are aging. Therefore, four-wheelers should be retired upon the introduction of new freight wagons.
After the completion of the oil pipeline, transport of oil and petroleum products by tank wagons will be terminated. Though most of the tank wagons are of four-wheelers, it is possible to convert a part of the newer bogie wagons into the appropriate wagons.
As for future container transport, railway attracts not only bonded containers, but also containers after customs clearance and goods transhipped after customs clearance and transported as general cargo by railway and truck into railway container transport.
As for bulk transport, it is necessary to plan projects including the development of a transport base with loading/unloading equipment and the manufacturing of wagons for bulk transport.
Presently, the procurement of 1300 freight wagons is in progress under the project of “1300 high capacity wagons” listed as on-going project in MTDF 2005-10, and 377 freight wagons have been already commissioned by the end of 2004/05.

Pakistan Transport Plan Study in the Islamic Republic of Pakistan (PTPS)
8-22
Furthermore, the procurement of 1000 freight wagons is planned under the project of “Procurement/manufacture and assembly of 1000 freight wagons” listed as new projects in MTDF 2005-10.
Except for the above freight wagons, the Pakistan Railways does not own freight wagons suitable for high-speed freight transport. In order to establish the high-speed freight transport system, it is absolutely necessary to accomplish these projects.
It should be noted that covered wagons now in use are not suitable for future railway freight transport because goods are loaded/unloaded only by manpower. In addition to containers and bulk, there is the mass transport suitable for railways such as the transport of goods from manufacturing factories to warehouses at logistic centres. However, with the development of the economy, the time will come in the near future that loading/unloading by manpower seems in no way practical. Therefore, it is necessary to procure or manufacture the full-open side door type freight wagons, which are suitable for loading/unloading by fork lifts.
(4) Service Facilities, Loading/Unloading and Logistic Facilities
To develop railways passenger transport as an attractive service, it is important to improve not only rolling stock and operating time, but also the ticket sales system, waiting lounges, canteens and kiosks. It is possible to improve the service system and facilities by private-sector capital, not by large investment as infrastructures, under the situation that the improvement of infrastructure and rolling stock make railway passenger transport stable.
The improvement of the sales system for reserved-seat tickets is especially important because passengers mainly use railways for long-distance trips. The Pakistan Railways should utilize travel agencies in business districts so that passengers do not need to go to the stations for advance reserved-seat tickets. At the same time, the Pakistan Railways should improve the service of ticket counters at the stations so that it does not take a long time to buy tickets. For the above, the enhancement of a computerised ticketing system is indispensable, and the computerised system will facilitate credible sales control and demand statistics.
Freight transport is positioned as a part of the logistic system from origin to destination. Consequently, reliability and punctuality are important for train operation. As for container transport, the establishment of a sales system is essential. Since bulk transport is incorporated into the operating system of manufacturing factories, regular/scheduled transport on a long-term contract is the main business.
Since railways can not provide door-to-door transport service, the function of the base station is to be a contact point between the railway and trucks or ships. And the improvement of the dry ports, container centres, logistic centres, commodity-wise transport centres and so on is essential for the development of railways freight transport. These facilities need to have comprehensive functions for not only loading/unloading of railways, but also as a logistic base. However, the railways company does not need to own all these facilities, and it is possible to develop those facilities by private-sector finance including private funds.
8.3.3 Medium-term Plan (Second Stage)
(1) Infrastructure Investment Plan
After the completion of the structural improvements for the Karachi - Lahore section, the important sections after the Karachi - Lahore section such as the Lahore - Rawalpindi - Peshawar section, Khanewal - Faisalabad - Lahore section, Faisalabad - Wazirabad section and Rohri - Quetta section will be improved. The main projects are track rehabilitation, renewal and improvement of signalling/telecommunication systems and partial track-doubling in heavy traffic sections. Those projects are necessary for safe and stable transport and streamlining of management, and reduce the requirements for handling and maintenance staff. The existing signalling systems will be replaced with new systems of a

Pakistan Transport Plan Study in the Islamic Republic of Pakistan (PTPS)
8-23
standard corresponding to the transport demand and importance of the section. Thereby, it is possible to reduce the number of switching staff at the stations and solve the difficulties of procurement of spare parts for required maintenance.
Based on the rehabilitation plan for structures and the long-term replacement plan established in the short-term plan, the rehabilitation and replacement work for the structures are to be promoted according to the urgency of the work and the importance of the sections. The long-term plan takes over this project.
(2) Rolling Stock Investment Plan
There are no projects for rolling stock listed in MTDF 2005-10, other than the projects commented as “continued beyond 2009/10” in the MTDF.
It is possible to promote investments in rolling stock in accordance with demand therefore, the investment plan for rolling stock is to procure the number corresponding to estimated demand.
The main locomotive is a 3000HP high-power type because the transport between Karachi and Lahore is dominant and the increase of transport volume is expected to be great. During the Second Stage, the Pakistan Railways will have rehabilitated tracks of sections other than Karachi – Lahore section, and the sections where high-power locomotives can run will expand.
The increase, rehabilitation and refurbishment of passenger coaches will proceed continuously, and at the same time improvement of service, reinforcement of transport capacity and reduction of congestion are to be promoted. It is important to adapt type and accommodation of coaches to customers’ needs.
As for freight wagons, the qualitative change to flat wagons for containers should be promoted. Over aged four-wheeler wagons have low occupancy efficiency in terms of locomotives and tracks. And occupancy efficiency of the wagons is quite low. Securing the operability of four-wheelers entails expenses for maintenance staff and facilities. Therefore, it is desirable to urgently retire the four-wheelers.
8.3.4 Long-term Plan (Third Stage)
(1) Long-term Investment Plan for Infrastructure and Rolling Stock
In the long-term plan after 2015/16, the target is to realize long-term projects listed in MTDF 2005-10. Besides, the renewal of signalling and telecommunication systems and the track rehabilitation are promoted for unfinished lines. These lines have small transport volume and low significance, therefore, the renewal and the rehabilitation are conducted at a certain standard, realized at low cost and solve the problem that old style and aging facilities required a large number of switching and maintenance staff. By this time, with the economic growth, employment cost will become more expensive than at the present, therefore, labour saving is necessary for continuation of the railways.
Rehabilitation and replacement of structures in the long-term plan are to be continuously executed.
By eliminating light-traffic lines, which have lost their role with the railways, from the national railway network, those lines do not need investments.
As for rolling stock, manufacturing, replacement and refurbishment are to be promoted in accordance to sharply increasing demand trends and changing customers’ needs.
(2) Electrification
The section between Karachi and Lahore (1,219 km) has large passenger and freight demand, and it will grow together with the economic growth of the country. For a large transport

Pakistan Transport Plan Study in the Islamic Republic of Pakistan (PTPS)
8-24
volume, electrification is advantageous, because of low rolling stock procurement cost, maintenance cost and availability of high traction power. Power cost depends on electric power supply and track conditions and operation of the railways.
This section has few sections of steep gradient and most trains are express which rarely stop. Therefore, little resource saving effects from regenerative brakes is expected. If the portion of electric power sources other than petroleum is high, railway electrification can reduce the country’s consumption of petroleum. If hydro and atomic power is a large portion of total generation, exhaust of CO2 can be reduced.
As electrification can easily run high power locomotives, speed-up of heavy freight trains, further speed-up of passenger trains and increase of acceleration of all trains can be economically carried out. Therefore, electrification makes it possible to utilize to the utmost the improved infrastructure of the advanced signalling systems, double-track and strengthened tracks.
On the other hand, as electrification requires huge investment for facilities, it needs careful study to decide if it is a candidate for execution. Transport demand is the most important factor of the decision. Another factor is demand and supply of 3000HP high power locomotives in order to avoid a surplus of locomotives which can only enter the limited section allowing 22.86 ton axle load.
Transport demand in this section (Karachi - Lahore) is nearly equal throughout and most of the trains operate through. Therefore, partial electrification that makes efficiency of locomotives and drivers low by changing on the way is not preferable, and the project should be for electrification of the entire section from Karachi to Lahore though phased construction is necessary.
A study on electrification between Karachi and Lahore (including rehabilitation of the currently electrified section) needs to be carried out in the medium-term plan looking ahead to growth of demand.
In accordance with the target demand based on the demand forecast in this Study, electrification construction works between Karachi and Lahore will need to start within the medium-term plan.
8.3.5 Curtailment of Light Traffic Lines
One of the most important problems of railway management reform is how to deal with light traffic lines. Their traffic volume is insufficient to operate railway lines which are suitable for mass transport now that the road transport system has been developed.
Some lines of the Pakistan Railways do not have enough demand for their subsistence and have already lost their roles with the railways. They are reducing the efficiency of the railways system. And it is preferable to separate those lines from the nationwide railway system and to entrust them to provincial governments. Each line should be managed independently by its own standard or changed over to road transport.
Passenger transport needs speed, frequency, and punctuality as well as safety. Therefore, demand large enough to sustain such conditions is required. Estimated passenger traffic density (Passenger-km of section / section length / day) is shown in Table 8.2.2.
It can be said that the traffic density of less than 1,000 passengers per day is insufficient. For example, in Japan lines less than 4,000 passengers per day were separated from the nationwide railway system and entrusted to the decision of the regions in the reform and privatization of Japanese National Railways in 1987.
Freight transport does not necessarily require high speed and frequency if the haulage distance is not so long as branch lines of light traffic. Therefore, the transport of huge volumes by a small number of trains, for example a train per day, can be continued at low speed with small infrastructure maintenance cost. Thus some branch lines can be managed

Pakistan Transport Plan Study in the Islamic Republic of Pakistan (PTPS)
8-25
exclusively for freight transport. However, if the remaining traffic is only feeder transport of containers and the number of trains is not sufficient even though the haulage volume is huge, then it is more effective to shift such container transport from the railways to road transport because of easy transhipment.
8.4 Master Plan Projects 8.4.1 Railway Infrastructure
(1) The Objective of the Railway Infrastructure Improvements
The objective of the improvement of railway infrastructure is to revitalize the underutilized railway infrastructure and develop a high speed freight transport system in the Karachi-Lahore Corridor. The high speed freight transport system will maximize the inherent advantage of railways, i.e. long haulage and massive transport by block trains, and enhance railway’s competitiveness. The system will maximize the container and bulk transport among selected stations such as large-scale freight stations, dry ports, container centres, logistic centres, etc. to operate by the “station -to-station direct transport”.
(2) The Prioritization of the Investment Projects
Investment projects and their priorities are established based on the objectives of the railway infrastructure improvement stated herein and the situation analysis of the infrastructure, rolling stock and train operation which is detailed in the preceding section of this Chapter. The investment projects are also identified and the schedule and estimated cost of projects are detailed in Table 8.4.7 in “7.4.4 Schedule and Cost”. The investment projects shall be implemented in three stages. The target year of the first stage is the fiscal year 2009/2010 corresponding to MTDF 2005-10 and those of the second and third stages shall be the fiscal year 2014/15 and 2024/25, respectively. The major infrastructure improvement and modernization projects are listed below:
a) First Stage (2006-2010) • Doubling of track from Lahore to Khanewal via Multan • Doubling of track from Khanewal to Raiwind. • Doubling of track from Lahore to Faisalabad • Doubling of track from Shahdara Bagh to Lala Musa (1st Phase). • Rehabilitation/replacement structure on Karachi-Lahore(1st stage) • Modernization of signalling system on the Karachi- Lahore section • Modernization of signalling system on the Lahore-Faisalabad section • Modernization of signalling system on the Lahore-Rawalpindi(1st Phase) • Improvement and modernization of telecommunication system(1st Phase) • Upgrading and improvement of track from Khampur to Lala Musa. • Rehabilitation and repairs of bridges and stations in the Corridor. • Expansion/improvement of container stations in up-country area. • Improvement of freight stations in Karachi for container/bulk transport. • Establishment of operational diagram.
b) Second Stage (2010-2015) • Doubling of track from Shahdara Bagh to Lala Musa (2nd Phase) • Doubling of track from Lara Musa to Rawalpindi • Doubling of track from Lodhran to Khanewal • Upgrading and Improvement of track from Khanewal to Wazirabad. • Rehabilitation/replacement structure on Karachi-Lahore(continue 1st Phase ) • Improvement and modernization of telecommunication system(2nd Phase) • Improvement of signalling system from Rawalpindi to Peshawar • Improvement of signalling system from Khanewal to Wazirabad

Pakistan Transport Plan Study in the Islamic Republic of Pakistan (PTPS)
8-26
• Improvement of signalling system from Multan to Attock City • Improvement of signalling system from Kotri to Habib kot • Improvement of signalling system from Jacobabad to Kot Adu • Rehabilitation of track from Rawalpindi to Peshawar • Rehabilitation of track from Jacobabad to Kot Adu • Rehabilitation of track on the Rohri-Quetta-Taftan section(1st Phase)
c) Third Stage (2015-2025) • Rehabilitation /replacement of structures on Karachi-Lahore (2nd Phase) • Rehabilitation of track on the Rohri-Quetta-Taftan section(continuation of 2nd Stage). • Rehabilitation/ replacement of structures of other lines • Improvement and modernization of signalling system on other lines • Improvement and modernization of telecommunication system on other lines • Upgrading and improvement of track on all regional lines. • Construction of new lines for regional development including rail link to Gwadar Port. • Construction of railway yard and railway linkage between Gwadar Port and container
yard. • Electrification of the Karachi-Lahore line
d) Estimated Cost • The estimated cost of the improvement programme is Rs. 546 billion which includes the
costs of rolling stock specified in Table 8.4.7. • The break down of the total cost is: Rs. 107 billion for the First stage, Rs. 130 billion for
the Second Stage and Rs.309 billion for the Third Stage. • These costs need to be financed by the government and external assistance during the
next 20 years.
8.4.2 Rolling Stock Fleet
Rolling stock can be increased, rehabilitated and remodelled by small numbers corresponding to demands and customers’ requirements. The plan is proposed along this line.
Investment for rolling stock will suit private funds if reform of the Pakistan Railway progresses. For example, a container transport enterprise can procure locomotives and wagons using its own funds.
Rolling stock will be used for more than 30 years, and it is essential to be procured and designed foreseeing various conditions; not only transport demand but also customer orientation, supply and demand of skilled employees, change of requirement of types accompanied with infrastructure projects for example electrification and track/bridge reinforcement, etc.
Especially, “maintenance free” is an important factor because skilled employees will become more difficult to obtain corresponding to development of the Pakistan economy even though the Pakistan Railways have many skilled employees at present. Loading and unloading by manpower will also become difficult.
It is essential to recognize that the existing 4-wheeler will soon become unusable because of a mismatch with customers’ requirements. Brake vans will become unnecessary in the lines where automatic block systems and improved communication systems are provided.
8.4.3 Project Evaluation
(1) Effect of Signalling System
The following effects are expected from the investment in the signalling system;
• Improvement of safety and reliability

Pakistan Transport Plan Study in the Islamic Republic of Pakistan (PTPS)
8-27
• Reinforcement of transport capacity (reduction of train intervals) • Reduction of travelling time (reduction of waiting time) • Reduction of expenses for train operation (reduction of operation and maintenance staff)
a) Improvement of safety and reliability The visibility of signals becomes high and back-up system prevents human errors such as oversight of a signal and over speed. Therefore, the safety and reliability of railway is greatly improved.
b) Reinforcement of transport capacity (reduction of train intervals) With the existing system only one train is allowed to run in a section between adjacent stations despite the double track; however, with improved system trains can operate with “2 block section clear” and short signalling system handling time. (Signals located between stations are changed automatically instantly.) Therefore, the train intervals can be reduced significantly, and at the same time, the number of trains can be increased.
This situation reinforces the transport capacity.
Operation intervals depend on the headways of block signals. The below comparison chart is a sample of the reduction of operation intervals.
Reduction of Operation Interval Operation interval under the existing system Speed Operation interval under
the improved system 10 km * 15 km * 100 km/hr 4 min. 20 sec. 10 min. 30 sec. 13 min. 50 sec. 70 km/hr 6 min. 10 sec. 13 min. 40 sec. 18 min. 00 sec. 55 km/hr 7 min. 50 sec. 16 min. 40 sec. 22 min. 00 sec.
Assumptions: - Operation interval between non-stop trains - Headway of block signals of the improved system: less than 3 km - Time to switch signal lever of the existing system: 3 minutes - Distance between first sight of the passing signal and the centre of the station in the existing
system: 2.5 km - Sight distance of the signal: 1200m Remarks *: distance between stations
c) Reduction of travelling time (reduction of waiting time) As stated below, a new (or rehabilitated) signalling system makes the waiting time of slow trains shorter, especially freight trains. The waiting time is dependent on the distance between stations (current system), the interval of block system (after the improvement) and the speed of the overtaking train. The comparison of the waiting time before/after the improvement is as follows;
System Under existing system Under improved system Operation - Running time of the overtaking train
between the sign to have to sight the passing signal of the preceding station and the next station - And time for handling signal levers twice
- Running time of the overtaking train between the sign to have to sight the block signal of 2 blocks before the home signal and the spot to clear the block signal of 2 blocks after the starting signal
Waiting Time 22 minutes 7 minutes 40 seconds Assumptions: - Distance between signals of improved system
Block signal – 3000m- Block signal – 2000m – Home signal – 1000m – Starting signal – 2000m – Block signal – 3000m – Block signal
- Distance between stations of the existing system: 12 km

Pakistan Transport Plan Study in the Islamic Republic of Pakistan (PTPS)
8-28
- Time to switch lever of the existing system: 3 minutes - Distance between the sign to have to sight the passing signal and the centre of the station in
the existing system: 2.5 km - Signal sight distance: 1200m - Speed of passing train: 100 km/hr
d) Reduction of expenses for train operation (reduction of operation and maintenance staff) By the improvement of signalling system and the introduction of CTC, staff for switching signals at middle stations becomes unnecessary because the signal levers are operated by remote control from the dispatching centre. And also at major stations, it is possible to significantly reduce the number of staff. In addition, it is also possible to reduce the number of stations.
Maintenance staff also can be reduced considerably, because old signalling equipment, which often requires inspection, repair and adjustment, is replaced with modern maintenance-free equipment.
The problem of procurement of spare parts also is solved. In this regard, it is possible to save maintenance cost.
(2) Capacity Expansion
The study proposes improvement of the infrastructures, such as improvement of the signalling system, track strengthening/rehabilitation and double-tracking. Increased line capacity as a result of the projects is estimated as below. The estimation is made based on “Scott’s Formula” that is used by the Pakistan Railways.
a) Line Capacity of Double-track in Karachi - Lahore Estimated line capacity of double-track in Karachi - Lahore (at present and after infrastructure improvement) is shown below Table 8.4.1.
Table 8.4.1 Estimated Line Capacity of Double-track in Karachi - Lahore for Each Stage
Stage Line Capacity Infrastructure Freight wagons Present 38 pair trains/day Tokenless block Mainly 4 wheelers
83 pair trains/day Automatic block, double-track,strengthened track Mainly 4 wheelers Infrastructure
Improvement121 pair trains/day Automatic block, double-track,
strengthened track Mainly high performance
wagons
Electrification 151 pair trains/day Electrified, in addition to above Mainly high performancewagons
Further Reinforcement 168 pair trains/day
Shortening block section, increase of passing loops,
extension of station effective length, strengthening substation
Almost all high performance wagons
Remarks: Generalized estimation on the assumption that the longest distance between stations is 1.5 km in case tokenless block is applied.
Source: JICA Study Team
Estimated line capacity at present is 38 pair of trains per day, and 18-19 pairs of passenger trains are in service, which provide about half of the line capacity. There is margin to make 19 pair of freight trains if the capacity is shared evenly between freight and passenger trains. However, until completion of the infrastructure improvements, freight trains will be forced to wait for passenger trains because the existing service level of passenger service cannot be lowered.

Pakistan Transport Plan Study in the Islamic Republic of Pakistan (PTPS)
8-29
After completion of the infrastructure improvements, the main line between Karachi and Lahore will have sufficient line capacity and margin to raise service level of both passenger and freight transport.
In the fiscal year 2014/15, estimated line capacity will be 83 pair of trains per day, which can be increased to 121 pair of trains per day by changing freight wagons from 4-weelers to high performance wagons, and then the assumed number of trains will be 89 (29 passenger, and 60 freight) pair of trains per day. The line capacity will be sufficient for further growth of traffic.
Electrification can reinforce the capacity more by increasing operation speed, acceleration and hauling capacity.
Estimated transport capacity of a freight train is shown below in Table 8.4.2. In order to adopt to estimate line capacity, it is necessary to take into consideration imbalance of transport volume between directions. The proportion of transport volume up-country to down-country is assumed to be 6 to 4.
Table 8.4.2 Estimated Transport Capacity of a Freight Train
Type Hauling Capacity
Average Transport capacity
Conditions
3,000HP DL 1,800 ton 1,080 ton Maximum operation speed: 80 km/hr Station effective length: 600 m (as existing)
3,900kW EL 2,000 ton 1,200 ton Maximum operation speed: 100km/hr Station effective length: 600 m (as existing)
7,000kW EL 3,000 ton 1,800 ton Maximum operation speed: 80 km/hr Station effective length: 900 m (extended)
Source: JICA Study Team
b) Line Capacity of Single track in Primary A Lines Estimated line capacity of single track in primary A lines (at present and after infrastructure improvement) is shown below Table 8.4.3.
Table 8.4.3 Estimated Line Capacity of Single track in Primary A Lines for Each Stage
Stage Line Capacity Infrastructure Freight wagons Present 46 trains/day Tokenless block Mainly 4 wheelers
57 trains/day Automatic block, single track, strengthened/rehabilitated track Mainly 4 wheelers Infrastructure
Improvement78 trains/day Automatic block, single track,
strengthened/rehabilitated track Mainly high performance
Remarks: Generalized estimation on the assumption that the longest distance between stations is 12 km in case tokenless block is applied
Source: JICA Study Team
Estimated line capacity at present is 46 trains per day, and 18-26 passenger trains are in service, which is about half of the line capacity. There is a margin to run 20-28 freight trains. However, until completion of the infrastructure improvements, freight trains will be forced to wait for passenger trains because the existing service level of passenger service cannot be lowered.
After completion of infrastructure improvement, line capacities will be increased. While the freight wagons are mainly 4 wheelers, there will be 57 trains per day. And after they are changed to high performance wagons, it increases to 76 trains per day.
c) Line Capacity of Single-track in Other Lines Estimated line capacities of single-track in other lines to be improved (at present and after

Pakistan Transport Plan Study in the Islamic Republic of Pakistan (PTPS)
8-30
infrastructure improvement) are shown below Table 8.4.4.
Table 8.4.4 Estimated Line Capacity of Single-track in Other Lines on Each Stage
Stage Line Capacity Infrastructure Freight wagons Present 38 trains/day Tokenless block Mainly 4 wheelers
42 trains/day New type tokenless block, single track, rehabilitated track Mainly 4 wheelers Infrastructure
Improvement 61trains/day New type tokenless block, single
track, rehabilitated track Mainly high performance
Remarks: Generalized estimation on the assumption that the longest distance between stations is 15 km Source: JICA Study Team
Estimated line capacity at present is 38 trains per day, and less than 18 passenger trains are in service, which is less than half of the line capacity. There is enough margin to offer freight services.
After completion of infrastructure improvements, line capacities will be increased. While the freight wagons are still mainly 4 wheelers, it will be 42 trains per day. And after they are changed to high performance wagons, it increases to 61 trains per day.
(3) Impact on Modal Share
Investments in infrastructure and train operation, including the completion of track rehabilitation, track-doubling and modernization of signalling systems on the Main Corridor will improve the safety and reliability, increase speeds up to 140 km/h, and increase frequency of train operation. It is expected that the share of rail in passenger traffic which is now 9.4% will increase substantially for medium and long-distance traffic due to the increased speed, efficiency, safety/reliability and services. The freight traffic is expected to increase dramatically due to the new marketing and service delivery systems and by 2015 railway’s share will reach 20% level of the total transport volume.
(4) Economic Evaluation
Economic Indicators such as Economic Internal Rate of Return (EIRR) and Net Present Value (NPV) were calculated for the Railway Master Plan base on the following assumptions:
• Economic benefit consists of savings in passenger travel time and vehicle operating cost (VOC) on road network. Time values to convert travel time to monetary value are the same as used for roads in Chapter 6.
• Evaluation period is set for 30 years from 2005/06 to 2034/45. • Total investment cost for railway is allocated for 20 years. • The investment effect begins to appear from 2010/11. • Road network is such that only and all road projects in MTDF are carried out. • In “Without Case”, freight transport by rail is fixed at 10.2 billion ton-km after 2010/11. • Residual values are not considered.
The economic transport cost by rail was calculated using the following formula:
Transport cost by rail per ton = 0.39 D (km) + 468 Rs./ton
The yearly allocation of the total investment cost at Rs. 274.6 billion was assumed as shown in Table 8.4.5.
Table 8.4.5 Cost Allocation for Economic Evaluation Rs. Billion
Short-term (5years) 2005/06-09/10
Medium-term (5 years) 2010/11-14/15
Long-term (10 years) 2015/16-24/25
12.343 11.407 15.580 Note: Assumption by JICA Study Team

Pakistan Transport Plan Study in the Islamic Republic of Pakistan (PTPS)
8-31
Traffic assignment was carried out to calculate travel time saving and VOC saving. The yearly savings are summarized as shown in Table 8.4.6.
Table 8.4.6 Travel Time Saving and VOC Saving Rs. Billion
Year 2015 2020 2025 Travel Time Saving 2.3 10.8 60.0 VOC Saving 46.9 97.4 229.7 Total 49.2 108.2 289.7
Note: Calculated by JICA Study Team
The EIRR was calculated at 23.2%, and NPV worked out to be Rs. 120.2 billion at a discount rate of 15%.
8.4.4 Schedule and Cost
The proposed development plans are listed in Table 8.4.7. The plans in “Medium Term Development Framework (MTDF) 2005-2010 are all included.
Schedules and estimated costs of the projects are also shown in the Table. The total of estimated costs amounts to Rs. 546 billion for 2005-2025. And those for the short term plan, 2005-2010, amount to Rs. 107 billion, those for the medium term plan, 2010-2015, amount to Rs. 130 billion and those for the long term plan, 2015-2025 amounts to Rs. 309 billion.
Schedules of some projects are revised from MTDF.
Table 8.4.7 Schedule and Estimated Cost of the Project Schedule and Estimated Cost (Rs. Million) No. Projects Total 2005 - 2010 2010 - 2015 2015 - 2025
1,823 1
Procurement/manufacture of 175 passenger coaches
(7,776)1,823
A
6,963 2
Procurement 69 DE locos
(11,151)6,963
A
5,506 3
Track rehabilitation and modernization of sleeper factory
(11,192)5,506
A
647 4
Recommissioning of 55 DE Locos
(879)647
A
121 5
Replacement of breakdown cranes and procurement of relief train
(407)121
A
4,143 6
1,300 high capacity wagons
(5,870)4,143
A
2,864 7
Doubling of track Lodhran - Multan - Khanewal
(3,297)2,864
* A
845 8
Rehabilitation of 450 passenger coaches
(2,145)845
A
9
Other projects
(148)26
26
A
10
Conversion of Mirpur Khas - Khokhropar section to broad gauge
(700)400
400
A
5,712 11
Dualization of track from Khanewal to Raiwind 5,712
A
1,288 2,312 12
Dualization of track from Shahdara Bagh to Lala Musa 3,600
D
3,500 13
Upgrading and improvement of track from Khampur to Lala Musa 3,500
B
2,940 14
Doubling of track from Lahore to Faisalabad section 3,840
900 C
12,700 15
Procurement/manufacture/ and assembling of 75 diesel locomotives 12,700
B

Pakistan Transport Plan Study in the Islamic Republic of Pakistan (PTPS)
8-32
Schedule and Estimated Cost (Rs. Million) No. Projects Total 2005 - 2010 2010 - 2015 2015 - 2025
3,600 16
Procurement/manufacture/ and assembly of 1,000 freight wagons 4,800
1,200 B
5,977 17
Procurement/manufacture/ and assembly of 150 passenger coaches 5,977
A
2,500 18
Railway yard and railway linkage from Gwadar Port to container yard 2,500
C
6,500 5,500 19
Rail link to Gwadar Port 12,000
C
4,450 10,550 20
Up-gradation Rohri - Quetta - Taftan 15,000
C
21
Feasibility study for rail link from Kundian to Peshawar 10
10
A
22
Feasibility study for rail link from Bostan to Peshawar 10
10
A
23
Provision of road over bridge at Chowrangi Chowk EPZ (50%) 250
250
A
15,000 24
Improvement of signalling system, Karachi - Lahore 15,000
2,000 25
Improvement of signalling system, Lahore - Rawalpindi 2,900
900
1,300 26
Improvement of signalling system, Rawalpindi - Peshawar 1,300
1,000 27
Improvement of signalling system, Faisalabad - Lahore 1,700
700
2,100 28
Improvement of signalling system, Khanewal - Wazirabad 2,100
2,900 29
Improvement of sgnalling system, Rohri - Quetta 2,900
5,000 30
Improvement/rehabilitation of tele- communication system (1st phase) 5,000
3,000 31
Improvement/rehabilitation of tele- communication system (2nd phase) 3,000
2,500 32
Improvement of signalling system, Multanl - Attock City 2,500
1,700 33
Improvement of signalling system, Kotri - Habib kot 1,700
2,100 34
Improvement of signalling system, Jacobabad - Kot Adu 2,100
9,000 35
Improvement of signalling system, other lines continued 9,000
2,000 36
Improvement/rehabilitation of tele- communication system (3rd phase) 2,000
1,000 37
Urgent rehabilitation of signalling and telecommunication systems 1,000
7,100 38
Doubling of track, Lala Musa - Rawalpindi 7,100
2,100 39
Doubling of track, Lodhran - Khanewal (Via Chord) 2,100
700 40
Rehabilitation of track, Rawalpindi - Peshawar 700
2,000 41
Rehabilitation of track, Multanl - Attock City 2,000
1,400 42
Rehabilitation of track, Kotri - Habib kot 1,400
1,700 43
Rehabilitation of track, Jacobabad - Kot Adu 1,700
6,000 44
Rehabilitation of track, other lines continued 6,000

Pakistan Transport Plan Study in the Islamic Republic of Pakistan (PTPS)
8-33
Schedule and Estimated Cost (Rs. Million) No. Projects Total 2005 - 2010 2010 - 2015 2015 - 2025
200 45
Planning investigation and rehabilitation of structures 200
2,000 3,000 46
Rehabilitation/replacement of structures, Karachi - Lahore (1st phase) 5,000
5,000 47
Rehabilitation/replacement of struc- tures, Karachi - Lahore (2nd phase) 5,000
2,000 48
Urgent rehabilitation of structures of other lines 2,000
10,000 49
Rehabilitation/replacement of structures of other lines 10,000
2,000 50
Improvement of passenger station and ticketing system 3,000
1,000
3,000 51
Improvement of freight stations in Karachi for container/bulk transport 3,000
5,000 52
Expansion/improvement of container stations in up-country area 5,000
5,000 53
Expansion of freight stations in Karachi for container/bulk transport 5,000
7,000 54
Expansion/improvement of container stations in up-country area (2) 7,000
19,000 55
Procurement/manufacture/assembling of 120 diesel locomotives (3000HP) 22,000
3,000
24,000 56
Procurement/manufacture/assembling of 180 diesel locomotives (2000HP) 27,000
3,000
30,000 57
Procurement/manufacture/assembly of 150 electric locomotives (Passenger) 30,000
50,000 58
Procurement/manufacture/assembly of 180 electric locomotives (Freight) 50,000
25,000 59
Procurement/manufacture/assembly of 550 passenger coaches 25,000
5,000 6,000
60 Heavy rehabilitation/modification of 530 passenger coaches 11,000
56,000 61
Procurement/manufacture/assembly of 1,230 passenger coaches 56,000
5,800 62
Procurement/manufacture/ and assembly of 1,050 freight wagons 5,800
25,000 63
Procurement/manufacture/ and assembly of 4,600 freight wagons 25,000
15,000 64
Expansion and modernisation of locomotive/rolling stock repair shops 15,000
15,000 65
Expansion and modernisation of locomotive/rolling stock depot 15,000
66
Feasibility study of electrification, Karachi - Lahore 50 50
7,000 20,000 67
Construction/rehabilitation of Electrification, Karachi - Lahore 27,000
1,200 2,600 68
Increase of transport capacity , Karachi - Lahore, in addition to electrification 3,800
**
7,000 13,000 69
New link, Bostan - Zhob - D.I.Khan - Kohat - Peshawar 20,000
2005 - 10 2010 - 15 2015 - 25 Calculated total 544,287 116,475 146,662 281,150
Total 544,000 116,000
147,000 281,000
Notes: Total estimated cost written upper in (xxx): It includes the portion executed up to 2004/05. Total estimated cost written lower: It includes only the portion to be executed after 2005/06. “A” in the column of Remarks means that the project is listed in MTDF 2005-10 “B” in the column of Remarks means that the project is listed in MTDF 2005-10, and schedule is moved up.
“C” in the column of Remarks means that the project is listed in MTDF 2005-10, and schedule is postponed. “D” in the column of Remarks means that the project is listed in MTDF 2005-10, and estimated cost is revised.
* Including signalling system ** Extension of station effective length, reduction of blocking distance and increase of passing loops
Source: JICA Study Team

Pakistan Transport Plan Study in the Islamic Republic of Pakistan (PTPS)
8-34
8.5 Reform of Pakistan Railways 8.5.1 Overview
The Government of Pakistan (GOP) has launched a plan to transform Pakistan Railways (PR) into a public corporation and drafted a Pakistan Railways Corporation Act 2005. Under the Act a new public corporation to be named Pakistan Railways Corporation (PRC) will be created with more autonomy and powers in its governance. The ultimate goal of the institutional reform is to complete the transition from a state-owned railway to private ownership. However, considering the current state of the financial structure of PR and railway infrastructure, it is unlikely that the institutional reform alone can complete the transition. Lessons learned from international experience in privatization reveal that the financially troubled railways are difficult to sell “as is” and that a transition requires a multi-step reorganization and financial recuperation. These lessons have relevancies to Pakistan.
In order to complete the transition it is necessary for the railways to establish the sustainability of the financial structure and demonstrate its economic viability before the transition. The transition or the ultimate privatization of PR will be a slow process and it may take 15-20 years from today provided that the improvement and development of the railway infrastructure are carried out in a systematic and timely fashion. This section of the JICA Study focuses on the transition or the ultimate privatization of PR and, having reviewed the proposed institutional reform and its effects on the railway industry, attempts to address the issues that are critical for the successful transition.
8.5.2 Historical Perspective of PR Privatization
PR was organized as a department of the Ministry of Railways and this form of organization has proven increasingly ineffective in coping with competition when the national railway’s pre-eminent position was challenged increasingly in post-deregulation era.
In 1996, GOP published an “Open Access Policy (OAP)”. The goal of the government was to build the railway industry’s commercial capabilities and reputation for quality services through private sector participation. GOP solicited private sector bids to transport fuel oil by rail on behalf of Pakistan State Oil (PSO) to the upcountry’s private power stations. There was no positive reaction from the private sector.
In 1997, GOP went step further and announced its plan for PR privatization. The plan was to: (i) restructure PR into three core businesses -passenger, freight and infrastructure-, (ii) create a new Railway Resettlement Agency a public entity to retain all surplus assets and liabilities, including redundant labour, real estate, debts and liabilities including pension and environmental clean up and (iii) establish a new Railway Regulatory Authority to regulate the largely private sector rail industry. The government’s plan was to sell the core business of PR in almost “as is” condition. Sale of a large state-own railway like the PR which has over 90,000 employees, huge liabilities, i.e. pensions, post retirement benefits/privileges and un-kept railway infrastructure and obsolete rolling stock will require a multi-phased reorganization, and financial recuperation. The government’s decision to complete the transition without the processes that were proven to be necessary was inappropriate and ill advised. Subsequently, the plan, although it was not implemented, impacted negatively on the moral of PR employees and railway infrastructure as it was seen by the PR employees as an act of “abandonment” and by the government it was understood as the end to the government subsidy to the financially troubled railway.
It must be noted that in 1995, JICA Study on National Transport Plan in the Islamic Republic of Pakistan recommended the creation of a Pakistan Railway Corporation, similar to PIA, with Ministerial the representation on the Board. The ownership and overall direction of the railway would remain in the public sector, but day-to-day running of the railway would be passed on to commercially oriented managers with clearly defined targets and

Pakistan Transport Plan Study in the Islamic Republic of Pakistan (PTPS)
8-35
responsibilities. The study concluded that, ultimately, given the hope for gain in railway productivity and profitability, such a structure would be suitable for the privatization of the railways, if that was politically desirable. The JICA approach to the Pakistan Railways privatization is clearly based on the “Corporatization-Reorganization-Privatization” principles.
8.5.3 Proposed Institutional Reform
(1) Pakistan Railways Corporation Act, 2005
In 2005, the GOP renewed its PR privatization efforts. The focus was shifted from the outright sale of PR assets to corporatization. A new railway law was drafted and it has been presented to the stakeholders, i.e. federal ministries and provincial governments, for their reviews and approvals. It is expected that the new law will be enacted by June 2006.
a) The salient features of the Pakistan Railways Act, 2005 • Creation of a wholly owned public corporation that may be called the Pakistan Railways
Corporation (PRC). • The Board of PRC consists of a Chairman, CEO, and nine directors: three from the GOP,
three from PRC and three from the private sector. The CEO will be recruited from the private sector.
• The Board has the power and authority to make decisions and administer the affairs of PRC, including the determination of tariffs and rates at which PRC will provide Railway service.
• Transfer all non-core activities, i.e. schools, hospitals, etc. to a new holding company to be created under the MOR.
• Transfer of all assets, rights, powers, authorities, privilege, properties movable and immovable, cash and bank balance to PRC.
• Transfer of all debts/loans or overdrafts and all liabilities, i.e. pension, post retirement benefits and general provident fund transferred to GOP.
• Development, improvement and rehabilitation of railway fixed infrastructure and rolling stock remain the responsibility of GOP as part of PSDP.
• Costs of unprofitable passenger services/routes are compensated for GOP as Public Service Obligations or defence requirements.
b) Rationale of the Reform • Creation of a commercially oriented railway. The institutional structure of PR contains
weak incentives to increase efficiency. Such structures suppress commercial incentives, distort business and investment decisions and sap management responsibility and accountability. PR cannot be an effective player in a competitive transport market while it is a government department.
• Creation of lines of business management. Lines of business management facilitates greater management responsibility and accountability and enables profit centre accounting, hence better performance, monitoring lines of business management simplifies and focuses marketing and business development functions.
• Curtailment of non-core activities. Non-core activities create management complexity, divert attention and also create an excuse for high costs. Ownership of supply industries precludes the benefits of competitive tendering and the rigor of normal commercial supplier contracts, further, non-core activities absorb scarce railway investment.
• Financing Structure and self-sufficiency in train operation. The financing structure is ad hoc and unsustainable. With no clear long-term strategy or short-term goal and no value for money test, or monitoring to underpin budgetary support. Such systems also create few incentives for management to focus on net costs rather than gross revenue and expenditure separately.
• Reduction of surplus employees. Overstaffing encourages sloppy management and poor staff moral, as well as higher costs.

Pakistan Transport Plan Study in the Islamic Republic of Pakistan (PTPS)
8-36
c) Expected effects of institutional reform on the performance of the railways To increase the railway industry’s commercial capabilities it is necessary, first, to transform PR into a commercially oriented enterprise through institutional reform and management reorganization. The GOP’s policy and strategy are clear and the reasons for the reform are convincing. The Pakistan Railways Corporation Act of 2005 and the institutional reform as proposed are, however, the first step towards the PR privatization. Under the new Act, the GOP will provide the new Corporation (PRC) with more autonomy and powers, including the determination of tariffs and fares and free the PRC from all debts and liabilities, including pensions and post retirement benefits/privileges. Furthermore, the GOP will continue to fund the costs of capital investment required by the improvements and rehabilitations of railway fixed infrastructure and rolling stock as part of PSDP. As a public corporation the PRC will be exempted from all taxes. Under these terms and conditions, there is no doubt that the PRC can improve the efficiency and productivity in the train operation for passengers and, to a certain extent, for the freight services
By management improvement and with continuous subsidy from the GOP for procurement and maintenance of rolling stock and for the development and improvement of infrastructure it is expected that the corporatization can turn the railways industry around.
The institutional reform, however, has its limits and it is not likely to deliver the improvements required for the ultimate privatization. In order to attract element of the private sector into the industry it is essential to demonstrate, not only the economic viability of the railways industry, but also the competitiveness and profitability.
The objective of the corporatization is to complete the transformation of PR into an autonomous public corporation which is ultimately capable of self-financing of the corporate affairs including the infrastructure management (ground operations), procurement and maintenance of rolling stock, resolution of the maintenance back log and the rationalization of labour redundancy and settlement of liabilities, etc. To ensure the smooth transition from the corporatization to privatization the PRC has to make extraordinary efforts towards management improvement parallel with the improvement and strengthening of the railways infrastructure. Management improvement has to focus on the winning of the cost competition, first, in the middle/long distance intercity passenger transport and middle/long distance freight transport. To achieve this target the management has to develop a business practice equipped with a sophisticated and computerized ticketing and marketing systems in addition to the modernization of infrastructure, rolling stock and service facilities that enable a fast, efficient and competitive delivery service. If the PRC can not achieve the goal during the next 10 years it will be faced with the same old problem -deficit financing- and the risk of GOP needing to resume subsidy to railway industry increases.
8.5.4 The Overall Effects of the Corporatization
Provided that the management improvements and investments are carried out in line with the investment and development plans mentioned above it can be anticipated that the corporatization of Pakistan Railways could produce the following effects:
(1) General
• Train operation capacity on the Corridor will be increased in terms of volume and revenue.
• Competitiveness of both passenger and freight transport with other modes in intercity middle/long distance passenger transport and middle/long distance freight transport will be increased.
• Opportunities for private sector capital and management expertise being injected into railway related industries increased.

Pakistan Transport Plan Study in the Islamic Republic of Pakistan (PTPS)
8-37
(2) Train Operation Capacity
• Carrying capacity of passenger transport, particularly, express trains will be increased. • Passenger demand and real yields will be increased due to the improved speed,
safety/reliability and services. • Freight transport services demand and revenue will be increased. • Container transport services demand and revenues earned will be increased. • Bulk transport services demand and revenue will be increased.
(3) Infrastructure
• Track reinforcement, double-tracking, modernization of signalling and telecommunication systems and better maintenance will have:
• Reduced bottlenecks and eased speed restrictions. • Reduced waiting time and the subsequent travelling time. • Increased safety/reliability.
(4) Rolling Stock and Service Facilities
• Replacement of obsolete rolling stock completed by procurement of a fleet of high performance locomotives, high performance wagons and passenger coaches.
(5) Institutional Efficiencies
• Incentives to increase efficiency enhanced. • Opportunities for private sector participation enhanced • Labour and capital productivity improved
(6) Financial Structure
• Self-sufficiency achieved. • The financing structure becomes sustainable. • Maintenance back log from the past resolved
The following basic requirements for the ultimate privatization met:
• Increased transport Capacity • Sustainable financial structure • Increased economic viability
8.5.5 The Steps towards the Ultimate Privatization
(1) Conversion of Freight Operation Business and Passenger Operation Units of PRC to Joint Stock Corporations (2015)
• All assets of the passenger and freight operations are to be transferred to joint stock corporations and ultimately privatized through a series of public offerings after the Initial Public Offering (IPO) in 2020
• PRC will function as a “Resettlement Corporation” after the separation and transformation of the operation unit, rail maintenance unit and infrastructure units into joint stock corporations and retain all surplus assets, liabilities, labour redundancy, etc. or as an option create a Railway Resettlement Corporation.
• PRC will hold 100% of the shares of the new joint stock corporations until the IPOs of these joint stock corporations.
(2) Conversion of Rail Maintenance Business to a Joint Stock Corporation (2015-20)
• The rail maintenance Business of PRC will be privatized through an IPO. The new

Pakistan Transport Plan Study in the Islamic Republic of Pakistan (PTPS)
8-38
company will provide maintenance services to PRC rail infrastructure, including civil engineering and building, signal engineering and fixed equipment maintenance. It will also undertake large-scale and small-scale track renewals works and heavy mechanized track maintenance
(3) Conversion of Infrastructure Unit to a joint Stock Corporation (2015-20) - An option
• Infrastructure (track, fixed facilities, stations, bridges and right of way) will be converted to a joint stock company. Financing of construction and rehabilitation remain the responsibility of the Government until this unit is sold. PRC retains 100% of the share of the new joint stock infrastructure corporation.
• There is an option for PRC to retain the infrastructure and enter a lease agreement with the private passenger and freight transport companies or charge these private companies access fees.
(4) Public Offering of Joint Stock Corporations
• Initial public offerings (IPO’s) of the following joint stock corporations, as these corporations matured and demonstrated compliance with the listing requirements of the Karachi Stock Exchange.
(i)Train Operation Company (2020) (ii)Infrastructure Maintenance Company (2020)) (iii)Rail Infrastructure Company (2020-25)-An Option
(5) Establishment of Railway Resettlement Corporation (2015) - An Option
In 1987, an independent settlement entity Japan National Railways Resettlement Corporation proved very useful in managing the “work out’ in Japan where the government organized an intermediary to serve as the government’s trustee in managing the orderly disposition of non-core assets and of outstanding liabilities. Retain all surplus assets and liabilities, including labour, real estate, debts. Until all business units or divisions are privatized (in the form of a joint stock company) PRC functions as a resettlement corporation. The Railway Resettlement Corporation, a public corporation, then takes over the PRC’s functions.
The attached diagram will illustrate the process of privatization and outline a time table.
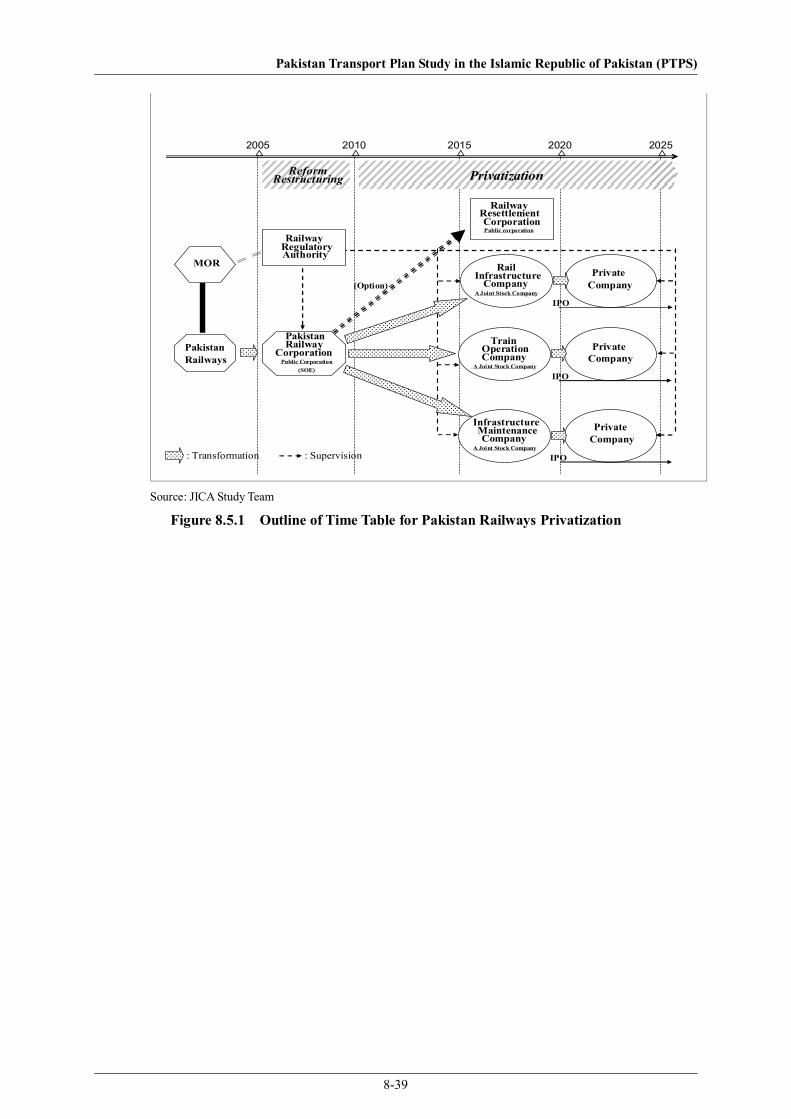
Pakistan Transport Plan Study in the Islamic Republic of Pakistan (PTPS)
8-39
2005△
2010△
2015△
2020△
2025△
RestructuringReform Privatization
AuthorityRegulatoryRailway
PakistanRailways
MOR
Public Corporation
RailwayPakistan
Corporation(SOE)
(Option)
RailwayCorporation
ResettlementPublic corporation
InfrastructureCompany
Rail
A Joint Stock Company
A Joint Stock CompanyCompanyOperation
Train
CompanyInfrastructureMaintenance
A Joint Stock Company
PrivateCompany
IPO
IPO
IPO
: Transformation : Supervision
PrivateCompany
PrivateCompany
Source: JICA Study Team
Figure 8.5.1 Outline of Time Table for Pakistan Railways Privatization
Top Related