


Languages
Pages
Legal


Page 1
Tourism Forecasting in South Africa – Some Perspectives
Andrea SaaymanNorth-West University, Potchefstroom Campus

Page 2
Agenda
• Some facts about tourism to South Africa• Review of academic studies
– Neural networks– Pure time series forecasts– ARDL forecasts– VEC and TVP forecasts
• Seasonality in tourist arrivals• Current challenges

Page 3
Some facts about tourism to SA• The sanction years:
– Domestic tourism focus– International tourism stagnation
• Stagnant years:– Total tourist arrivals 1980 – 702 794– Total tourist arrivals 1990 – 1 029 094– Average growth in arrivals 4.3% per year
• Change started in 1991/2:– Tourist arrivals in 1992 – 2 891 721– Peak arrivals in 2008 – 9 728 860

Page 4
Time series of tourist arrivals
1980
1983
1986
1989
1992
1995
1998
2001
2004
2007
2010
0
2000000
4000000
6000000
8000000
10000000
12000000

Page 5
African versus intercontinental tourists
1980
1982
1984
1986
1988
1990
1992
1994
1996
1998
2000
2002
2004
2006
2008
2010
0
0.2
0.4
0.6
0.8
1
1.2

Page 6
South Africa’s top 15
Africa
Europe
North America
Asia
Australasia
Central and South America
Middle East
Indian Ocean is-lands
ZimbabweLesotho
MozambiqueSwazilandBotswana
UKUSA
GermanyNamibiaZambiaNigeriaMalawi
NetherlandsFrance
Australia
0 1,000,000 2,000,000

Page 7
Tourism’s growing importance in the economy
1994/5 2011
International tourists 4 684 064 8 339 351
Visitor exports R10 billion R75 billion
Contribution to GDP 3% 8.6%
Contribution to employment 550,000 1,188,000

Page 8
Review of academic studies
• Only a handful of academic papers on forecasting tourist arrivals
• Focusing only on intercontinental tourist arrivals– 2001 – Burger et al. using neural networks– 2010 – Saayman & Saayman comparing pure
time series forecast accuracy– 2012 – Louw & Saayman using ARDL models– 2012 – Botha & Saayman comparing TVP and
VEC forecasts

Page 9
Neural networks
• A practitioner’s guide• Case study of US tourist demand for city
of Durban (1992-1998)• Compared time-series methods with
neural networks– Back-propagation algorithm with momentum
used to train process
Page 10
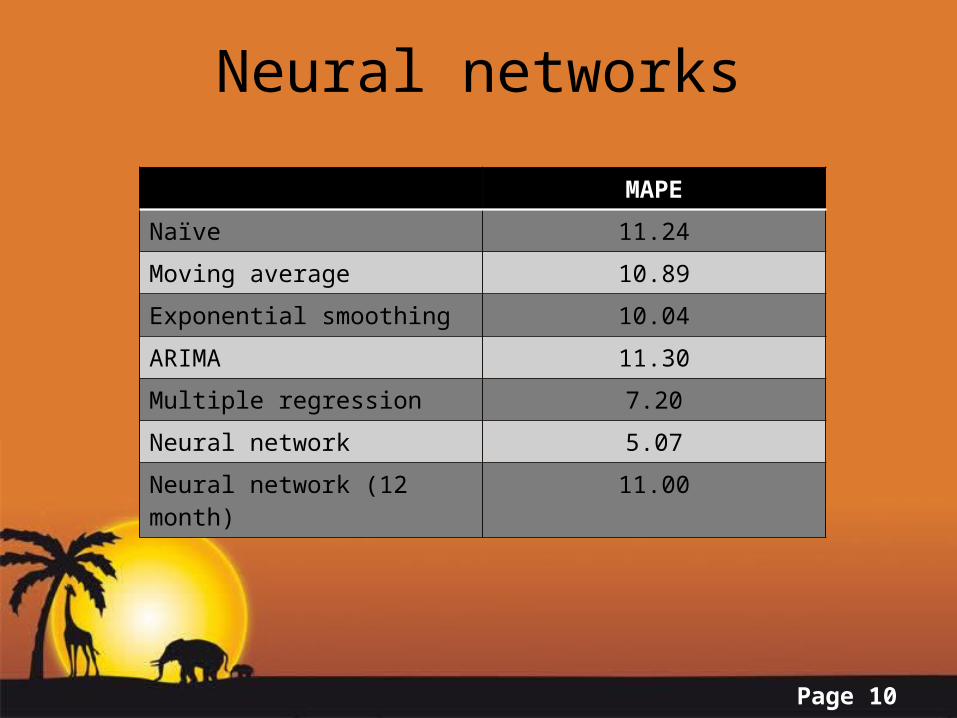
Neural networks
MAPE
Naïve 11.24
Moving average 10.89
Exponential smoothing 10.04
ARIMA 11.30
Multiple regression 7.20
Neural network 5.07
Neural network (12 month) 11.00

Page 11
Univariate forecasts
• Compared accuracy of univariate time-series forecasts for tourist arrivals from top 5 intercontinental markets
• Monthly arrivals from 1994 to 2006• Ex post forecasts for 2007

Page 12
Comparison based on MAPEModel Germany France UK Netherlands USA
12-month forecast
Naïve 1 3.239 (5) 2.142 (3) 3.859 (5) 3.828 (4) 1.579 (3)
Naïve 2 2.256 (3) 4.587 (5) 2.313 (4) 4.748 (5) 1.824 (5)
Holt Winters 0.708 (2) 1.059 (2) 0.582 (2) 1.158 (2) 0.809 (2)
ARIMA 2.864 (4) 2.149 (4) 1.951 (3) 1.653 (3) 1.612 (4)
SARIMA 0.610 (1) 0.954 (1) 0.395 (1) 0.828 (1) 0.613 (1)
6-month forecast
Naïve 1 3.534 (5) 2.208 (3) 4.195 (5) 6.000 (5) 1.879 (4)
Naïve 2 1.794 (3) 2.450 (5) 2.166 (3) 2.653 (4) 2.071 (5)
Holt Winters 0.812 (2) 1.093 (2) 0.515 (2) 1.036 (2) 1.221 (2)
ARIMA 3.119 (4) 2.239 (4) 2.203 (4) 1.735 (3) 1.804 (3)
SARIMA 0.787 (1) 0.991 (1) 0.452 (1) 0.724 (1) 0.754 (1)

Page 13
SARIMA forecasts
8.8
9.2
9.6
10.0
10.4
10.8
2007M01 2007M04 2007M07 2007M10
ACTUAL ARRIVALS GERMANYFORECASTED ARRIVALS
10.0
10.2
10.4
10.6
10.8
11.0
11.2
2007M01 2007M04 2007M07 2007M10
ACTUAL ARRIVALS GREAT BRITAINFORECASTED ARRIVALS
8.4
8.8
9.2
9.6
10.0
2007M01 2007M04 2007M07 2007M10
ACTUAL ARRIVALS THE NETHERLANDSFORECASTED ARRIVALS
9.7
9.8
9.9
10.0
10.1
10.2
10.3
10.4
2007M01 2007M04 2007M07 2007M10
ACTUAL ARRIVALS USAFORECASTED ARRIVALS
8.4
8.6
8.8
9.0
9.2
9.4
9.6
2007M01 2007M04 2007M07 2007M10
ACTUAL ARRIVALS FRANCEFORECASTED ARRIVALS

Page 14
Univariate forecasts
• More accurate forecasts of overseas arrivals in SA with techniques that account for seasonality
• SARIMA forecasts outperform others, including Holt-Winters
• Non-seasonal ARIMA-models perform poorly in this context
• Policy application remains limited

Page 15
ARDL forecasts
• Forecasted arrivals from Asia, Europe, South America, North America, Australasia and UK
• Ex post forecasts – 1 to 3 year horizon• Quarterly data from 1994 to 2004• ARDL model with ECM• Included income, travel cost, price,
infrastructure variables
Page 16
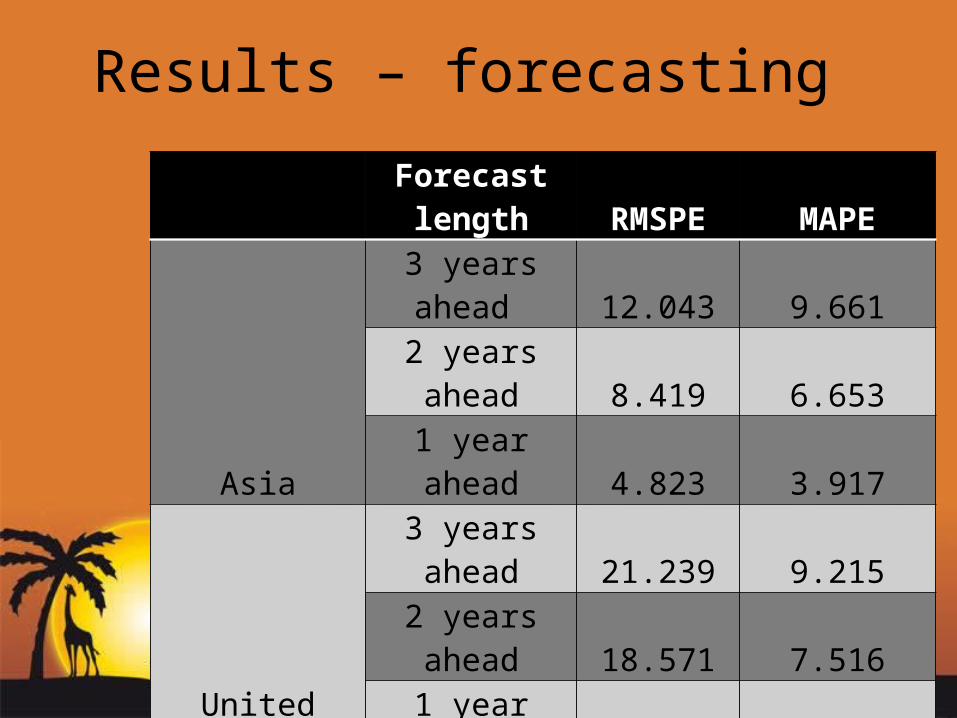
Results – forecasting
Forecast length RMSPE MAPE
Asia
3 years ahead 12.043 9.6612 years ahead 8.419 6.6531 year ahead 4.823 3.917
United Kingdom
3 years ahead 21.239 9.2152 years ahead 18.571 7.5161 year ahead 19.483 1.828
South America
3 years ahead 30.976 18.5142 years ahead 28.192 26.0281 year ahead 16.948 16.398

Page 17
Results – forecasting
Forecast length RMSPE MAPE
Europe
3 years ahead 31.456 18.4062 years ahead 32.957 18.6261 year ahead 39.096 26.488
Australasia
3 years ahead 40.933 35.5382 years ahead 32.014 26.0341 year ahead 15.047 11.031
North America
3 years ahead 36.652 32.0172 years ahead 26.933 22.7731 year ahead 14.801 11.772

Page 18
ARDL forecasts• Long run – real GDP per capita, real price and
infrastructure significant– Demand is income elastic over both short and long run– Infrastructure only creates long run benefit– Demand is relative price inelastic over both short and
long run– Transport cost has relatively small effect
• Forecast accuracy:– Accuracy good for 1-year horizon– UK and Asia models presented best results
Page 19
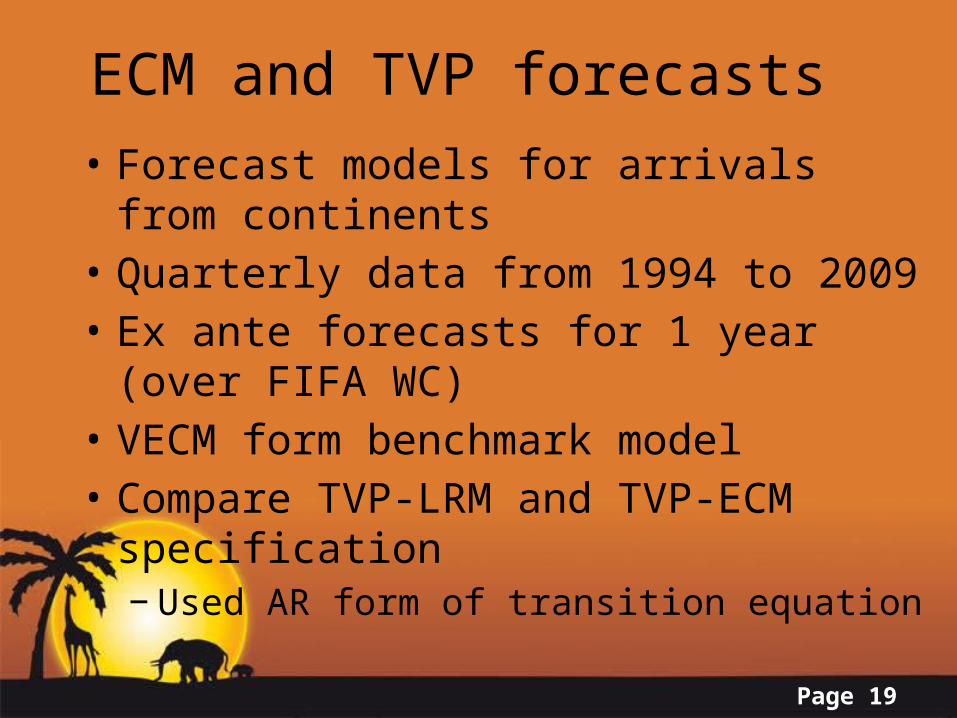
• Forecast models for arrivals from continents
• Quarterly data from 1994 to 2009• Ex ante forecasts for 1 year (over FIFA
WC)• VECM form benchmark model• Compare TVP-LRM and TVP-ECM
specification − Used AR form of transition equation
ECM and TVP forecasts

Page 20
Forecasting accuracy
North
America UK EuropeSouth
America Asia Australia
VECM
MAPE 0.072 0.076 0.286 0.175 0.122MAD/MEAN 0.069 0.077 0.115 0.408 0.167 0.119
TVP
MAPE 0.095 0.101 0.101 0.314 0.102 0.108
MAD/MEAN 0.085 0.096 0.097 0.734 0.088 0.119
TVP-EC
MAPE 0.123 0.264 0.251 0.215 0.113 0.103
MAD/MEAN 0.115 0.268 0.252 0.338 0.112 0.103

Page 21
Demand Elasticities:North America
Page 22
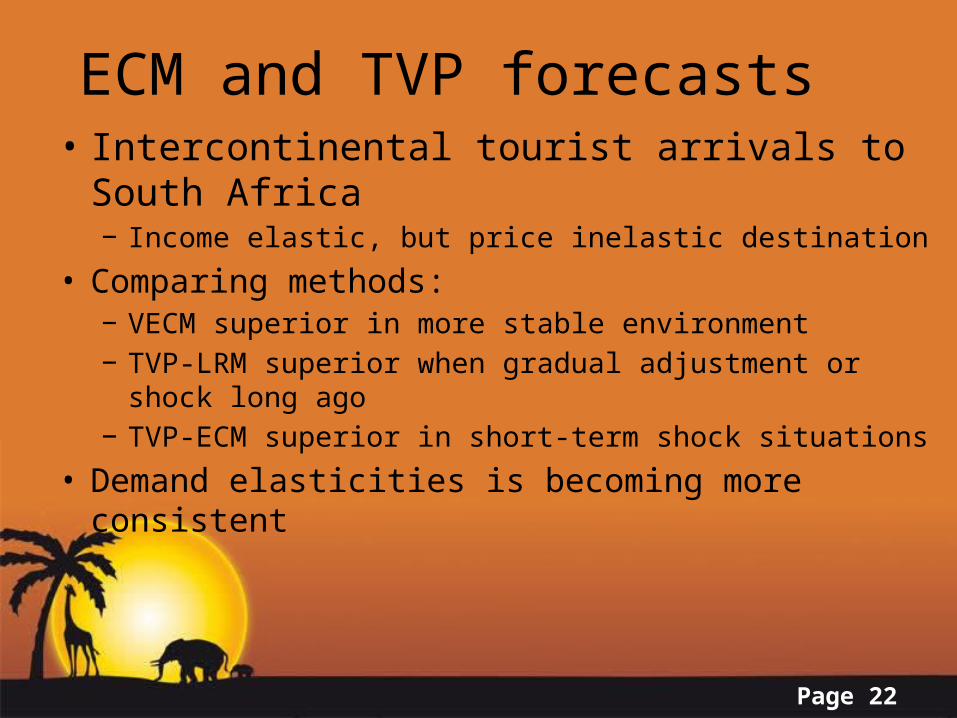
• Intercontinental tourist arrivals to South Africa− Income elastic, but price inelastic destination
• Comparing methods:− VECM superior in more stable environment− TVP-LRM superior when gradual adjustment or shock
long ago− TVP-ECM superior in short-term shock situations
• Demand elasticities is becoming more consistent
ECM and TVP forecasts

Page 23
Seasonality in intercontinental arrivals
• SARIMA models outperform other non-seasonal models
• 2009 paper by Shen, Li & Song− Deterministic seasonal dummies− Stochastic treatment
of seasonality
1994
Q1
1995
Q1
1996
Q1
1997
Q1
1998
Q1
1999
Q1
2000
Q1
2001
Q1
2002
Q1
2003
Q1
2004
Q1
2005
Q1
2006
Q1
2007
Q1
2008
Q1
2009
Q10
20,000
40,000
60,000
80,000
100,000
120,000
140,000
160,000
180,000

Page 24
Current challenges
• Forecasts for SA done by WTTC• Econex forecasted on ad-hoc basis using
ARDL• A need for:
– More continuous forecasts– More inclusive forecasts
• Focusing on more than arrivals“Travel and Tourism research and forecasting in
South Africa needs significant improvement, both in terms of quantity and quality”

Page 25
Current challenges
• There is a need for:– A dedicated tourism forecasting unit
• Austrian WIFO• Australian forecasting committee
– Wider scope to serve a variety of industry needs
– Skills development in forecasting– Better co-operation between all parties

Page 26
Thank you
Top Related