


Languages
Pages
Legal

1
The University ofNew South WalesThe University ofNew South Wales Mälardalen U
Overview of condition monitoring and vibration transducers
Emeritus Professor R. B. Randall
School of Mechanical and Manufacturing Engineering
The University of New South Wales
Sydney 2052, Australia
The University ofNew South WalesThe University ofNew South Wales Mälardalen U
Machine Monitoring and Diagnostics
• Information on condition to be brought from the inside to the outside of operating machines:
1. Vibration Analysis 2. Oil Analysis
This lecture concentrates on vibration analysis
The vibration signal can be used for:
1. Fault detection – Is there a significant change?
2. Fault diagnosis – What has caused the change?
3. Fault prognosis – How much longer can the machine be operated safely?
2
The University ofNew South WalesThe University ofNew South Wales Mälardalen U
Three Phases of Condition Monitoring
1. Fault detectionMust be able to detect a wide range of different possibilities from low to high frequency, with some variation in load and speed. Applied to all signals: therefore efficient. Can now be automated.
2. Fault DiagnosisOnly applied when a significant change is detected: therefore more detailed analysis can be carried out in a narrower frequency range. Some techniques can now be automated.
3. Fault prognosisMajor economic benefit comes from being able to predict remaining useful life (RUL). Least developed until now. Much can be achieved with data trending.
The University ofNew South WalesThe University ofNew South Wales Mälardalen U
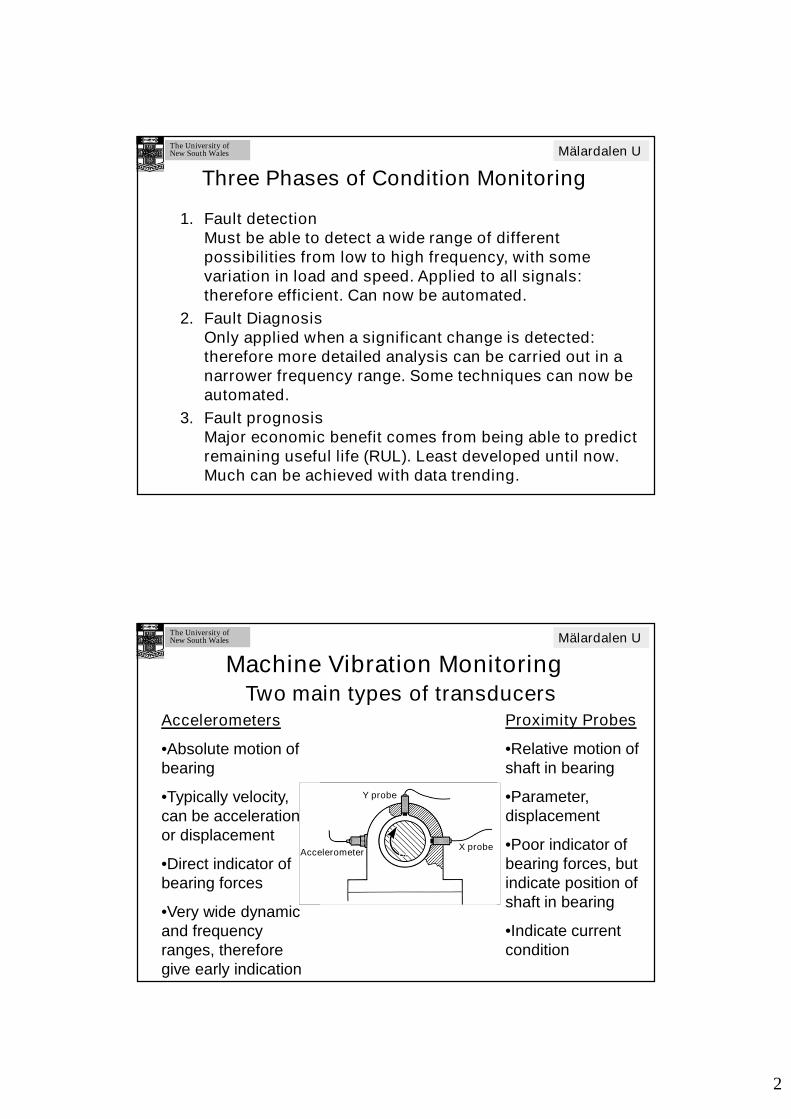
Machine Vibration MonitoringTwo main types of transducers
Accelerometers
•Absolute motion of bearing
•Typically velocity, can be acceleration or displacement
•Direct indicator of bearing forces
•Very wide dynamic and frequency ranges, therefore give early indication
Proximity Probes
•Relative motion of shaft in bearing
•Parameter, displacement
•Poor indicator of bearing forces, but indicate position of shaft in bearing
•Indicate current condition
X probe
Y probe
Accelerometer
3
The University ofNew South WalesThe University ofNew South Wales Mälardalen U
• Velocity pickups – Seismic transducers like accelerometers – voltage proportional to velocity –bulky – limited frequency range (10 Hz – 2 kHz)
• Laser (Doppler) transducers – measure absolute surface velocity – non-contacting, no mass loading of measurement object – quite bulky and not very portable – Possible to scan multiple points over a surface by deflecting laser beam – currently very expensive
• Acoustic emission (typically 100 kHz – 1 MHz) –piezoelectric transducer attached to surface – limited reproducibility – Difficult to calibrate
Machine Vibration MonitoringOther vibration transducers
The University ofNew South WalesThe University ofNew South Wales Mälardalen U
• Torsional vibration means rotational oscillations of shafts and rotors
• Can be measured in terms of angular displacement (phase modulation), angular velocity (frequency modulation) or angular acceleration
• Rotors have torsional springlike elements (shaft sections, couplings etc) and rotary inertias (discs, impellers, flywheels etc) and so have torsional natural frequencies and mode shapes, which can be excited by input and output torque fluctuations
• Local torsional vibrations may not be damaging but carry diagnostic information (engine misfires, gear transmission error)
Machine Vibration MonitoringTorsional vibration
4
The University ofNew South WalesThe University ofNew South Wales Mälardalen U
MACHINE DIAGNOSTICS
• Velocity signal usually best indicator of condition, since all vibrations represent an oscillation between kinetic energy (velocity squared) and potential energy (strain or stress squared).
• Maximum stress normally uniform so velocity spectrum tends to be flattest with frequency
• Changes at high or low frequency have an equal chance of affecting the overall velocity level, so velocity is best criterion of vibration severity
• Acceleration sometimes useful for emphasizing faults showing up at high frequencies, such as in rolling element bearings
• Best velocity transducer is an accelerometer and integrator
The University ofNew South WalesThe University ofNew South Wales Mälardalen U
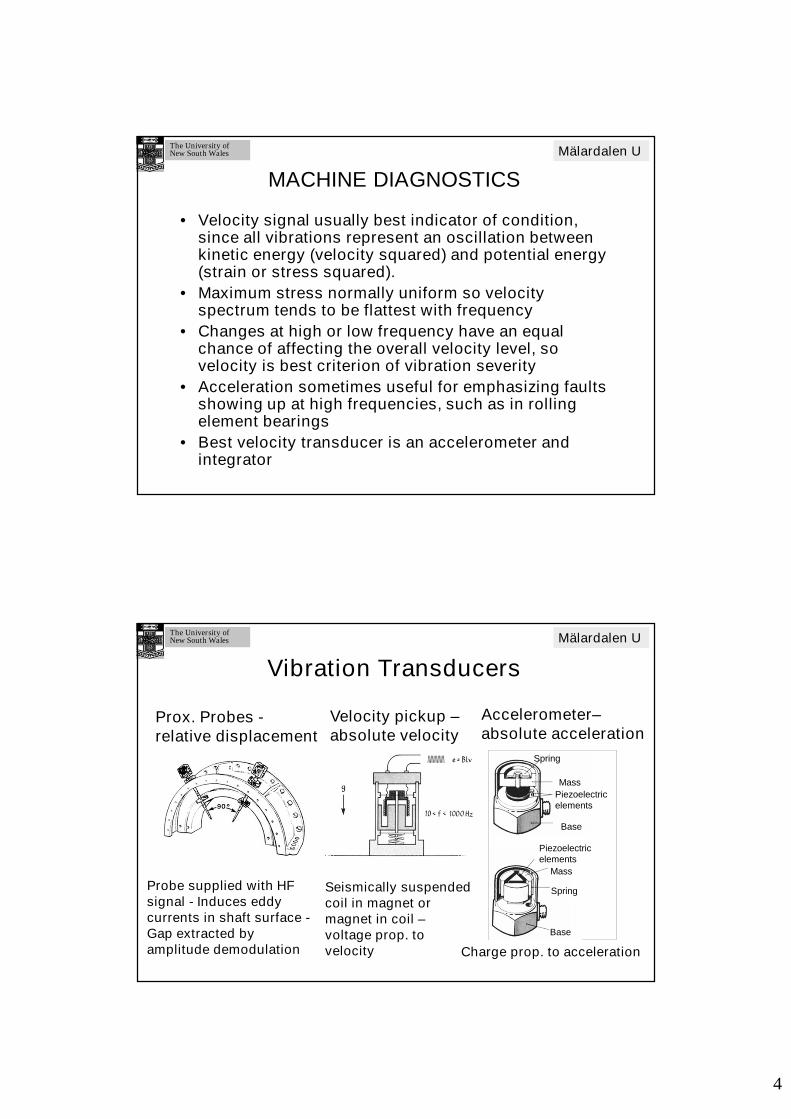
Vibration Transducers
Prox. Probes -relative displacement
Velocity pickup –absolute velocity
Accelerometer–absolute acceleration
Spring
Mass
Base
Mass
Base
Piezoelectricelements
Spring
Piezoelectricelements
Probe supplied with HF signal - Induces eddy currents in shaft surface -Gap extracted by amplitude demodulation
Seismically suspended coil in magnet or magnet in coil –voltage prop. to velocity Charge prop. to acceleration
5
The University ofNew South WalesThe University ofNew South Wales Mälardalen U
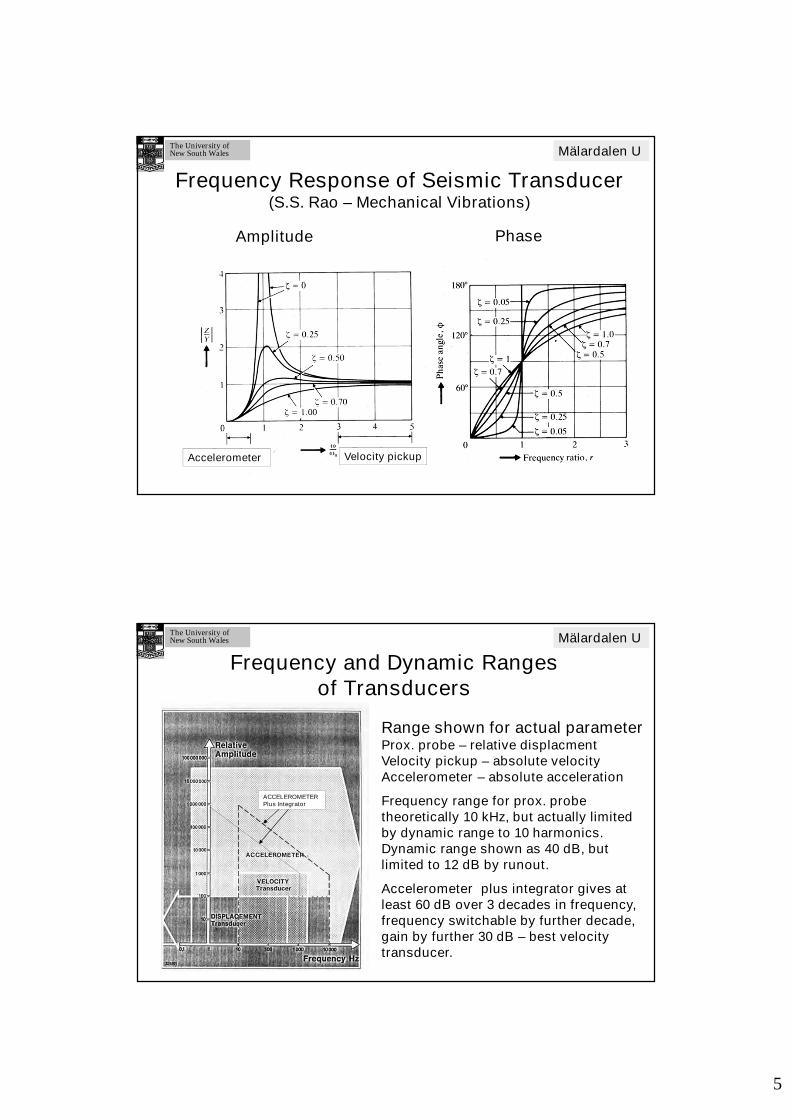
Frequency Response of Seismic Transducer(S.S. Rao – Mechanical Vibrations)
Accelerometer Velocity pickup
Amplitude Phase
The University ofNew South WalesThe University ofNew South Wales Mälardalen U
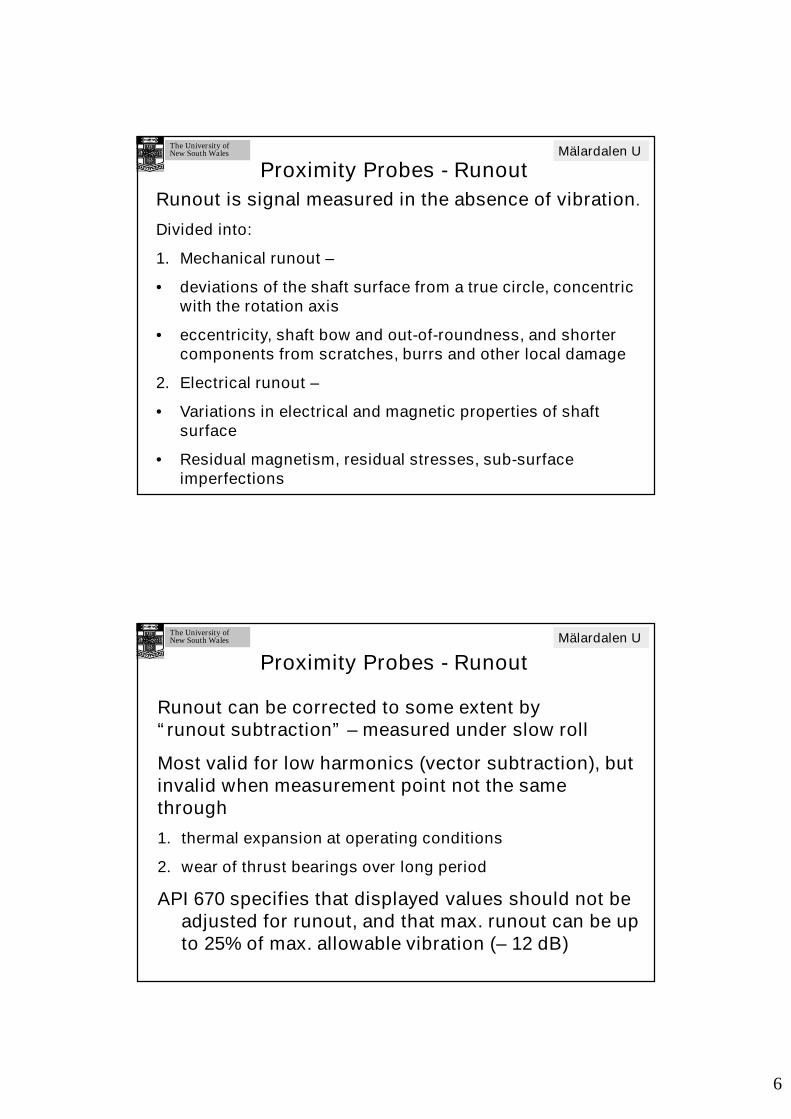
Frequency and Dynamic Ranges of Transducers
ACCELEROMETERPlus Integrator
Range shown for actual parameter Prox. probe – relative displacmentVelocity pickup – absolute velocityAccelerometer – absolute acceleration
Frequency range for prox. probe theoretically 10 kHz, but actually limited by dynamic range to 10 harmonics. Dynamic range shown as 40 dB, but limited to 12 dB by runout.
Accelerometer plus integrator gives at least 60 dB over 3 decades in frequency, frequency switchable by further decade, gain by further 30 dB – best velocity transducer.
6
The University ofNew South WalesThe University ofNew South Wales Mälardalen U
Proximity Probes - Runout
Runout is signal measured in the absence of vibration.
Divided into:
1. Mechanical runout –
• deviations of the shaft surface from a true circle, concentric with the rotation axis
• eccentricity, shaft bow and out-of-roundness, and shorter components from scratches, burrs and other local damage
2. Electrical runout –
• Variations in electrical and magnetic properties of shaft surface
• Residual magnetism, residual stresses, sub-surface imperfections
The University ofNew South WalesThe University ofNew South Wales Mälardalen U
Proximity Probes - Runout
Runout can be corrected to some extent by “runout subtraction” – measured under slow roll
Most valid for low harmonics (vector subtraction), but invalid when measurement point not the same through
1. thermal expansion at operating conditions
2. wear of thrust bearings over long period
API 670 specifies that displayed values should not be adjusted for runout, and that max. runout can be up to 25% of max. allowable vibration (– 12 dB)
7
The University ofNew South WalesThe University ofNew South Wales Mälardalen U
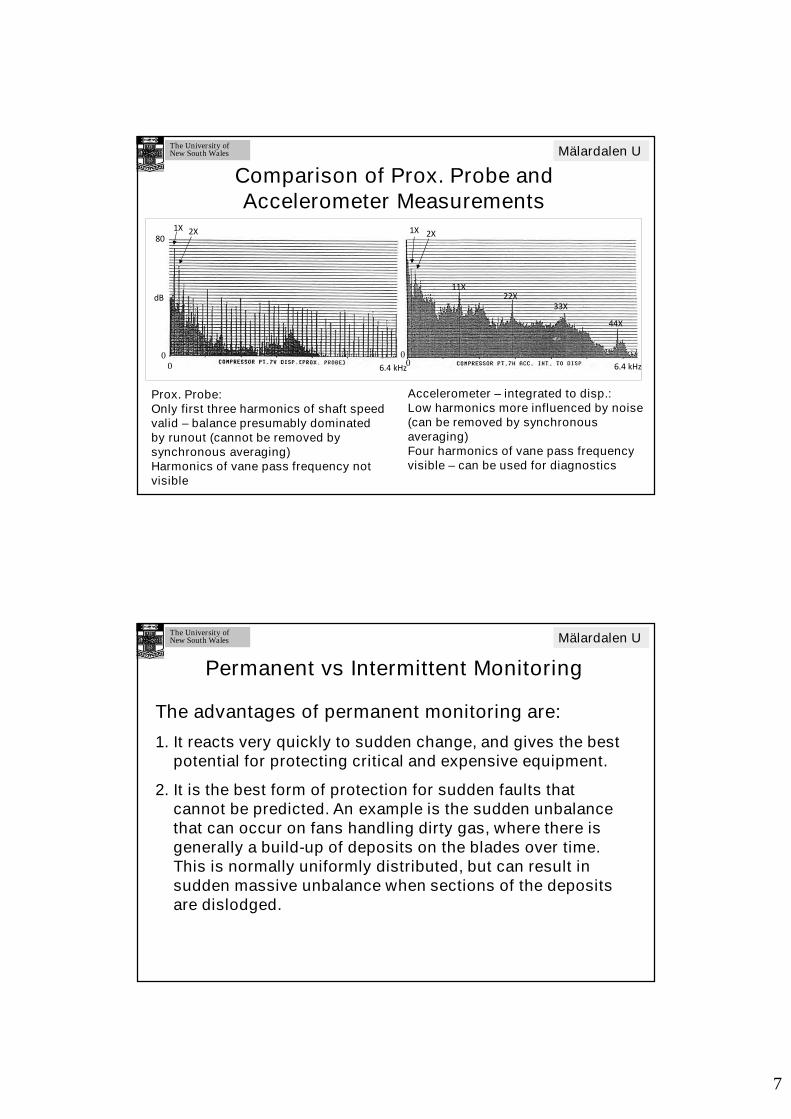
Comparison of Prox. Probe and Accelerometer Measurements
1X 2X80
dB
1X 2X
11X22X
33X
44X
6.4 kHz 6.4 kHz0 000
Prox. Probe:Only first three harmonics of shaft speed valid – balance presumably dominated by runout (cannot be removed by synchronous averaging)Harmonics of vane pass frequency not visible
Accelerometer – integrated to disp.:Low harmonics more influenced by noise (can be removed by synchronous averaging)Four harmonics of vane pass frequency visible – can be used for diagnostics
The University ofNew South WalesThe University ofNew South Wales Mälardalen U
Permanent vs Intermittent Monitoring
The advantages of permanent monitoring are:
1. It reacts very quickly to sudden change, and gives the best potential for protecting critical and expensive equipment.
2. It is the best form of protection for sudden faults that cannot be predicted. An example is the sudden unbalance that can occur on fans handling dirty gas, where there is generally a build-up of deposits on the blades over time. This is normally uniformly distributed, but can result in sudden massive unbalance when sections of the deposits are dislodged.
8
The University ofNew South WalesThe University ofNew South Wales Mälardalen U
Permanent vs Intermittent Monitoring
The disadvantages of permanent monitoring are:
•The cost of having permanently mounted transducers is very high –can only be applied to the most critical machines in a plant.
•Where the transducers are proximity probes, they virtually have to be built in to the machine at the design stage.
•Since the reaction has to be very quick, permanent monitoring is normally based on relatively simple parameters, eg
1. overall RMS or peak vibration level
2. phase of low harmonics of shaft speed relative to a “key phasor”
In general such simple parameters do not give much advance warning of impending failure; it is likely to be hours or days, as opposed to the weeks or months lead time that can be given by advanced diagnostic techniques
The University ofNew South WalesThe University ofNew South Wales Mälardalen U
Permanent vs Intermittent Monitoring
A very large number of machines can be monitored intermittently with a single transducer and data logger, and the data downloaded to a monitoring system capable of carrying out detailed analysis.
The advantages of intermittent monitoring are:
•Much lower cost of monitoring equipment.
•The potential (through detailed analysis) to get much more advance warning of impending failure - plan maintenance work and production to maximize availability of equipment.
•Applied primarily where the cost of lost production from failure of the machine completely outweighs the cost of the machine itself.
9
The University ofNew South WalesThe University ofNew South Wales Mälardalen U
Permanent vs Intermittent Monitoring
The disadvantages of intermittent monitoring are:
•Sudden rapid breakdown may be missed, and in fact where failure is completely unpredictable this technique should not be used.
•The lead time to failure may not be as long as possible if the monitoring intervals are too long for economic reasons. This is in fact an economic question, balancing the benefits of increased lead time against the extra cost of monitoring more frequently
•Note that with permanently mounted transducers, intermittent detailed analysis can be made frequently to get the best of both worlds
The University ofNew South WalesThe University ofNew South Wales Mälardalen U
Vibration Severity Criteria
Historical criteria:
1. Rathbone (1939) “Vibration Tolerance”, Power Plant Engineering, 43, pp. 721 – determined empirically, approx. constant velocity, tending towards constant displacement at low frequency and constant acceleration at high frequency.
2. H.G. Yates (1949) “Vibration diagnosis in marine geared turbines”, Trans. North East Coast Inst. Eng. Shipbuilders – reasoned that constant velocity corresponded to constant stress for given mode shape (size independent).
3. IRD General Machinery Criterion Chart – constant velocity, similar to Yates
10
The University ofNew South WalesThe University ofNew South Wales Mälardalen U
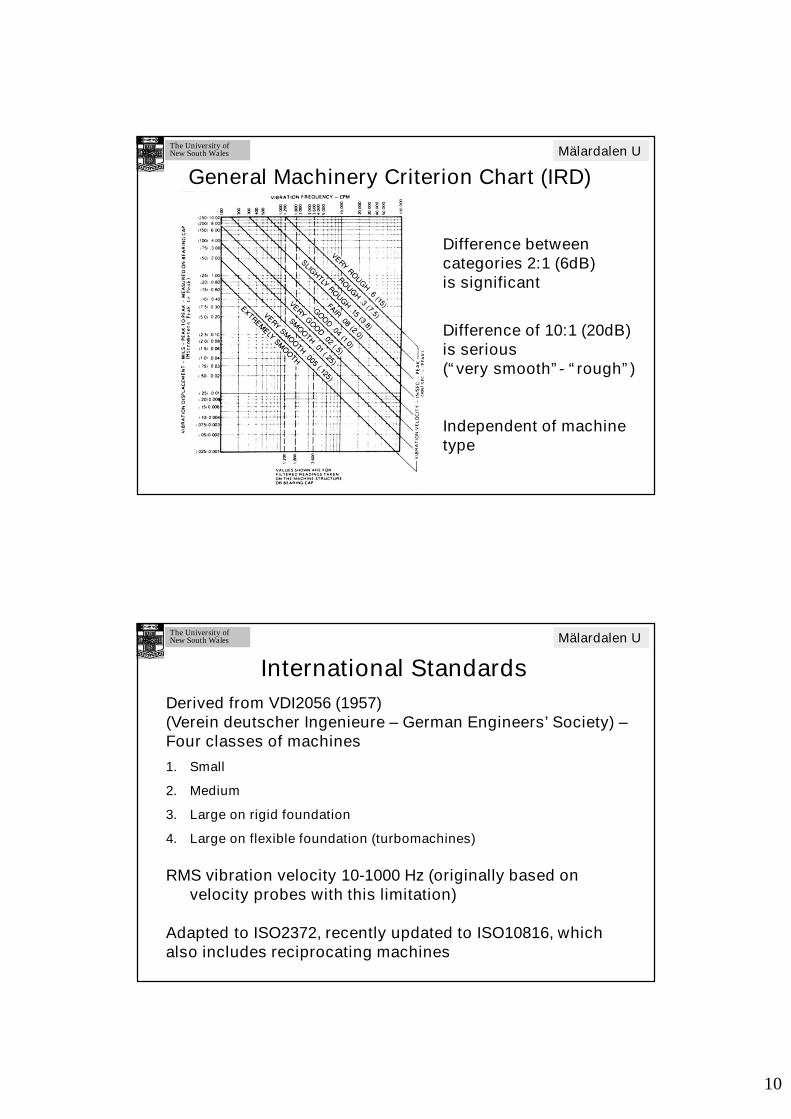
General Machinery Criterion Chart (IRD)
Difference between categories 2:1 (6dB)is significant
Difference of 10:1 (20dB) is serious(“very smooth”- “rough”)
Independent of machine type
The University ofNew South WalesThe University ofNew South Wales Mälardalen U
International Standards
Derived from VDI2056 (1957)(Verein deutscher Ingenieure – German Engineers’ Society) –Four classes of machines
1. Small
2. Medium
3. Large on rigid foundation
4. Large on flexible foundation (turbomachines)
RMS vibration velocity 10-1000 Hz (originally based on velocity probes with this limitation)
Adapted to ISO2372, recently updated to ISO10816, which also includes reciprocating machines
11
The University ofNew South WalesThe University ofNew South Wales Mälardalen U
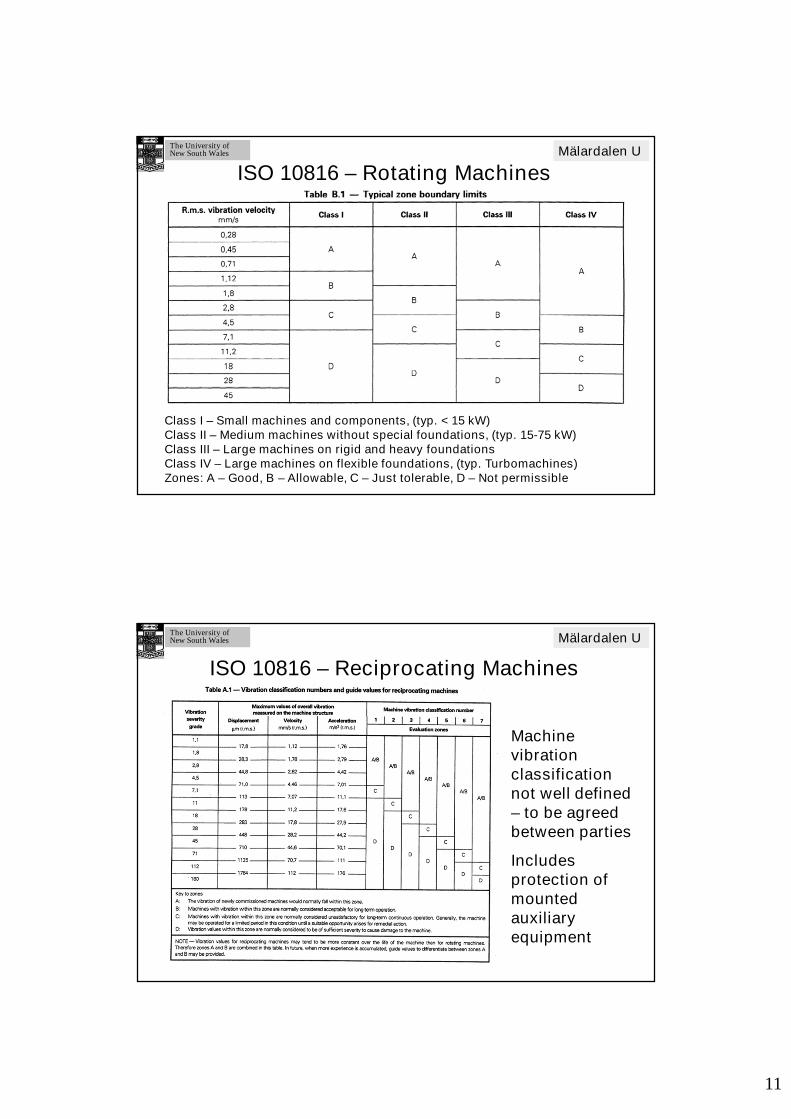
ISO 10816 – Rotating Machines
Class I – Small machines and components, (typ. < 15 kW) Class II – Medium machines without special foundations, (typ. 15-75 kW)Class III – Large machines on rigid and heavy foundationsClass IV – Large machines on flexible foundations, (typ. Turbomachines)Zones: A – Good, B – Allowable, C – Just tolerable, D – Not permissible
The University ofNew South WalesThe University ofNew South Wales Mälardalen U
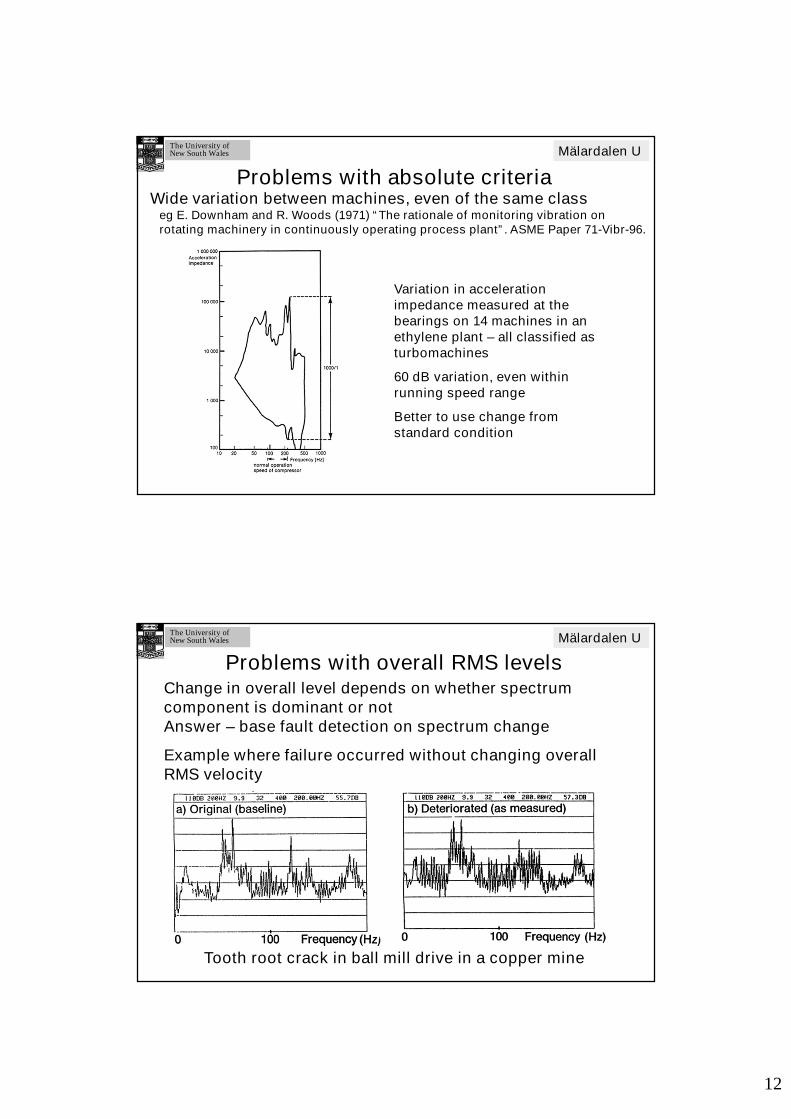
ISO 10816 – Reciprocating Machines
Machine vibration classification not well defined – to be agreed between parties
Includes protection of mounted auxiliary equipment
12
The University ofNew South WalesThe University ofNew South Wales Mälardalen U
Problems with absolute criteriaWide variation between machines, even of the same class
eg E. Downham and R. Woods (1971) “The rationale of monitoring vibration on rotating machinery in continuously operating process plant”. ASME Paper 71-Vibr-96.
Variation in acceleration impedance measured at the bearings on 14 machines in an ethylene plant – all classified asturbomachines
60 dB variation, even within running speed range
Better to use change from standard condition
The University ofNew South WalesThe University ofNew South Wales Mälardalen U
Problems with overall RMS levelsChange in overall level depends on whether spectrum component is dominant or notAnswer – base fault detection on spectrum change
Example where failure occurred without changing overall RMS velocity
Tooth root crack in ball mill drive in a copper mine
13
The University ofNew South WalesThe University ofNew South Wales Mälardalen U
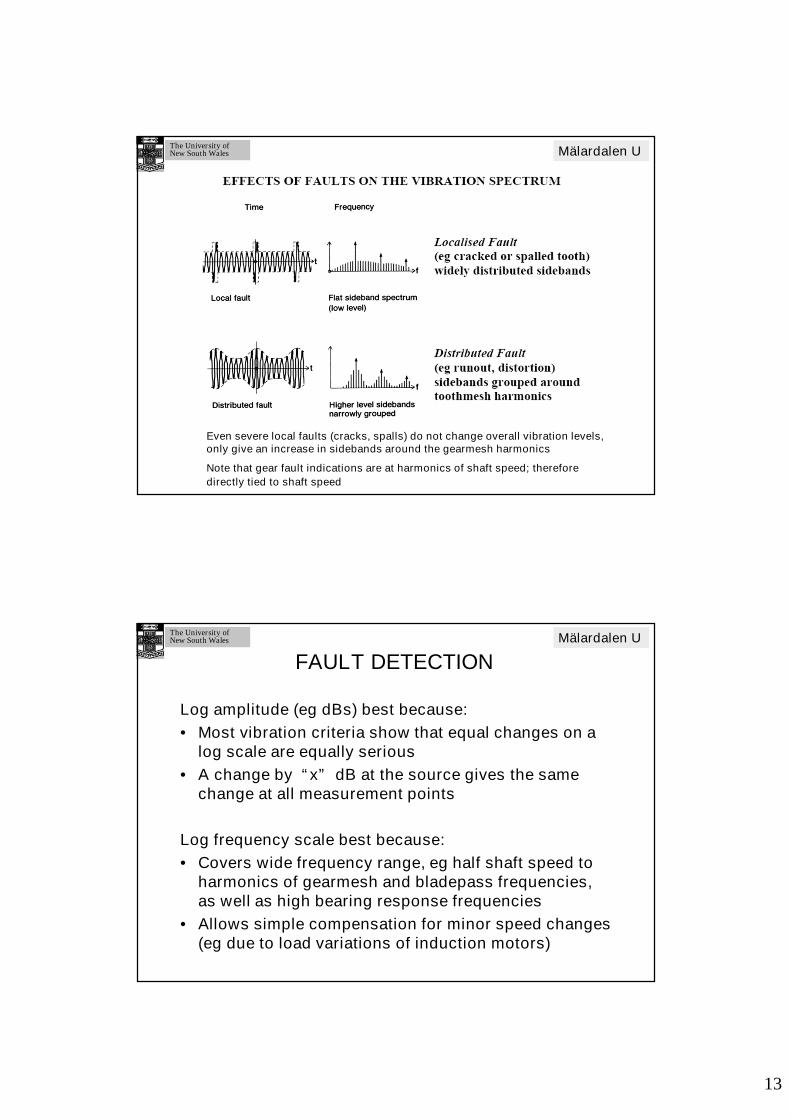
Even severe local faults (cracks, spalls) do not change overall vibration levels, only give an increase in sidebands around the gearmesh harmonics
Note that gear fault indications are at harmonics of shaft speed; therefore
directly tied to shaft speed
The University ofNew South WalesThe University ofNew South Wales Mälardalen U
FAULT DETECTION
Log amplitude (eg dBs) best because:
• Most vibration criteria show that equal changes on a log scale are equally serious
• A change by “x” dB at the source gives the same change at all measurement points
Log frequency scale best because:
• Covers wide frequency range, eg half shaft speed to harmonics of gearmesh and bladepass frequencies, as well as high bearing response frequencies
• Allows simple compensation for minor speed changes (eg due to load variations of induction motors)
14
The University ofNew South WalesThe University ofNew South Wales Mälardalen U
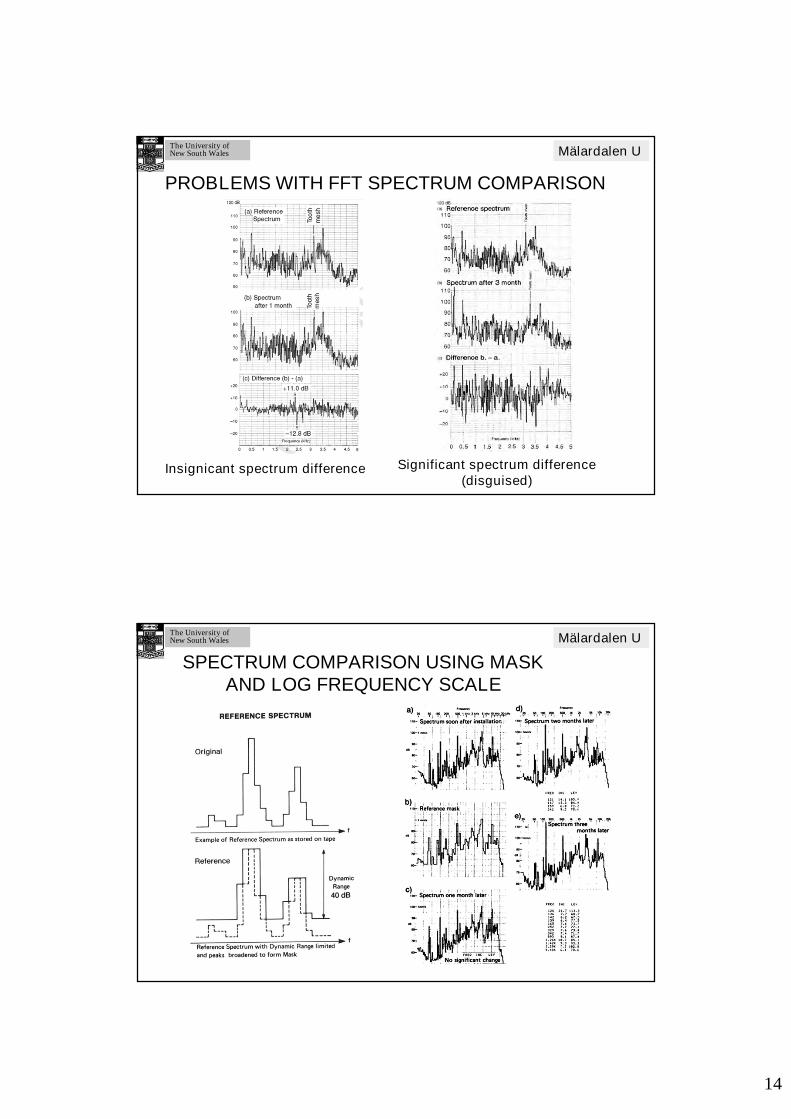
PROBLEMS WITH FFT SPECTRUM COMPARISON
Insignicant spectrum difference Significant spectrum difference (disguised)
The University ofNew South WalesThe University ofNew South Wales Mälardalen U
SPECTRUM COMPARISON USING MASK AND LOG FREQUENCY SCALE
15
The University ofNew South WalesThe University ofNew South Wales Mälardalen U
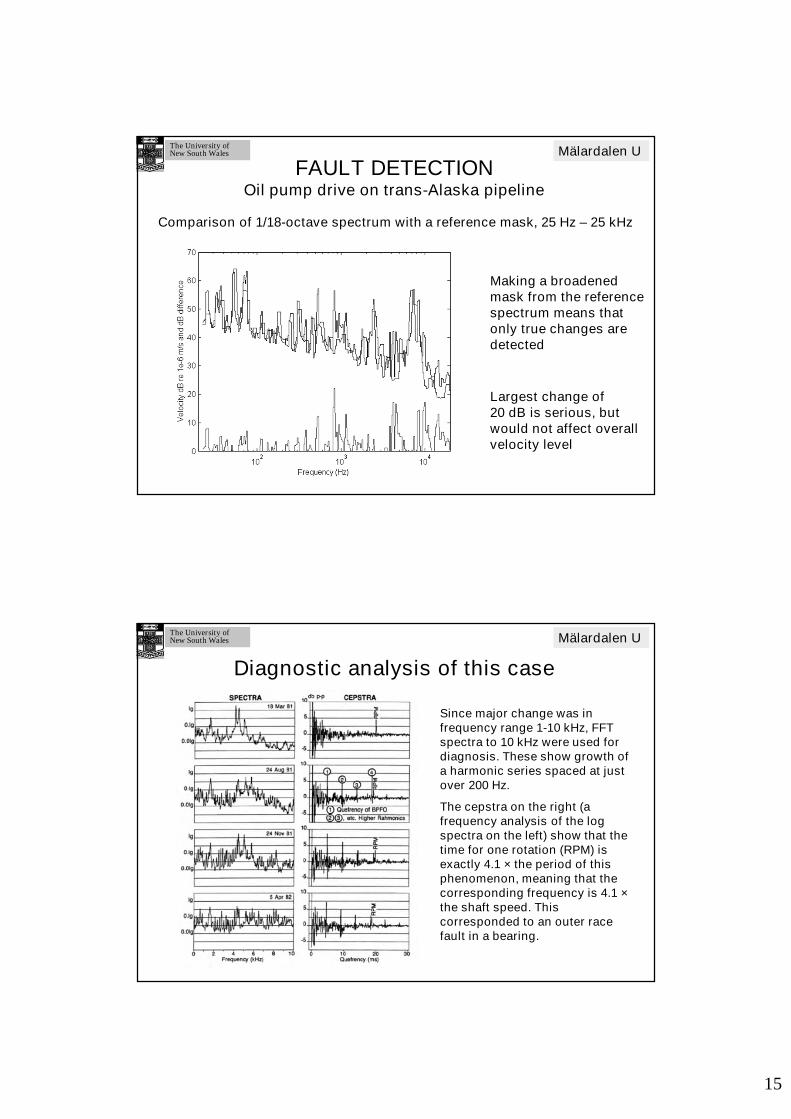
FAULT DETECTIONOil pump drive on trans-Alaska pipeline
Comparison of 1/18-octave spectrum with a reference mask, 25 Hz – 25 kHz
Making a broadened mask from the reference spectrum means that only true changes are detected
Largest change of 20 dB is serious, but would not affect overall velocity level
The University ofNew South WalesThe University ofNew South Wales Mälardalen U
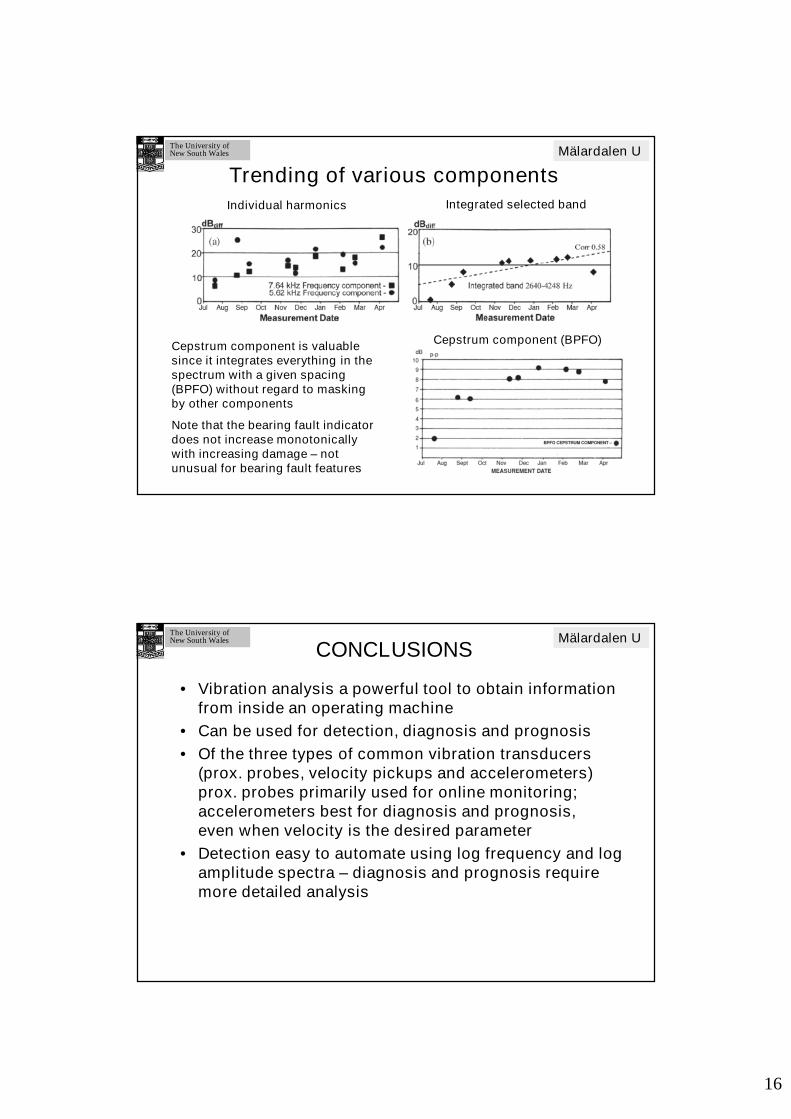
Diagnostic analysis of this case
Since major change was in frequency range 1-10 kHz, FFT spectra to 10 kHz were used for diagnosis. These show growth of a harmonic series spaced at just over 200 Hz.
The cepstra on the right (a frequency analysis of the log spectra on the left) show that the time for one rotation (RPM) is exactly 4.1 × the period of this phenomenon, meaning that the corresponding frequency is 4.1 ×the shaft speed. This corresponded to an outer race fault in a bearing.
16
The University ofNew South WalesThe University ofNew South Wales Mälardalen U
Trending of various components
Individual harmonics Integrated selected band
Cepstrum component (BPFO)Cepstrum component is valuable since it integrates everything in the spectrum with a given spacing (BPFO) without regard to masking by other components
Note that the bearing fault indicator does not increase monotonically with increasing damage – not unusual for bearing fault features
The University ofNew South WalesThe University ofNew South Wales Mälardalen U
CONCLUSIONS
• Vibration analysis a powerful tool to obtain information from inside an operating machine
• Can be used for detection, diagnosis and prognosis
• Of the three types of common vibration transducers(prox. probes, velocity pickups and accelerometers)prox. probes primarily used for online monitoring;accelerometers best for diagnosis and prognosis,even when velocity is the desired parameter
• Detection easy to automate using log frequency and log amplitude spectra – diagnosis and prognosis require more detailed analysis
17
The University ofNew South WalesThe University ofNew South Wales Mälardalen U
CONCLUSIONS (cont.)
• Fault detection of rotating machines best done on logfrequency and log amplitude (or dB) scales with compensation for small speed changes
• Permanent online monitoring primarily to protectexpensive machines
• Intermittent monitoring and analysis (possibly from anonline system) gives most diagnostic and prognosticpower through detailed analysis
References (unlisted):R.B. Randall, (2011) “Vibration-based Condition Monitoring: Industrial, Aerospace and Automotive Applications”, published by Wiley (Chichester, UK) January.
Top Related