


Languages
Pages
Legal

/Y0, (06
AN INVESTIGATION OF THE RATIO OF FREE TO BOUND PHENYTOIN IN
OVERDOSE CASES
THESIS
Presented to the Graduate Council of the North Texas State
University in Partial Fulfillment of the Requirements
For the Degree of
MASTER OF SCIENCE
by
Mona Lee Beckman Royder, B.S.
Denton, Texas
August, 1985

Royder, Mona L. Beckman. An Investigation of the Ratio
of Free to Bound Phenytoin in Overdose Cases. Master of
Science (Basic Health Sciences), August, 1985, 54 pp., 18
tables, 3 figures, bibliography, 47 titles.
An investigation of the ratio of free to bound
phenytoin in overdose cases was accomplished by three
studies to answer these questions:
1. Will the free to bound ratio change with
increasing total phenytoin concentration?
2. Will the free to bound ratio be altered with
decreasing total protein concentration?
3. Do these results correlate with overdose cases?
The results demonstrated that the ratio of free to
bound phenytoin remains constant throughout the therapeutic
range as long as a person has a normal total protein
concentration. However, the free to bound ratio changes
significantly when the total protein decreases by 25 per
cent. This substantiates the importance of monitoring free
and total phenytoin concentrations in hypoproteinemia.

TABLE OF CONTENTS
Page
LIST OF TABLES.... . . . . . . . . . . . . . v
LIST OF ILLUSTRATIONS . . . . . . . . . . . . vii
Chapter
I. INTRODUCTION . . . . . . . . . . . . 1
Chemical and Physical Properties ofPhenytoin . . . . . . . . . . . . . 1
Physiologic Disposition of Phenytoin. 3Changes in Ratio of Free to Bound
Phenytoin due to Variation inProtein Binding . . . . . . . . . . 7
Changes in Ratio of Free to BoundPhenytoin due to Drug-DrugInteractions . . . . . . . . . . . 11
Changes in Ratio of Free to BoundPhenytoin due to Various Patho-physiologic Factors . . . . . . . . 14
II. MATERIALS AND METHODS . . . . . . . . 18
Experimental Design . . . . . . . . . 18Materials . . . . . . . . . . . . . . 18
Animals . . . . . . . . . . . . . . 18Equipment . . . . . . . . . . . . . 19Chemicals and Other Supplies . . . 19
Experiment I. Determination of theChanges in Ratio of Free to BoundPhenytoin with Various Standardsand Total Protein Concentration . . 20Sample Preparation . . . . . . . . 20
Experiment II. Determination of theChanges in Ratio of Free to BoundPhenytoin in Laboratory Animals . . 22
Experiment III. Determination of theChanges in Ratio of Free to BoundPhenytoin in Human Overdose Cases 23
Analysis of Samples . . . . . . . . . 24
III. RESULTS AND DISCUSSION . . . . . . . 28
Experiment I. Evaluation of theChanges in Ratio of Free to BoundPhenytoin with Various Standardsand Total Protein Concentrations . 28
iii

Experiment II. Evaluation of theChanges in Ratio of Free to BoundPhentyoin in Laboratory Animals . . 30
Experiment III. Evaluation of theChanges in Ratio of Free to BoundPhentyoin in Human Overdose Cases . 30
IV. CONCLUSION . . . . . . . . . . . . . 51
LITERATURE CITED ........................... 53
iv

LIST OF TABLES
Page
Table
I. Group 1. Total and Free PhenytoinConcentrations in Plasma withCorresponding Free to Bound Ratios -Gas Chromatography . . . . . . . . . 34
II. Group 2. Total and Free PhenytoinConcentrations in Plasma withCorresponding Free to Bound Ratios -Gas Chromatography . . . . . . . . . . 35
III. Group 3. Total and Free PhenytoinConcentrations in Plasma withCorresponding Free to Bound Ratios -Gas Chromatography . . . . . . . . . . 36
IV. Group 4. Total and Free PhenytoinConcentrations in Plasma withCorresponding Free to Bound Ratios -Gas Chromatography . . . . . . . . . . 37
V. Group 1. Total and Free PhenytoinConcentrations in Plasma withCorresponding Free to Bound Ratios -Emit Study . . . . . . . . . . . . . . 38
VI. Group 2. Total and Free PhenytoinConcentrations in Plasma withCorresponding Free to Bound Ratios -Emit Study . . . . . . . . . . . . . . 39
VII. Group 3. Total and Free PhenytoinConcentrations in Plasma withCorresponding Free to Bound Ratios -Emit Study . . . . . . . . . . . . . . 40
VIII. Group 4. Total and Free PhenytoinConcentrations in Plasma withCorresponding Free to Bound Ratios -Emit Study . . . . . . . . . . . . . . 41
IX. Group 1. Total and Free PhenytoinConcentrations in Plasma withCorresponding Free to Bound Ratios -TDX Study . . . . . . . . . . . . . . 42
V

X. Group 2. Total and Free PhenytoinConcentrations in Plasma withCorresponding Free to Bound RatiosTDX Study . . . . . . . . . . . . . . 43
XI. Group 3. Total and Free PhenytoinConcentrations in Plasma withCorresponding Free to Bound Ratios -TDX Study . . . . . . . . . . . . . . 44
XII. Group 4. Total and Free PhenytoinConcentrations in Plasma withCorresponding Free to Bound Ratios -TDX Study . . . . . . . . . . . . . . 45
XIII. Total and Free Phenytoin ConcentrationsPlasma of Laboratory Rats withCorresponding Free to Bound Ratios . . 46
XIV. Patient A. Normal Total ProteinConcentration . . . . . . . . . . . . 47
XV. Patient B. Decreased Total ProteinConcentration . . . . . . . . . . . . 47
XVI. Descriptive Statistics for Each Measure-ment Technique . . . . . . . . . . . . 48
XVII. Correlation Between the Free to BoundRatio and Total Protein Concen-tration . . . . . . . . . . . . . . . 49
XVIII. Correlation Between the Free to BoundRatio and Total Phenytoin Concen-tration.......................... ... 50
vi

LIST OF ILLUSTRATIONS
Figure Page
1. :Biotransformation of Phenytoin toMetabolites . . .. . . . . . . . . 5
2. Drug Absorption and Distribution . . . 9
3. :Relationship of Free to Bound PhenytoinRatio with Protein Concentrations. . 31
vii
_ __ __ _ _
CHAPTER I
INTRODUCT ION
At least two million Americans suffer from one or more
of the many forms of epilepsy, a collection of seizures
disorders equally common worldwide (1) . However,
antiepileptic drug therapy provides some seizure control
for only about seventy to eighty percent and complete
control for not more than fifty per cent of the affected
population (2). The most significant progress in terms of
therapeutic efficacy came with the introduction of
phenobarbital in 1912 (3) and diphenylhydantoin in 1938
(4). The discovery of diphenylhydantoin by Merritt and
Putnam was significant, not only because of its immediate
therapeutic application, but it provided the first evidence
of the selective nature of antiepileptic therapy.
Phenytoin proved somewhat effective in the treatment of
complex partial seizures (grand mal). Because it is not a
sedative, phenytoin was also responsible for the
recognition that sedation is not a requisite for
anticonvulsant efficacy (5).
CHEMICAL AND PHYSICAL PROPERTIES
Phenytoin is the generic name for 5, 5-diphenyl--
hydantoin (acid form), commonly know as Dilantin.
1

2
The free acid has a molecular weight of 252.26; the sodium
salt has a molecular weight of 274.25, phenytoin acid
represents of 91.98 per cent of the total weight of the
sodium salt form (14). The acid form is used in
formulations of aqueous suspensions containing 30 mg or 125
mg of phenytoin acid per 5 ml (pediatric Dilantin-30
Suspension and Dilantin-125 Suspension). This form is also
used in formulating chewable tablets containing 50 mg
phenytoin acid per tablet (Dilantin Infatabs). However,
most preparations are expressed in terms of the sodium
salt. Therefore, the gelatin capsules are formulated to
contain either 30 mg or 100 mg of phenytoin sodium
(Dilantin Sodium Kapseals = 27.6 mg or 92.0 mg of phenytoin
acid equivalents) per capsule. This 8 per cent difference
must be taken into account when changing from one product
3
to another for equivalent dosing (6).
Phenytoin is a weak organic acid that is almost
insoluble in water. The apparent dissociation constant
(pKa'), representing the pH at which half the drug is
ionized, was found to be in the range of 8.3 to 9.2 by
nonaqueous titration in early studies (7, 8). Studies by
Schwartz, et.al. (9) on solubility measurements indicated a
true pKa' of 8.06 in water. Thus, at physiologic pH (pH of
gastrointestinal tract is 2 - 7, plasma is 7.4) phenytoin
exists primarily as the free acid and favors lipophilic
partitioning.
PHYSIOLOGIC DISPOSITION OF PHENYTOIN
Phenytoin is rapidly and passively absorbed across the
intestinal mucosa in the nonionized form, but absorption is
limited by its extremely low solubility in gastrointestinal
fluids. Absorption is a nonlinear saturation process which
occurs only as the drug is cleared from the plasma and as
it goes into solution in the intestinal fluids (10). When
phenytoin enters the blood, it becomes extensively bound to
plasma proteins (80-90 per cent), but the free form enters
all tissues, such as the liver, brain, and muscle, where it
is bound to cellular proteins and phospholipids. Total
concentrations of the drug are higher in these tissues than
in the extracellular fluid, but the free concentrations of
phenytoin in transcellular fluids such as CSF,
gastrointestinal fluids, bile, saliva, semen, milk and

4
plasma remain equivalent to the free concentration in the
blood (10).
Drugs, such as salicylates, thyroxine, phenylbutazone
and others can alter phenytoin binding to plasma proteins
by competing for a common binding site on the protein (11).
The plasma half-life of phenytoin in the body is defined
as the time it takes for the concentration of the drug in
plasma, at the time of its peak concentration after a
single dose or the steady-state concentration after
multiple doses, to decline by fifty per cent (10). In
human, the half-life after oral administration of doses
that result in therapeutic concentrations averages
approximately 22.0 hours. The literature reports a range
of 7.0 to 42.0 hours (12, 15). The half-life is dose
dependent and obeys saturation (Michaelis-Menten) kinetics.
This may be altered by drugs that compete for binding or
inhibit or accelerate biotransformation of the drug in the
liver. Large doses of phenytoin that saturate the enzyme
that biotransforms the drug in the liver will also increase
the plasma half-life (10).
Phenytoin is eliminated almost entirely by metabolic
transformation prior to excretion in the form of
metabolites (14). Less than five per cent of the
administered dose is excreted unchanged in the urine (13,
15). On the basis of known metabolites established to
date, the most likely pathways involved in the

5
HN HN CO2H
NH NH20
Phenyton
O
\/ \/n n
Arene oxide intermediate
OPH A
OH
N/\ /HN 0
5 p-Hydrowyphonyl).5.phenythyuinnto{p-HPPH)
HO
0HN
5-I 4m.Hydroxyphenyls-5pinetIhy$nnn m (m-HPPH)
HO OHH H
\/ \/0HN
5-
3.4
Oihyr$roey-1.5-cyclohexadren.-yf)-5-phenylhydantoin (dihydrodioll
OH 0
HAD
NH( Catechol )
Fig. I. Biotransformation of phenytoin

6
biotransformation of phenytoin are shown in Fig. 1 (14).
Phenytoin is excreted in the urine by glomerular
filtration and undergoes tubular resorption.
5-p-hydroxyphenyl-5-
phenylhydantion (HPPH) its major metabolite is excreted by
glomerular filtration and tubular secretion and obeys
saturation kinetics (10). HPPH represents approximately
seventy per cent of the total phenytoin excreted.
During the absorption phase, most of the drug is
excreted in the bile as conjugates and/or metabolites which
are then hydolyzed and reabsorbed from the intestinal tract
by enterohepatic circulation and finally excreted in the
urine; very little drug is lost in the feces (10).
The therapeutic range for total phenytoin established
in the literature is 10-20 ug/ml (6). No therapeutic range
has been established for the free, unbound phenytoin.
Since approximately 80-90 per cent of the drug is bound to
plasma proteins, the therapeutic range for free, unbound
phenytoin is expected to be 1-2 ug/ml.
In 1973, Booker and Darcey (16) proposed that clinical
signs of phenytoin intoxication should correlate more
accurately with the free rather than the total
concentration of phenytoin in plasma. Their study was
comprised of 25 patients receiving various dosages of
sodium phenytoin. Of these patients, 12 developed toxic
symptoms characterized by horizontal and vertical

7
nystagmus, dysmetria and slurred speech. Of the 12
patients exhibiting toxic symptoms, three were reported to
have total phenytoin concentrations within the normal
therapeutic range established in the literature of 10-20
ug/ml and free phenytoin concentrations well above the
expected range of 1-2 ug/ml. The remaining nine patients
exhibited free phenytoin concentrations within the expected
range of 1-2 ug/ml. Subsequent investigations have
strongly suggested that the free, unbound fraction of
phenytoin is responsible for the physiologic action of the
drug and should be the logical choice for therapeutic drug
monitoring (16, 17). Typically, free phenytoin
concentrations increase dramatically when the total
phenytoin concentrations exceed 20 ug/ml (16). However,
definite clinical signs of intoxication have been reported
with total plasma phenytoin concentrations as low as 13
ug/ml in humans (16). Evidence in the literature suggests
that this is due to the great variance in protein binding
of phenytoin (17, 18). In addition, various drugs and
disease states may alter the degree of binding in humans
(19, 20, 21, 22, 23) and subsequently change the ratio of
free to bound drug.
CHANGES IN RATIO OF FREE TO BOUND PHENYTOIN DUE TO
VARIATION IN PROTEIN BINDING
While there is a general agreement that a direct
relationship exists between total phenytoin serum

8
concentrations and degree of clinical intoxication, there
are frequent exceptions, as reported by Booker and Darcey
(16). Patients with low total phenytoin concentrations may
show signs of toxicity while others with high
concentrations may be free of any significant degree of
intoxication (16). On entering the circulatory system,
phenytoin is rapidly and reversibly bound to plasma
proteins. In humans, the average is approximately ninety
per cent (17, 24). Many researchers have reported that
individual differences in the per cent of binding exists
(17, 25). Since the pharmacologic properties of phenytoin
are due to the free, unbound fraction, individual
differences in the degree of protein binding may explain
the variation reported in the relationship between total
phenytoin concentration and the degree of clinical
intoxication.
An equilibrium exists between the free phenytoin
present in plasma that is also present in the tissues, and
the amount of phenytoin bound to the plasma protein (26).
Pippenger (26) reports that as free phenytoin is cleared
from plasma into tissues there is a dissociation of protein
bound drug to maintain the equilibrium between the free and
bound phenytoin concentrations. When all of the tissue
sites capable of binding phenytoin have been occupied, the
fixed ratio of free to bound drug at steady-state occurs;
then the quantity of phenytoin that is free in the cellular

Q]
~~4U
B#
C C-
CD -u
-
\ \ \\ ~)
U.0
Ea,
-I-w
LL
w
0
w-
xJ
z0
CO
z
0H
0CL
(5
Dcc
C4
o"0C,~ 40
:p.'
9
o zozm
"7
. wrL 0
aw E
- 3
6t.
r0
0
0
Cr
"
"
aO.0
i
jjjH '111111 IG IftI
.. w"
,.
r--- -
!
F

10
water will be in equilibrium with the free drug in plasma.
Because at steady state all available binding sites are
occupied, the equilibrium between free and bound phenytoin
remains relatively constant (Fig. 2).
Any factor that can change the affinity of phenytoin
for its binding site will cause a new equilibrium to be
established between the free and bound drug (26).
Pippenger (26) reports that the amount of drug bound to
plasma proteins depends on the number of available protein
binding sites. As the total concentration of protein bound
phenytoin in plasma increases, the available albumin sites
approach saturation. If all the binding sites become
occupied, an increase in drug dose may cause a substantial
increase in the free phenytoin concentration, even though
the total concentration in plasma is increased only
slightly. Pippenger (26) emphasizes that for drugs that
are eighty per cent or more protein bound, small changes in
free concentrations will exhibit marked changes of the
observed pharmacological effects. Phenytoin binding to
plasma proteins is regulated by electrostatic and spatial
interactions between drug and protein molecules. Pippenger
(26) reports that an electrostatic interaction occurs
between phenytoin, whose electrical charge is determined by
the chemical nature, and the charged amino acid residues
that are located on the external surface of the protein
molecule. The -NH3+ of lysine and other N-terminal amino

11
acids, along with the COO- of aspartic and glutamic acid
are residues capable of establishing an electric field.
The extent of the electrostatic field established around
the protein molecule is determined by the charged amino
acid residues of a certain protein. It has been
established that the forces may provide for the attraction
and positioning of phenytoin as it approaches the
electrostatic field of the protein before it binds (26).
Furthermore, van der waals bonds and hydrogen bonding
appear to be responsible for achieving a stable
drug-protein complex. Support for this concept is
suggested by the three dimensional structure of protein.
CHANGES IN RATIO OF FREE BOUND PHENYTOIN DUE TO DRUG-DRUG
INTERACTIONS
Pharmacological studies in humans have demonstrated
that various drugs alter the ratio of free to bound
phenytoin in plasma. Many interactions have been
documented in the literature (24, 27). Pharmacokinetic
interactions often become evident by the appearance of
signs of intoxication in patients receiving common doses of
phenytoin in combination with another drug. Drugs often
administered to epileptic patients such as salicylates
(20), valproic acid (28), phenylbutazone (11), as well as
endogenous compounds such as fatty acids (21) will displace
phenytoin from the plasma proteins and may cause serious

12
drug interactions and toxicity due to an increased free,
unbound fraction.
The narrow therapeutic index of phenytoin and the
steep dose-plasma relationship makes drug interactions an
important concern. Of particular interest are those in
which phenytoin metabolism is inhibited, and these include
interactions with sulthiame (27), coumarin anticoagulants
(29), and chloramphenicol (30). These drug interactions
are caused by an inhibition of the hepatic mixed
function-oxidase system which catalyzes phenytoin
biotransformation. The antipyretic anti-inflammatory
analgesics in use today have chemical properties of weak
acids. Most of them are highly bound to plasma proteins,
the degree of binding being approximately 95-99.6 per cent
for many derivatives (31). Therefore, displacement of
phenytoin from the binding sites on plasma proteins may
occur due to its similar chemical nature when taken
simultaneously with analgesics. Phenylbutazone and
salicylic acid have been documented in the literature to
increase the concentration of unbound phenytoin in vitro
two to threefold (19). In vivo, such displacement might be
expected to eventually lower the total plasma concentration
of phenytoin decreased by a transient increase in the
unbound fraction that is of clinical interest. However,
both total and free plasma phenytoin concentrations then
decrease because the free plasma phenytoin is more

13
available for rapid metabolism by the liver (26).
Eventually, the final ratio of free to bound concentrations
remain constant at the new total phenytoin concentration.
Fraser, et.al. (20) reported values from an in vivo study
that correlated with values reported from in vitro
experiments for the range of plasma total and free
concentrations. In all patients studied by Fraser, et.al.
(20), the free fraction of phenytoin increased after oral
administration of salicylates. In addition, phenytoin
metabolism by parahydroxylation is a saturable process and
even a slight inhibition of the metabolizing enzyme
activity may produce an increase in the plasma metabolite
concentration. Neuvonen, et.al. (22) reports that at least
two different types of interactions seem to be operating
simultaneously when patients on phenytoin are administered
phenylbutazone. The displacement of phenytoin from plasma
proteins seems to dominate in the first days of
phenylbutazone therapy and lowers the total phenytoin
concentration. Within one to two weeks of therapy, the
inhibition of phenytoin metabolism increases the total
phenytoin concentrations. The inhibition of phenytoin
metabolism might be a rapid process, similar to the one
suggested for pheneturide (24). For instance, when
phenturide was added to the medications of patients
stabilized on phenytoin, elevations of plasma phenytoin
concentrations occurred. These elevations may be higher in

14
the early phase of combined therapy and decline in later
weeks (24). This sequence of events appears to indicate
that both inhibition and induction are involved in these
interactions. Inhibition starts almost immediately whereas
induction takes a longer time to develop (27). The
displacement of phenytoin from plasma proteins with
administration with these drugs can cause the amount of
pharmacologically active, unbound phenytoin to be
increased.
CHANGES IN RATIO OF FREE TO BOUND PHENYTOIN DUE TO VARIOUS
PATHOPHYSIOLOGIC FACTORS
Many of the diseases and physiologic factors that
determine either plasma concentrations or the rate of
disposition of phenytoin in man have been identified.
Svensmark and Buchthal (32) studied the relationship
between dose and steady-state concentrations of phenytoin
in children and adults. Children have a smaller plasma
concentration:dose ratio than adults. Garrettson and Jusko
(33) revealed further evidence for age related difference
affecting phenytoin disposition by finding that adolescents
have smaller minimum half-lives of phenytoin. Protein
deficiency due to hepatic disease, renal disease, or other
diseases can influence the effects of phenytoin by altering
its metabolism and pharmacokinetics.
Hooper, et.al. (25) reported data indicating that the

15
phenytoin binding capacity of plasma proteins is reduced in
both hepatic and renal disease. This result is anticipated
since hepatic biotransformation is the main route of
phenytoin elimination, and therefore hepatic disease would
be expected to alter the pharmacokinetics of this drug.
Hooper, et.al. (25) found that this altered binding
capacity appeared to correlate with changes in plasma
albumin and bilirubin values. It seems likely that there
is competition between phenytoin and endogenous bilirubin
for binding sites on the albumin molecules (25). This
conclusion is supported by the study of Rane, et.al. (34).
There also appears to be a reduction in the binding
capacity of plasma proteins in renal disease. Gugler,
et.al. (21) examined the effects of the nephrotic syndrome
on the pharmacokinetics of phenytoin and determined that
these patients exhibit a decreased degree of protein
binding, an increased plasma clearance, an increased
apparent volume of distribution, and lower steady state
plasma concentrations. Hooper, et.al. (25) reported values
of 15.8 + 3.9 per cent unbound phenytoin in patients with
renal disease which were confirmed by Letteri, et.al. (35).
This is believed to be caused by the decreased capacity of
uremic patients to bind phenytoin.
Because of reduced plasma protein binding due to
various factors, there will be an expected increase in free
phenytoin in the plasma and glomerular filtration. Also in

16
renal failure there tends to be a retention of the p-HPPH
glucuronide metabolite in the body. The high plasma
concentrations of this metabolite has been shown to slow
phenytoin biotransformation (35). Therefore, total
phenytoin concentration may be misleading. In this
condition, phenytoin intoxication may occur at lower total
plasma concentrations. Whereas the determination of the
free fraction may reflect more accurately the true clinical
symptoms.
There is conflicting evidence in the literature as to
the importance of monitoring free, unbound phenytoin. At
present, most clinical laboratories are determining the
total phenytoin concentration in plasma (free to bound).
Since the free, unbound fraction is responsible for the
physiological action of the drug, it seems logical to
monitor this unbound fraction in some cases.
The purpose of this study will be to determine the
changes in ratio of free to bound phenytoin in overdose
cases and to evaluate the necessity of monitoring the free
drug. This will be accomplished in three separate studies.
The first study will determine the changes in ratio of free
to bound phenytoin with increasing total phenytoin
concentration and the effects of hypoproteinemia with
increasing concentrations of total phenytoin. The second
study will evaluate the change on ratio of free to bound
phenytoin in laboratory rats with increasing doses of

17
phenytoin. The last study will evaluate the changes in
ratio of free to bound phenytoin in two human overdose
cases.
It is proposed that less binding of phenytoin will
occur at subnormal protein concentrations causing an
increased amount of free, unbound drug to be present to
produce a therapeutic or toxic effect. We will determine
the change in ratio of free to bound phenytoin in vivo and
in vitro with various protein concentrations and to relate
how these changes correlate with two overdose cases.

CHAPTER II
MATERIALS AND METHODS
Experimental Design
This study is comprised of three separate and distinct
experiments to determine the changes in free to bound
pheytoin ratios when altering the total protein
concentration. The first was designed to determine the
changes in ratio of free to bound phenytoin using known
standards with various total protein concentrations. In
the second, the ratio of free to bound phenytoin was
determined from plasma samples obtained from laboratory
rats injected with known amounts of phenytoin. The third
evaluated the changes in ratio of free to bound phenytoin
in human overdose cases.
Materials
Animals
Unsexed, Sprague-Dawley albino rats were supplied by
Holtzman and Copmpany Rodent Supply Laboratory. These
animals, weighing between 310 and 510 grams, were
maintained on Purina Rat Chow and tap water ad libitum
prior to sacrifice. Animals were housed four per cage in
an alternating twelve hour cycle of light and dark at
ambient room termperature (22-26 degrees centigrade). All
18

19
animals were selected at random prior to experimental
manipulation.
Equipment
The gas liquid chromatograph used was a Varian Series
2400 equipped with a flame ionization detector. The column
(6 ft., 0.25 in o.d., and 2mm i.d.) was packed with 3
percent SP-2250 (OV-17) on 100/200 mesh Supelcort
(Supleco). Flow rates for the gases were: helium, 40
ml/min; air, 250 ml/min; and hydrogen 30 ml/min. Injection
port temperature was set at 270 degrees centigrade,
detector temperature at 300 degrees centigrade, and the
column temperature was set at 260 degrees centigrade for
all isothermal analysis and a range of 200-260 degrees
centigrade for all programmed analysis. The recorder was a
Varian Model 9176, with chart speed set at 0.5 mm/min.
Extractions were accomplished with the aid of an Eberbach
shaker (Ann Arbor, Michigan). Evaporation was performed in
a Tecam Dri-block DB-3 (100 degrees centigrade).
Centrifugation was performed in a Damon/IEC HN-SII
centrifuge and an OTD 50 Sorvall ultracentrifuge with a
T865 rotor head (Newton, Connecticut).
Chemicals and Other Supplies
All reagents used were of analytical reagent grade.
Ammonium sulfate, potassium phosphate, and chloroform were
obtained from Matteson, Coleman, and Bell (Cinicinatti,
Ohio). N,N-dimenthylacetamide, methanol, and toluene were
20
procured from Fisher Scientifc Company (Fairlawn, New
Jersey). Tetramethylammonium hydroxide, MPPH (internal
standard), and iodomethane were supplied by Aldrich
Chemical Company (Milwaukee, Wisconsin). Diphenylhydantoin
was purchased from Sigma Chemical Company (St. Louis,
Missouri). Emit Free Level Filters I and reagents were
obtained from the Syva Company (Palo Alto, California).
Tuberculin syringes (lcc) equipped with 22-gauge needles
were purchased from Becton-Dickinson (Rutherford, New
Jersey). All TDX regeants were obtained from Abbott
Laboratories (Irving, Texas).
Experiment I
Sample Preparation
Twenty plasma samples were prepared to obtain a set of
standards with known concentrations of phenytoin. These
standards were assayed with each group in Experiment I and
were used to calculate the concentration of phenytoin in
each sample. Ten standards were prepared to represent the
total phenytoin concentration in the range from 5.0 ug/ml
to 100.0 ug/ml and ten standards were prepared to represent
the free phenytoin concentration in a range from 0.5 ug/ml
to 10.0 ug/ml. All samples were prepared using filtered
blood bank plasma.
Forty additional plasma samples were prepared with
known concentrations of phenytoin ranging from 5.0 ug/ml to

21
100.0 ug/ml. The forty samples were divided into four
groups of ten spanning the above concentration range. Each
group represented decreasing total protein concentrations
beginning with a control (normal protein) and then
decreasing by twenty five per cent to a value of only
twenty five per cent of the original value. Each group was
then assayed for the total phenytoin concentration by three
separate methods. An aliquot of each sample was then
filtered through a specific millipore filter and assayed
again by these three methods to determine the free
phenytoin concentration. All samples were analyzed in
triplicate.
Group I. All ten samples in this group served as
controls. A range from subtherapeutic to toxic for the
total and free phenytoin concentrations was exhibited with
normal total protein concentrations. One set of ten
samples were incubated in a thirty seven degree centigrade
water bath for sixty minutes to facilitate protein binding.
The other two groups of ten samples remained at twenty five
degrees centigrade (room temperature) for sixty minutes to
equilibrate before the analysis began.
Group II. The total protein concentration in this
group of samples was decreased by one-fourth by diluting
with saline. All samples were assayed for the total and
free concentration of phenytoin by the three methods
described (see analysis of samples).

22
Group III. The total protein concentration in this
group of samples were decreased by one-half. The samples
were assayed for both the total and free phenytoin
concentration by the three methods described (see analysis
of samples).
Group IV. The total protein concentration in this
group of samples was decreased by three-fouths. All
samples were assayed for both total and free phenytoin
concentration by the three methods described (see analysis
of samples).
Experiment II
Twelve rats were selected at random for this
experiment and divided in three groups of four each.
Appropriate doses of the sodium phenytoin salt dissolved in
five per cent gum acacia were administered by
intra-peritoneal injection with a lcc tuberculin syringe.
Gum acacia alone was administered to rats as a control
group. Approximately thirty minutes after this injection,
30 ug/ml d-tubocurarine was injected intraperitoneally with
a 3cc syringe equipped with a 22 gauge needle to obtain a
compete neuromuscular block within twenty to twenty five
minutes. Sixty minutes after injection of the sodium
phenytoin salt and a complete neuromuscular block, a
cardiac puncture was performed using a 10cc syringe

23
equipped with a 20 gauge needle to obtain a blood sample to
be analyzed for both total and free phenytoin
concentrations.
Group I. A 20 mg/kg dose of the sodium phenytoin salt
dissolved in five per cent gum acacia was administered to
this group of rats to approximate subtherapeutic
concentrations of both the total and free phenytoin in
plasma.
Group II. A 50 mg/kg dose of the sodium phenytoin salt
dissolved in five per cent gum acacia was administered to
this group of rats to approximate concentrations in the
therapeutic range for both the total and free phenytoin in
plasma.
Group III. A 100 mg/kg dose of the sodium phenytoin
salt dissolved in five percent gum acacia was administered
to this group of rats to approximate toxic concentrations
of both the total and free phenytoin in plasma.
Experiment III
Plasma samples from various patient related overdose
cases were anlayzed for both the total and free phenytoin
concentrations. All samples were stored frozen at two to
six degrees centigrade prior to analysis. These samples
were allowed to equilibrate at twenty five degrees
centigrade for sixty minutes prior to analysis. Total

24
protein concentrations were determined on each sample
analyzed.
Analysis of Samples
The experimental samples were removed from the
refrigerated state and allowed to equilibrate at room
termperature (twenty five degrees centigrade). A modified
procedure from Henry (36) and Doumas (37) was used to
determine the amount of total protein and albumin in each
plasma sample using the DuPont Automatic Clinical Analyzer
for both Experiment I and Experiment III. In the total
protein procedure, cupric ion reacts with the peptide
linkages of protein in a basic solution. The blue copper
(II) protein complex formed is proportional to the total
protein concentration in the sample and is measured using a
two-filter (540-510 nm) end point technique. For the
albumin procedure, at pH 4.2 and in the presence of a
solubilizing agent, bromcresol green binds to specific
sites on the albumin molecule forming a complex that has a
characteristic spectrum differenct from the dye. The
amount of complex formed is proportional by a two-filter
(600-540 nm) end point technique.
In Experiment I, all samples were analyzed using three
separate instruments. The first method was the
quantitation of total and free phentyoin using gas liquid
chromatography. To determine the total phenytoin
concentration, the drug is extracted from one milliliter of

25
the sample with toluene containing the internal standard
5-(p-methylphenyl )-5-phenylhydantoin (MPPH). The toluene
is back extracted with tetramethylammonium hydroxide
(TMAH). This base extracts acid drugs out of the solvent
and also splits hydrogen off of the nitrogen present to
facilitate derivatization. The free phenytoin
concentration is determined by first filtering a sample
through a millipore filter while being centrifuged at
1000-2000 x g at twenty five degree centigrade for twenty
minutes in a centrifuge equipped with a fixed, angle-head
rotor. This filter consists of a reservoir tube which has
the capacity of 1.2 milliliters, a hydrophilic, selectively
permeable membrane with low nonspecific binding properties
for phenytoin, and a removable collection cup that prevents
changes in pH during ultrafiltration was employed. It has
been researched and reported by the Syva Company (Palo
Alto, California) that at least 98.4 per cent of the Emit
Free Filter I will exhibit greater than 99 per cent protein
retention. This ultrafiltrate was extracted as previously
described for the quantitation of total phenytoin by the
gas chromatograph. The only modification was the amount of
sample used (0.5 milliliter) and the internal standard was
reduced to one-fifth of the original concentration to
facilitate calculations. All samples were analyzed in
triplicate. The Emit (Syva Company) was the second
instrument used for both the total and free phenytoin

26
determinations. All samples were analyzed in duplicate.
Plasma samples with known phenytoin concentrations
previously prepared were assayed for the total phenytoin
concentration. These samples were filtered as described
above, and the ultrafiltrate was assayed to determine the
free phenytoin concentration. The Emit assay is a
homogeneous enzyme immunoassay technique used for the
microanalysis of specific compounds in biological fluids
(37). In this method, phenytoin is labeled with an enzyme,
and when the enzymed-labeled drug becomes bound to an
antibody against the drug, the enzyme activity is reduced.
Phenytoin in the sample competes with the enzyme-labeled
phenytoin for the antibody-induced inactivaion of the
enzyme. Enzyme activity correlates directly with the
concentration of drug in the sample and is measured by an
absorbance change resulting from the enzyme's catalytic
action on a substrate.
The third instrument employed to determine the total
and free phenytoin concentrations was the TDX (Abbott
Company). All samples were analyzed in duplicate due to
sample volume recovered. The drug concentration is
measured based on the method of fluorescence polarization
(38). Fluorescence polarization immunoassay measures
tracer-antibody binding directly by using the unique
properties of the fluorescent dye, fluorescein. A change
in the polarization of fluorescent light emitted by the

27
dye, as tracer is bound, is measured using a sophisticated
optical detection system. The concentration of phenytoin
in the sample can be extrapolated from a calibration curve
of polarization values versus phenytoin concentrations.
Plasma samples previously prepared were used for both the
total and free determination of phenytoin.
In Experiment II, all samples were analyzed using the
Emit. This was due to the small amount of sample volume
obtained from the cardiac puncture performed on the rats
(the TDX was not available at the time of this assay).
After centrifugation of the blood sample, approximately 1
cc of plasma was recovered. Both the total and free
phenytoin concentrations were determined using this method.
In Experiment III, all samples were analyzed using the
TDX. Extremely small amounts (<0.5 ml) of most samples
required the use of this instrument.
INININ 1911111111 11 11011,4011011111,11 ! ,
CHAPTER III
RESULTS AND DISCUSSION
This study revealed that the change in ratio of free to
bound phenytoin increases dramatically as the total protein
concentration decreases. This data is supported by the
fact that when the total protein concentration is
subnormal, more phenytoin remains free to exhibit a more
pronounced physiological response. The degree to which the
total protein concentration is decreased is in direct
relation to the toxicity exhibited. All three experiments
were performed to show a general trend between the change
in ratio of free to bound drug and total protein
concentration. These experiments were not performed to
verify methods used to analyze free and total phenytoin or
total protein concentration, but to verify any trends seen
by established procedures.
Experiment I
The data from the gas chromatography studies from the
four groups of known standards with various total protein
concentations is presented in Tables I - IV. Table I
(normal total protein concentration) revealed lower free to
bound ratios than the groups presented in Table II (normal
28

29
total protein concentration decreased by one-fourth) and
Table III (normal total protein concentration decreased by
one-half). All three groups presented in Table I - III
revealed a negligible increase in the free to bound ratios.
Table IV (normal total protein concentration decreased by
three-fouths) revealed a dramatic increase in the free to
bound ratio of phenytoin.
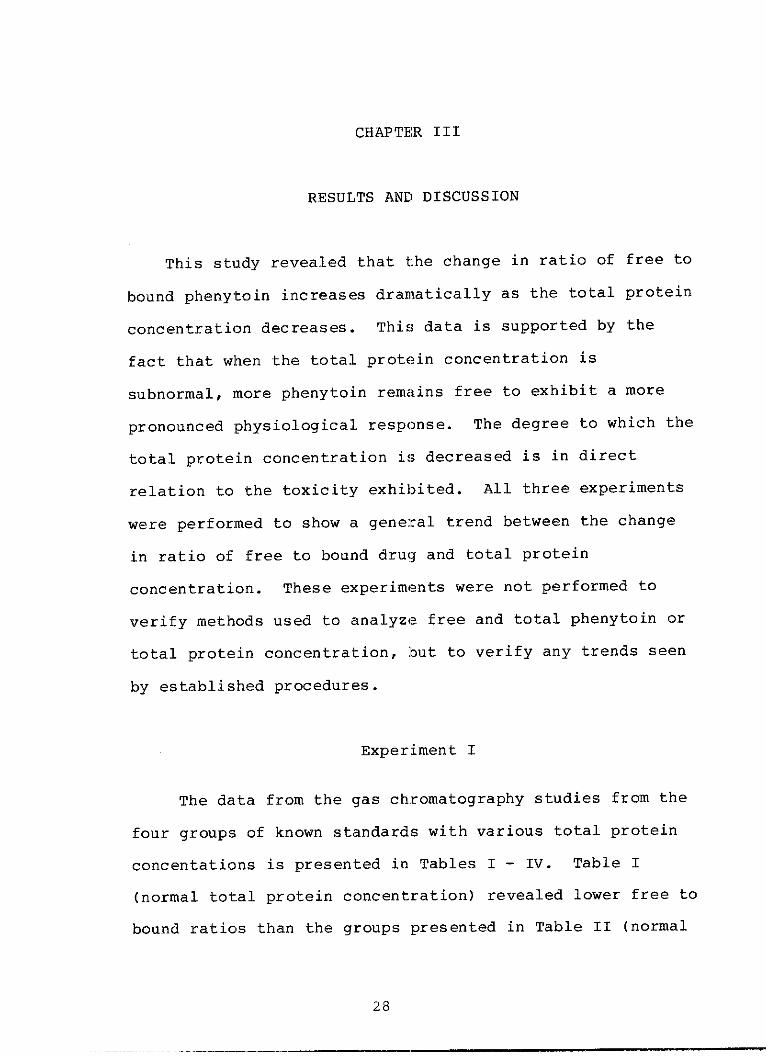
Data from the Emit study is presented in Table V -
VIII. Table V (normal total protein concentration) and
Table VI normal total protein concentration decreased by
one-fourth) reveals a slight variance from the gas
chromatography study. The free to bound ratios are
slightly higher than those groups with corresponding total
protein concentrations in the previous analysis. Table VII
(normal total protein concentration decreased by one-half)
and Table VIII (normal total protein concentration
decreased by three-fouths) reveal a significant increase in
the free to bound ratios.
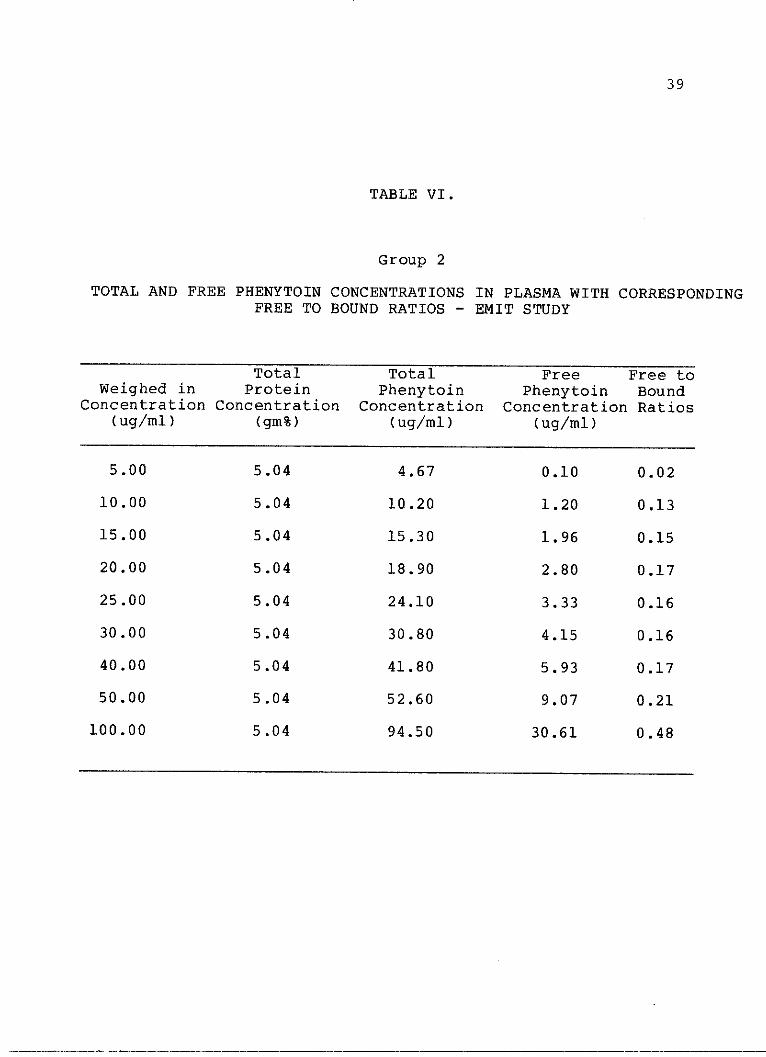
The data from the TDX study is presented in Tables IX
- XII. Table IX (normal total protein concentration) and
Table X (normal total protein concentration decreased by
one-fourth) reveal a slight increase in the free to bound
ratios. Table XI (total protein concentration decreased by
one-half) reveals slightly higher free to bound ratios than
the other groups with corresponding total protein
concentrations. Table XII (total protein concentration

30
decreased by three-fourths) reveals a significantly higher
free to bound ratio of phenytoin.
Experiment II.
All data from the in vivo study with laboratory rats
is presented in Table XIII. The results indicate that with
various total phenytoin concentrations ranging from
subtherapeutic to toxic, the free phenytoin concentrations
were within the expected range of 10 - 20 percent of the
total drug concentration.
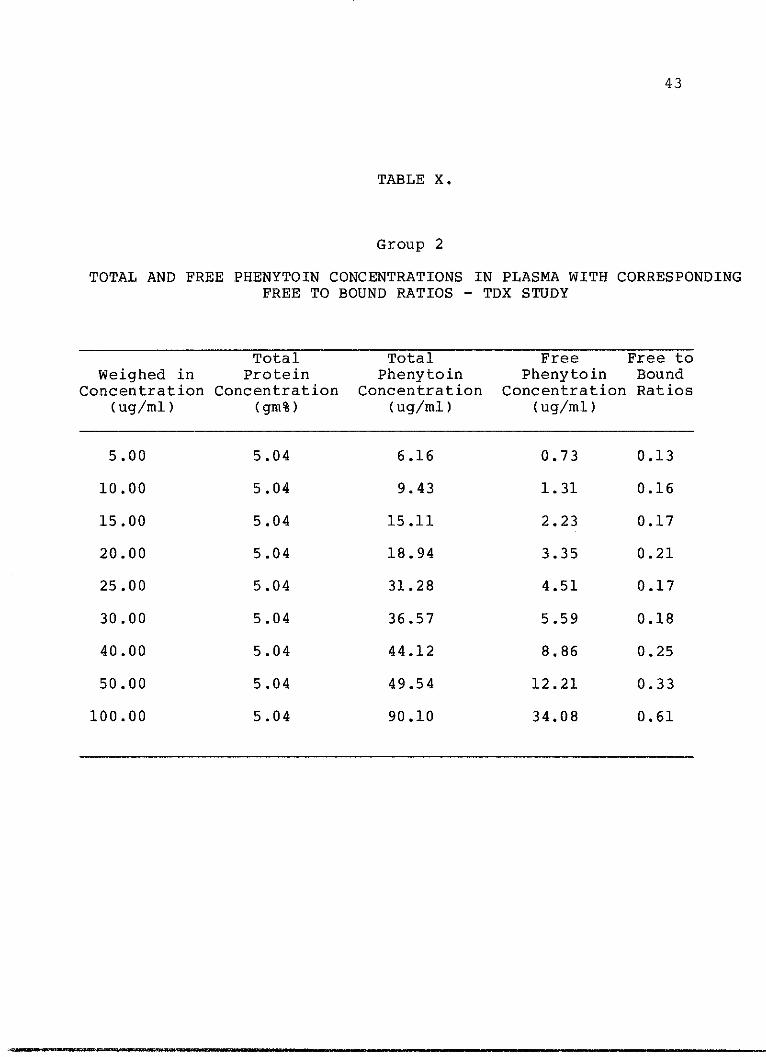
Experiment III.
Tables XIV and XV reveal the data from two overdose
cases. Patient A has a total protein concentration within
the normal range published in the literature of 6 - 8 gm
percent. Over a period of six days, total and free
concentrations were analyzed and found to be in the toxic
range. All free phenytoin concentrations are within the
expected range of 10 - 20 percent of the total phenytoin
concentration. Free to bound ratios remain relatively
constant. Patient B has a total protein concentration of
4.2 gm percent (28.4 percent below the normal range) .
Total and free phenytoin concentrations were analyzed on
five consecutive days. Total phenytoin concentrations
remained in the toxic range for the first four days with
INTANIMAI 11 11, MIN III III III

31
RELATIONSHIP OF FREE TO BOUND PHENYTOIN RATIOWITH PROTEIN CONCENTRATIONS
.400
o .300
0
o .2004J
.100
Normal N-25% N-50% N-75%
Total Protein Concentration (gm%)
Fig. 3. Relationship of free to bound phenytoin ratio withdecreasing total protein concentration.

32
corresponding toxic free phenytoin concentrations on the
fifth day, the total phenytoin concentrations was within
the therapeutic range, but the free phenytoin remained
toxic. All free to bound ratios were increased.
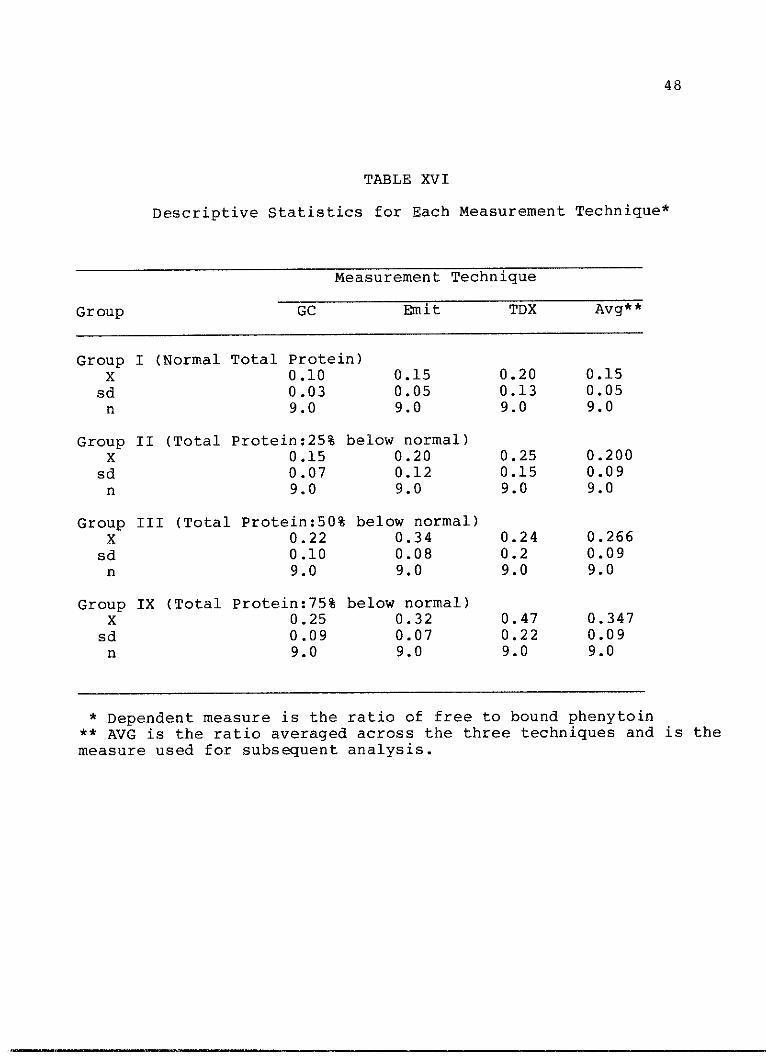
Descriptive statistics for each measurement technique
is presented in Table XVI. Figure 3 reveals the
relationship of free to bound phenytoin and total protein
concentrations using the averaged mean of all three
methods.
The correlations between the free to bound ratio and
total protein concentrations is revealed in Table XVII.
These results indicate moderate negative linear
relationships between the free to bound ratio and total
protein concentration, with the gas chromatography and Emit
methods being somewhat more sensitive to the relationships.
However, the explained variability (approximately 47 per
cent) is too weak for a reliable prediction. Part of this
weakness may be associated with the range restriction for
total concentration.
The correlations between the free to bound ratio and
the total phenytoin concentrations ranging from
subtherapeutic to toxic are revealed in Table XVIII. This
data reveals that the free to bound ratios are positively
correlated with increasing concentrations (significance
< 0.05) in Experiment 1 with plasma standards of known
concentrations of phenytoin. This correlation was not

33
present in Experiment 2. The correlation between the free
to bound ratios and increasing phenytoin concentrations in
laboratory rats was 0.22 (p=0.575). This is partially due
to the differences in n between the data sets. Also, the
relationships, although significant, are not particularly
strong (i.e., explained variance is less than approximately
30 per cent for any of the correlations) . This means poor
success in predicting the total phenytoin concentration
from the free to bound ration, or vice versa.

34
TABLE I.
Group 1
TOTAL AND FREE PHENYTOIN CONCENTRATIONS IN PLASMA WITH CORRESPONDING
FREE TO BOUND RATIOS - GAS CHROMATOGRAPHY STUDY
Total Total Free Free to
Weighed in Protein Phenytoin Phenytoin Bound
Concentration Concentration Concentration Concentration Ratios
(ug/ml) (gm%) (ug/ml) (ug/ml)
5.00 6.41 4.57 0.41 0.10
10.00 6.41 9.80 1.04 0.12
15.00 6.41 17.64 1.56 0.10
20.00 6.41 20.58 2.00 0.11
25.00 6.41 22.54 2.64 0.13
30.00 6.41 27.43 3.20 0.13
40.00 6.41 32.66 3.48 0.12
50.00 6.41 72.51 4.49 0.07
100.00 6.41 108.10 5.07 0.05

35
TABLE II.
Group 2
TOTAL AND FREE PHENYTOIN CONCENTRATIONS IN PLASMA WITH CORRESPONDING
FREE TO BOUND RATIOS - GAS CHROMATOGRAPHY STUDY
Total Total Free Free to
Weighed in Protein Phenytoin Phenytoin Bound
Concentration Concentration Concentration Concentration Ratios
(ug/ml) (gm%) (ug/ml) (ug/ml)
5.00 5.04 3.65 0.40 0.11
10.00 5.04 8.21 0.73 0.09
15.00 5.04 14.44 1.29 0.09
20.00 5.04 20.06 2.20 0.11
25.00 5.04 25.69 2.83 0.11
30.00 5.04 30.40 4.56 0.15
40.00 5.04 43.32 6.92 0.16
50.00 5.04 53.20 11.20 0.21
100.00 5.04 101.99 31.60 0.31

36
TABLE III.
Group 3
TOTAL AND FREE PHENYTOIN CONCENTRATIONS WITH CORRESPONDING FREE TOBOUND RATIOS - GAS CHROMATOGRAPHY STUDY
Total Total Free Free toWeighed in Protein Phenytoin Phenytoin Bound
Concentration Concentration Concentration Concentration Ratios(ug/ml) (gm%) (ug/ml) (ug/mi)
5.00
10.00
15.00
20.00
25.00
30.00
40.00
50.00
100.00
3.42
3.42
3.42
3.42
3.42
3.42
3.42
3.42
3.42
4.95
10 .56
16.67
21.95
28.38
36.14
47.36
53.30
123.75
0.54
1.37
2.50
3.51
4.54
7.23
11.37
14.92
39.60
0.11
0.13
0.15
0.16
0.16
0.20
0.24
0.29
0.37

37
TABLE IV.
Group 4
TOTAL AND FREE PHENYTOIN CONCENTRATIONS IN PLASMA WITH CORRESPONDINGFREE TO BOUND RATIOS - GAS CHROMATOGRAPHY STUDY
Total Total Free Free toWeighed in Protein Phenytoin Phenytoin Bound
Concentration Concentration Concentration Concentration Ratios(ug/ml) (gm%) (ug/ml) (ug/ml)
5.00
10.00
15.00
20.00
25.00
30.00
40.00
50.00
100.00
1.62
1.62
1.62
1.62
1.62
1.62
1.62
1.62
1.62
4.07
8.62
13.83
19.36
33.84
34.17
43.44
53.85
107.71
0.53
1.45
2.34
3.64
7.76
8.82
10.08
12.90
1780
0.15
0.20
0.20
0.23
0.30
0.35
0.30
0.32
0.20

38
TABLE V.
Group 1
TOTAL AND FREE PHENYTOIN CONCENTRATIONS IN PLASMA WITH CORRESPONDINGFREE TO BOUND RATIOS - EMIT STUDY
Total Total Free IWeighed in Protein Phenytoin Phenytoin
Concentration Concentration Concentration Concentration(ug/ml) (gm%) (ug/ml) (ug/ml)
5.00
10.00
15.00
20.00
25.00
30.00
40.00
50.00
100.00
6.41
6.41
6.41
6.41
6.41
6.41
6.41
6.41
6.41
4.60
12.30
17.50
20.90
25.40
30.90
38.80
52.00
107.80
0.40
1.12
1.76
2.64
2.90
3.90
5.15
6.42
22.22
Free toBoundRatios
0.18
0.10
0.11
0.14
0.13
0.14
0.15
0.14
0.26
39
TABLE VI.
Group 2
TOTAL AND FREE PHENYTOIN CONCENTRATIONS IN PLASMA WITH CORRESPONDINGFREE TO BOUND RATIOS - EMIT STUDY
Total Total FreeWeighed in Protein Phenytoin Phenytoin
Concentration Concentration Concentration Concentration(ug/ml) (gm%) (ug/ml) (ug/ml)
5.00
10.00
15.00
20.00
25.00
30.00
40.00
50.00
100.00
5.04
5.04
5.04
5 .04
5.04
5.04
5.04
5.04
5.04
4.67
10.20
15.30
18.90
24.10
30.80
41.80
52.60
94.50
0.10
1.20
1.96
2.80
3.33
4.15
5.93
9.07
30.61
Free toBoundRatios
0.02
0.13
0.15
0.17
0.16
0.16
0.17
0.21
0.48
. I III IIIIInk

40
TABLE VII.
Group 3
TOTAL AND FREE PHENYTOIN CONCENTRATIONS IN PLASMA WITH CORRESPONDINGFREE TO BOUND RATIOS - EMIT STUDY
Total Total Free Free toWeighed in Protein Phenytoin Phenytoin Bound
Concentration Concentration Concentration Concentration Ratios(ug/ml) (gm%) (ug/ml) (ug/ml)
5.00
10.00
15.00
20.00
25.00
30.00
40.00
50.00
1L00.00
3.42
3.42
3.42
3.42
3.42
3.42
3.42
3.42
3.42
5.02
9.80
14.80
21.30
23.70
27.00
37.80
60.00
88.30
1.32
1.92
3.53
3.76
5.94
6.92
11.56
15.56
28.40
0.36
0.24
0.31
0.21
0.33
0.34
0.44
0.35
0.47

41
TABLE VIII.
Group 4
TOTAL AND FREE PHENYTOIN CONCENTRATIONS IN PLASMA WITH CORRESPONDINGFREE TO BOUND RATIOS - EMIT STUDY
Total Total Free Free toWeighed in Protein Phenytoin Phenytoin Bound
Concentration Concentration Concentration Concentration Ratios(ug/ml) (gm%) (ug/ml) (ug/ml)
5.00
10.00
15.00
20.00
25.00
30.00
40.00
50.00
100.00
1.62
1.62
1.62
1.62
1.62
1.62
1.62
1.62
1.62
5.23
11.60
15.70
21.20
27.20
30.90
42.61
55.47
103.76
1.46
2.12
3.32
5.10
6.38
7.03
12.23
14.75
31.30
0.39
0.22
0.22
0.32
0.31
0.29
0.40
0.32
0.43

42
TABLE IX.
Group 1
TOTAL AND FREE PHENYTOIN CONCENTRATIONS IN PLASMA WITH CORRESPONDINGFREE TO BOUND RATIOS - TDX STUDY
Total Total Free Free toWeighed in Protein Phenytoin Phenytoin Bound
Concentration Concentration Concentration Concentration Ratios(ug/ml) (gm%) (ug/ml) (ug/ml)
5.00
10.00
15.00
20.00
25.00
30.00
40.00
50.00
100.00
6.41
6.41
6.41
6.41
6.41
6.41
6.41
6.41
6.41
6.18
9.51
15.27
18.15
24.27
29.50
41.36
48.84
87.56
0.54
0.95
1.72
2.08
3.16
5.00
6.91
10.05
29.95
0.10
0.11
0.13
0.13
0.15
0.20
0.20
0.26
0.52
43
TABLE X.
Group 2
TOTAL AND FREE PHENYTOIN CONCENTRATIONS IN PLASMA WITH CORRESPONDINGFREE TO BOUND RATIOS - TDX STUDY
Total Total Free Free toWeighed in Protein Phenytoin Phenytoin Bound
Concentration Concentration Concentration Concentration Ratios(ug/ml) (gm%) (ug/ml) (ug/ml)
5.00
10.00
15.00
20.00
25.00
30.00
40.00
50.00
100.00
5.04
5.04
5.04
5.04
5.04
5.04
5.04
5.04
5.04
6.16
9.43
15 .11
18.94
31.28
36.57
44.12
49.54
90.10
0.73
1.31
2.23
3.35
4.51
5.59
8.86
12.21
34.08
0.13
0.16
0.17
0.21
0.17
0.18
0.25
0.33
0.61
v

44
TABLE XI.
Group 3
TOTAL AND FREE PHENYTOIN CONCENTRATIONS IN PLASMA WITH CORRESPONDINGFREE TO BOUND RATIOS - TDX STUDY
Total Total Free Free toWeighed in Protein Phenytoin Phenytoin Bound
Concentration Concentration Concentration Concentration Ratios(ug/ml) (gm%) (ug/ml) (ug/ml)
5.00 3.42 5.39 0.93 0.13
10.00 3.42 11.12 2.12 0.16
15.00 3.42 14.57 3.25 0.17
20.00 3.42 23.33 4.84 0.21
25.00 3.42 27.19 6.73 0.17
30.00 3.42 32.92 8.22 0.18
40.00 3.42 39.72 11.56 0.25
50.00 3.42 52.28 15.05 0.33
100.00 3.42 80.53 37.23 0.61
..2.!d. - .. .. - IIbirflUriMif F rl-Isi liirirmni Igni blint1n III Irwisiral 1-Fn' II 1 1 I -1 II. -. a ' -- --I. - -1 -1s I - -- - - i r -a e -i- -i-- :.s - -s 1 w- : i ,..- - r -. i- ,: s:., -el--- i.- 1. ... un..-:. .. ,- .:-r-- ---- ,- --is--- n -.- ,-.-- a, -.m.--- - ."

45
TABLE XII.
Group 4
TOTAL AND FREE PHENYTOIN CONCENTRATIONS IN PLASMA WITH CORRESPONDINGFREE TO BOUND RATIOS - TDX STUDY
Total Total Free Free toWeighed in Protein Phenytoin Phenytoin Bound
Concentration Concentration Concentration Concentration Ratios(ug/ml) (gm%) (ug/ml) (ug/ml)
5.00 1.62 5.08 1.61 0.46
10.00 1.62 8.36 2.69 0.47
15.00 1.62 15.71 5.49 0.54
20.00 1.62 19.19 8.04 0.72
25.00 1.62 23.93 9.00 0.60
30.00 1.62 32.15 12.36 0.62
40.00 1.62 40.39 18.58 0.85
50.00 1.62 48.80 25.76 1.12
100.00 1.62 96.86 72.41 2.96

V'zH
La
0
U
0U
H
V]
HO0
OH
0
O
)E-HP4
zH0
zOWHW
r4
rz
F:z
z
0&U
zi
1 46
HHH
04jr O
-HOWrd
C0
C
-H I4J
Oc)>4-3
C
CO0U
C0
H"" O gjOC CH
H. Od4 J -IJ
0CC
EO)00
O
O
H O
d OW
H O
0 O 0 N H H- O H -(N H H O H H CM H H. . . . . . . . .
o 0 0 0 0 0 0 0 0
C C Oi O H O C (N OC71 N 0 H- O (N H
O 0 0 H-N H H (N 10O O O r-I - I -I N Ln-d
o o 0 O O O O O Od (N CO -{O1 00 d Li
. * 0 . . 0 . * S
N N 0 0 H N CHl 0N Hr-I r-I
CT1 O O O M inO inLN
in O N i H NO OO- 0 0 0 Nm M O ON
O O 10 O O C) 'H (N
O O in inO O O O C>OO H H H H H Hr- O HS M 'M M in in M
in in n L O O O ON N N n H L (N 0 C
r- 0 N
,. N M LO n0 0 0 0 C
Co
Ez
47
TABLE XIV
Patient A: Normal Total Protein Concentration
Date Total Free Per Free toof Phenytoin Phenytoin Cent Bound
Test Concentration Concentration Binding Ratio
4/2/80 58.86 5.30 90.90 0 .10
4/4/80 52.46 5.43 89.60 0.12
4/5/80 37.79 3.94 89.60 0.12
4/7/80 28.25 3.60 87.30 0.15
4/7/80 21.55 2.56 88.10 0.13
TABLE XV
Patient B: Decreased Total Protein Concentration
Date Total Free Per Free toof Phenytoin Phenytoin Cent Bound
Test Concentration Concentration Binding Ratio
9/19/80 32.04 7.51 76.60 0.31
9/20/80 36.36 7.42 79.60 0.26
9/21/80 38.72 6.80 82.40 0.21
9/22/80 26.26 4.88 81.40 0.22
9/23/80 20.39 5.46 73.20 0.37
48
TABLE XVI
Descriptive Statistics for Each Measurement Technique*
Measurement Technique
Group GC Emit TDX Avg**
Group I (Normal Total Protein)X 0.10 0.15 0.20 0.15
sd 0.03 0.05 0.13 0.05n 9.0 9.0 9.0 9.0
Group II (Total Protein:25% below normal)X 0.15 0.20 0.25 0.200
sd 0.07 0.12 0.15 0.09n 9.0 9.0 9.0 9.0
Group III (Total Protein:50% below normal)X 0.22 0.34 0.24 0.266
sd 0.10 0.08 0.2 0.09n 9.0 9.0 9.0 9.0
Group IX (Total Protein:75% below normal)X 0.25 0.32 0.47 0.347
sd 0.09 0.07 0.22 0.09n 9.0 9.0 9.0 9.0
* Dependent measure is the ratio of free to bound phenytoin** AVG is the ratio averaged across the three techniques and is themeasure used for subsequent analysis.

49
TABLE XVII
Correlation Between the Free to Bound Ratio and Total ProteinConcentration
Method Correlation p (L)
Gas Chromatography -0.68 0.000
Emit -. 65 0.000
TDX -0.49 0.003
All -0.40 0.000
*See Footnote a in Table XVI

50
TABLE XVIII
Correlations Between the Free to Bound Ratio and Total PhenytoinConcentration
Method Correlation p (L)*
Gas Chromatography 0.38 .021
Emit 0.49 .003
TDX 0.58 .000
All 0.35 .000
*Using the bonferroni procedure, the p value must be < 0.05 to besignificant.

CHAPTER IV
CONCLUS ION
Several questions were addressed and answered in this
investigation of the ratio of free to bound phenytoin in
overdose cases:
1. Whether or not the free to bound ratios will
change with increasing concentrations of
phenytoin,
2. How the ratio of free to bound phenytoin will
change with decreasing total protein concen-
tration,
3. How these results correlate with human overdose
cases?
In the first study we analyzed four groups of plasma
standards with known concentrations of phenytoin by three
separate methods. Although there was a general trend for
the ratio of free to bound drug to increase with increasing
phenytoin concentrations in plasma, no significant
differences could be demonstrated. Furthermore, this trend
was not apparent until concentrations were well above the
therapeutic range (i.e., 100 ug/ml).
The first group in this study had normal total protein
concentrations. The total protein concentration was
continually decreased by 25 per cent in the remaining three
51
:

52
groups. As the protein concentrations decreased there was a
dramatic increase in the free to bound ratio. This was
observed beginning with total protein concentrations decreased
by 25 per cent.
In the second study, laboratory rats were used to validate
the in vitro investigation. The results proved no significant
change in the free to bound ratios.
The clinical correlation substantiates the results from
the first study. Patient A had a normal total protein
concentration and there was no significant increase in the free
to bound ratios at concentrations of 22 - 60 ug/ml. Patient B
had total protein concentrations 28.4 per cent below the normal
range established in the literature. The free to bound ratios
were significantly higher in this patient at concentrations of
20 - 39 ug/ml. The ratio was altered by two to four times.
This study makes a significant contribution to the
literature by demonstrating that the ratio of free to bound
phenytoin remains constant throughout the therapeutic range as
long as the person has a normal total protein concentration.
This implies that there is more than adequate binding sites on
albumin and not a saturable process in concentrations of up to
100 ug/ml. However, the free to bound ratio changes
significantly when the total plasma protein decreases by 25 per
cent and verifies that monitoring free and total phenytoin
concentration is important in this population.

53
LITERATURE CITED
1. Lennox, W.G. and Lennox, M.A.: Epilepsy and relateddisorders. Vol. I., Little, Brown, Inc., Boston, 1960.
2. Coatsworth, J.J.: Studies on the efficacy of marketedantiepileptic drugs. NINDS Monograph, No. 12, DHEWPublication No. (NIH) 73-51. U.S. Government PrintingOffice, Washington, 1971.
3. Hauptmann, A.: Luminal bei Epilepsie Munch. Med.Wochenschr. 59: 1907-1909, 1912.
4. Merrit, H.H. and Putnam, T.J.: Sodiumdiphenylhydantoinate in treatment of convulsive disorders.J.A.M.A., 111: 1068-1073, 1938.
5. Jones, G.L. and Woodbury, D.M.: Principles of drugaction: structure-activity relationsip and mechanisms.Antiepileptic Drugs. Raven Press, New York. 83-109, 1982.
6. Glazko, A.J.: Diphenylhydantoin: chemistry and methodsof determination. In: Antiepileptic Drugs, edited by D.M.Woodbury, J.K. Penry and R.P. Schmidt, Raven Press, NewYork. 103-112, 1972.
7. Agarwal, S.P. and Blake, M.I.: Determination of the pkvalue for 5,5-diphenylhydantoin. J. Pharm. Sci. 57:1434-1435, 1968.
8. Glazko, A.J., Peterson, F.E., Smith, T.C., Dill, W.A.and Chag, T.: Phenytoin metabolism in human subjects withshort and long half-lives. Fed. Proc. 39: 1099, 1980.
9. Schwartz, P.A., Rhodes, C.T. and Cooper, J.W.:Solubility and ionization characteristics of phenytoin. J.Pharm. Sci. 66: 994-997, 1977.
10. Woodbury, D.M.: Phenytoin absorption, distribution,and excretion. In: Antiepileptic drugs, edited by D.M.Woodbury, J.K. Penry and C.E. Pippenger. Raven Press, NewYork, 1982.
11. Lunde, P.K.M., Rane, A., Jaffe, S.J., Lund, L. andSjojuist, F.: Plasma protein binding of diphenylhydantoinin man. Interaction with other drugs and the effect oftemperature and plasma dilution. Clin. Pharmacol. Ter.,II: 846-855, 1970.

54
12. Arnold, K. and Gerber, N.: The rate of decline of
diphenylhydantoin in human plasma. Clin. Pharmacol. Ther.
11: 121-134, 1970.
13. Dill, W.A., Kazenko, A., Wolff, L.M. and Glazko, A.J.:
Studies on 5,5-diphenylhydantoin in animals and man. J.
Pharmcol. Exp. Ther. 118: 270-279, 1956.
14. Chang, T. and Glazko, A.: Diphenylhydantoin:
Biotransformation In: Antiepileptic drugs, edited by D.M.
Woodbury, J.K. Penry and R.P. Schmidt. Raven Press, NewYork 149-162, 1972.
15. Kozelko, F.L. and Hine, C.H.: Degradation products of
dilantin. J. Pharmacol. Exp. Ther. 77: 175-179, 1973.
16. Booker, H.E. and Darcey, B.: Serum concentrations of
free dipheylhydantoin and their relationsip to clinical
intoxication. Epilepsia 14: 177-184, 1973.
17. Porter, R.J. and Layzer, R.B.: Plasma albumin
concentration and diphenylhydantoin binding in man. Arch.
Neurol. 32: 198-303, 1975.
18. Wiegand, U.W., Slattery, J.T., Hintze, K.L. and Levy,
G.: Differences in the protein binding of several drugs
and bilirubin in serum and heparinized plasma of rats.Life Sciences, Vol. 25: 471-478.
19. Bowmer, C.J. and Lindup, W.E.: Decreased binding of
drugs and dyes to plasma proteins from rats with acute
renal failure: effects of ureter ligation and intramuscularinjection of glycose. Br. J. Pharmac. 66: 275-281, 1979.
20. Fraser, D.G., Ludden, T.M., Evens, R.P. and Sutherland,
E.W.: Displacement of phenytoin from plasma binding sites
by salicylate. Clin. Pharmacol. Ther. 165-169, 1980.
21. Gugler, R., Shoeman, D.W. and Azarnoff, D.L.: Effect
of in vivo elevation of free fatty acids on protein binding
of drugs. Pharmacology 12: 160-165, 1974.
22. Neuvonen, P.J., Lehtovara, R., Bardy, A., and Eloman,
E.: Antipyretic analygesics in patients on antiepileptic
drug therapy. Eur. J. clin. Pharm. 15: 263-268, 1979.
23. Varma, D.R.: Protein deficiency and drug interactions;a review. Drug Dev. Res. 1: 183-198, 1981.
24. Richens, A.: Interactions with antiepileptic drugs.
Drugs 13: 266-275, 1977.

55
25. Hooper, W.D., Bochner, F., Eadie, M.J. and Tyrer, J.H.:Plasma protein binding of diphenyihydantoin. Effects ofsex hormones, renal, and liver disease. Clin. Pharmacol.Therp. 15: 276-282, 1974.
26. Pippenger, C.E.: Drug distribution and proteinbinding. Syva Monitor 6, pp 1-8, 1980.
27. Kutt, H.: Interactions of antiepileptic drugs.Epilepsia 16: 393-502, 1975.
28. Koper, A., Olsson, Y. and Sjoholm, I.: Binding ofdrugs to human serum albumin. XIV. The theoretical basisfor the interaction between phenytoin and valprate. Mol.Phrmacol. 18: 237-242, 1980.
29. Hansen, J.M., Kristensen, J, Skovsted, I. andChristensen, L,K.: Dicumarol-induced diphenyldantoinintoxication. Lancet I: 265-266, 1966.
30. Christensen, L.K. and Skovsted, L.: Inhibitition ofdrug metabolism by chloramphenicol. Lancet II. 1397-1399,1969.
31. Smyth, D.J., Bravo, J.F.: Antirheumatic drugs.Clinical pharmacological and therapeutic aspects. Drugs 10:394-425, 1975.
32. Svensmark, 0. and Buchthal, F.: Aspects ofpharmacology of phenytoin (Dilantin) and phenobarbitalrelevant to this dosage in the treatment of epilepsy.Epilepsia. Vol 1, pp. 373-384, 1959.
33. Garrettson, L.K. and Jusko, W.U.: Diphenylhydantoinelimination kinetics in over-dosed children. Clin.Pharmacol. Ther. 17: 481-491, 1975.
34. Rane, A. Lunke, P.K.M., Jailing, B., Yaffe, J.J. andSjoquist, F.: Plasma protein binding of diphenylhydantoinin normal and hyperbilirubinemic infants. J. Pediat., 78,877-882, 1971.
35. Letteri, J.M., Mellk, H., Louis, S., Kutt, H., Duraute,P. and Glazko, A.: Diphenylhydantoin metabolism in uremia.New Engl. J. Med. 185: 648-652, 1971.
36. Henry, R.J.: Clinical chemistry, principles andtechniques. Harper and Row, New York, N.Y. 407-421, 1974.
37. Schottelius, D.D.: Homogeneous immunoassay system(Emit) for quantitation of antiepileptic drugs in
,

56
biological fluids. In: Antiepileptic Drugs: Quantitative
Analysis and interpretation, edited by C.E. Pippenger, J.K.
Penry and H. Kutt. Raven Press, New York 95-108, 1978.
38. Lu-Stef fes , M., Jolley, M. E . , Pittluck, G., Panas,
H.N., Olive, D.L., Want, C.H.J., Nystrom, D.D. and Stroupe,S.D.: Fluorescence polarization immunoassays of phenytoinand phenobarbital. Clin. Chem. 27: 1099, 1981.
Top Related