


Languages
Pages
Legal


IntroductionDependence measures & Copulas
Optimal TransportThe Target Dependence Coefficient
Clustering Credit Default SwapsLimits & Future Developments
Optimal Transport between Copulasfor Clustering Time Series
IEEE ICASSP 2016
Gautier Marti, Frank Nielsen, Philippe Donnat
March 22, 2016
Gautier Marti Optimal Transport between Copulas for Clustering Time Series

IntroductionDependence measures & Copulas
Optimal TransportThe Target Dependence Coefficient
Clustering Credit Default SwapsLimits & Future Developments
1 Introduction
2 Dependence measures & Copulas
3 Optimal Transport
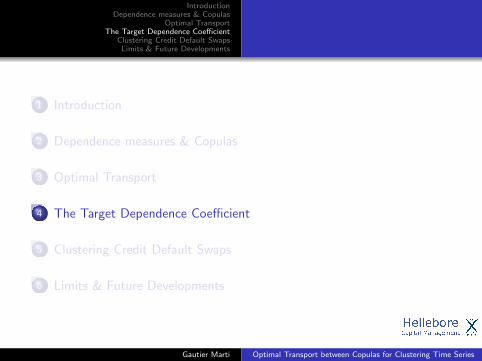
4 The Target Dependence Coefficient
5 Clustering Credit Default Swaps
6 Limits & Future Developments
Gautier Marti Optimal Transport between Copulas for Clustering Time Series

IntroductionDependence measures & Copulas
Optimal TransportThe Target Dependence Coefficient
Clustering Credit Default SwapsLimits & Future Developments
Clustering of Time Series
We need a distance Dij between time series xi and xj
If we look for ‘correlation’, Dij is a decreasing function of ρij ,a measure of ‘correlation’
Several choices are available for ρij . . .
Gautier Marti Optimal Transport between Copulas for Clustering Time Series

IntroductionDependence measures & Copulas
Optimal TransportThe Target Dependence Coefficient
Clustering Credit Default SwapsLimits & Future Developments
1 Introduction
2 Dependence measures & Copulas
3 Optimal Transport
4 The Target Dependence Coefficient
5 Clustering Credit Default Swaps
6 Limits & Future Developments
Gautier Marti Optimal Transport between Copulas for Clustering Time Series

IntroductionDependence measures & Copulas
Optimal TransportThe Target Dependence Coefficient
Clustering Credit Default SwapsLimits & Future Developments
Common dependence measures
(a) ρ = 0.66 (b) ρ = 0.23 (c) ρS = 0.65 (d) ρS = 0.64
500 data points (xi , yi ) from N((
00
),
(1 0.6
0.6 1
)).
(a) Pearson correlation ρ between X and Y .
(b) Pearson correlation ρ between X and Y with one outlier introduced in the dataset.
(c) Spearman correlation ρS between X and Y which is Pearson correlation on the rank-transformed data.
(d) Spearman correlation ρS between X and Y with one outlier introduced in the dataset.
Gautier Marti Optimal Transport between Copulas for Clustering Time Series

IntroductionDependence measures & Copulas
Optimal TransportThe Target Dependence Coefficient
Clustering Credit Default SwapsLimits & Future Developments
Copulas
Sklar’s Theorem:
F (xi , xj) = Cij(Fi (xi ),Fj(xj))
Cij , the copula, encodes the dependence structureFrechet-Hoeffding bounds:
max{ui + uj − 1, 0} ≤ Cij(ui , uj) ≤ min{ui , uj}
Figure: (left) lower-bound copula, (mid) independence, (right)upper-bound copula
Gautier Marti Optimal Transport between Copulas for Clustering Time Series

IntroductionDependence measures & Copulas
Optimal TransportThe Target Dependence Coefficient
Clustering Credit Default SwapsLimits & Future Developments
Dependence measures and their relations to copulas
Bivariate dependence measures:
deviation from Frechet-Hoeffding bounds
Spearman’s ρS ,Gini’s γ,Kendall distribution distance [2],
deviation from independence uiujSpearman,Copula MMD [6],Schweizer-Wolff’s σ,Hoeffding’s Φ2
Gautier Marti Optimal Transport between Copulas for Clustering Time Series

IntroductionDependence measures & Copulas
Optimal TransportThe Target Dependence Coefficient
Clustering Credit Default SwapsLimits & Future Developments
Motivation: Target specific dependence, forget others
Motivation: We want to detect y = f (x2) and y = f (x), but noty = g(x), where f , g are respectively strictly increasing, decreasing.Problem: A dependence measure which is powerful enough todetect y = f (x2) will generally also detect y = g(x).
Dependence to detect (ρij := 1)
Dependence to ignore (ρij := 0)
Gautier Marti Optimal Transport between Copulas for Clustering Time Series

IntroductionDependence measures & Copulas
Optimal TransportThe Target Dependence Coefficient
Clustering Credit Default SwapsLimits & Future Developments
1 Introduction
2 Dependence measures & Copulas
3 Optimal Transport
4 The Target Dependence Coefficient
5 Clustering Credit Default Swaps
6 Limits & Future Developments
Gautier Marti Optimal Transport between Copulas for Clustering Time Series

IntroductionDependence measures & Copulas
Optimal TransportThe Target Dependence Coefficient
Clustering Credit Default SwapsLimits & Future Developments
Optimal Transport
Wasserstein metrics:
W pp (µ, ν) := inf
γ∈Γ(µ,ν)
∫M×M
d(x , y)pdγ(x , y)
In practice, the distance W1 is estimated on discrete data bysolving the following linear program with the Hungarian algorithm:
EMD(s1, s2) := minf
∑1≤k,l≤n
‖pk − ql‖fkl
subject to fkl ≥ 0, 1 ≤ k, l ≤ n,n∑
l=1
fkl ≤ wpk , 1 ≤ k ≤ n,
n∑k=1
fkl ≤ wql , 1 ≤ l ≤ n,
n∑k=1
n∑l=1
fkl = 1.
Gautier Marti Optimal Transport between Copulas for Clustering Time Series

IntroductionDependence measures & Copulas
Optimal TransportThe Target Dependence Coefficient
Clustering Credit Default SwapsLimits & Future Developments
EMD: How does it work? Showcase in 1D
Earth Mover Distance is the minimum cost, i.e. the amount of dirtmoved times the distance by which it is moved, of turning piles ofearth into others.
EMD = |x1 − x2| EMD = 16 |x1 − x3|+ 1
6 |x2 − x3|
Gautier Marti Optimal Transport between Copulas for Clustering Time Series
IntroductionDependence measures & Copulas
Optimal TransportThe Target Dependence Coefficient
Clustering Credit Default SwapsLimits & Future Developments
1 Introduction
2 Dependence measures & Copulas
3 Optimal Transport
4 The Target Dependence Coefficient
5 Clustering Credit Default Swaps
6 Limits & Future Developments
Gautier Marti Optimal Transport between Copulas for Clustering Time Series

IntroductionDependence measures & Copulas
Optimal TransportThe Target Dependence Coefficient
Clustering Credit Default SwapsLimits & Future Developments
EMD between Copulas - The Methodology
Why the Earth Mover Distance?
Figure: Copulas C1,C2,C3 encoding a correlation of 0.5, 0.99, 0.9999respectively; Which pair of copulas is the nearest? For Fisher-Rao,Kullback-Leibler, Hellinger and related divergences:D(C1,C2) ≤ D(C2,C3); EMD(C2,C3) ≤ EMD(C1,C2)
Gautier Marti Optimal Transport between Copulas for Clustering Time Series

IntroductionDependence measures & Copulas
Optimal TransportThe Target Dependence Coefficient
Clustering Credit Default SwapsLimits & Future Developments
EMD between Copulas - The Methodology
Probability integral transform of a variable xi :
FT (xki ) =1
T
T∑t=1
I (x ti ≤ xki ),
i.e. computing the ranks of the realizations, and normalizingthem into [0,1]
Gautier Marti Optimal Transport between Copulas for Clustering Time Series
IntroductionDependence measures & Copulas
Optimal TransportThe Target Dependence Coefficient
Clustering Credit Default SwapsLimits & Future Developments
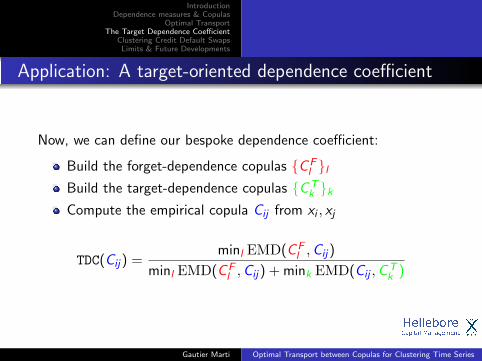
Application: A target-oriented dependence coefficient
Now, we can define our bespoke dependence coefficient:
Build the forget-dependence copulas {CFl }l
Build the target-dependence copulas {CTk }k
Compute the empirical copula Cij from xi , xj
TDC(Cij) =minl EMD(CF
l ,Cij)
minl EMD(CFl ,Cij) + mink EMD(Cij ,CT
k )
Gautier Marti Optimal Transport between Copulas for Clustering Time Series

IntroductionDependence measures & Copulas
Optimal TransportThe Target Dependence Coefficient
Clustering Credit Default SwapsLimits & Future Developments
Target Dependence Coefficient: Two examples
Motivating example
Figure: Dependence is measured asthe relative distance from thenearest forget-dependence(independence) to the nearesttarget-dependence (comonotonic)
Classical dependence
Figure: Dependence is measured asthe relative distance fromindependence to the nearesttarget-dependence: comonotonicityor counter-monotonicity
Gautier Marti Optimal Transport between Copulas for Clustering Time Series

IntroductionDependence measures & Copulas
Optimal TransportThe Target Dependence Coefficient
Clustering Credit Default SwapsLimits & Future Developments
Benchmark: Power of Estimators
0.0
0.4
0.8
xvals
pow
er.cor[typ,]
xvals
pow
er.cor[typ,]
0.0
0.4
0.8
xvals
pow
er.cor[typ,]
xvals
pow
er.cor[typ,]
cordCorMICACERDCTDC
0.0
0.4
0.8
xvals
pow
er.cor[typ,]
xvalspow
er.cor[typ,]
0 20 40 60 80 100
0.0
0.4
0.8
xvals
pow
er.cor[typ,]
0 20 40 60 80 100
xvals
pow
er.cor[typ,]
Noise Level
Pow
er
Figure: Dependence estimators power as a function of the noise forseveral deterministic patterns + noise. Their power is the percentage oftimes that they are able to distinguish between dependent andindependent samples. Experiments similar to [3]
Gautier Marti Optimal Transport between Copulas for Clustering Time Series

IntroductionDependence measures & Copulas
Optimal TransportThe Target Dependence Coefficient
Clustering Credit Default SwapsLimits & Future Developments
1 Introduction
2 Dependence measures & Copulas
3 Optimal Transport
4 The Target Dependence Coefficient
5 Clustering Credit Default Swaps
6 Limits & Future Developments
Gautier Marti Optimal Transport between Copulas for Clustering Time Series

IntroductionDependence measures & Copulas
Optimal TransportThe Target Dependence Coefficient
Clustering Credit Default SwapsLimits & Future Developments
Clustering Financial Time Series
East Japan Railway Com-
pany vs. Tokyo Electric
Power Company:
ρ = 0.49,
ρS = 0.17,
τ = 0.12
TDC = 0.19
Gautier Marti Optimal Transport between Copulas for Clustering Time Series

IntroductionDependence measures & Copulas
Optimal TransportThe Target Dependence Coefficient
Clustering Credit Default SwapsLimits & Future Developments
Impact of different coefficients
Which is best? One can look at:
stability criteria [5],
convergence rates [4],
Gautier Marti Optimal Transport between Copulas for Clustering Time Series

IntroductionDependence measures & Copulas
Optimal TransportThe Target Dependence Coefficient
Clustering Credit Default SwapsLimits & Future Developments
1 Introduction
2 Dependence measures & Copulas
3 Optimal Transport
4 The Target Dependence Coefficient
5 Clustering Credit Default Swaps
6 Limits & Future Developments
Gautier Marti Optimal Transport between Copulas for Clustering Time Series

IntroductionDependence measures & Copulas
Optimal TransportThe Target Dependence Coefficient
Clustering Credit Default SwapsLimits & Future Developments
Computational Limits
The methodology presented can be applied in higher dimensions,but it has some scalability issues:
non-parametric density estimation is hard (problem oftenreferred as the curse of dimensionality),
costly to compute due to the exponential number of bins.
Partial solutions:
Approximation schemes can drastically reduce thecomputation time [1]
Parametric modelling (optimal transport between Gaussianmeasures [7]) can alleviate these issues but loses genericity.
Gautier Marti Optimal Transport between Copulas for Clustering Time Series

IntroductionDependence measures & Copulas
Optimal TransportThe Target Dependence Coefficient
Clustering Credit Default SwapsLimits & Future Developments
Marco Cuturi.Sinkhorn distances: Lightspeed computation of optimaltransport.In Advances in Neural Information Processing Systems, pages2292–2300, 2013.
Fabrizio Durante and Roberta Pappada.Cluster analysis of time series via kendall distribution.In Strengthening Links Between Data Analysis and SoftComputing, pages 209–216. Springer, 2015.
David Lopez-Paz, Philipp Hennig, and Bernhard Scholkopf.The randomized dependence coefficient.In Advances in Neural Information Processing Systems, pages1–9, 2013.
Gautier Marti Optimal Transport between Copulas for Clustering Time Series

IntroductionDependence measures & Copulas
Optimal TransportThe Target Dependence Coefficient
Clustering Credit Default SwapsLimits & Future Developments
Gautier Marti, Sebastien Andler, Frank Nielsen, and PhilippeDonnat.Clustering financial time series: How long is enough?2016.
Gautier Marti, Philippe Very, Philippe Donnat, and FrankNielsen.A proposal of a methodological framework with experimentalguidelines to investigate clustering stability on financial timeseries.In 14th IEEE International Conference on Machine Learningand Applications, ICMLA 2015, Miami, FL, USA, December9-11, 2015, pages 32–37, 2015.
Barnabas Poczos, Zoubin Ghahramani, and Jeff G. Schneider.Copula-based kernel dependency measures.
Gautier Marti Optimal Transport between Copulas for Clustering Time Series

IntroductionDependence measures & Copulas
Optimal TransportThe Target Dependence Coefficient
Clustering Credit Default SwapsLimits & Future Developments
In Proceedings of the 29th International Conference onMachine Learning, ICML 2012, Edinburgh, Scotland, UK, June26 - July 1, 2012, 2012.
Asuka Takatsu et al.Wasserstein geometry of gaussian measures.Osaka Journal of Mathematics, 48(4):1005–1026, 2011.
Gautier Marti Optimal Transport between Copulas for Clustering Time Series
Top Related