


Languages
Pages
Legal


NBER WORKING PAPER SERIES
BEYOND BMI: THE VALUE OF MORE ACCURATE MEASURESOF FATNESS AND OBESITY IN SOCIAL SCIENCE RESEARCH
John CawleyRichard V. Burkhauser
Working Paper 12291http://www.nber.org/papers/w12291
NATIONAL BUREAU OF ECONOMIC RESEARCH1050 Massachusetts Avenue
Cambridge, MA 02138June 2006
Corresponding author. Contact information: John Cawley, Department of Policy Analysis and Management,124 MVR Hall, Cornell University, Ithaca NY 14853. Email: [email protected]. We thank Maki Ueyamafor research assistance. For helpful comments, we thank John Bound, Charlie Brown, Dean Lillard, BobSchoeni, Dan Silverman, and conference participants at the University of Michigan Retirement ResearchCenter. This work was supported by grants from the National Institute on Aging and from the Social SecurityAdministration through the Michigan Retirement Research Center. The findings and conclusions expressedare solely those of the authors and do not represent the views of the NIA, Social Security Administration,or the Michigan Retirement Research Center. The views expressed herein are those of the author(s) and donot necessarily reflect the views of the National Bureau of Economic Research.
©2006 by John Cawley and Richard V. Burkhauser. All rights reserved. Short sections of text, not to exceedtwo paragraphs, may be quoted without explicit permission provided that full credit, including © notice, isgiven to the source.

Beyond BMI: The Value of More Accurate Measures of Fatness and Obesity in Social ScienceResearchJohn Cawley and Richard V. BurkhauserNBER Working Paper No. 12291June 2006, Revised July 2006JEL No. I2, J2
ABSTRACT
Virtually all social science research related to obesity uses body mass index (BMI), usuallycalculated using self-reported values of weight and height, or clinical weight classifications basedon BMI. Yet there is wide agreement in the medical literature that such measures are seriouslyflawed because they do not distinguish fat from fat-free mass such as muscle and bone. Here weevaluate more accurate measures of fatness (total body fat, percent body fat, and waistcircumference) that have greater theoretical support in the medical literature. We provide conversionformulas based on NHANES data so that researchers can calculate the estimated values of thesemore accurate measures of fatness using the self-reported weight and height available in many socialscience datasets.
To demonstrate the benefits of these alternative measures of fatness, we show that using themsignificantly impacts who is classified as obese. For example, when the more accurate measures offatness are used, the gap in obesity between white and African American men increases substantially,with white men significantly more likely to be obese. In addition, the gap in obesity between AfricanAmerican and white women is cut in half (with African American women still significantly morelikely to be obese).
As an example of the value of fatness in predicting social science outcomes, we show thatwhile BMI is positively correlated with the probability of employment disability in the PSID, whenbody mass is divided into its components, fatness is positively correlated with disability whilefat-free mass (such as muscle) is negatively correlated with disability.
John Cawley124 MVR HallDepartment of Policy Analysis and ManagementCornell UniversityIthaca, NY 14853and [email protected]
Richard V. BurkhauserDepartment of Policy Analysis and ManagementCornell University125 MVR HallIthaca, NY [email protected]

2
Introduction
A wide variety of social science outcomes are affected by health (Culyer and
Newhouse, 2000), and one important dimension of health is fatness. Fatness is a concept
that refers to the abundance of adipose tissue, in which energy is stored in the form of fat
cells (Bjorntorp, 2002). Fatness is a risk factor for ischemic heart disease, congestive
heart failure, stroke, cancer, respiratory disease, diabetes, hyperlipidemia, hypertension,
asthma, sleep apnea, arthritis, degenerative joint disease, gastric reflux, and depression
(Pi-Sunyer, 2002; U.S. D.H.H.S., 2001; NIH, 1998). The current view of fatness in the
medical literature is that fat collectively constitutes an endocrine organ that secretes
leptin, which damages the cardiovascular system, and resistin, which causes insulin
resistance and Type II diabetes (Trayhurn and Beattie, 2001). The link between fatness
and morbidity has been confirmed in hundreds of randomized controlled trials in the
medical literature showing the correlation between weight loss and improvement in
obesity-related comorbidities (NIH, 1998; U.S. DHHS, 2001).
The health impact of fatness is particularly troubling because the average weight
of Americans has risen considerably in the past few decades (Hedley et al., 2004; Ogden
et al., 2006). Given the link between fatness and morbidity and mortality, excessive
fatness is now recognized as one of the most serious public health challenges facing the
U.S. (U.S. DHHS, 2001) and other industrialized countries (International Obesity Task
Force, 2005).
In this paper, we investigate the best way to measure fatness for the purpose of
better predicting outcomes of interest to social scientists, such as employment, marriage,
and comorbid conditions. To date, fatness has almost universally been measured in the

3
social science literature using body mass index (BMI), which is weight in kilograms
divided by height in meters squared (U.S. DHHS, 2001; NIH, 1998).2 The advantage of
BMI is that the information required to calculate it (weight and height) is easy to collect
and relatively common in social science datasets such as the National Longitudinal
Surveys of Youth (NLSY), the Panel Study of Income Dynamics (PSID), the Health and
Retirement Study (HRS), the Behavioral Risk Factor Surveillance System (BRFSS), the
National Health Interview Survey (NHIS), and the National Longitudinal Survey of
Adolescent Health (Add Health).
Despite the widespread use of BMI among social scientists, within the medical
literature BMI is considered to be a very limited measure of fatness and obesity because
it does not distinguish body composition (McCarthy et al., 2006; Yusuf et al 2005;
Gallagher et al 1996; Smalley et al 1990; Garn et al 1986). For example, it overestimates
fatness among those who are muscular (U.S. DHHS, 2001; Prentice and Jebb, 2001).
Gallagher et al. (1996) calculated that BMI alone accounts for just 25 percent of between-
individual differences in percent body fat.
Obesity is a concept that refers to excessive fatness (Bjorntorp, 2002; Bray,
Bouchard, and James, 1998). The most common definition of obesity used in the social
science literature is based on BMI: a BMI greater than or equal to 30. However, there are
a variety of definitions of obesity, corresponding to the various measures of fatness, and
the strengths and weaknesses of each definition of obesity depend on the strengths and
weaknesses of the fatness definition on which it is based. For this reason, the clinical
weight classification of obesity that is based on BMI suffers the same limitation as BMI:
2 For example, EconLit lists 55 articles with the words “body mass index” or “BMI” in the abstract or among the keywords, but zero articles with the more accurate measures of fatness in the abstract or among the keywords.
4
it ignores body composition. Smalley et al (1990) tested the accuracy of BMI-based
definitions of obesity at identifying those determined to be obese through measurements
of body fat and found that BMI correctly identified only 44.3 percent of obese men and
55.4 percent of obese women. Put another way, a majority of truly obese men are
misclassified as non-obese if one uses the BMI-based definition of obesity. Subsequent
studies in the medical literature have confirmed this finding (Wellens et al 1996).
The use of BMI to classify people as obese also results in false positives because
people who are muscular but not fat have a higher BMI; these false positives totaled 9.9
percent of non-obese men and 1.8 percent of non-obese women (Smalley et al, 1990).
(Women are less likely to be inaccurately classified as obese on the basis of BMI because
they are less likely to be heavily muscular.) Based on all of these findings, the
researchers concluded that the ability of BMI in particular, and weight-height indices in
general, to identify obesity defined using direct measures of fatness is “poor” (Ibid, p.
408). Moreover, the inferiority of BMI at predicting health outcomes relative to more
accurate measures of fatness led a 2005 editorial in the British medical journal The
Lancet to conclude “…current practice with body-mass index as the measure of obesity is
obsolete, and results in considerable underestimation of the grave consequences of the
overweight epidemic” (Kragelund and Omland, 2005, p. 1590).
Despite the skepticism in the medical literature toward BMI as a measure of either
fatness or obesity, virtually no tests of the robustness of social science-based findings
using these more accurate measures of fatness have been undertaken on social science-

5
based outcomes.3 Here we attempt to facilitate such studies both in the short run — and
even more importantly — in the long run.
In the short run this paper provides researchers with the tools to estimate more
accurate measures of fatness using currently available variables in social science datasets
such as the NLSY, PSID, HRS, BRFSS, NHIS, and Add Health. Specifically, we
provide conversion formulas based on data from the National Health and Nutrition
Examination Survey III (NHANES III) so that researchers can calculate the estimated
values of these more accurate measures of fatness using the self-reported weight and
height measures available in many social science datasets. We believe that these
estimates are useful for several reasons. First, researchers can determine whether the
more accurate measures of fatness are better predictors than BMI of their outcome of
interest. Such research will be useful because it will provide the social science
community with evidence regarding the sensitivity of past findings that used BMI to
more accurate measures of fatness. We also show in this paper that such studies are
likely to be fruitful by demonstrating that important insights can be gained by using our
prediction equations to estimate more accurate measures of fatness in social science
datasets. As an example, we show that while BMI is weakly positively correlated with the
probability of employment disability in the PSID, when body mass is divided into its
components, total body fat is positively correlated with disability while fat-free mass
(such as muscle) is negatively correlated with disability.
3 To our knowledge, the only such study is Wada (2005), which uses the NHANES III to estimate total body fat and fat-free mass in the NLSY but is focused more narrowly to explore the differences across race and gender in the correlation between BMI and wages found in Cawley (2004) and Averett and Korenman (1999).

6
In the long run we hope this paper and the papers it inspires, showing the value of
these theoretically superior measure of fatness, will lead to the inclusion of more accurate
measures of fatness in future waves of social science datasets, both because the cost of
collecting such data is falling and the demand for them by the social science researchers
is rising.
More Accurate Measures of Fatness
While there is consensus in the medical literature that BMI is a poor measure of
fatness (McCarthy et al., 2006; Yusuf et al 2005; Gallagher et al 1996; Smalley et al
1990; Garn et al 1986), there is no consensus on which of the more accurate measures of
fatness is best (Freedman and Perry, 2000). Candidates include: total body fat (TBF),
percent body fat (PBF) which is total body fat divided by total mass, waist circumference
(WC), and waist-to-hip ratio (WHR).
Total body fat (TBF) and percent body fat (PBF) are appealing measures of
fatness because the medical literature suggests that it is fat that causes morbidity and
mortality (Pi-Sunyer, 2002; U.S. DHHS, 2001). For example, Trayhurn and Beattie
(2001) argue that fat directly causes Type II diabetes and cardiovascular disease by
secreting resistin and leptin; these findings suggest that TBF may be the most relevant
measure of fatness for predicting social science outcomes affected by health because the
sheer volume of fat may determine the amount of leptin and resistin released; on the other
hand PBF may be a better measure if additional fat-free-mass can dilute the health
impacts of those secretions.
Findings from the medical literature also suggest that it is not just the amount of
fat that matters, but also the location or distribution of that fat. In particular, abdominal

7
visceral fat (i.e. that located around the internal organs) is associated with an elevated risk
of morbidity (Bray, Bouchard, and James, 1998). The amount of abdominal visceral fat
can be assessed using laboratory methods like dual-energy X-ray absorptiometry, but in
practice it is frequently measured using either waist circumference or waist-to-hip ratio;
comparisons have found that these two are highly correlated with abdominal fat (Snijder
et al., 2002). Yusuf et al. (2005) conclude that by a variety of standards, waist-to-hip
ratio (WHR) and, to a lesser extent, waist circumference better predict heart attack than
does BMI; an accompanying comment in The Lancet entitled “A Farewell to Body-Mass
Index?” concluded that these findings represent “…the final nail in the casket for body-
mass index as an independent cardiovascular risk factor…” (Kragelund and Omland,
2005, pp. 1589, 1590).
While it is generally accepted that central adiposity (abdominal fat) is associated
with greater risk of morbidity and mortality, it is not clear that waist-to-hip ratio is the
best way to measure it. For example, a 1998 NIH report entitled Clinical Guidelines on
the Identification, Evaluation, and Treatment of Overweight and Obesity in Adults
recommends the use of waist circumference rather than waist to hip ratio to measure
central adiposity (NIH, 1998, p. xxiv).
Until recently the costs of collecting both measurements of fatness and in-depth
social science outcomes in one dataset were prohibitive. As a result, medical datasets that
include direct measures of fatness contain few outcomes of interest to social scientists,
and social science datasets do not contain accurate measures of fatness such as TBF,
PBF, WC, or WHR. We expect this to change as social science researchers become more
aware of the benefits of more accurate measures of fatness and as the costs of collecting

8
them continue to decline. Until then however, TBF and FFM can be estimated in social
science datasets using a two-step method. We use the NHANES III to generate
prediction equations for these more accurate measures of fatness, so researchers using a
social science dataset that includes self-reported weight and height can estimate them and
test the robustness of the previous literature (that used BMI) to the use of these more
accurate measures of fatness.
Data: National Health and Nutrition Examination Survey III (NHANES III)
The NHANES III is a nationally representative cross-sectional survey conducted
from 1988 to 1994. All respondents were asked to complete an extensive interview
(during which they were asked to report their weight and height) and undergo a
subsequent medical examination in a large mobile examination center (during which their
weight and height were measured). The NHANES III sample consists of 31,311
examined respondents. In this paper we use NHANES III adults aged 18-65.
The NHANES III is the “Rosetta Stone” for estimating more accurate measures of
fatness, because it includes the data necessary to calculate many measures of fatness; it
includes: self-reported weight and height, measured weight and height, measured waist
circumference, measured waist-to-hip ratio, and Bioelectrical Impedance Analysis (BIA)
readings that can be used to calculate fat-free mass and therefore total body fat and
percent body fat (we explain this calculation in the next section).4 This allows
4 There are a variety of ways of measuring TBF and therefore PBF, which range from methods that use very expensive equipment that can be used only in a lab setting and which require subject cooperation or exposure to radiation (e.g. magnetic resonance imaging or MRI, dual x-ray absorptiometry) to more portable (field-based) methods that are less expensive and rapid (e.g. Bioelectrical Impedance Analysis or BIA) (Freedman and Perry 2000). In this paper, we use measures of TBF and PBF that were estimated by BIA. Each method of measuring body composition has its pros and cons (Freedman and Perry 2000); for example, the BIA method of estimating fat-free mass is less accurate for the severely obese (NIH, 1996). However, despite this limitation, the NIH endorses BIA as a useful technique for measuring body fat and body composition generally (NIH 1996). Prentice and Jebb (2001) conclude: “Bioimpedance is probably

9
researchers to regress measured fatness on self-reported weight and height, transport the
coefficients on the self-reported variables to any social science dataset that includes self-
reported values, and to then construct estimates of measured fatness. We drop as
implausible observations with self-reported height either under four feet or over seven
feet (one observation of each) or with self-reported weight under 80 pounds (one
observation).
As part of the examination for respondents 12 years of age and older,
measurements from Bioelectrical Impedance Analysis (BIA) were recorded. NHANES
examiners attached a pair of electrodes to the right wrist and ankle, and passed a very
small (50 kHz) electrical current through the body and measured the resistance of the
body to the current. These measurements can be used to calculate fat and fat-free mass
because the resistance to an electric current is inversely related to the amount of fat-free
mass in the body; the water in muscles conducts electricity while fat is an insulator.
BIA is a well-established method widely used to measure body fat, and
considerable planning and training were devoted to maximizing the validity and
reliability of the BIA measurements taken as part of the NHANES (NIH, 1996; US
DHHS, 1994).5
BIA readings are missing for many NHANES III respondents. We have complete
data for 2,138 white females, 1,861 African American females, 1,911 white males, and
1,634 African American males. We cannot calculate FFM or TBF in NHANES III for the only technique that can meet the criteria of being simple, rapid, and free from operator variability” (page 146). However, it is not our position that BIA is preferable to all other methods of measuring body fat; we use it because it is one method endorsed by the NIH, it is the only method for which data is now available in a large, nationally representative U.S. dataset - the National Health and Nutrition Examination Surveys (U.S. DHHS, 1994). 5 Although BIA readings were also included in each of the annual NHANES surveys since 1999, the NHANES III is the most recent survey for which there are consensus prediction equations in the medical literature to convert these readings to Total body fat and Fat-free mass.

10
Mexican Americans because, as we explain later, the sample used to generate the
equations excluded Hispanics. However, when we examine waist circumference and
correct self-reported values of weight and height for reporting error, we have samples of
1,669 Mexican American females and 1,745 Mexican American males.
The NHANES III contains little data on labor market activity or other social
science outcomes, so in isolation it is not of much value in conducting social science
research. However, in conjunction with social science datasets such as the NLSY, PSID,
or HRS, it is very useful, as it allows us to combine its rich biomarker data with the rich
data on employment, relationships, and other outcomes in social science datasets.
We take into account the complex survey design of the NHANES III by
estimating our models using svy commands in Stata version 9.2 that account for the
strata, primary sampling units, and sample weights of the NHANES III. Because we look
separately at race-gender cells, and there are missing values of BIA readings for many
respondents, there were instances in which strata had only one primary sampling unit,
which violates the requirements of Stata’s complex survey design commands. Rather
than drop these observations and lose information, we merge the stratum with only one
PSU with another stratum, and give the PSU a unique identifier within the new stratum.6
We use the WTPFEX6 sample weight, which is recommended when the medical
examination variables (such as weight and BIA measurements) are studied.
Method of Calculating Total body fat (TBF) and Percent body fat (PBF)
We calculate TBF and PBF using measures from Bioelectrical Impedance
Analysis (BIA) contained in the NHANES III. There are multiple systems used to collect
6 This was not a problem for white females, but there was one such stratum (with three observations) for white males, six such strata (with 21 observations) for African American females, and five such strata (also with 21 observations) for African American males.
11
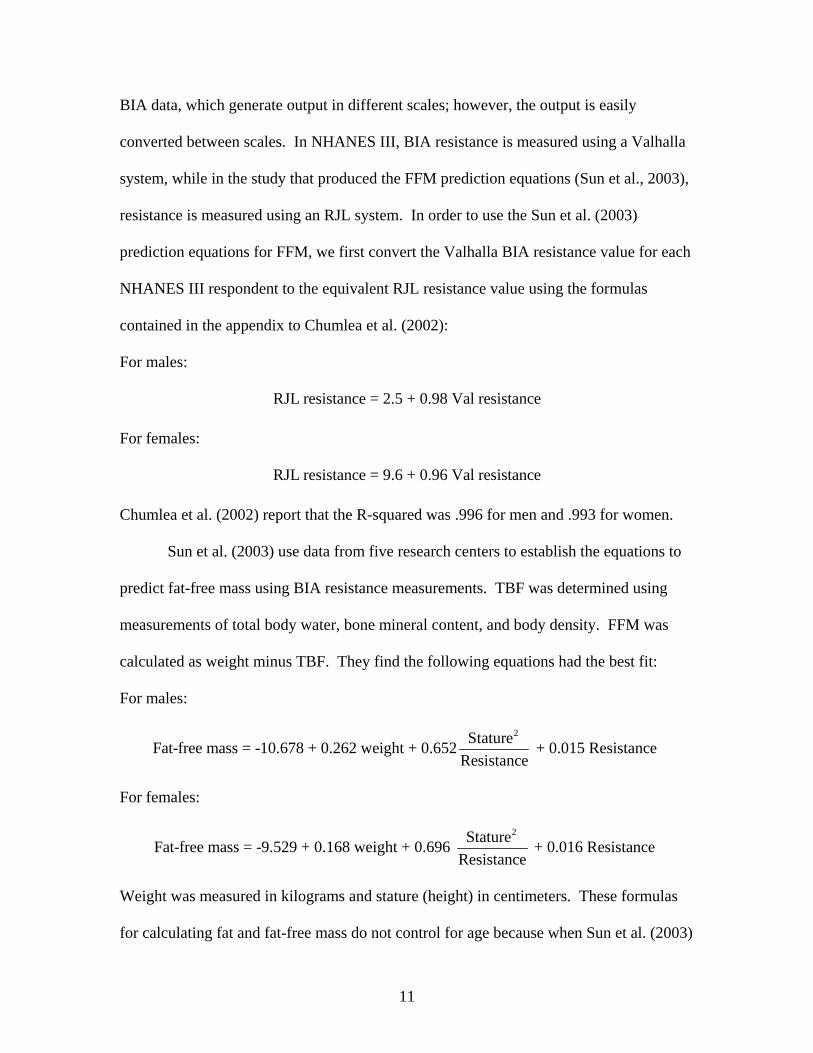
BIA data, which generate output in different scales; however, the output is easily
converted between scales. In NHANES III, BIA resistance is measured using a Valhalla
system, while in the study that produced the FFM prediction equations (Sun et al., 2003),
resistance is measured using an RJL system. In order to use the Sun et al. (2003)
prediction equations for FFM, we first convert the Valhalla BIA resistance value for each
NHANES III respondent to the equivalent RJL resistance value using the formulas
contained in the appendix to Chumlea et al. (2002):
For males:
RJL resistance = 2.5 + 0.98 Val resistance
For females:
RJL resistance = 9.6 + 0.96 Val resistance
Chumlea et al. (2002) report that the R-squared was .996 for men and .993 for women.
Sun et al. (2003) use data from five research centers to establish the equations to
predict fat-free mass using BIA resistance measurements. TBF was determined using
measurements of total body water, bone mineral content, and body density. FFM was
calculated as weight minus TBF. They find the following equations had the best fit:
For males:
2StatureFat-free mass = -10.678 + 0.262 weight + 0.652 + 0.015 Resistance Resistance
For females:
2StatureFat-free mass = -9.529 + 0.168 weight + 0.696 + 0.016 Resistance Resistance
Weight was measured in kilograms and stature (height) in centimeters. These formulas
for calculating fat and fat-free mass do not control for age because when Sun et al. (2003)

12
tested whether age should be included, they found it did not significantly improve the fit
of their model. The same formula is used for African Americans and whites because Sun
et al. (2003) found no significant differences in goodness of fit of their model whether
they pooled whites and African Americans or used whites alone; for this reason, they
report only equations derived from whites and African Americans pooled. However, Sun
et al. (2003) note that the final FFM equations (which do not control for race) tend to
underpredict African American males’ FFM by 2.1 kg and African American females’
FFM by 1.6 kg, and to overpredict white males’ FFM by 0.4 kg and white females’ FFM
by 0.3 kg (No Hispanics were in the sample.) We adjust the FFM of NHANES
respondents by these amounts. The R-squared of the prediction equation was .90 for men
and .83 for women.
BIA predicts fat-free mass, but total body fat is easily determined using the same
identity below for men and women:
Total body fat = weight – fat-free mass
and:
Percent body fat = (Total body fat / weight) * 100
Prediction Equations for Total body fat (TBF) and Fat-free mass (FFM)
Using the NHANES III data, we regress total body fat (TBF) and fat-free mass
(FFM) on self-reported weight and its square, self-reported height and its square, and age
and its square. The set of regressors in this NHANES III regression consists entirely of
variables also available in social science datasets like the PSID, NLSY, and HRS. Since
we found that the coefficients in these regressions differ significantly by race and sex,
we estimated models separately for white females, white males, African American

13
females, and African American males. (Because there were no Hispanics in the Sun et al.
(2003) sample, we restrict our analysis to whites and African Americans.)
The coefficients from these NHANES III regressions can be transported to
various social science datasets and multiplied by the values of the relevant variables to
predict TBF and FFM.7 We make the results of our NHANES III regressions available in
this paper so other researchers can easily calculate TBF in any of the several social
science datasets that contain self-reported weight and height. This will allow others to
use additional measures of fatness without having to first follow the earlier steps of using
the NHANES III.
We report results by race and sex from the TBF regression in Table 1, which
indicates that self-reported weight (in kg), self-reported height (in cm), and age are good
predictors of total body fat (in kg); R-squared values range from .76 to .90. This
indicates that the basic self-reported weight data available in several social science
datasets are sufficient to accurately estimate TBF. The results in Table 1 also indicate
that the fit is better for women (around 89 percent of variance explained) than for men
(77 percent).
We report results by race and sex from the FFM regression in Table 2. The
results indicate that self-reported weight (in kg), self-reported height (in cm), and age are
also good predictors of fat-free mass (in kg); the R-squares are in the narrow range of .81
to .82. (Unlike the TBF results, the goodness of fit in the FFM regressions is
approximately equal for men and women.) This confirms that the basic self-reported
weight data available in several social science datasets are also sufficient to accurately
7 Although TBF and FFM are in kilogram units, the transformation between pounds and kilograms is linear so we keep the self-report of weight in pounds since those are the units in which self-reported weight is recorded in most social science datasets.
14
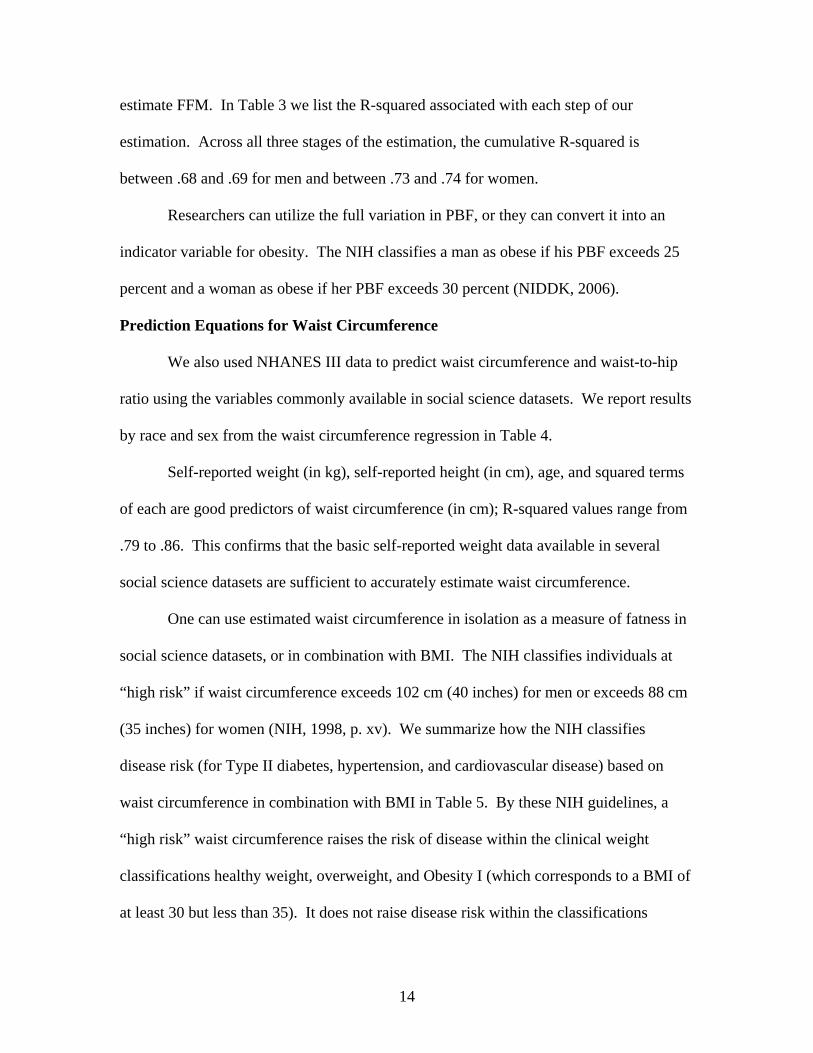
estimate FFM. In Table 3 we list the R-squared associated with each step of our
estimation. Across all three stages of the estimation, the cumulative R-squared is
between .68 and .69 for men and between .73 and .74 for women.
Researchers can utilize the full variation in PBF, or they can convert it into an
indicator variable for obesity. The NIH classifies a man as obese if his PBF exceeds 25
percent and a woman as obese if her PBF exceeds 30 percent (NIDDK, 2006).
Prediction Equations for Waist Circumference
We also used NHANES III data to predict waist circumference and waist-to-hip
ratio using the variables commonly available in social science datasets. We report results
by race and sex from the waist circumference regression in Table 4.
Self-reported weight (in kg), self-reported height (in cm), age, and squared terms
of each are good predictors of waist circumference (in cm); R-squared values range from
.79 to .86. This confirms that the basic self-reported weight data available in several
social science datasets are sufficient to accurately estimate waist circumference.
One can use estimated waist circumference in isolation as a measure of fatness in
social science datasets, or in combination with BMI. The NIH classifies individuals at
“high risk” if waist circumference exceeds 102 cm (40 inches) for men or exceeds 88 cm
(35 inches) for women (NIH, 1998, p. xv). We summarize how the NIH classifies
disease risk (for Type II diabetes, hypertension, and cardiovascular disease) based on
waist circumference in combination with BMI in Table 5. By these NIH guidelines, a
“high risk” waist circumference raises the risk of disease within the clinical weight
classifications healthy weight, overweight, and Obesity I (which corresponds to a BMI of
at least 30 but less than 35). It does not raise disease risk within the classifications
15
underweight, Obesity II (which corresponds to a BMI of at least 35 but less than 40) or
Obesity III (which corresponds to a BMI greater than or equal to 40).
The same NHANES variables that accurately predict waist circumference are not
sufficient to accurately predict our other measure of central adiposity, waist-to-hip ratio;
they explain a bare majority of the variation for men and only a third or less of variation
for women. As a result, we do not recommend estimating waist-to-hip ratio and so do not
offer prediction equations from NHANES in this paper.
Prediction Equations for Weight and Height (Correcting for Reporting Error)
Even if one wants to use weight controlling for height as a measure of fatness,
most social science datasets lack measurements of those characteristics; they typically
include only self-reported values. Previous research documents substantial reporting
error in self-reports of weight (e.g. Rowland, 1989); in general, the direction of reporting
bias is negatively correlated with actual weight: underweight people tend to overreport
their weight, and overweight people tend to underreport their weight. This reporting
error can result in severe underestimates of the number of individuals in high weight
classifications such as obesity and morbid obesity (Nieto-Garcia, Bush and Keyl, 1990).
This reporting error may also bias coefficient estimates (Bound, Brown, and Mathiowetz,
2002), so we correct for it applying the method by Lee and Sepanski (1995) and Bound et
al. (2002). This correction for reporting error does not completely eliminate reporting
error (Plankey et al., 1997), so measured weight is still preferable when it is available.
Since social science datasets generally lack measured weight and height, researchers
using such data will likely want to correct for reporting error. In recent years many
economists studying obesity have made this correction (e.g. Cawley, 2000, 2004;

16
Lakdawalla and Philipson, 2002; Chou, Grossman, and Saffer, 2004), so we provide here
NHANES III-based equations for predicting true weight and height to facilitate this
correction for future researchers.
We regress actual weight on reported weight, its square, and on age and its
square, separately by race and sex.8 Table 6 lists the constant and coefficients from this
regression. The goodness of fit of the models in Table 6 is extremely high, with R-
squared ranging from .91 to .95.
We repeat this process for height in Table 7. The fit of the models of height are
also high but not as high as for weight; the R-squared ranges from .69 to .90. The
coefficients from these regressions can be transported to the social science dataset and
multiplied by the self-reported values to construct measures of weight and height
corrected for reporting error. Again, this assumes transportability; i.e. that the
relationship between true and reported values is the same in both datasets.
Table 8 shows what difference this correction makes to BMI. The first column
shows average BMI based on self-reported weight and height, the second column shows
average BMI based on weight and height corrected for reporting error, and the third
column shows BMI based on measured values. Table 8 shows that using self-reported
values of weight and height to construct BMI, on average, results in an underreported
BMI. For each group of women, the difference between mean BMI based on measured
values and mean BMI based on self-reported values is statistically significant at the 1
8 We tested and rejected the hypothesis that coefficients were equal across gender and race; the one exception was that we could not reject equality of coefficients in the weight regression for females across whites, African Americans, and Mexican Americans, but since the hypothesis of equality was rejected in every other case, we consistently provide coefficient estimates from models estimated separately by race and gender.

17
percent level, whereas mean BMI based on corrected values is not significantly different
than BMI based on measured values.
Results for men differ by race and sex. White males resemble women in that the
difference between mean BMI based on measured values and mean BMI based on self-
reported values is statistically significant at the 1 percent level, whereas mean BMI based
on corrected values is not significantly different than BMI based on measured values.
However, for African American and Mexican American males, mean BMI based on
corrected values is slightly less than the mean BMI based on self-reports, but the
difference is not statistically significant, and neither is significantly different from mean
BMI based on measurements.
While the difference in mean BMIs shown in Table 8 is relatively small, the
underreporting of weight can nonetheless have a large impact on estimated rates of
obesity. This is because shifting a normal distribution even slightly to the left can
dramatically decrease the percentage of the total density to the right of a given cutoff.
Table 9 shows that the correction for reporting error results in obesity rates increasing by
2.5 percentage points for white females, almost 5 percentage points for African American
females, and almost 6 percentage points for Mexican American females. Correcting for
reporting error also raises the obesity rates of white and African American men, but the
correction slightly lowers the obesity rate of Mexican American men, but it is not a
significant difference. For every race-sex group, the obesity rate found using self-
reported weight and height to estimate BMI is significantly lower than the obesity rate
found using measured values of weight and height to estimate BMI. When BMI is
calculated using measures of weight and height that have been corrected for reporting

18
error, the associated obesity rates are not significantly different from obesity rates using
measured weight and height for African American women, Mexican American women,
white males, and African American males. Clearly, correcting self-reported weight and
height for reporting error can substantially improve the accuracy of estimated obesity
rates.
Other Issues when Predicting Measures of Fatness in Social Science Datasets
We use the same subset of variables (self-reported weight and its square, self-
reported height and its square, age and its square) in our prediction equations for total
body fat, fat-free mass, waist circumference, and weight and height corrected for
reporting error. There are an infinite number of linear and nonlinear combinations of
these variables, and one can imagine a research agenda aimed at finding which nonlinear
combination of them best predicts social science outcomes. However, that is most
emphatically not our agenda; we are not interested in such an open-ended atheoretical
model fitting exercise. Instead, we focus on the combinations of those variables that best
predict measures of fatness that have considerable face validity and external validity in
the medical literature. (Moreover, in the long run, when biomarkers are collected as part
of social science datasets, the preliminary step of estimating more accurate measures of
fatness will be unnecessary.)
While we have included both linear and squared terms in our prediction
equations, other researchers may seek to explore other functional forms for the
relationship between the more accurate measure of fatness and self-reported weight, self-
reported height, and age in the NHANES III. Likewise it is possible to include any
variable that appears in both the NHANES III and social science datasets in our equations
19
predicting these different measures of chosen measures of fatness. In particular, we
could also have included: education category, income category, and marital status. The
advantage of including them is that they may increase the predictive power of the model.
The disadvantage is that the wording and response categories of these questions may
differ between the NHANES and social science datasets, and thus it may be less
defensible to “transport” the NHANES coefficients to the values reported in a different
dataset. Since the fit of our models is good with our current set of regressors, we choose
to be parsimonious, but acknowledge that other researchers may wish to include a
broader set of variables.
There are several factors that may weaken the assumption behind
“transportability,” i.e. that the relationship between measured fatness and self-reported
weight is the same in the NHANES and in the social science dataset of interest. First, the
NHANES collects self-reported weight in a face-to-face interview, whereas several social
science datasets (e.g. PSID, BRFSS, HRS) collect at least some of their data on self-
reported weight through phone interviews.9 If self-reports differ considerably when
collected in a face-to-face interview as opposed to over the phone, the relationship
between measured fatness and self-reported weight may differ between the NHANES and
the other social science datasets.
Another limitation is that the NHANES III data were collected 1988-94, whereas
our PSID data were collected in 1986, 1999, 2001, and 2003. Any change over time in
the relationship between measured fatness and self-reported weight would be problematic
because it violates the assumption of transportability between the two datasets. More
9 Social science datasets that, like the NHANES, use face-to-face interviews include the NLSY 1979 Cohort, NLSY 1997 Cohort, Add Health, and NHIS.
20
recent NHANES surveys have been conducted annually since 1999, and once BIA
prediction equations become available for those more recent datasets, it will become
possible to test whether the relationship between measured fatness and self-reported
weight changed over time. In addition, researchers will then have the option of using
more recent NHANES data if it is more proximate to their social science data.
The final limitation is that there was a gap between when the NHANES collected
self-reports of weight and when it measured fatness and weight. The NHANES III data
guide reports that the typical schedule for a survey site involved 3-4 weeks of household
interviews followed by medical examinations in weeks 4-7 (U.S. DHHS, 1994). Thus,
the period between self-report and measurement ranged between 0 to 7 weeks. As far as
we know, there is no reason to believe that this gap will bias estimates of the relationship
between self-reports and measured values, but it will weaken the explanatory power of
the self-report. However, the explanatory power of our prediction equations is extremely
high.
Researchers transporting these NHANES III coefficients to social science datasets
in order to construct more accurate measure of fatness should recognize that including an
estimate (rather than an error-free measurement) of fatness will cause the standard errors
in their regression models to be underestimated. Researchers should consider approaches
to appropriately adjust the standard errors as discussed by Bound, Brown, and
Mathiowetz (2002).
Defining Obesity Using BMI Results in Misclassification of Weight Status
We have shown that more accurate measures of fatness can be estimated using the
NHANES III and one of many social science datasets. But is worth the trouble to do it?
21
Obesity defined using BMI, though theoretically inferior, may be a reasonable proxy,
generally correctly classifying who is obese and who is not obese.
In this section we show that it is worth doing because obesity defined using BMI
(calculated using measured weight and height) is only weakly correlated with obesity
defined using percent body fat, and that obesity defined using BMI results in substantial
misclassification of individuals into weight classifications.
Although there are many measures of fatness, because of space constraints we
focus on two measures of obesity: body mass index (based on measured weight and
height) greater than or equal to 30, and a more accurate measure—percent body fat
greater than 25% for men or greater than 30% for women (NIDDK, 2006). The
correlation between the two is relatively weak: .45 for males and .38 for females.
Taking obesity status defined using PBF to be the true obesity status, we examine
how well obesity defined using BMI correctly classifies people. Table 10 shows that the
accuracy of obesity defined using BMI varies by sex. For example, only 0.17 percent of
all women classified as obese by BMI are actually not obese judging by percent body fat.
In contrast, 16.45 percent of all positives are false for men. One important reason for this
difference by sex is that men are more likely to have considerable muscle mass.
In general, false negatives are a much bigger problem than false positives for
obesity defined using BMI. In other words, many more people are obese than are
classified as such by BMI. The extent of false negatives in Table 10 also varies by sex:
62.85 percent for females compared to 28.66 percent for males. Consistent with previous
studies (Smalley et al., 1990; Wellens et al., 1996), we find that obesity defined using
BMI does a poor job of classifying people as obese or non-obese.
22
One important difference between obesity defined using BMI and that defined
using PBF is that the PBF-defined obesity is a lower threshold; far larger percentages of
people are classified as obese using the PBF threshold. Table 11 shows that while 23.3
percent of women are classified as obese according to BMI, three times as many (70.1
percent) are classified as obese by the PBF standard. The difference for men, though not
as large, is still striking: 18.9 percent are obese according to BMI, but 43.3 percent are
obese according to PBF. The fact that PBF results in a strikingly higher rate of obesity is
not necessarily an indictment of that measure. Yusuf et al. (2005) found that waist-to-hip
ratio was a far better predictor of heart attack than BMI and concluded that BMI greatly
underestimates the number of people for whom fatness impacts health. So while it is true
that more people are classified as obese by PBF than BMI, it is not clear that the
prevalence of obesity we have become accustomed to, because BMI is usually used to
define obesity, is the “right” prevalence of obesity.
To show how similarly BMI and PBF classify people as obese when controlling
for this difference in threshold, we choose cutoffs for PBF that generate the same rates of
obesity as are found when one uses BMI (roughly 23.3 percent for women and 18.9
percent for men). The analogous PBF cutoff is 41 percent body fat for women and 29
percent body fat for men. Using those PBF cutoffs, we find that the correlation in obesity
classifications is 70.2 percent for women and 47.1 percent for men. Treating the PBF
classification as correct, Table 12 shows that the BMI classification of obesity has a false
positive rate of 27.74 percent for women and 44.79 percent for men, and a false negative
rate of 5.42 percent for women and 9.31percent for men. (Lowering the PBF cutoff that
defines obesity resulted in an increase in the false positives rate and a decrease in the

23
false negative for BMI, reflecting the tradeoff between Type I and Type II error.) Even
controlling for the threshold effect, we find that BMI does a poor job of classifying
people as obese or non-obese. As we show below, the major reason is that BMI does not
distinguish between fat and fat free mass.
Why the Definition of Obesity Matters: Racial Disparities in Obesity
In the next two sections we provide examples of the value of using more accurate
measures of fatness in social science research. Although there are many measures of
fatness, because of space constraints we focus on a few. Our comparisons confirm that
the measure of fatness chosen by the researcher has enormous consequences for the
conclusions drawn about who is obese and how fatness affects social science outcomes.
As Tables 10, 11 and 12 demonstrate, BMI is a noisy measure of fatness since it
does not distinguish between fat and fat free mass. This would be less of an issue if this
noise were random across the population. However as we show in this section, this is not
the case across race and gender. Hence the prevalence of obesity will vary across race
and gender depending on how one defines obesity. We start by showing in Table 13 how
the amount of fat-free mass and total body fat vary with race and gender. On average,
African American females have 3.56 more kg of Fat-free mass (such as muscle, bone,
and fluid) than white females and African American males have 1.33 more kg of fat-free
mass than white males. Both of these differences are statistically significant. African
American women also have on average 3.16 more kg of total body fat, but their
additional fat-free mass almost perfectly offsets that, so African American females’
percent body fat is only 0.79 percentage points greater than that of white females, a
difference that is not statistically significant.

24
African American men not only have more fat-free mass on average, they also
have on average 2.33 fewer kg of total body fat compared to white men; as a result, their
average percent body fat is 2.85 percentage points lower than that of white men. This is a
statistically significant difference.
These differences across race in fat-free mass and total body fat are critical,
because BMI does not account in any way for differences in fat-free mass, nor are there
different BMI cutoffs for overweight or obesity for African Americans. Since African
Americans have on average higher Fat-free mass such as muscle and bone, BMI
mistakenly classifies them as more likely to be overweight and obese. Table 14 shows
that when one defines obesity using BMI, the obesity rate among African American
women is 11.40 percentage points higher than that among white women, a statistically
significant difference. Again when one defines obesity using BMI, the obesity rate among
African American men is 0.56 percentage points higher than that of white men, a
difference that is not statistically significant.
The black-white gap in obesity rates changes dramatically when one classifies
people as obese using the more accurate measure of percent body fat. The second
column of Table 14 shows that, while the black-white gap in obesity rates among women
continues to be statistically significant, it falls by more than half when one uses the more
accurate measure of PBF. Even more dramatic is the change among men. Whereas
African American and white men have statistically indistinguishable obesity rates when
one uses BMI, when one defines obesity using PBF the difference is statistically
significant with white men having an obesity rate that is 16.26 percentage points higher
than that of African American men. In summary, the use of a more accurate measure of

25
fatness generates obesity rates that challenge the conventional wisdom about who is
obese and why.
Why the Definition of Obesity Matters: Predicting Employment Disability
To illustrate the value of more accurate measures of fatness in predicting social
science outcomes, we focus in this section on one important outcome: employment
disability. The employment rate of working-age people with disabilities, defined using
self-reported work limitations, has fallen dramatically over the last two decades (both
absolutely and relative to working-age people without disabilities).10 Over this same time
period both the prevalence of obesity (based on a BMI measure) and the number of
beneficiaries receiving income from Social Security Disability Insurance (SSDI) doubled
(Ogden et al., 2006; Social Security Administration, 2006), raising the question of
whether the relative decline in employment and the growth in SSDI rolls is partly due to
the rise in obesity.
The medical and social science literatures offer some support for this hypothesis.
The medical literature has found strong correlations between obesity and various medical
conditions (Pi-Sunyer, 2002; U.S. DHHS, 2001; NIH, 1998). The social science
literature has found that obesity is correlated with exit from the work force and increases
in SSDI and Supplemental Security Insurance (SSI) rolls (Lakdawalla, Bhattacharya, and
Goldman, 2004; Ferraro et al., 2002; Narbro et al., 1996). Other research has used
variation in weight due to genetics to estimate the causal impact of BMI or obesity
defined using BMI on self-reported work limitation-based disability (Cawley, 2000;
Burkhauser and Cawley, 2005). However, a potential limitation of all these previous
10 See Stapleton and Burkhauser (2003) and Burkhauser, Houtenville, and Rovba (2006) for detailed discussions of the measurement issues associated with this literature.
26
social science studies is that they define fatness and obesity using body mass index
(BMI). As a result, they may misstate both the correlation as well as the casual
relationship between fatness and their outcome variables, including disability based on
self-reported work limitations.
As a first step in showing potential measurement errors introduced by BMI in this
literature, we focus on the correlation of various measures of fatness with self-reported
employment-based disability. In doing so, we set aside the issue of causality between the
two. As such, our estimates cannot be interpreted as measuring the causal impact of
fatness on disability.
Data: Panel Study of Income Dynamics (PSID)
For this section of the paper, we analyze a commonly studied social science
dataset, The Panel Study of Income Dynamics (PSID), which is a nationally
representative, longitudinal survey of individuals and the families in which they reside
(Hill, 1992). The sample size has grown from 4,800 families in 1968, the first year of the
study, to more than 7,000 families in 2003. The PSID recorded the self-reported weight
and height of the primary household respondent (the head of the household) and also
collected the primary respondent’s proxy reports of spouse’s weight in 1986, 1999, 2001,
and 2003.11 Data from these four years were pooled to create the sample for this paper;
the data were weighted using the individual sample weight for 2003. The PSID does not
ask whether women are pregnant at the time of interview. While it may be possible to
11 We include both self-reports and proxy reports in the analyses of this section and assume that the relationship between measured weight and height with proxy reports is the same as that with self-reports, but we acknowledge that a significant difference between the two would violate the assumptions behind transportability.

27
determine this retrospectively based on children’s ages, we have not done this. As a
result, some of the variation in weight among PSID women may be due to pregnancy.
As we did with the NHANES III, we drop as implausible observations with self-
reported height either under four feet (zero observations) or over seven feet (one
observation) or with self-reported weight under 80 pounds (seven observations). Our
final sample includes 5,411 observations for white females, 2,247 observations for
African American females, 5,447 observations for white males, and 1,481 observations
for African American males.
Disability is an elusive concept to measure since it reflects both health-based
impairments and the social environment. We follow the strategy suggested by
Burkhauser, Houtenville and Wittenberg (2003) and use a self-reported work limitation
measure of disability. Specifically, respondents in the PSID are asked “Do you have any
physical or nervous condition that limits the type of work or the amount of work you can
do?” Yes answers are coded as one and no answers are coded as zero and this binary
outcome is used as the dependent variable in a probit regression. Our research question
in this section is: Is fatness positively correlated with self-reported work limitations? To
answer this question, we present results from models in which we measure fatness in
various ways: 1) BMI (calculated using self-reports of height and weight); 2) self-
reported weight (in kilograms) controlling for self-reported height (in centimeters); or 3)
total body fat (TBF) and fat-free mass (FFM), predicted using the NHANES III
regressions described above. Each regression also controls for years of education, age,
age squared, and indicator variables for year and region of residence. Models are

28
estimated separately for white females, African American females, white males, and
African American males.
Table 15 shows that for white females, an extra unit of BMI (row 1) raises the
probability of self-reported work limitations by 0.39 percentage points (for a five-foot-
three-inch woman, a unit of BMI is equal to 2.66 kg). An extra kilogram of weight (row
2) raises the probability by 0.14 percentage points. However, both of these measures of
fatness (BMI, and weight in kg) ignore the composition of weight. When we decompose
body mass into Total body fat (TBF) and Fat-free mass (FFM), an extra kg of TBF is
associated (row 3) with a 0.22 percentage point higher probability self-reported work
limitations, whereas an extra kg of FFM is associated (row 4) with a 0.04 percentage
point lower probability of work limitations. It is not surprising that FFM is associated
with a lower probability of work limitations, since FFM includes muscle and bone, both
of which may be protective against injury.
Table 16 shows analogous results for African American females. Once again, the
probability of work limitations rises with both BMI (by 0.31 percentage points per unit of
BMI) and weight (by 0.12 percentage points per kg). However, once we decompose
body mass into TBF and FFM, we find that the probability of work limitations rises with
TBF (by 0.18 percentage points per kg) but has no significant correlation with FFM
(though the point estimate is negative). In each case, the correlation of each measure of
fatness with disability is weaker for African American women than white women. This
is consistent with a previous literature that finds that the correlation between labor market
outcomes and fatness measured using either BMI or obesity defined using BMI is more

29
negative for white than African American females (Cawley and Danziger, 2005; Cawley,
2004; Averett and Korenman, 1999).
Tables 17 and 18 present the analogous results for white and African American
males. Table 17 shows that, for white males, an extra unit of BMI (which for a six-foot
tall man is equal to 3.35 kg) is associated with a 0.12 percentage point higher probability
of disability. An extra kg of weight is associated with a 0.04 percentage point higher
probability of disability. When we decompose body mass into TBF and FFM, an extra
kg of TBF is associated with a 0.2 percentage point higher probability of disability but an
extra kg of FFM is associated with a 0.13 percentage point lower probability of disability.
As was true for women, the correlation of each measure of fatness with disability
is weaker for African American men than white men. Table 18 shows that, for African
American men, an extra unit of BMI is associated with a 0.03 lower probability of
disability. The correlation of weight in kilograms with disability is not statistically
significant. When we decompose body mass, we find that an extra unit of TBF is
associated with a 0.08 higher probability, and FFM is associated with a 0.06 lower
probability, of disability.
Comparing our results across these four tables, an important difference seems to
be that FFM is more negatively correlated with work limitations for men than women.
For both white and African American men, the correlation is statistically significant at the
1 percent level, whereas it was only significant at the 10 percent level for white females
and was not statistically significant for African American females.
This difference between men and women is consistent with two hypotheses: 1)
muscle is more protective against work limitations for men than women, perhaps because
30
more men are employed in physically demanding jobs that involve the risk of injury; and
2) conditional on becoming disabled, men lose more muscle mass than women, perhaps
either because they tend to be employed in jobs that maintain muscle mass or because
they can no longer participate in leisure activities that previously maintained their muscle
mass. This difference between men and women in how muscle correlates with labor
market outcomes may also explain previous findings that white men classified as
overweight (by their BMI) earn more than healthy-weight men (e.g. Cawley, 2004).
These men may simply be more muscular, not fatter, than healthy-weight men, and the
higher wage may reflect a higher marginal revenue product of labor due to their strength.
Overall, these results confirm two important points. First, not all body mass has
the same impact on social science outcomes; total body fat is associated with a higher
risk of adverse outcomes, but fat-free mass is associated with a lower risk of such
outcomes. This strongly supports our contention that more accurate measures of fatness
should be used in social science research. The use of BMI or weight ignores body
composition and misses these important ways in which body composition reflects health,
which impacts social science outcomes.
The second important claim confirmed by these findings is that the method of
transporting coefficients from NHANES to social science datasets such as the PSID
works well. It is possible to use the NHANES to construct more accurate measures of
fatness in widely used social science datasets that lack detailed medical examination data.
Discussion
In this paper we have shown that more accurate measures of fatness can be
estimated using the NHANES III in conjunction with social science datasets and that it is

31
worth the trouble to do so. Obesity defined using BMI is only weakly correlated with
obesity defined using percent body fat. Furthermore, obesity defined using BMI results in
substantial misclassification of individuals into weight classifications, judging by obesity
defined using more theoretically appropriate measures of fatness.
Obesity defined using percent body fat provides a very different picture of who
in America is obese than the traditional statistics based on BMI. The black-white gap in
obesity rates changes dramatically when one classifies people as obese using the more
accurate measure of percent body fat. While the obesity rate among African American
females remains significantly higher than that among white females, it falls by more than
half when one uses the more accurate measure of percent body fat. Even more dramatic
is the change among men. Whereas African American and white men have statistically
indistinguishable obesity rates when one uses BMI, when one uses PBF the obesity rate
among white men is dramatically higher than that of African American men, a difference
that is statistically significant. These findings challenge the conventional BMI-based
wisdom about who is obese and why.
We also find that partitioning body mass into total body fat (TBF) and fat-free-
mass (FFM) has important implications for predicting at least one important social
science outcome: employment disability. Our findings from the PSID reveal that not all
body mass has the same impact on self-reported work limitations. Total body fat is
associated with a higher risk of a disability, but fat-free mass is associated with a lower
risk of disability. The use of BMI or weight ignores body composition and misses these
important ways in which body composition reflects health, which impacts social science
outcomes.

32
In the short run this paper provides researchers with the tools to estimate more
accurate measures of fatness using currently-available variables in social science datasets
such as the NLSY, PSID, HRS, BRFSS, NHIS, and Add Health. In the long run we
predict this paper and the papers it inspires, showing the value of these theoretically
superior measure of fatness, will lead to the inclusion of more accurate measures of
fatness in future waves of social science datasets, both because the cost of collecting such
data is falling and the demand for them by the social science researchers is rising.
We do not claim to know yet which of the more accurate measures of fatness best
predicts social science outcomes, or which will be eventually included in social science
datasets. To paraphrase Winston Churchill, this study is not the end of this debate, nor is
it the beginning of the end; but it may be the end of the beginning. Social scientists
should now acknowledge that, because of its failure to distinguish body composition,
BMI is a deeply flawed measure. They should consider more accurate measures of
fatness that include, but are not necessarily limited to, percent body fat, total body fat,
and waist circumference. Exactly which measures prove to be most predictive of social
science outcomes will likely depend upon how fatness or obesity affects the social
science outcome of interest (e.g. through an obesity-related comorbidity or through
discrimination based on appearance).

33
References
Averett, Susan and Sanders Korenman. 1999. “Black-White Differences in Social and Economic Consequences of Obesity.” International Journal of Obesity, 23: 166-173.
Beertema, Wieske; van Hezewijk, Marjan; Kester, Arnold; Forget, Pierre-Philippe; van Kreel, Bernard. 2000. “Measurement of Total Body Water in Children Using Bioelectrical Impedance: A Comparison of Several Prediction Equations.” Journal of Pediatric Gastroenterology & Nutrition. 31(4):428-432.
Bjorntorp, Per. 2002. “Definition and Classification of Obesity.” In Christopher G. Fairburn and Kelly D. Brownell (eds.) Eating Disorders and Obesity: A Comprehensive Handbook, 2nd Edition. (New York: Guilford Press).
Bound, John, Charles Brown, and Nancy Mathiowetz. 2002. “Measurement Error in Survey Data.” in Handbook of Econometrics, volume 5, ed. James Heckman and Ed Leamer. (New York: Springer-Verlag).
Brown, Peter J. and Vicki K. Bentley-Condit. 1998. “Culture, Evolution, and Obesity.” In Handbook of Obesity, edited by George A. Bray, Claude Bouchard, and W.P.T. James. (Marcel Dekker: New York).
Bray, George A., Claude Bouchard, and W.P.T. James. 1998. “Definitions and Proposed Current Classification of Obesity.” Handbook of Obesity, (Marcel Dekker: New York).
Burkhauser, Richard V., and John Cawley. 2005. “Obesity, Disability, and Movement onto the Disability Insurance Rolls.” Paper presented at the International Health Economics Association 5th World Congress.
Burkhauser, Richard V., Andrew J. Houtenville, and David C. Wittenburg. 2003. “A User’s Guide to Current Statistics on the Employment of People with Disabilities.” In David C. Stapleton and Richard V. Burkhauser (eds.) The Decline in the Employment of People with Disabilities: A Policy Puzzle. (Kalamazoo, MI: W.E. Upjohn Institute for Employment Research), pp. 23-86.
Burkhauser, Richard V., Andrew J. Houtenville, and Ludmila Rovba. 2006. “Accounting for the Declining Fortunes of Working-Age People with Disabilities,” Cornell University Working Paper (March).
Cawley, John. 2000. “An Instrumental Variables Approach to Measuring the Effect of Body Weight on Employment Disability.” Health Services Research, 35(5, Part II): 1159-1179
Cawley, John. 2004. “The Impact of Obesity on Wages.” Journal of Human Resources, 39(2): 451-474.
Cawley, John, and Sheldon Danziger. 2005. “Morbid Obesity and the Transition From Welfare to Work.” Journal of Policy Analysis and Management, 24(4): 727-743.
Conley, Dalton, and Rebecca Glauber. 2005. “Gender, Body Mass, and Economic Status.” National Bureau of Economic Research Working Paper # 11343.
Chou, Shin-Yi, Michael Grossman, and Henry Saffer. 2004. “An Economic Analysis of Adult Obesity: Results from the Behavioral Risk Factor Surveillance System.” Journal of Health Economics, 23: 565-587.
Chumlea, W. Cameron, Shumei S. Guo, Robert J. Kuczmarski, Katherine M. Flegal, Clifford L. Johnson, Steven B. Heymsfield, Henry C. Lukaski, Karl Friedl, and

34
Van S. Hubbard. 2002. “Body Composition Estimates from NHANES III Bioelectrical Impedance Data.” International Journal of Obesity, 26: 1596-1609.
Culyer, Anthony J., and Joseph P. Newhouse. 2000. Handbook of Health Economics, Volumes 1A and 1B. (Elsevier: New York).
Ferraro, Kenneth F., Ya-ping Su, Randall J. Gretebeck, David Black, and Stephen F. Badylak. 2002. “Body Mass Index and Disability in Adulthood: A 20-Year Panel Study,” American Journal of Public Health, 92(5): 834-840.
Freedman, D.S. and G. Perry. 2000. “Body Composition and Health Status Among Children and Adolescents.” Preventive Medicine, 31(2, Part II Supplement): S34-S53.
Gallagher, Dympna, Marjolein Visser, Dennis Sepulveda, et al. 1996. “How Useful is Body Mass Index for Comparison of Body Fatness Across Age, Sex, and Ethnic Groups?” American Journal of Epidemiology, 143(3): 228-39.
Garn, S.M., W.R. Leonard, V.M. Hawthorne. 1986. “Three Limitations of the Body Mass Index.” American Journal of Clinical Nutrition, 44: 996-97.
Hedley, Allison A., Cynthia L.Ogden, Clifford L. Johnson, Margaret D. Carroll, Lester R. Curtin, and Katherine M. Flegal. 2004. “Overweight and Obesity Among U.S. Children, Adolescents, and Adults, 1999-2002.” JAMA, 291(23): 2847-2850.
Hill, Martha S. (1992), The Panel Study of Income Dynamics: A User's Guide. Beverly Hills, CA: Sage Publications.
International Obesity Task Force. EU Platform on Diet, Physical Activity, and Health, 2005. Online at: http://www.iotf.org/media/euobesity3.pdf
Kragelund, Charlotte, and Tobjorn Omland. 2005. “A Farewell to Body-Mass Index?” The Lancet, 366:1589-1591.
Lakdawalla, Darius, and Tomas Philipson. 2002. “The Growth of Obesity and Technological Change: A Theoretical and Empirical Investigation.” NBER Working Paper #8965.
Lakdawalla, Darius N., Jayanta Bhattacharya, and Dana P. Goldman. 2004. “Are the Young Becoming More Disabled?” Health Affairs, 23(1): 168-176.
Lee, Lung-fei and Jungsywan H. Sepanski. 1995. “Estimation of Linear and Nonlinear Errors-in-Variables Models Using Validation Data.” Journal of the American Statistical Association, 90(429): 130-40.
McCarthy, HD, TJ Cole, T Fry, SA Jebb, and AM Prentice. 2006. “Body Fat Reference Curves for Children.” International Journal of Obesity, 30: 598-602.
Narbro, Kristina, Egon Jonsson, Barbro Larsson, Hans Waaler, Hans Wedel, and Lars Sjostrom. 1996. “Economic Consequences of Sick-Leave and Early Retirement in Obese Swedish Women.” International Journal of Obesity and Related Metabolic Disorders, 20(10): 895-903.
National Institute of Diabetes and Digestive and Kidney Diseases (NIDDK), National Institutes of Health. 2006. “Weight-Control Information Network.” World wide web content. http://win.niddk.nih.gov/publications/understanding.htm#distribution Accessed May 19, 2006.
National Institutes of Health. 1996. “Bioelectrical Impedance Analysis in Body Composition Measurement: National Institutes of Health Technology Assessment

35
Conference Statement.” American Journal of Clinical Nutrition, 64(3S): 524S-532S.
National Institutes of Health. 1998. Clinical Guidelines on the Identification, Evaluation, and Treatment of Overweight and Obesity in Adults. NIH Publication 98-4083. (NIH: Washington, D.C.).
Nieto-Garcia, F. J., Bush, T. L. and Keyl, P. M. 1990. “Body Mass Definitions of Obesity: Sensitivity and Specificity Using Self-Reported Weight and Height.” Epidemiology, 1(2), 146-152.
Ogden, Cynthia, Margaret D. Carroll, Lester R. Curtin, Margaret A. McDowell, Carolyn J. Tabak, and Katherine M. Flegal. 2006. “Prevalence of Overweight and Obesity in the United States, 1999-2004.” JAMA, 295(13): 1549-1555.
Pi-Sunyer, F. Xavier. 2002. “Medical Complications of Obesity in Adults.” In Fairburn, Christopher G. and Kelly D. Brownell, Eating Disorders and Obesity: A Comprehensive Handbook, 2nd Edition. (Guilford Press: New York).
Plankey, MW, J Stevens, KM Flegal, and PF Rust. 1997. “Prediction Equations do not Eliminate Systematic Error in Self-Reported Body Mass Index.” Obesity Research, 5: 308-314.
Prentice Andrew M. and Susan A. Jebb. 2001. “Beyond Body Mass Index.” Obesity Reviews, 2(3): 141-147.
Rowland, M. L. 1989. “Reporting Bias in Height and Weight Data.” Statistical Bulletin, 70(2), 2-11.
Smalley, K.J., A.N. Knerr, Z.V. Kendrick, J.A. Colliver, and O.E. Owen. 1990. “Reassessment of Body Mass Indices.” American Journal of Clinical Nutrition, 52: 405-08.
Snijder, MG, M Visser, JM Dekker, et al. 2002. “The Prediction of Visceral Fat by Dual-Energy X-Ray Absorptiometry in the Elderly: A Comparison with Computed Tomography and Anthropometry.” International Journal of Obesity and Related Metabolic Disorders, 26: 984-993.
Social Security Administration. 2006. “Social Security Beneficiary Statistics.” Actuarial Publications. World wide web content. Accessed May 23, 2006. http://www.ssa.gov/OACT/STATS/OASDIbenies.html
Stapleton, David C. and Richard V. Burkhauser. (eds.) 2003. “The Decline in Employment of People with Disabilities, W.E. Upjohn Institute for Employment Research, Kalamazoo, MI
Sun, Shumei S., W. Cameron Chumlea, Steven B. Heymsfield, et al. 2003. “Development of Bioelectrical Impedance Analysis Prediction Equations for Body Composition With the Use of a Multicomponent Model for Use in Epidemiologic Surveys.” American Journal of Clinical Nutrition, 77: 331-40.
Trayhurn, Paul and John H. Beattie. 2001. “Physiological Role of Adipose tissue: White Adipose Tissue as an Endocrine and Secretory Organ.” Proceedings of the Nutrition Society, 60:329-339.
U.S. Department of Health and Human Services. 1994. “Plan and Operation of the Third National Health and Nutrition Examination Survey, 1988-94.” Vital and Health Statistics, Series 1: Programs and Collection Procedures, No. 32. (DHHS: Hyattsville, MD).
36
U.S. Department of Health and Human Services. 2001. The Surgeon General’s Call to Action to Prevent and Decrease Overweight and Obesity. (Washington, DC: U. S. Government Printing Office).
Wada, Roy. 2005. “Obesity, Muscularity, and Body Composition: The Puzzle of Gender-Specific Penalty and Between-Ethnic Outcomes.” Paper presented at 2005 Eastern Economic Association Meetings.
Wellens, R.I., A.F. Roche, H.J. Khamis, A.S. Jackson, M.L. Pollock, R.M. Siervogel. 1996. “Relationships Between the Body Mass Index and Body Composition.” Obesity Research, 4(1): 35-44.
Yusuf, Salim, Steven Hawken, Stephanie Ounpuu, et al. 2005. “Obesity and the Risk of Myocardial Infarction in 27000 Participants from 52 Countries: A Case-Control Study.” The Lancet, 366: 1640-1649.

37
Table 1 Predicting Total Body Fat (TBF) in kg, NHANES III
(1) (2) (3) (4)
Regressor White Females African American Females
White Males African American
Males Self-reported weight (kg)
0.89922*** 0.87631*** 0.38109*** 0.26752***
(19.6) (19.7) (7.02) (5.03) Self-reported weight (kg) squared
-0.00124*** -0.00100*** 0.00070** 0.00153***
(-4.32) (-3.61) (2.25) (5.35) Self-reported height (cm)
-0.82716 0.02741 1.43380** 1.02918
(-1.07) (0.049) (2.27) (1.33) Self-reported height (cm) squared
0.00181 -0.00070 -0.00471** -0.00357
(0.76) (-0.41) (-2.63) (-1.60) Age in years -0.09095** 0.01783 -0.03066 0.00721 (-2.50) (0.31) (-0.52) (0.096) Age in years squared
0.00121** -0.00035 0.00081 0.00018
(2.67) (-0.51) (1.16) (0.21) Constant 58.43316 -16.73487 -122.17814** -85.48695 (0.92) (-0.37) (-2.19) (-1.26) Observations 2138 1861 1911 1634 R-squared 0.90 0.88 0.77 0.76 Notes: 1) Table cells list coefficients and absolute value of t statistics in parentheses. 2) Asterisks indicate level of statistical significance: *** p<0.01, ** p<0.05, * p<0.1

38
Table 2
Predicting Fat-Free Mass (FFM) in kg, NHANES III
(1) (2) (3) (4) Regressor White Females African
American Females
White Males African American
Males Self-reported weight (kg)
0.29275*** 0.45456*** 0.55500*** 0.69071***
(6.58) (10.8) (12.2) (11.9) Self-reported weight (kg) squared
0.00036 -0.00061** -0.00016 -0.00083**
(1.19) (-2.34) (-0.69) (-2.58) Self-reported height (cm)
0.00231 -0.58533* -1.11216** -0.17975
(0.0058) (-1.86) (-2.12) (-0.34) Self-reported height (cm) squared
0.00065 0.00241** 0.00372** 0.00102
(0.53) (2.47) (2.49) (0.67) Age in years 0.12292*** 0.12897*** 0.12200** -0.02091 (3.38) (3.35) (2.11) (-0.39) Age in years squared
-0.00189*** -0.00178*** -0.00181*** -0.00006
(-4.59) (-3.81) (-2.77) (-0.100) Constant 3.20337 46.45843* 95.69915** 12.89614 (0.099) (1.87) (2.07) (0.28) Observations 2138 1861 1911 1634 R-squared 0.82 0.81 0.82 0.81 Notes: 1) Table cells list coefficients and absolute value of t statistics in parentheses. 2) Asterisks indicate level of statistical significance: *** p<0.01, ** p<0.05, * p<0.1

39
Table 3
Goodness of Fit for Each Stage of Estimates
Estimation Step R-squared Males
R-squared Females
Convert BIA resistance measures from Valhalla to RJL
.996 .993
Estimate body fat using BIA
.90 .83
Predict total body fat using BIA using self-reported weight
.77 (W) .76 (B)
.90 (W) .88 (B)
Composite R-Squared .69 (W) .68 (B)
.74 (W) .73 (B)
Note: W stands for white sample and B for African American sample. When no W or B is indicated, the R-squared corresponds to the pooled sample.

Table 4 Regression of Waist Circumference in cm on Self-Reported Weight and Height
in NHANES III, by Race and Gender (1) (2) (3) (4) (5) (6)
Regressor White Females
African American
Females
Hispanic Females
White Males
African American
Males
Hispanic Males
Self-reported weight (kg)
1.33461*** 1.33074*** 1.41506*** 1.02297*** 0.83855*** 0.78435***
(19.1) (16.6) (12.3) (9.65) (12.5) (11.9) Self-reported weight (kg) squared
-0.00297*** -0.00300*** -0.00379*** -0.00130** 0.00005 0.00003
(-6.64) (-6.00) (-4.65) (-2.27) (0.14) (0.082) Self-reported height (cm)
-1.02753 -0.43544 -0.96150 0.73592 1.56780* 1.88955***
(-1.59) (-0.63) (-0.91) (1.05) (1.91) (4.26) Self-reported height (cm) squared
0.00213 0.00041 0.00218 -0.00319 -0.00558** -0.00647***
(1.08) (0.20) (0.65) (-1.65) (-2.40) (-4.90) Age in years -0.09750 0.14324 -0.00652 0.28079*** 0.28580*** 0.36593*** (-1.29) (1.14) (-0.069) (4.22) (3.98) (4.41) Age in years (squared) 0.00344*** 0.00065 0.00266** -0.00067 -0.00025 -0.00161 (3.79) (0.42) (2.34) (-0.86) (-0.28) (-1.63) Constant 119.32391** 64.16721 106.31862 -20.51876 -92.12839 -112.52528*** (2.28) (1.13) (1.30) (-0.33) (-1.26) (-3.04) Observations 2112 1821 1393 1890 1595 1625 R-squared 0.85 0.83 0.79 0.86 0.85 0.83 Notes: 1) t statistics in parentheses 2) Asterisks indicate level of statistical significance: *** p<0.01, ** p<0.05, * p<0.1
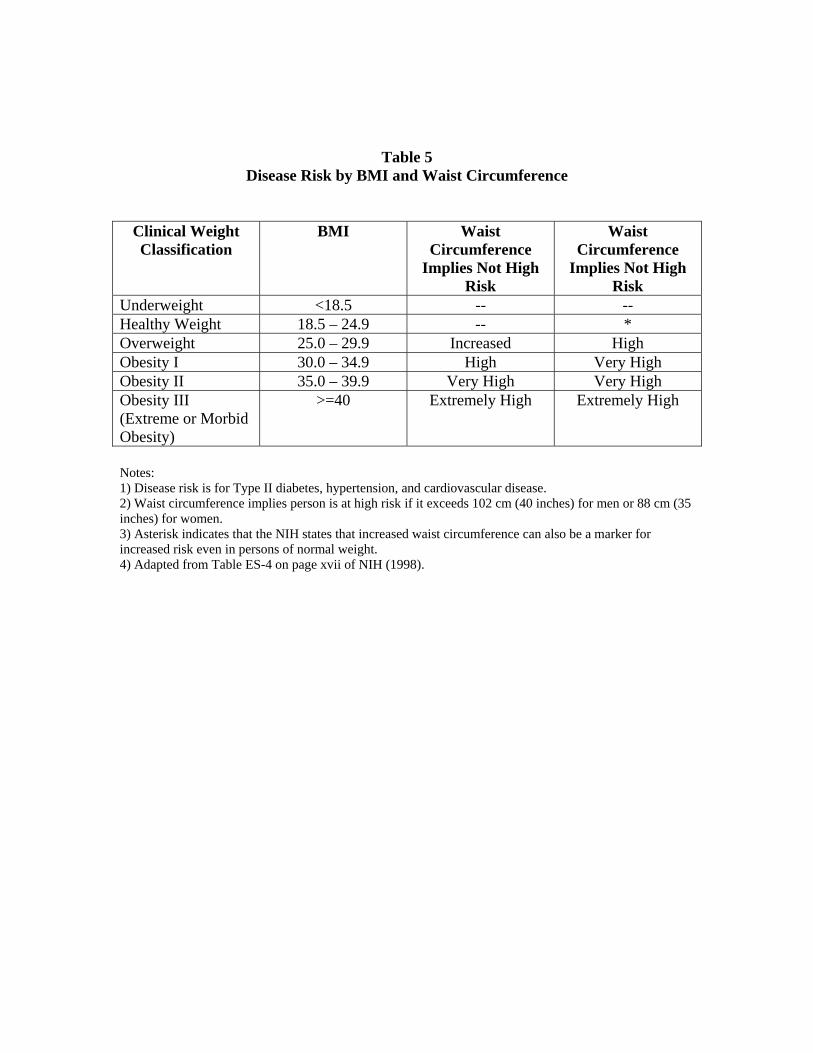
Table 5
Disease Risk by BMI and Waist Circumference
Clinical Weight Classification
BMI Waist Circumference
Implies Not High Risk
Waist Circumference
Implies Not High Risk
Underweight <18.5 -- -- Healthy Weight 18.5 – 24.9 -- * Overweight 25.0 – 29.9 Increased High Obesity I 30.0 – 34.9 High Very High Obesity II 35.0 – 39.9 Very High Very High Obesity III (Extreme or Morbid Obesity)
>=40 Extremely High Extremely High
Notes: 1) Disease risk is for Type II diabetes, hypertension, and cardiovascular disease. 2) Waist circumference implies person is at high risk if it exceeds 102 cm (40 inches) for men or 88 cm (35 inches) for women. 3) Asterisk indicates that the NIH states that increased waist circumference can also be a marker for increased risk even in persons of normal weight. 4) Adapted from Table ES-4 on page xvii of NIH (1998).

Table 6
Regression of Measured Weight in Pounds on Self-Reported Weight in NHANES III, by Race and Gender
(1) (2) (3) (4) (5) (6) Regressor White Females African
American Females
Mexican American Females
White Males African American
Males
Mexican American Males
Self-reported weight (lbs)
1.20689*** 1.24655*** 1.33699*** 0.93983*** 0.86586*** 0.91762***
(29.1) (22.7) (17.2) (13.9) (12.9) (13.8) Self-reported weight (lbs) squared
-0.00044*** -0.00050*** -0.00085*** 0.00021 0.00052*** 0.00027
(-3.20) (-3.25) (-3.60) (1.34) (3.02) (1.47) Age in years -0.08011 0.16573 -0.08408 0.21393 -0.02656 0.23878** (-0.66) (1.11) (-0.59) (1.57) (-0.21) (2.13) Age in years (squared)
-0.00013 -0.00307 0.00006 -0.00234 0.00035 -0.00285*
(-0.096) (-1.66) (0.032) (-1.59) (0.24) (-2.01) Constant -13.47855*** -23.05364*** -24.42148*** -1.39402 4.59831 0.39478 (-4.27) (-3.97) (-3.36) (-0.23) (0.72) (0.061) Observations 2338 2164 1669 1986 1763 1745 R-squared 0.94 0.92 0.91 0.95 0.93 0.92
Notes: 1) t statistics in parentheses 2) Asterisks indicate level of statistical significance: *** p<0.01, ** p<0.05, * p<0.1

43
Table 7 Regression of Measured Height in Inches on Self-Reported Height
in NHANES III, by Race and Gender
(1) (2) (3) (4) (5) (6) Coefficient White Females African
American Females
Mexican American Females
White Males African American
Males
Mexican American Males
Self-reported height (inches)
0.22581 -0.21104 -1.29528 -0.28997 -0.61905 -2.21063***
(0.45) (-0.25) (-1.39) (-0.85) (-1.35) (-4.99) Self-reported height (inches) squared
0.00510 0.00774 0.01639** 0.00853*** 0.01022*** 0.02202***
(1.30) (1.17) (2.20) (3.48) (3.13) (6.83) Age in years 0.07867*** 0.05574*** 0.02715 0.03577*** 0.04208*** 0.02651 (9.02) (4.40) (1.67) (3.64) (3.53) (1.39) Age in years squared
-0.00109*** -0.00078*** -0.00049** -0.00052*** -0.00060*** -0.00050**
(-10.7) (-4.50) (-2.29) (-4.77) (-4.23) (-2.10) Constant 27.45112* 44.86075 78.60810** 47.48629*** 62.12826*** 115.73243*** (1.68) (1.64) (2.70) (3.98) (3.83) (7.58) Observations 2338 2164 1669 1986 1763 1745 R-squared 0.88 0.80 0.69 0.90 0.85 0.74
Notes: 1) t statistics in parentheses 2) Asterisks indicate level of statistical significance: *** p<0.01, ** p<0.05, * p<0.1

Table 8
Average BMIs, by Race and Gender
BMI Based on Self- Reports
BMI Based on Self-Reports Corrected
for Reporting Error
BMI Based on Measurements
White Females 25.11*** 25.68 25.76 African American Females
27.41*** 28.19 28.27
Mexican American Females
26.69*** 27.61 27.67
White Males 26.19*** 26.46 26.53 African American Males
26.37 26.31 26.38
Mexican American Males
26.77 26.74 26.79
Notes: 1) Data: NHANES III 2) Asterisks indicate level of statistical significance: *** p<0.01, ** p<0.05, * p<0.1.
Table 9 Rates of Obesity, by Race and Gender
Obesity Based on
BMI Based on Self Reports
Obesity Based on BMI Based on Self-Reports Corrected
for Reporting Error
Obesity Based on BMI Based on Measurements
White Females 17.42*** 20.08*** 21.57 African American Females
28.30*** 33.20 33.27
Mexican American Females
23.79*** 29.58 30.79
White Males 15.77*** 17.69 19.16 African American Males
17.32*** 18.45 19.59
Mexican American Males
18.90*** 18.70*** 20.58
Notes: 1) Data: NHANES III 2) Asterisks indicate level of statistical significance: *** p<0.01, ** p<0.05, * p<0.1.

45
Table 10
False Positives and False Negatives When Use BMI to Define Obesity, by Gender
% Positives False % Negatives False
Females
0.17 62.85
Males 16.45 28.66 Notes:
1) Data: NHANES III 2) Uses NIH-recommended cutoffs of PBF for obesity: 25% for men, 30% for women.
Table 11 Prevalence of Obesity Measured by BMI and PBF, by Gender
Percent Obese
Defined Using BMI Percent Obese
Defined Using PBF Females 23.3 70.1 Males 18.9 43.3
Note: Data: NHANES III
Table 12 False Positives and False Negatives
When Use BMI to Define Obesity, by Gender
% Positives False % Negatives False
Females
27.74 5.42
Males 44.79 9.31 Notes:
1) Data: NHANES III 2) Controls for the threshold effect by using cutoffs of PBF for obesity that result in approximately
the same rates of obesity as does the BMI cutoff for obesity (BMI>=30), which are: 29% body fat for men and 41% for women.
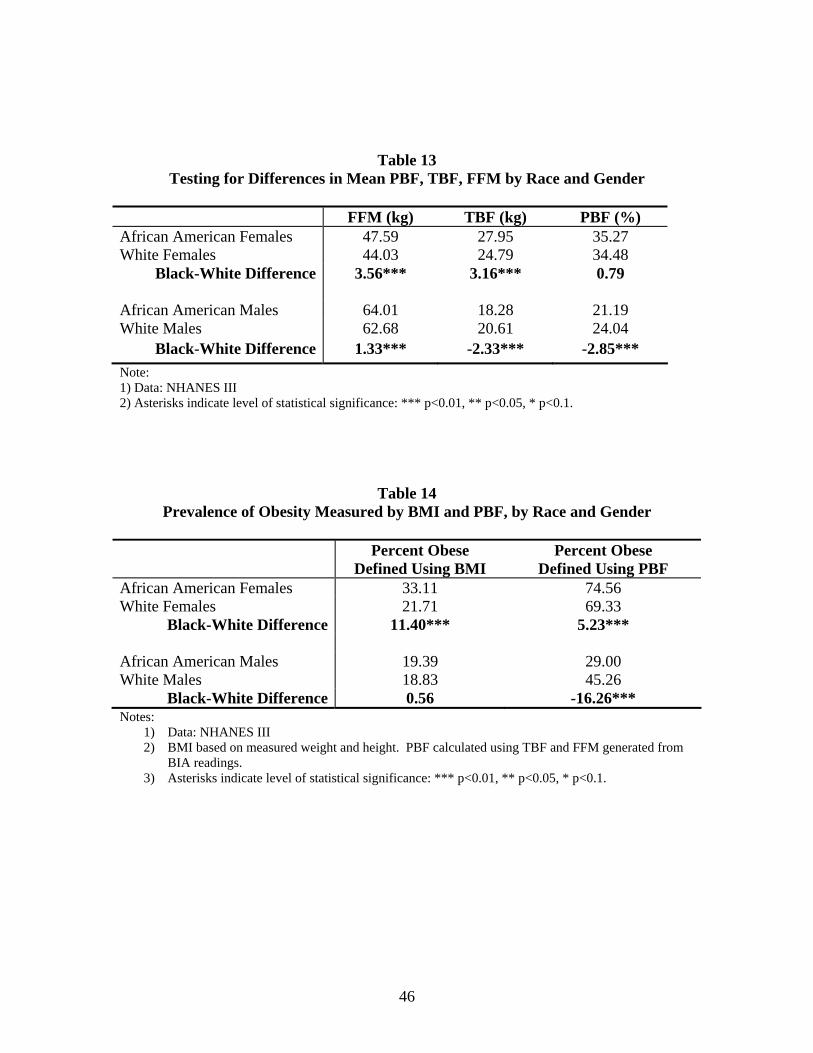
46
Table 13 Testing for Differences in Mean PBF, TBF, FFM by Race and Gender
FFM (kg) TBF (kg) PBF (%) African American Females 47.59 27.95 35.27 White Females 44.03 24.79 34.48
Black-White Difference 3.56*** 3.16*** 0.79 African American Males 64.01 18.28 21.19 White Males 62.68 20.61 24.04
Black-White Difference 1.33*** -2.33*** -2.85*** Note: 1) Data: NHANES III 2) Asterisks indicate level of statistical significance: *** p<0.01, ** p<0.05, * p<0.1.
Table 14 Prevalence of Obesity Measured by BMI and PBF, by Race and Gender
Percent Obese
Defined Using BMI Percent Obese
Defined Using PBF African American Females 33.11 74.56 White Females 21.71 69.33
Black-White Difference 11.40*** 5.23***
African American Males 19.39 29.00 White Males 18.83 45.26
Black-White Difference 0.56 -16.26*** Notes:
1) Data: NHANES III 2) BMI based on measured weight and height. PBF calculated using TBF and FFM generated from
BIA readings. 3) Asterisks indicate level of statistical significance: *** p<0.01, ** p<0.05, * p<0.1.
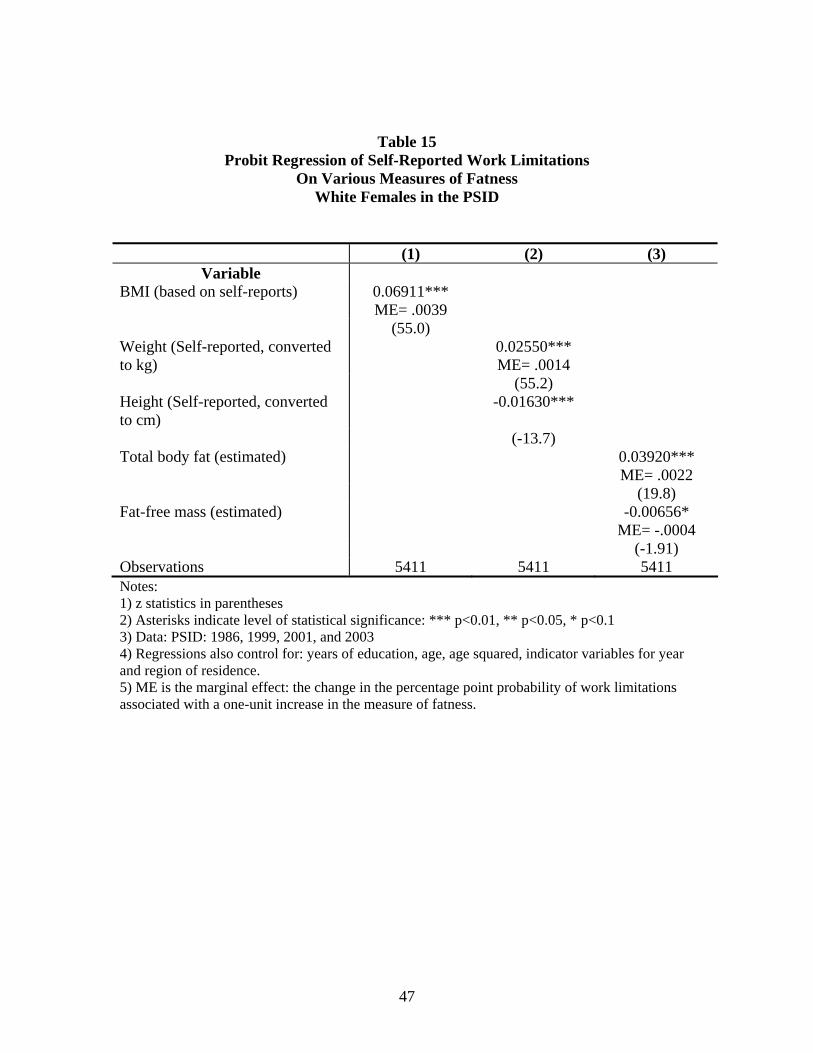
47
Table 15 Probit Regression of Self-Reported Work Limitations
On Various Measures of Fatness White Females in the PSID
(1) (2) (3)
Variable BMI (based on self-reports) 0.06911***
ME= .0039
(55.0) Weight (Self-reported, converted to kg)
0.02550*** ME= .0014
(55.2) Height (Self-reported, converted to cm)
-0.01630***
(-13.7) Total body fat (estimated) 0.03920***
ME= .0022 (19.8) Fat-free mass (estimated) -0.00656*
ME= -.0004 (-1.91) Observations 5411 5411 5411 Notes: 1) z statistics in parentheses 2) Asterisks indicate level of statistical significance: *** p<0.01, ** p<0.05, * p<0.1 3) Data: PSID: 1986, 1999, 2001, and 2003 4) Regressions also control for: years of education, age, age squared, indicator variables for year and region of residence. 5) ME is the marginal effect: the change in the percentage point probability of work limitations associated with a one-unit increase in the measure of fatness.
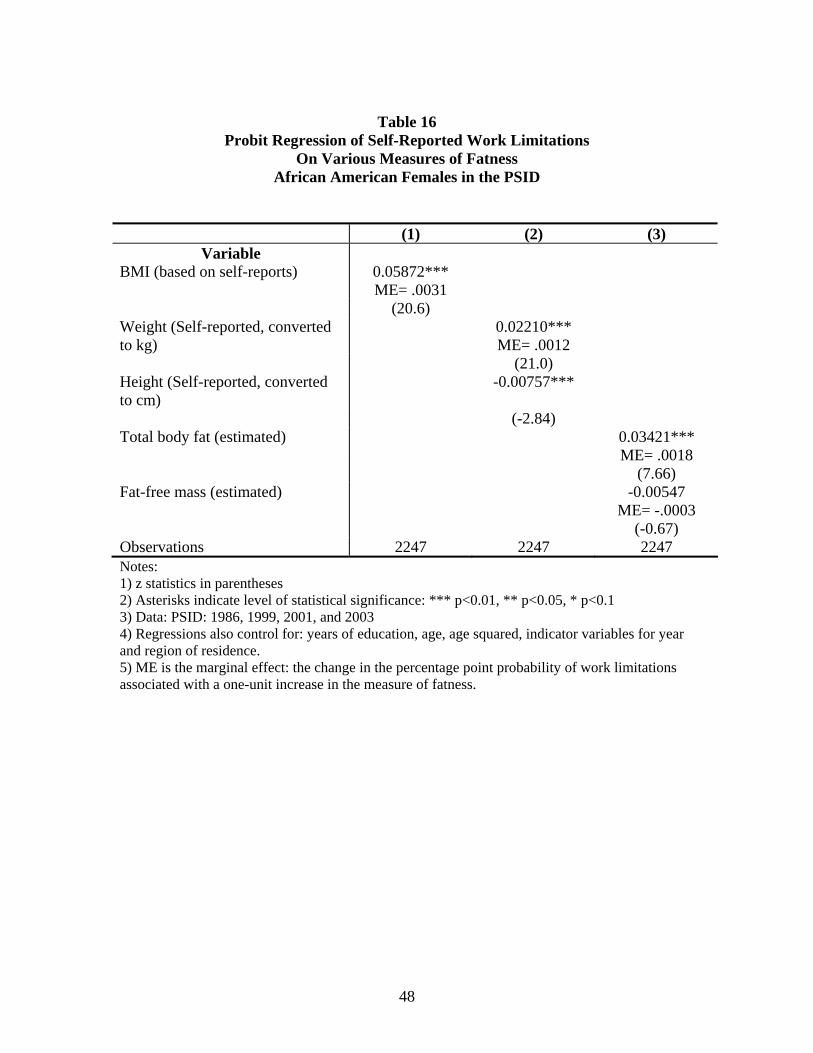
48
Table 16
Probit Regression of Self-Reported Work Limitations On Various Measures of Fatness
African American Females in the PSID (1) (2) (3)
Variable BMI (based on self-reports) 0.05872***
ME= .0031
(20.6) Weight (Self-reported, converted to kg)
0.02210*** ME= .0012
(21.0) Height (Self-reported, converted to cm)
-0.00757***
(-2.84) Total body fat (estimated) 0.03421***
ME= .0018 (7.66) Fat-free mass (estimated) -0.00547
ME= -.0003 (-0.67) Observations 2247 2247 2247 Notes: 1) z statistics in parentheses 2) Asterisks indicate level of statistical significance: *** p<0.01, ** p<0.05, * p<0.1 3) Data: PSID: 1986, 1999, 2001, and 2003 4) Regressions also control for: years of education, age, age squared, indicator variables for year and region of residence. 5) ME is the marginal effect: the change in the percentage point probability of work limitations associated with a one-unit increase in the measure of fatness.

49
Table 17
Probit Regression of Self-Reported Work Limitations On Various Measures of Fatness
White Males in the PSID (1) (2) (3)
Variable BMI (based on self-reports) 0.03355***
ME= .0012
(19.5) Weight (Self-reported, converted to kg)
0.01025*** ME= .0004
(18.9) Height (Self-reported, converted to cm)
-0.02252***
(-17.2) Total body fat (estimated) 0.05668***
ME= .0020 (19.7) Fat-free mass (estimated) -0.03635***
ME= -.0013 (-14.4) Observations 5447 5447 5447 Notes: 1) z statistics in parentheses 2) Asterisks indicate level of statistical significance: *** p<0.01, ** p<0.05, * p<0.1 3) Data: PSID: 1986, 1999, 2001, and 2003 4) Regressions also control for: years of education, age, age squared, indicator variables for year and region of residence. 5) ME is the marginal effect: the change in the percentage point probability of work limitations associated with a one-unit increase in the measure of fatness.
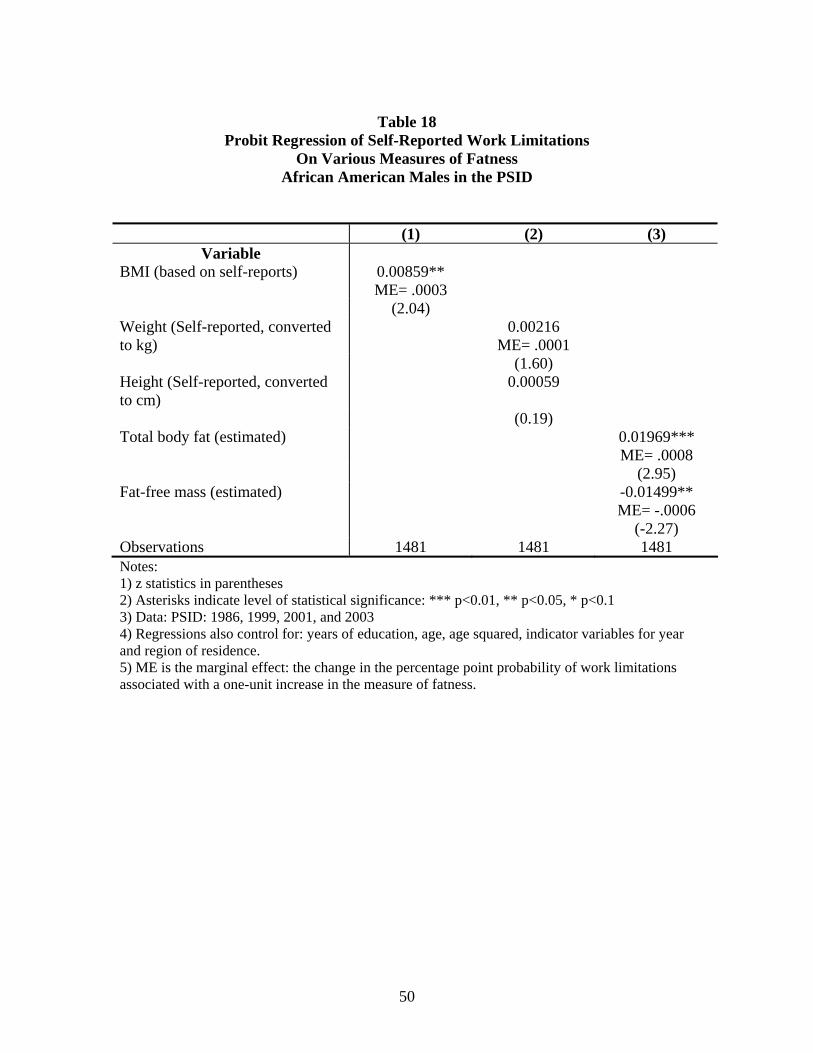
50
Table 18
Probit Regression of Self-Reported Work Limitations On Various Measures of Fatness
African American Males in the PSID (1) (2) (3)
Variable BMI (based on self-reports) 0.00859**
ME= .0003
(2.04) Weight (Self-reported, converted to kg)
0.00216 ME= .0001
(1.60) Height (Self-reported, converted to cm)
0.00059
(0.19) Total body fat (estimated) 0.01969***
ME= .0008 (2.95) Fat-free mass (estimated) -0.01499**
ME= -.0006 (-2.27) Observations 1481 1481 1481 Notes: 1) z statistics in parentheses 2) Asterisks indicate level of statistical significance: *** p<0.01, ** p<0.05, * p<0.1 3) Data: PSID: 1986, 1999, 2001, and 2003 4) Regressions also control for: years of education, age, age squared, indicator variables for year and region of residence. 5) ME is the marginal effect: the change in the percentage point probability of work limitations associated with a one-unit increase in the measure of fatness.
Top Related