


Languages
Pages
Legal

AD-A278 690 of Swe
Cai~,friva
On the KnowledgeUnderlying Multimedia
PresentationsYigal Areas, Eduard H. Hovy, and Mirra Vos8ers
USC/Information Sciences Institute4676 Admiralty Way
Marina del Rey, CA 90292
1992ISI/RR-93. 370
DTICft:LECTE
APR81B4
INFORMATIONSCIENCES 310/822-1511
INSTITUTE -- 4676 Admiraltv Way/Manna del Rev'Cafihrnia 90292-6695

BestAvailable
Copy
On the KnowledgeUnderlying Multimedia
PresentationsYigal Arens, Eduard H. Hovy, and Mirra Voasers
USC/lnformation Sciences Institute4676 Admiralty Way
Marina del Rey, CA 90292
1992ISI/RR-93- 370
The first author was supported in part by Rome Laboratory of the Air Force Systems Command and the Defense AdvancedResearch Projects Agency under contract no. F30602-91-C-0081. The second author was supported in part by RomeLaboratory of the Air Force Systems Command under RL contract no. FQ7619-89-03326-0001. The third author, a graduatestudent at the University of Nijmegen, The Netherlands, spent a research visit of six months at USC/ISI working on thisproject for her Master's degree. Views and conclusions contained in this report are the author's and not interpreted asrepresenting the official opinion or policy of DARPA, RL, the U.S. Government, or any person or agency connected withthem.
94-12810 =C QUA'7 -•: .•n
* 94 4 26 104
FORMN APPROVED
REPORT DOCUMENTATION PAGE ONLYO. (0L) 2-01OPublic reprtng burden for this collection of Informaiton Is estimated to average I hour per. response, including the time for revie~wing instructions snearching @ailing datasources. gethang and maintal:2, the data n•@ anda compising and r~eviewing. the colletin of information. Send com ments re~rdg thi~s burden Winwtud or anyothereslpectot o lhle€o.ig'onot !o~rm.ranon. includi'-n sugg41stings folr reducing thisa burden to owashnmgton Headquarters Services. Directorstolor Inlor roBtion operationsW•d•Iepo, 112I.oterson Davis highway, Suite 1204 A ington, VA 22202-4302. and to the Office of management and Budget. Paperwork Reduction Prtoject (0704-01111)
0.AEC S NY(ev ln)2 REPORT DATE 3. REPORT TYE ANo DATES COVERED)une 1992 Research Report
4. TITLE AND SUBTITLE S. FUNDING NUMBERS
On the Knowledge Underlying Multimedia PresentationsF30602-9 1 -C-0081 and
0 FQ7619-89-03326-0001
6. AUTHOR(S)
Yigal Arens, Eduard Hovy, and Mira Vossers
7. PERFORMING ORGANIZATION NAME(S) AND ADDRESS(ES) 8. PERFORMING ORGANIZATON* REPORT NUMBERUSC INFORMATION SCIENCES INSTITUTE
4676 ADMIRALTY WAY RR-370MARINA DEL REY, CA 90292-6695
9. SPONSORINGIMONITORING AGENCY NAMES(S) AND ADDRESS(ES) 10. SPONSORINGIMONITORING
ARPA ROME Laboratories AGENCY REPORT NUMBER
* 3701 N. Fairfax Drive Rome, New YorkArlington, VA 22203-1714
11. SUPPLEMENTARY NOTES
12A. DISTRIBUTIONWAVAILABILITY STATEMENT 12B. DISTRIBUTION CODE
UNCLASSIFIED/UNLIMITED13. ABSTRACT (Maximum 200 words)
We address one of the problems at the heart of automated multimedia presentation production and interpretation. The mediaproblem can be stated as follows: how does the producer of a presentation determine which information to allocate to whichmedium, and how does a perceiver recognize the function of each part as displayed in the presentation and integrate them into acoherent whole? What knowledge is used, and what processes? We describe the four major types of knowledge that play a role inthe allocation problem as well as interdependencies that hold among them. We discuss two formalisms that can be usedto repre-sent this knowledge and, using examples, describe the kinds of processing required for the media allocation problem.
14. SUBJECT TERMS 1S. NUMBER OF PAGES
multimedia presentations, human-computer interaction, presentation planning 28
16. PRICE CODE
017. SECURITY CLASSIFICTION 16. SECURITY CLASSIFICATION 19. SECURITY CLASSIFICATION 20. UMITATION OF ABSTRACT
OF REPORT OF THIS PAGE OF ABSTRACT
UNCLASSIFIED UNCLASSIFIED UNCLASSIFIED UNLIMITED
NSN 7540-1-280-5500 "Standard Form 298 (Rev. 2-9)Prescribed by ANSI Sid. Z39-18
0 r298-102
On the KnowledgeUnderlying Multimedia Presentations
Yigal Arens, Eduard Hovy, and Mira Vossers'
Information Sciences Instituteof the University of Southern California
4676 Admiralty WayMarina del Rey, CA 90292-6695
Tel: (310) 822-1511Fax: (310) 823-6714
Email: {ARENS, HOVY}@ISI.EDU
* ABSTRACT
We address one of the problems at the heart of automated multimedia presentationproduction and interpretation. The media allocation problem can be stated as follows:how does the producer of a presentation determine which information to allocate to whichmedium, and how does a perceiver recognize the function of each part as displayed in thepresentation and integrate them into a coherent whole? What knowledge is used, andwhat processes? We describe the four major types of knowledge that play a role in theallocation problem as well as interdependencies that hold among them. We discuss two
* formalisms that can be used to represent this knowledge and, using examples, describethe kinds of processing required for the media allocation problem.
'This author, a graduate student at the University of Nijmegen, Nijmegen, The Netherlands, spent* six months at USC/ISI and has since graduated.
1 The General Problem of Presentations usingMultiple Media
When communicating, people almost always employ multiple modalities. Even naturallanguage, which is after all the most powerful representational medium developed by hu-mankind, is usually augmented by pictures, diagrams, etc., when written, or by gestures,hand and eye movements, intonational variations, etc., when spoken. And this prefer-ence for multimodality carries over to communication with computational systems, asevidenced by the explosive growth of the field of Human-Computer Interfaces. Since theearly dream of Artificial Intelligence - of creating fully autonomous intelligent agentsthat would interact with people as equals - has proved impossible to achieve in the nearterm, the thrust of much AI work is on the construction of semi-intelligent machinesoperating in close symbiosis with humans, forming units. For maximum ease of com-munication within such units, natural language and other human-oriented media are theprime candidates (after all, computers are easier to program than humans are).
How then can computers construct and analyze such multimedia presentations? Asurvey of the literature on the design of presentations (book design, graphic illustra-tion, etc.; see [Tufte 90, Bertin 83, Tufte 83]) underscores how this area of commu-nication remains an art and shows how hard it is to describe the rules that gov-ern presentations. But people clearly do follow rules when they use several modali-ties to construct communications; textbooks, for example, are definitely not illustratedrandomly. Psychologists have been studying multimedia issues such as the effects ofpictures in text, design principles for multimedia presentation, etc. for many years[Hartley 85, Twyman 85, Dwyer 78, Fleming & Levie 78], although most of their re-sults are too general to be directly applicable in work that is to be computational-ized. On the other hand, cognitive science studies of the past few years have pro-vided results which can be incorporated into theories about good multimedia design[Petre & Green 90, Roth & Mattis 90, Mayer 89, Larkin & Simon 86]. They addressquestions such as whether graphical notations are really superior to text, what makesa picture worth (sometimes) a thousand words, how illustration affects thinking, thecharacterization of data, etc.
Artificial Intelligence researchers and other computer scientists have been address-ing aspects of the problem of automatically constructing multimedia presentations aswell. [Mackinlay 861 describes the automatic generation of a variety of tables and charts;the wIP system of [Wahlster et al. 92, Andr6 & Rist 92] (and see this volume) plans atext/graphics description of the use of an espresso machine, starting with a database offacts about the machine and appropriate communicative goals, and using text and presen-tation plans. The COMET system [Feiner 88, Feiner & McKeown 90] plans text/graphicpresentations of a military radio using text schemas and pictorial perspective presenta-tion rules. The AIMI system [Maybury 91, Burger & Marshall 91] (and see this volume)plans text/map/tables presentations of database information about military operations 0
2
and hardware, also using presentation plans. Similarly, the INTEGRATED INTERFACES
system [Arens et al. 88] and the CUBRICON system [Neal 90] plan and produce presen-tations involving maps, text, and menus. Other work is reported in the collections[Sullivan & Tyler 91, Ortony et al. 92].
One lesson that is clear from all this work is the need for a detailed study of themajor types of knowledge required for multimedia presentations, encoded in a formalismthat supports both their analysis and generation. For the past few years, we have beeninvolved in various studies of one aspect or another of this problem. In particular, we ask:why and how do people apportion the information to be presented to various media? Andhow do they reassemble the portions into a single message again? This paper containsan overview of some of our results. Section 2 describes our methodology and formalisms.Section 3 provides details about the features and their interdependencies that we havemanaged to collect, and Section 4 provides some examples of the use of this knowledge.
2 Our Approach and Methodology
2.1 The Problem of Media Allocation
In order to focus our efforts, we have concentrated on the media allocation problem:given arbitrary information and any number of media, how, and on what basis, is a
*• particular medium selected for the display of each portion of the information? Thisquestion, a particularization of the question why people use different media and othergestures and movements when they communicate, in our opinion lies at the heart of thegeneral multimedia issue.
Rather than start with a literature study, we here describe the problem from the* computational side. In most systems, the media allocation problem is addressed sim-
ply by the use of fixed rules that specify exactly what medium is to be used for eachparticular data type. This is clearly not a satisfactory solution, given the inflexibilityand non-portability of such systems. Our approach is a two-stage generalization of thisstraightforward approach. We take an example from a hypothetical data base aboutships in a Navy to illustrate. Under the straightforward approach, a typical rule may be:
1. Ships' locations are presented on maps.
Our first generalization is to assign a medium not to each data type, but instead to*each feature that characterizes data types. Thus instead of rule 1, we write the rule:
1'. Data duples (of which ships' locations are an example) are presented on 0
maps, graphs, or tables.
Of course, when considering subsets of features, one invariably gets underspecific rules.*0 To provide more specificity we formulate such additional rules as:
jzst .4, so Ia
- | | |
2. Data with spatial denotations (such as locations) are presented on mediawith spatial denotations (such as maps).
However, note that this rule deals not with the medium of maps but instead with acharacteristic of this medium. It suggests the second step of the generalization.
The second generalization is to assign characteristics of data not to media, but insteadto characteristics of media The two example rules now become:
1. Data duples (of which locations are an example) are presented on planarmedia (such as graphs, tables, and maps).2. Data with spatial denotations (such as locations) are presented on mediawith spatial denotations (such as maps).
In this example, the two rules together suffice to specify maps uniquely as the appro-priate medium for location coordinates. Of course, though, one can present the sameinformation using natural language, as in "the ship is at 15N 79E". Thus one is led torephrase rule 2 to arrive at a more general but very powerful formulation:
2'. Data with specific denotations are presented on media which can conveythe same denotations.
Since language, pictures, and maps can carry spatial denotations (while, say, graphsor histograms usually do not), we once again require additional rules in order to specifya unique medium. However, since each of the three mentioned media can be perfectlysuitable. In the right context, the rules we formulate might not absolutely prohibit amedium; rather, the rules should be context-dependent in ways which enable the selectionof the most appropriate medium. Thus we are led to rules such as:
3. If more than one medium can be used, and there is an existing presen-tation, prefer the medium/a that is/are already present as exhibits in thepresentation.4. If more than one media can be used, and there is additional informationto be presented as well, prefer medium/a that can accommodate the otherinformation too.
Rule 4 has important consequences. If one is to present not only the location of aship, but also its heading, then both language and a map would do, since both mediahave facilities for indicating direction (in the case of language, an appositive phrase withthe value "heading SSW"; and in the case of a map, an icon with an elongation or anarrow). If in addition to this now one adds the requirement to present the nationalityof the ship, natural language has such a capability (the adjective "Swiss", say) but dueto limitations of the map medium, one of the icon's independent characteristics (say, itscolor) must be allocated to convey nationality. Of course, this requires the addition ofa description of the meaning of the different values the icon's independent characteristic
4
can have (for example, a table of color for nationality). Such additional presentationaloverhead makes a map a less attractive medium than natural language for presenting
0 a single ship's location/heading/nationality (though possibly not that of several shipstogether).
We formalize and discuss this point later in more detail. Here it is enough to notethat the two-stage generalizations provide collections of rules that relate characteristics ofinformation and characteristics of media in service of good multimedia presentations. Ingeneral terms, the medium allocation algorithm required can be described as a constraintsatisfaction system, where the constraints arise from rules requiring the features of theinformation to be presented (i.e., the data) to be matched up optimally with the featuresof the media at hand.
2.2 The Four Types of Knowledge Required
We illustrated the use of knowledge about media and information type. But what addi-tional factors play a role in multimedia communication?
In our previous work in multimedia human-computer interactions [Arens et al. 92, Vossers 91, Hovy & Arens 91, Hovy & Arens 90,Arens & Hovy 90a, Arens & Hovy 90b], we addressed this question from several angles,trying to build up a library of terms that capture all the factors that play a role in multi-media human-human and human-computer communication. Drawing from an extensivesurvey of literature from Psychology, Human-Computer Interfaces, Natural LanguageProcessing, Linguistics, Human Factors, and Cognitive Science, (see [Vossers 91]) as wellas from several small analyses of pages from newspapers such as the USA Today andinstruction manuals for appliances such as user manuals for a motor car, a sewing ma-chine, a VCR, and a cookbook, we collected well over a hundred distinct features thatplay a role in the higher-level aspects of the production and interpretation processes, aswell as over fifty rules that express the interdependencies among these features. Whereappropriate, we applied the two-step generalization method to come up with features ofthe right type and at the right level of detail.
These features classify naturally into four major groups:
1. the characteristics of the media used,
2. the nature of the information to be conveyed,
* 3. the goals and characteristics of the producer, and
4. the characteristics of the perceiver and the communicative situation.
Section 3 provides more details about each type of knowledge resource and the rulesinterlinking them. Before getting to this section, however, we describe our attempts tofind an adequately flexible and powerful representation formalism for the knowledge.
5
I-- Y1 -
X I Xl X2 X3 I Y2 ----Y I Y1 Y2 I-- Xl ----- {
Z I Y2 X2 X3 I \--X2 ------------ / I-- X Z---
I I q
X3------------------------------- I
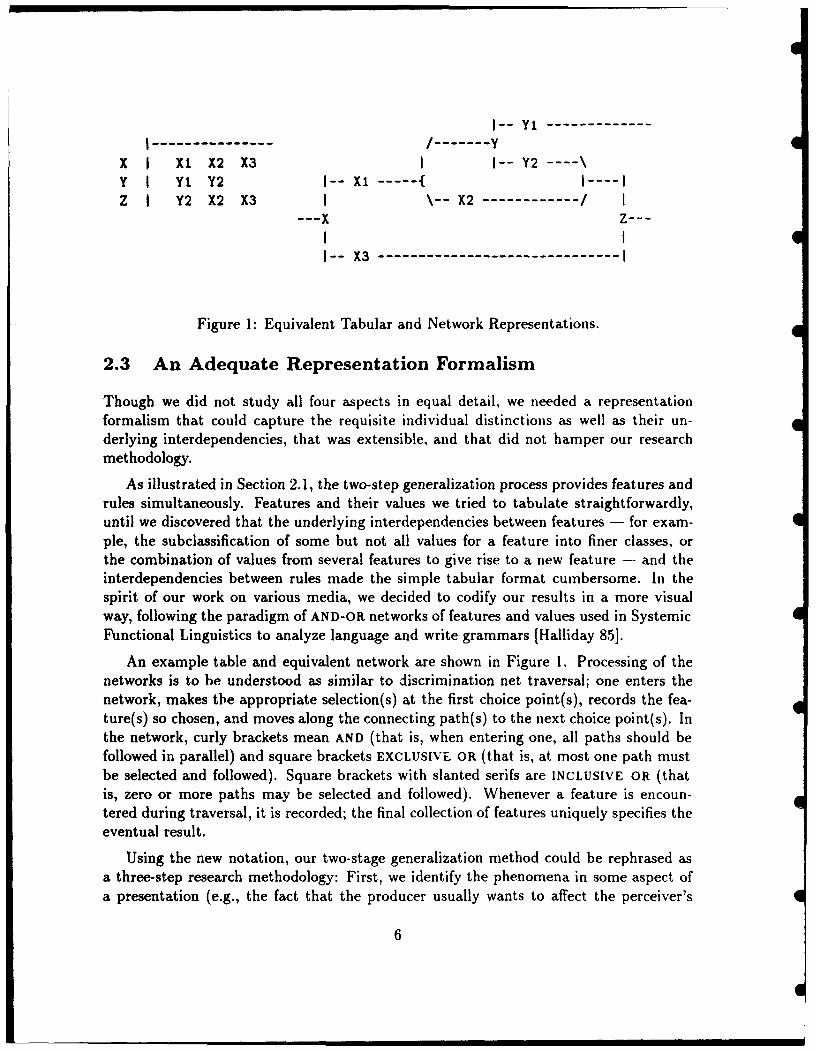
Figure 1: Equivalent Tabular and Network Representations.
2.3 An Adequate Representation Formalism
Though we did not study all four aspects in equal detail, we needed a representationformalism that could capture the requisite individual distinctions as well as their un-derlying interdependencies, that was extensible, and that did not hamper our researchmethodology.
As illustrated in Section 2.1, the two-step generalization process provides features andrules simultaneously. Features and their values we tried to tabulate straightforwardly,until we discovered that the underlying interdependencies between features - for exam-ple, the subclassification of some but not all values for a feature into finer classes, orthe combination of values from several features to give rise to a new feature - and theinterdependencies between rules made the simple tabular format cumbersome. In thespirit of our work on various media, we decided to codify our results in a more visualway, following the paradigm of AND-OR networks of features and values used in SystemicFunctional Linguistics to analyze language and write grammars [Halliday 85].
An example table and equivalent network are shown in Figure 1. Processing of thenetworks is to be understood as similar to discrimination net traversal; one enters thenetwork, makes tbe appropriate selection(s) at the first choice point(s), records the fea-ture(s) so chosen, and moves along the connecting path(s) to the next choice point(s). Inthe network, curly brackets mean AND (that is, when entering one, all paths should befollowed in parallel) and square brackets EXCLUSIVE OR (that is, at most one path mustbe selected and followed). Square brackets with slanted serifs are INCLUSIVE OR (thatis, zero or more paths may be selected and followed). Whenever a feature is encoun-tered during traversal, it is recorded; the final collection of features uniquely specifies theeventual result.
Using the new notation, our two-stage generalization method could be rephrased as"a three-step research methodology: First, we identify the phenomena in some aspect of"a presentation (e.g., the fact that the producer usually wants to affect the perceiver's
6
future goals, or the fact that different media utilize different numbers of presentation'dimensions'); second, we characterize the variability involved in each phenomenon (e.g..a producer may want to affect , iie perceiver's goals through warnings, suggestions, hints.requests, etc., or language *3 expressed 'linearly' while diagrams are two-dimensional):and third, we map out t:,e interdependencies among the values of all the phenomena (e.g..the goal to warn selects a feature value 'urgent', and this value is interdependent withvalues such as 'high noticeability' which are tied to appropriate media such as soundor flashing icons). In the resulting AND-OR networks of interdependencies, each nodereprese:,ts a single phenomenon and each arc a possible value for it together with itsinterdependencies with other values.
One advantage of the network notation is its independence of process; one can im-plement the knowledge contained directly in network form, in a traditional rule-basedsystem, or a connectionist one. We maintain the network form because several otherpresentation-related software at USC/ISI uses the same formalism. The Penman sentencegenerator [Mann & Matthiessen 83, Penman 88, Hovy 90] and associated text planningsystem [Hovy et al. 92] contain a grammar of English and various factors influencing textstructure all represented as AND-OR networks; sentence generation proceeds by travers-ing the grammar network from 'more semantic' toward 'more syntactic' nodes, collectingat each node features that instruct the system how to build the eventual sentence (see[Matthiessen 841). Parsing proceeds by traversing the same network 'backwards', eventu-ally arriving at the 'more semantic' nodes and their associated features, the set of whichconstitutes the parse and determines the parse tree (see [Kasper & Hovy 90, Kasper 89]).This bidirectionality of processing is an additional advantage of the network formalism.
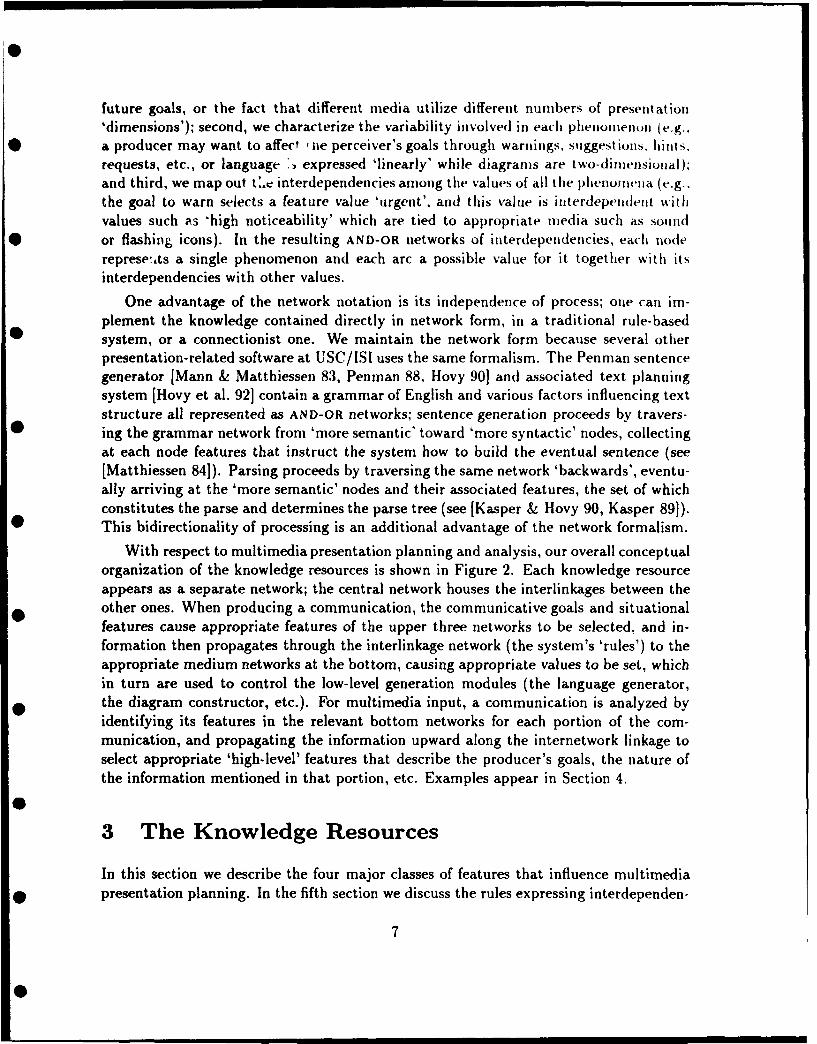
With respect to multimedia presentation planning and analysis, our overall conceptualorganization of the knowledge resources is shown in Figure 2. Each knowledge resourceappears as a separate network; the central network houses the interlinkages between theother ones. When producing a communication, the communicative goals and situationalfeatures cause appropriate features of the upper three networks to be selected, and in-formation then propagates through the interlinkage network (the system's 'rules') to theappropriate medium networks at the bottom, causing appropriate values to be set, whichin turn are used to control the low-level generation modules (the language generator,the diagram constructor, etc.). For multimedia input, a communication is analyzed byidentifying its features in the relevant bottom networks for each portion of the com-munication, and propagating the information upward along the internetwork linkage toselect appropriate 'high-level' features that describe the producer's goals, the nature ofthe information mentioned in that portion, etc. Examples appear in Section 4.
3 The Knowledge Resources
In this section we describe the four major classes of features that influence multimedia* presentation planning. In the fifth section we discuss the rules expressing interdependen-
7
Figure 2: Knowledge Resources that Support Multimedia Communication.
cies among the features in the four classes.
3.1 Characterization of Media
3.1.1 Definition of Terms
The following terms are used to describe presentation-related concepts. We take the pointof view of the communicator (indicating where the consumer's subjective experience maydiffer).
1. Consumer: A person interpreting a communication.
2. Medium: A single mechanism by which to express information. Examples:spoken and written natural language, diagrams, sketches, graphs, tables, pictures.
3. Exhibit: A complex exhibit is a collection, or composition, of several simple ex-hibits. A simple exhibit is what is produced by one invocation of one medium. Examplesof simple exhibits are a paragraph of text, a diagram, a computer beep. Simple exhibitsinvolve the placement of one or more Information Carriers on a background Substrate.
4. Substrate: The background to a simple exhibit. That which establishes, to theconsumer, physical or temporal location, and often the semantic context, within whichnew information is presented to the information consumer. The new information willoften derive its meaning, at least in part, from its relation to the substrate. Examples:a piece of paper or screen (on which information may be drawn or presented); a grid (onwhich a marker might indicate the position of an entity); a page of text (on which certainwords may be emphasized in red); a noun phrase (to which a prepositional phrase maybe appended). An empty substrate is possible.
5. Information Carrier: That part of the simple exhibit which, to the consumer,communicates the principal piece of information requested or relevant in the currentcommunicative context. Examples: a marker on a map substrate; a prepositional phrase
8
S
within a sentence predicate substrate. A degenerate carrier is one which cannot bedistinguished from its background (in the discussion below the degenerate carrier is aspecial case, but we do not bother explicitly to except it where necessary. Please assumeit excepted).
6. Carried Item: That piece of information represented by the carrier; the "deno-tation' of the carrier.
For purposes of rigor, it is important to note that a substrate is simply one or moreinformation carrier(s) superimposed. This is because the substrate carries information aswell2 . In addition, in many cases the substrate provides an internal system of semanticswhich may be utilized by the carrier to convey information. Thus, despite its name,not all information is transmitted by the carrier itself alone; its positioning (temporal orspatial) in relation to the substrate may encode information as well. This is discussedfurther below.
7. Channel: An independent dimension of variation of a particular informationcarrier in a particular substrate. The total number of channels gives the total number ofindependent pieces of information the carrier can convey. For example, a single mark oricon can convey information by its shape, color, and position and orientation in relationto a backgrcund map. The number and nature of the channels depend on the type ofthe carrier and on the exhibit's substrate.
3.1.2 Internal Semantic Systems
Some information carriers exhibit an internal structure that can be assigned a 'real-world' denotation, enabling them subsequently to be used as substrates against whichother carriers can acquire information by virtue of being interpreted within the substrate.For example, a map used to describe a region of the world possesses an internal structure- points on it correspond to points in the region it charts. When used as a backgroundfor a ship icon, one may indicate the location of the ship in the world by placing its iconin the corresponding location on the map substrate. Examples of such carriers and theirinternal semantic systems are shown in Table 1.
* Other information carriers exhibit no internal structure. Examples: icon, computerbeep, and unordered list.
2Note that from the information consumer's point of view, Carrier nd Substrate are subjective terms;two people looking at the same exhibit can interpret its components as carrier and substrate in differentways, depending on what they already know. For example, different people may interpret a graph
• tracking the daily value of some index differently as follows: someone who is familiar with the historyof the index may call only the last point of the graph, that is, its most recent addition, the informationcarrier, and call all the rest of the graph the substrate. Someone who is unfamiliar with the history ofthe index may interpret the whole line plotted out as the information carrier, and the graph's axes andtitle, etc., as substrate. Someone who is completely unfamiliar with the index may interpret the wholegraph, including its title and axis titles, as information carrier, and interpret the screen on which it is
* displayed as substrate.
9
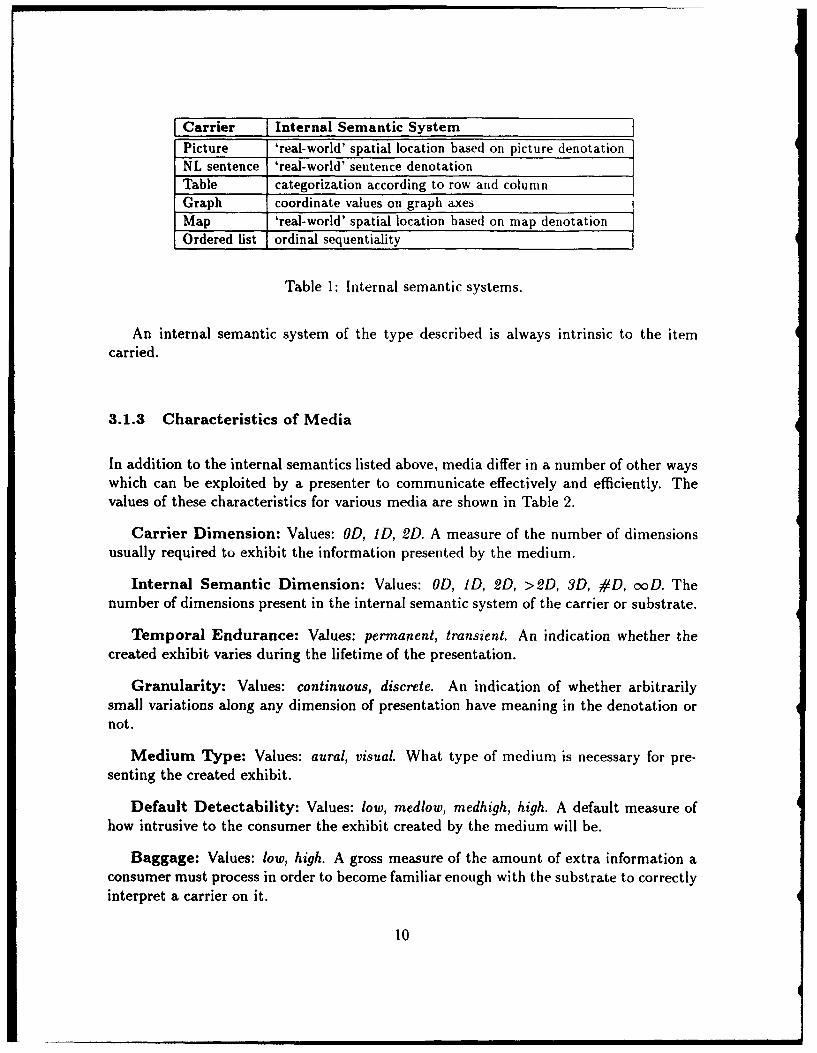
Carrier Internal Semantic System
Picture 'real-world' spatial location based on picture denotationNL sentence 'real-world' sentence denotationTable categorization according to row and columnGraph coordinate values on graph axesMap 'real-world' spatial location based on map denotationOrdered list ordinal sequentiality
Table 1: Internal semantic systems.
An internal semantic system of the type described is always intrinsic to the itemcarried.
3.1.3 Characteristics of Media
In addition to the internal semantics listed above, media differ in a number of other wayswhich can be exploited by a presenter to communicate effectively and efficiently. Thevalues of these characteristics for various media are shown in Table 2.
Carrier Dimension: Values: OD, ID, 2D. A measure of the number of dimensionsusually required to exhibit the information presented by the medium.
Internal Semantic Dimension: Values: OD, ID, 2D, >2D, 3D, #D, ooD. Thenumber of dimensions present in the internal semantic system of the carrier or substrate.
Temporal Endurance: Values: permanent, transient. An indication whether thecreated exhibit varies during the lifetime of the presentation.
Granularity: Values: continuous, discrete. An indication of whether arbitrarilysmall variations along any dimension of presentation have meaning in the denotation ornot.
Medium Type: Values: aural, visual. What type of medium is necessary for pre-senting the created exhibit.
Default Detectability: Values: low, medlow, medhigh, high. A default measure ofhow intrusive to the consumer the exhibit created by the medium will be.
Baggage: Values: low, high. A gross measure of the amount of extra information aconsumer must process in order to become familiar enough with the substrate to correctlyinterpret a carrier on it.
10
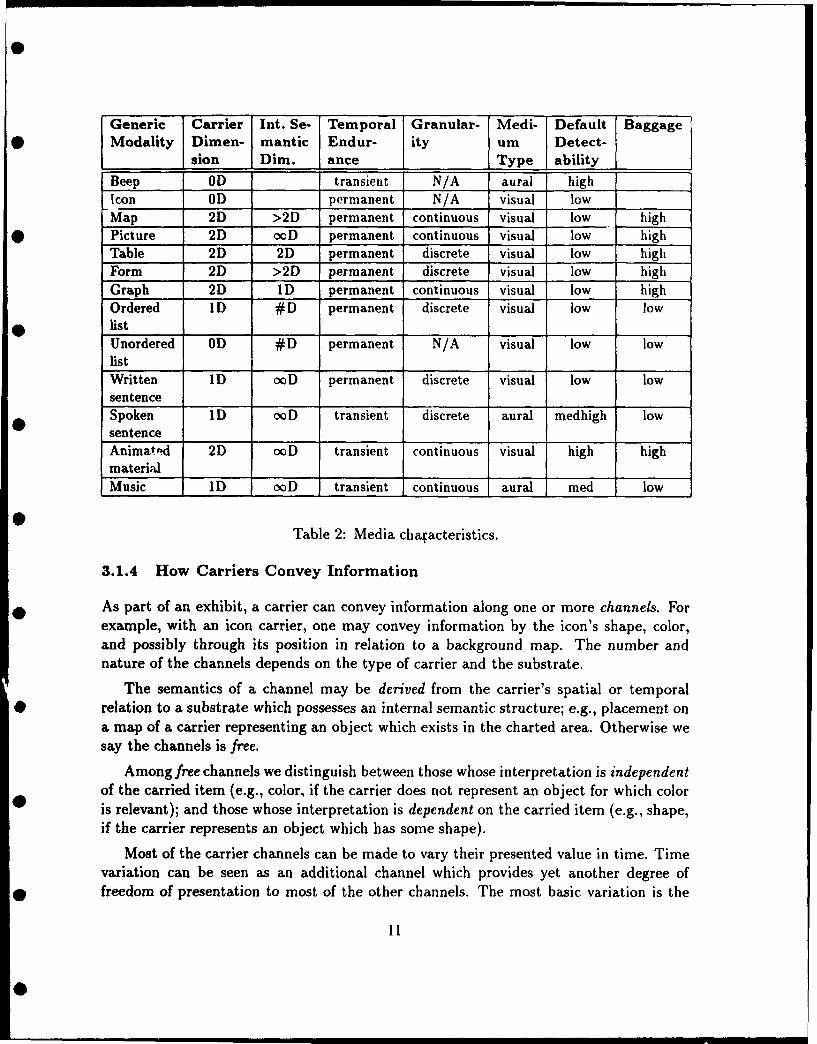
Generic Carrier Int. Se- Temporal Granular- Medi- Default BaggageModality Dimen- mantic Endur- ity um Detect-
sion Dim. ance Type abilityBeep OD transient N/A aural high
Icon OD permanent N/A visual lowMap 2D >2D permanent continuous visual low highPicture 2D ooD permanent continuous visual low highTable 2D 2D permanent discrete visual low highForm 2D >2D permanent discrete visual low highGraph 2D ID permanent continuous visual low highOrdered ID # D permanent discrete visual low lowlist
Unordered OD #D permanent N/A visual low lowlistWritten ID coD permanent discrete visual low lowsentenceSpoken ID coD transient discrete aural medhigh lowsentenceAnimated 2D coD transient continuous visual high highmaterial _ _
Music ID ooD transient continuous aural med low
Table 2: Media chafacteristics.
3.1.4 How Carriers Convey Information
As part of an exhibit, a carrier can convey information along one or more channels. Forexample, with an icon carrier, one may convey information by the icon's shape, color,and possibly through its position in relation to a background map. The number andnature of the channels depends on the type of carrier and the substrate.
The semantics of a channel may be derived from the carrier's spatial or temporal* relation to a substrate which possesses an internal semantic structure; e.g., placement on
a map of a carrier representing an object which exists in the charted area. Otherwise wesay the channels is free.
Among free channels we distinguish between those whose interpretation is independentof the carried item (e.g., color, if the carrier does not represent an object for which coloris relevant); and those whose interpretation is dependent on the carried item (e.g., shape,if the carrier represents an object which has some shape).
Most of the carrier channels can be made to vary their presented value in time. Timevariation can be seen as an additional channel which provides yet another degree of
* freedom of presentation to most of the other channels. The most basic variation is the
11
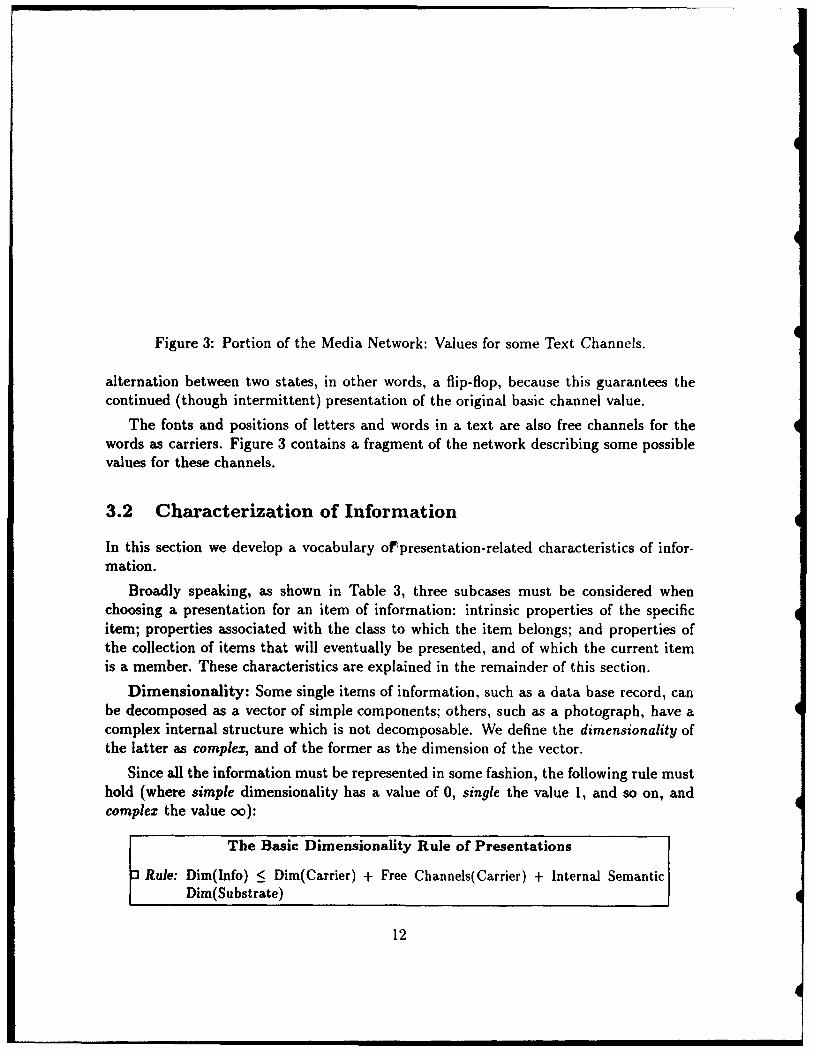
Figure 3: Portion of the Media Network: Values for some Text Channels.
alternation between two states, in other words, a flip-flop, because this guarantees thecontinued (though intermittent) presentation of the original basic channel value.
The fonts and positions of letters and words in a text are also free channels for thewords as carriers. Figure 3 contains a fragment of the network describing some possiblevalues for these channels.
3.2 Characterization of Information
In this section we develop a vocabulary oftpresentation-related characteristics of infor-mation.
Broadly speaking, as shown in Table 3, three subcases must be considered whenchoosing a presentation for an item of information: intrinsic properties of the specificitem; properties associated with the class to which the item belongs; and properties ofthe collection of items that will eventually be presented, and of which the current itemis a member. These characteristics are explained in the remainder of this section.
Dimensionality: Some single items of information, such as a data base record, canbe decomposed as a vector of simple components; others, such as a photograph, have acomplex internal structure which is not decomposable. We define the dimensionality ofthe latter as complex, and of the former as the dimension of the vector.
Since all the information must be represented in some fashion, the following rule musthold (where simple dimensionality has a value of 0, single the value 1, and so on, andcomplex the value oo):
I The Basic Dimensionality Rule of Presentations
Rule: Dim(Info) < Dim(Carrier) + Free Channels(Carrier) + Internal SemanticDim(Substrate)
12
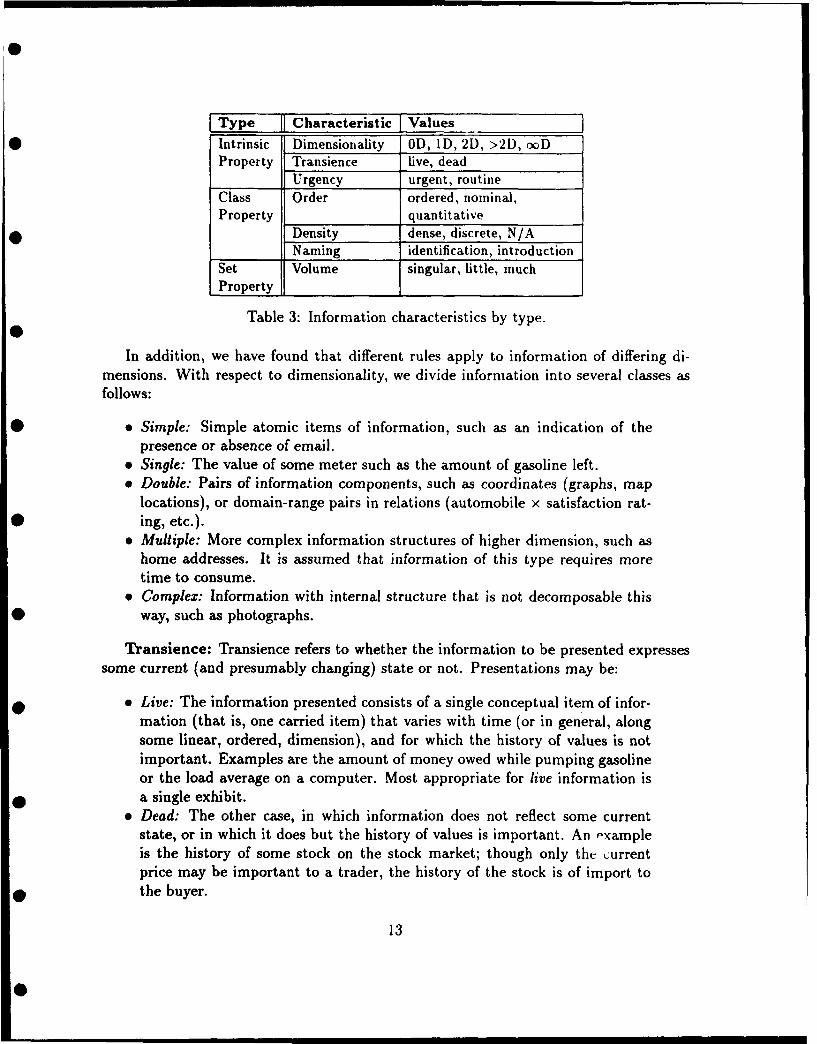
Type I Characteristic] Values
Intrinsic Dimensionality OD, ID, 2D, >2D, oxDProperty Transience live, dead
Urgency urgent, routineClass Order ordered, nominal,Property quantitative
Density dense, discrete, N/ANaming identification, introduction
Set Volume singular, ittle, muchProperty 1 _ 1_1
Table 3: Information characteristics by type.
In addition, we have found that different rules apply to information of differing di-mensions. With respect to dimensionality, we divide information into several classes asfollows:
"" Simple: Simple atomic items of information, such as an indication of thepresence or absence of email.
"* Single: The value of some meter such as the amount of gasoline left."* Double: Pairs of information components, such as coordinates (graphs, map
locations), or domain-range pairs in relations (automobile x satisfaction rat-ing, etc.).
"* Multiple: More complex information structures of higher dimension, such ashome addresses. It is assumed that information of this type requires moretime to consume.
"* Complex: Information with internal structure that is not decomposable thisway, such as photographs.
Transience: Transience refers to whether the information to be presented expressessome current (and presumably changing) state or not. Presentations may be:
9 Live: The information presented consists of a single conceptual item of infor-mation (that is, one carried item) that varies with time (or in general, alongsome linear, ordered, dimension), and for which the history of values is notimportant. Examples are the amount of money owed while pumping gasolineor the load average on a computer. Most appropriate for live information isa single exhibit.
e Dead: The other case, in which information does not reflect some currentstate, or in which it does but the history of values is important. An exampleis the history of some stock on the stock market; though only the currentprice may be important to a trader, the history of the stock is of import to
* the buyer.
13
Urgency: Some information may be designated urgent, requiring presentation insuch a way that the consumer's attention is drawn. This characteristic takes the valuesurgent and routine:
"* Urgent: This information relates to the user's persistent goals (involving ac-tions which could cause personal injury or property damage, whether an im-minent meltdown or a warning to a person crossing the road in front of acar) and must therefore be reinforced by textual devices such as 'boldface','capitalization', etc. For more details see [Hovy & Arens 91).
"* Routine: The normal, non-distinguished case.
Order: Order is a property of a collection of items all displayed together as a groupof some kind. Values here are:
"* Quantitative: This characterizes items belonging to a conceptually and/or
syntactically regular but not presentationally ordered set, such as temperaturereadings for various parts of the country).
"* Ordinal: This characterizes items of a set ordered according to their semanticdenotations (e.g., steps in a recipe).
"* Nominal: The items are not ordered.
Density: The difference between information that is presented equally well on agraph and a histogram and information that is not well presented on a histogram is amatter of the density of the class to which the information belongs. The former case isdiscrete information; an example is the various types of car made in Japan. The latteris dense information; an example is the prices of cars made in Japan.
"* Dense: A class in which arbitrary small variations along a dimension of inter-est carry meaning. Information in such a class is best presented by a modalitythat supports continuous change.
"* Discrete: A class in which there exists a lower limit to variations on thedimension of interest.
Naming (function): The role information plays may be defined relative to otherinformation present. A good example is the information that names and introduces, suchas that in headings of text sections, titles of diagrams, and labels in pictures. We identifyjust two of the many types here:
* Identification: This information identifies a portion of the presentation, basedon an appropriate underlying semantic relation such as between a text labeland a picture part; see [Hovy et al. 92].
* Introduction: This information identifies and introduces other information byappearing first and standing out positionally.
14
Figure 4: Fragment of the Information Features Network.
Volume: A batch of information may contain various amounts of information to bepresented. If it is a single fact, we call it singular; if more than one fact but still littlerelative to some task- and user-specific threshold, we call it little; and if not, we call it
* much. This distinction is useful because not all modalities are suited to present muchinformation.
"* Much: The relatively permanent modalities such as written text or graphicsleave a trace to which the consumer can refer if he or she gets lost doing the
* task or forgets, while transient modalities such as spoken sentences and beepsdo not. Thus the former should be preferred in this case.
"* Little: There is no need to avoid the more transient modalities when theamount of information to present is little.
"* Singular: A single atomic item of information. A transient modality can* be used. However, one should not overwhelm the consumer with irrelevant
information. For example, to display information about a single ship, oneneed not draw a map.
The features listed here are only the tip of a large iceberg. They can be subclassified inseveral ways. One way is by whether the feature is apparent by virtue of the informationitself or by its juxtaposition with others, as in Table 3; another way is by its teleologicalstatus, as partially shown in Figure 4.
3.3 The Producer's Intentions
Particularly in the field of natural language research, there has been much work identi-fying and classifying the possible goals of a producer of an utterance - work which can
* quite easily be applied to multimedia presentations in general.
15
Automated text generators, when possessing a rich grammar and lexicon, typicallyrequire several producer-related aspects to specify their parameters fully. For example,the PAULINE generator [Hovy 881 produced numerous variations from the same under-lying representation depending on its input parameters, which included the followingpresenter-oriented features:
Producer's goals with respect to perceiver: These goals all address some aspectof the perceiver's mental knowledge or state, such as:
* Affect perceiver's knowledge: This feature takes such values as teach, inform,and confuse.
* Affect perceiver's opinions of topic: Values include switch, reinforce.* Involve perceiver in the conversation: involve, repel.* Affect perceiver's emotional state: Of the hundreds of possibilities we list
simply anger, cheer up, calm.* Affect perceiver 's goals: Values include activate and deactivate. These goals
cover warnings, orders, etc.
Producer's goals with respect to the producer-perceiver relationship: Theseaddress both producer and perceiver, for example:
"* Affect perceiver's emotion toward producer. Values include respect, like, dis-like.
"• Affect relative status: Values here determine formality of address forms incertain languages, etc.: dominant, equal, subordinate.
"* Affect interpersonal distance: Values such as intimate, close, distant.
For our purposes, we have chosen to borrow and adapt a partial classification of aproducer's communicative goals from existing work on Speech Acts. Figure 5 provides asmall portion of the network containing aspects of a producer's communicative intentionsthat may affect the appearance of a presentation (see [Vossers 91] for more details). Inthis network fragment warn is distinguished from inform because, unlike inform speechacts, the semantics of warnings involve capturing the attention of the reader in orderto affect his/her goals or actions. To achieve this, a warning must be realized usingpresentation features that distinguish it from the background presentation.
3.4 The Perceiver's Nature and Situation
Our work has only begun to address this issue. Existing research provides considerablematerial with a bearing on the topic, including especially the work in Cognitive Psychol-ogy on issues of human perception which influence the appropriateness of media choicesfor presentation of certain types of data. A survey and discussion of these results is pre-sented in [Vossers 911. On the computational side, the abovementioned text generationsystem [Hovy 88] contains several categories of characteristics of the perceiver, including:
16
Figure 5: Portion of the Producer Goals Network.
* Figure 6: Portion of the Internetwork Linkage.
"* knowledge of the topic: expert, student, novice."* interest in the topic: high, low.e opinions of the topic: good, neutral, bad."* language ability. high, low."* emotional state: calm, angry, agitated.
3.5 Interdependencies and Rules
The factors that affect multimedia presentations are not independent. Their interde-pendencies can be thought of as rules which establish associations between the goals ofthe producer, the content of the information, and surface features of presentations toconstrain the options for presenting information (during generation) and disambiguatealternative readings (during interpretation). A small portion of these rules, also rep-resented in network form, appears in Figure 6. Moving from left to right through thenetwork (that is, in the direction of presentation interpretation), one first finds the pre-sentation forms which express the information, then features of the information whichare linked to various presentation forms, and finally the producer goals. That formalismis essentially equivalent to standard "Rule" writing, as below. We use one formalism orthe other, depending on what we feel is most suitable to the task being addressed.
Below, in traditional form, is a more comprehensive list of rules, organized by char-acteristics of data being considered for presentation. The terminology is defined in Sec-
• tion 3.2.
17
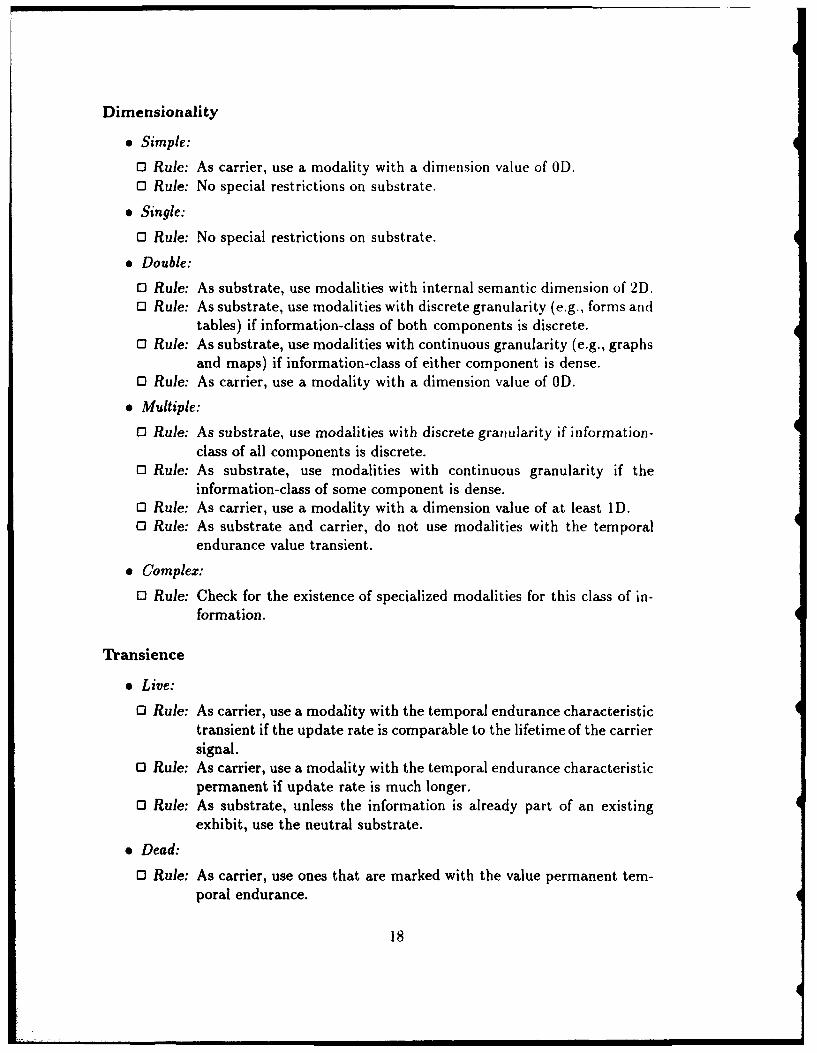
Dimensionality
"* Simple:
"o Rule: As carrier, use a modality with a dimension value of OD."o Rule: No special restrictions on substrate.
"* Single:
o Rule: No special restrictions on substrate.
"* Double:
"o Rule: As substrate, use modalities with internal semantic dimension of 2D."o Rule: As substrate, use modalities with discrete granularity (e.g., forms and
tables) if information-class of both components is discrete."o Rule: As substrate, use modalities with continuous granularity (e.g., graphs
and maps) if information-class of either component is dense."o Rule: As carrier, use a modality with a dimension value of OD.
"* Multiple:
o Rule: As substrate, use modalities with discrete granularity if information-class of all components is discrete.
"o Rule: As substrate, use modalities with continuous granularity if theinformation-class of some component is dense.
"o Rule: As carrier, use a modality with a dimension value of at least ID."o Rule: As substrate and carrier, do not use modalities with the temporal
endurance value transient.
"* Complex:
o3 Rule: Check for the existence of specialized modalities for this class of in-formation.
Transience
"* Live:
"o Rule: As carrier, use a modality with the temporal endurance characteristictransient if the update rate is comparable to the lifetime of the carriersignal.
"o Rule: As carrier, use a modality with the temporal endurance characteristicpermanent if update rate is much longer.
"o Rule: As substrate, unless the information is already part of an existingexhibit, use the neutral substrate.
"* Dead:
o] Rule: As carrier, use ones that are marked with the value permanent tem-poral endurance.
18
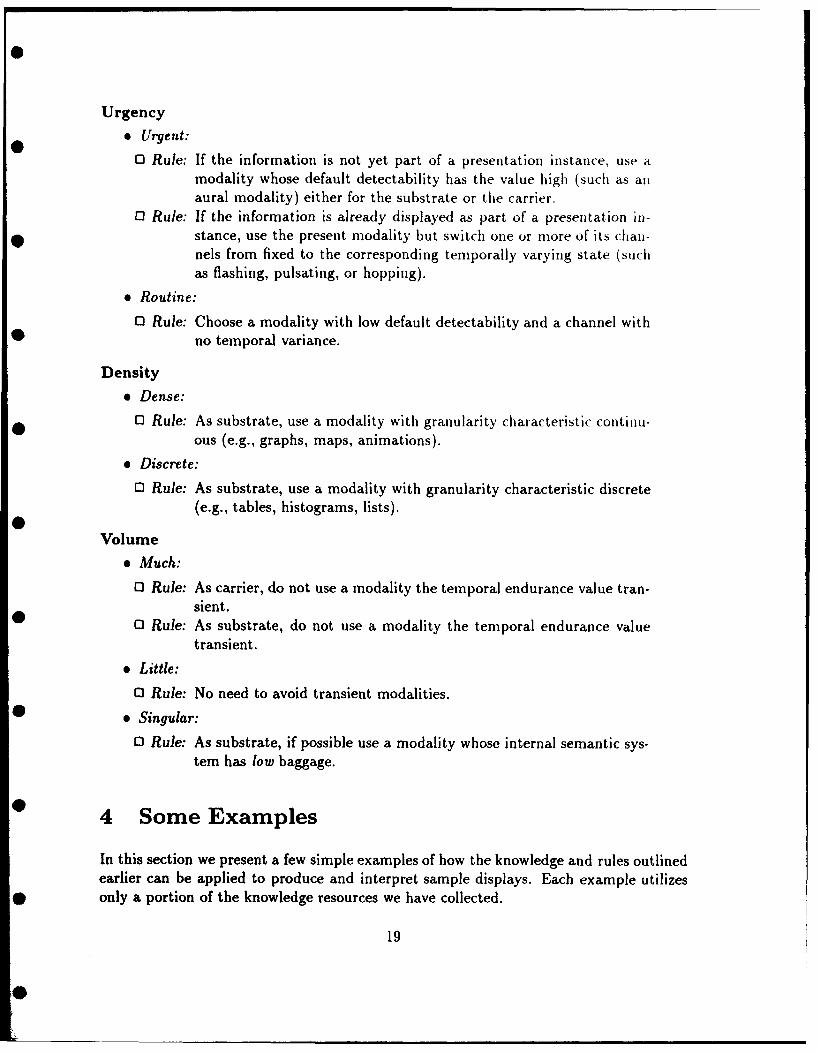
Urgency
* Urgent:
"o Rule: If the information is not yet part of a presentation instance, use amodality whose default detectability has the value high (such as anaural modality) either for the substrate or the carrier.
"o Rule: If the information is already displayed as part of a presentation in-stance, use the present modality but switch one or more of its chani-nels from fixed to the corresponding temporally varying state (suchas flashing, pulsating, or hopping).
* Routine:
o Rule: Choose a modality with low default detectability and a channel withno temporal variance.
Density
"* Dense:
0 Rule: As substrate, use a modality with granularity characteristic continu-ous (e.g., graphs, maps, animations).
"* Discrete:
0 Rule: As substrate, use a modality with granularity characteristic discrete(e.g., tables, histograms, lists).
Volume
"* Much:
"o Rule: As carrier, do not use a modality the temporal endurance value tran-sient.
"o Rule: As substrate, do not use a modality the temporal endurance valuetransient.
"* Little:
o Rule: No need to avoid transient modalities.
* Singular:0 Rule: As substrate, if possible use a modality whose internal semantic sys-
tem has low baggage.
4 Some Examples
In this section we present a few simple examples of how the knowledge and rules outlinedearlier can be applied to produce and interpret sample displays. Each example utilizesonly a portion of the knowledge resources we have collected.
19
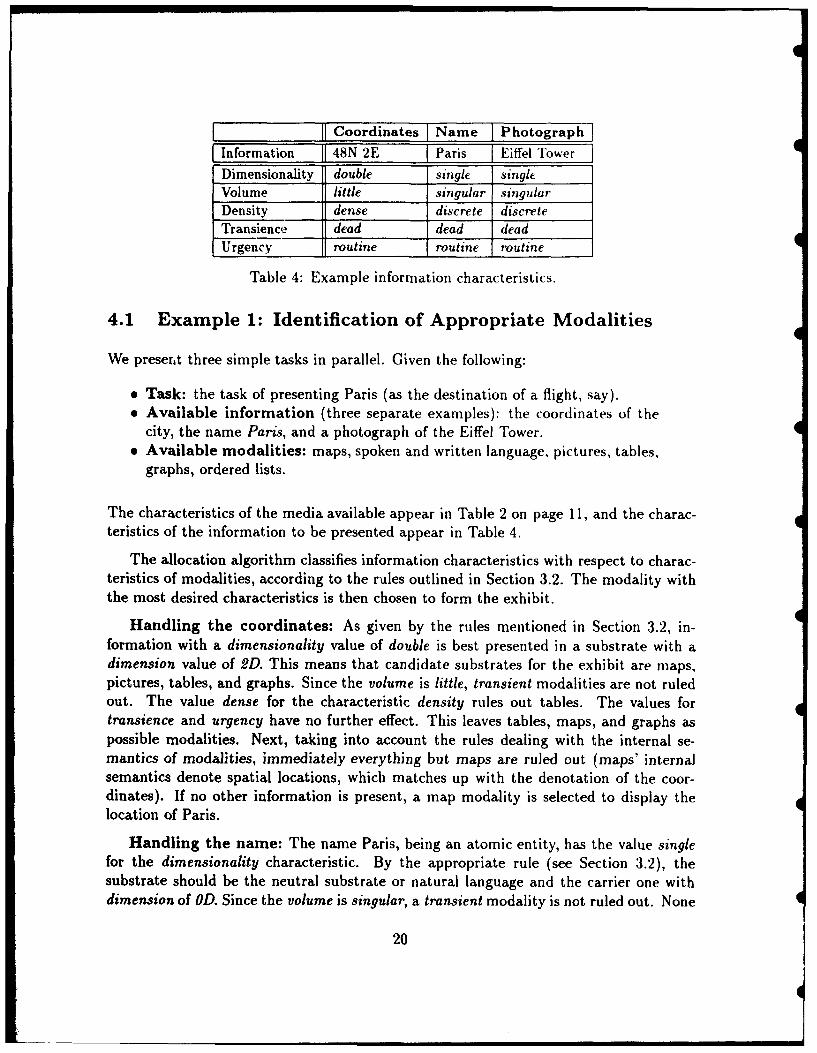
Coordinates Name PhotographInformation 48N 2E Paris Eiffel TowerDimensionality double single singleVolume little singular singularDensity dense discrete discreteTransience dead dead deadUrgency routine routine routine
Table 4: Example information characteristics.
4.1 Example 1: Identification of Appropriate Modalities
We presert three simple tasks in parallel. Given the following:
"* Task: the task of presenting Paris (as the destination of a flight, say)."* Available information (three separate examples): the coordinates of the
city, the name Paris, and a photograph of the Eiffel Tower."* Available modalities: maps, spoken and written language, pictures, tables,
graphs, ordered lists.
The characteristics of the media available appear in Table 2 on page 11, and the charac-teristics of the information to be presented appear in Table 4.
The allocation algorithm classifies information characteristics with respect to charac-teristics of modalities, according to the rules outlined in Section 3.2. The modality withthe most desired characteristics is then chosen to form the exhibit.
Handling the coordinates: As given by the rules mentioned in Section 3.2, in-formation with a dimensionality value of double is best presented in a substrate with adimension value of 2D. This means that candidate substrates for the exhibit are maps,pictures, tables, and graphs. Since the volume is little, transient modalities are not ruledout. The value dense for the characteristic density rules out tables. The values fortransience and urgency have no further effect. This leaves tables, maps, and graphs aspossible modalities. Next, taking into account the rules dealing with the internal se-mantics of modalities, immediately everything but maps are ruled out (maps' internalsemantics denote spatial locations, which matches up with the denotation of the coor-dinates). If no other information is present, a map modality is selected to display thelocation of Paris.
Handling the name: The name Paris, being an atomic entity, has the value singlefor the dimensionality characteristic. By the appropriate rule (see Section 3.2), thesubstrate should be the neutral substrate or natural language and the carrier one withdimension of OD. Since the volume is singular, a transient modality is not ruled out. None
20
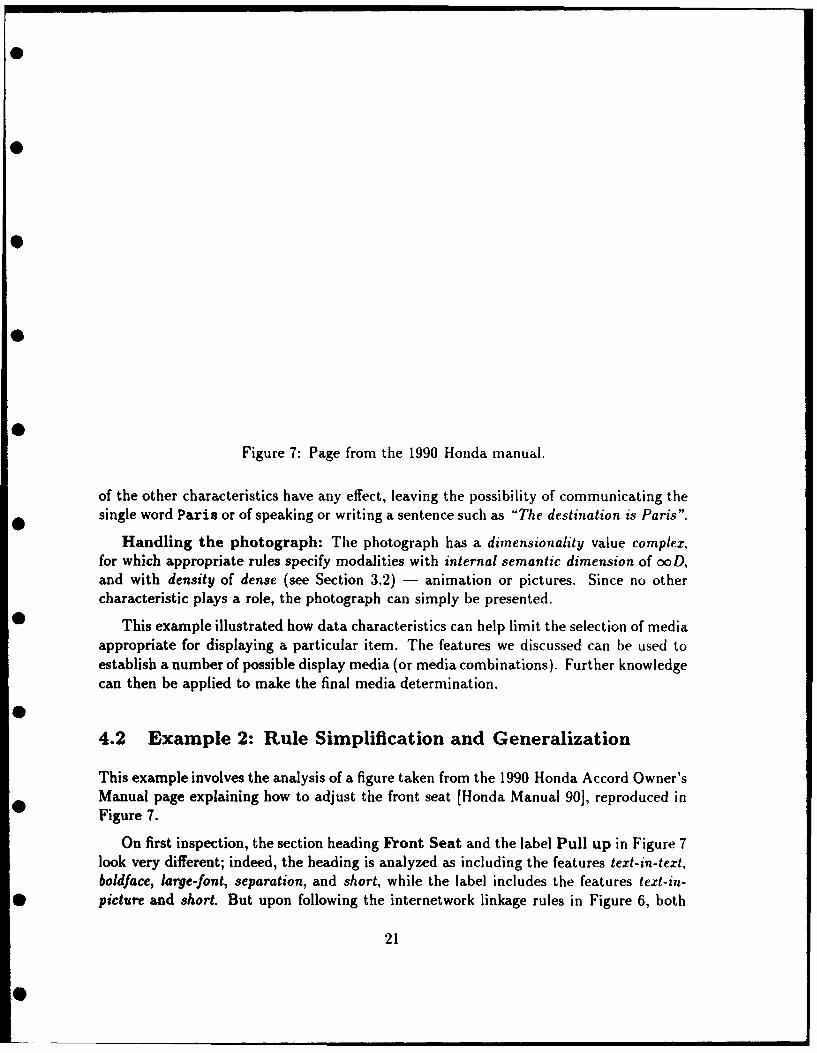
Figure 7: Page from the 1990 Honda manual.
of the other characteristics have any effect, leaving the possibility of communicating thesingle word Paris or of speaking or writing a sentence such as "The destination is Paris".
Handling the photograph: The photograph has a dimensionality value complex,for which appropriate rules specify modalities with internal semantic dimension of soD,and with density of dense (see Section 3.2) - animation or pictures. Since no othercharacteristic plays a role, the photograph can simply be presented.
This example illustrated how data characteristics can help limit the selection of mediaappropriate for displaying a particular item. The features we discussed can be used toestablish a number of possible display media (or media combinations). Further knowledgecan then be applied to make the final media determination.
4.2 Example 2: Rule Simplification and Generalization
This example involves the analysis of a figure taken from the 1990 Honda Accord Owner'sManual page explaining how to adjust the front seat (Honda Manual 90], reproduced inFigure 7.
On first inspection, the section heading Front Seat and the label Pull up in Figure 7look very different; indeed, the heading is analyzed as including the features text-in-text,boldface, large-font, separation, and short, while the label includes the features text-in-
* picture and short. But upon following the internetwork linkage rules in Figure 6, both
21
items are seen to serve almost-identical producer goals: introduce and idtntify. respec-tively. Thus they are both instances of the naming function (see Figure -): the featuresthat differ are simply those required to differentiate each item from its background. Thusthe operative rule can concisely be expressed as:
0 Rule: To indicate the naming function, use short text which is distinct fromthe background presentation object.
How to achieve distinction is a matter for the individual presentation media, andhas nothing to do with the communicative function of naming per se. Within a picture,distinction is achieved by the mere use of text, while within text, distinction must beachieved by varying the features of the surrounding rendering of the language, for exampleby changing the font type and size or the position of the item in relation to the generaltext body.
The notion of distinction, having crystallized out of the above two presentations,somewhat unexpectedly turns out to be quite generally applicable. Consider the textbullets at the bottom of the figure. Since their function is to warn (and not merely toinform, which is the purpose of the preceding paragraphs), the text has the feature bold.This serves to distinguish the warning text from the background, thereby signaling thespecial force required for a warning. Using the rule stated above, we can now predictthat, within the context of a diagram or picture, one can effect a warning simply byplacing text within the non-textual substrate.
Thus, though the notion of distinction was not explicitly developed for the individualnetworks ;nfluencing presentations, Figure 6 suggested its utility with an appropriatecollection of specific features. Its importance was discerned in the course of investigatingthe internetwork lnkage rules and their application to presentations such as this manualpage.
The example illustrates the generality of the rules that can be used to gener-ate and parse multimedia presentations, but, when described, it may seem obvious.However, it can only be explained by using such notions as distinguished/separated(both the positional/off-text distinctiveness and the realizational/text-vs-graphics dis-tinctiveness) and communicative function (one part of the communication serves toname/introduce/identify another part). When one constructs a vocabulary of terms onthis level of description, one finds unexpected overlaps in communicative functionalityacross media.
In the domain of presentations containing text and line drawings, we demonstratedthat media selection rules can be written so that the same rule can be used to controlthe analysis and generation of some aspect of both a diagram and a piece of text. This isextremely significant, in that the resulting parsimony and expressive power of these rulessimultaneously motivates the particular representational level we have used and also sug-gests how the complex task of multimedia communication is achieved with less overhead
22
than at first seemed necessary. The assembly of a vocabulary of media-independent (orat least shared by multiple media) features of the kind we discuss is an important futureresearch task.
5 Conclusion
The enormous numbers of possibilities that appear when one begins to deal with multiplemedia, as illustrated by the Psychology, Cognitive Science, and automated text gener-ation and formatting work mentioned above, is daunting. We believe that systematicanalysis of the factors influencing presentations, such as the types described here, is re-quired before powerful general-purpose multimedia human-computer interfaces can bebuilt. Appropriate formalisms for representing the underlying knowledge may serve touncover unexpected overlaps of functionality which serve to simplify the rules upon whichsuch interface systems will depend. It appears that the dependency network formalismand feature-based analysis methodology described in this paper hold some promise foruntangling the complex issues involved, and, perhaps, may one day help explain whymultimedia communication is so pervasive in human interaction.
References
[Andri & Rist 92] Andr6, E. and Rist, T. 1992. The Design of Illustrated Documents as aPlanning Task. German Research Center for Al (DFKI) Research Report.
[Arens et al. 881 Arens, Y., Miller, L., Shapiro, S.C. and Sondheimer, N.K. 1988. AutomaticConstruction of User-Interface Displays. In Proceedings of the 7th AAAI Conference, St.Paul, MN (808-813). Also available as USC/Information Sciences Institute Research ReportRR-88-218.
[Arens & Hovy 90a) Arens, Y. and Hovy, E.H. 1990. How to Describe What? Towards a Theory* of Modality Utilization. In Proceedings of the 12th Cognitive Science Conference, Cambridge,
MA.
[Arens & Hovy 90b] Arens, Y. and Hovy, E.H. 1990. Text Layout as a Problem of ModalitySelection. In Proceedings of the 5th Conference on Knowledge-Based Specification (87-94),RADC Workshop, Syracuse, NY.
[Arens et al. 921 Arens, Y., Hovy, E., and Van Mulken, S. 1992. A Tree-Traversing Prototypethat Allocates Presentation Media. Submitted to a workshop.
[Bertin 83] Bertin, J. 1983. Semiology of Graphics, (trans. by J. Berg). Madison: University of* Wisconsin Press.
23
0
[Burger & Marshall 91] Burger, J. and Marshall, R. 1991. AIMI: An Intelligent MultimediaInterface. In Proceedings of the 9th National ConferencE on Artificial lrittlligence, AAAI-91.Anaheim, CA (23-28).
[Dwyer 78] Dwyer, F.M. 1978. Strategies for improving visual learning. State College. PA:Learning Services.
(Feiner 881 Feiner, S. 1988. An Architecture for Knowledge-Based Graphical Interfaces.ACM/SIGCHI Workshop on Architectures for Intelligent Interfaces: Elements and Proto-types, Monterey, CA.
[Feiner & McKeown 901 Feiner, S. and McKeown, K.R. 1990. Coordinating Text and Graphicsin Explanation Generation. In Proceedings of the 8th AAAI Conference (442-449).
[Fleming & Levie 78] Fleming, M. and Levie, H.W. 1978. Instructional Message Design: Prin-ciples from the Behavioral Sciences. New Jersey: Educational Technology Publications.
[Halliday 851 Halliday, M.A.K. 1985. An Introduction to Functional Grammar. Baltimore: Ed-ward Arnold Press.
[Hartley 85] Hartley, J. 1985. Designing Instructional Text. (2nd edition). Great Britain: KoganPage Ltd.
[Honda Manual 90] Honda Accord: 1990 Owner's Manual. Ja,...: Honda Motor Co. Ltd.
[Hovy 88] Hovy, E.H. 1988. Generating Natural Language under Pragmatic Constraints. Hills-dale, NJ: Lawrence Erlbaum Associates.
[Hovy 90] Hovy, E.H. 1990. Natural Language Processing at ISI. The Finite String 16(4) (37-42).
[Hovy & Arens 90] Hovy, E.H. and Arens, Y. 1990. When is a Picture Worth a ThousandWords? - Allocation of Modalities in Multimedia Communication. Presented at the AAAISymposium on Human-Computer Interaction, Stanford University.
[Hovy & Arens 91] Hovy, E.H. and Arens, Y. 1991. Automatic Generation of Formatted Text.In Proceedings of the 10th AAAI Conference, Anaheim, CA.
[Hovy et al. 92] Hovy, E.H., Lavid, J., Maier, E., Mittal, V., and Paris, C.L. 1992. Employ-ing Knowledge Resources in a New Text Planning Architecture. In Proceedings of the 6thInternational Workshop on Language Generation, Trento, Italy (to appear).
(Kasper 891 Kasper, R.T. 1989. Unification and Classification: An Experiment in Informa-tion-Based Parsing. In Proceedings of the International Workshop on Parsing Technologies,Pittsburgh, PA.
[Kasper & Hovy 90] Kasper, R.T. and Hovy, E.H. 1990. Integrated Semantic and SyntacticParsing using Classification. In Proceedings of the DARPA Speech and Natural LanguageWorkshop, Pittsburgh, PA.
24
[Larkin & Simon 861 Larkin, J.H., and Simon, H.A. 1986. Why a Diagram is (Sometimes)Worth Ten Thousand Words. Cognitive Science 11(1) (6.5-99).
[Mackinlay 86] Mackinlay, J. 1986. Automatic Design of Graphical Prrscttations. Ph.D. disser-tation, Stanford University.
[Mann & Matthiessen 83] Mann, W.C. and Matthiessen, C.M.I.M. 1983. Nigel: A SystemicGrammar for Text Generation. Research Report RR-83-105, USC/ISI.
[Matthiessen 84] Matthiessen, C.M.I.M. 1984. Systemic Grammar in Computation: The NigelCase. In Proceedings of 1st Conference of the European Association for Computational Lin-guistics, Pisa, Italy. Also available as USC/ISI Research Report RR-84-121.
[Maybury 91] Maybury, M.T. 1991. Planning Multimedia Explanations using Communicative* Acts. In Proceedings of the 9th National Conference on Artificial Intelligence, AAAI-91,
Anaheim, CA (61-66).
[Mayer 89] Mayer, R.E. 1989. Systematic Thinking Fostered by Illustrations in Scientific Text.Journal of Educational Psychology 81 (240-246).
* [Neal 90] Neal, J.G. 1990. Intelligent Multi-Media Integrated Interface Project. SUNY Buffalo.RADC Technical Report TR-90-128.
[Ortony et al. 92] Ortony, A., Slack, J., and Stock, 0. (eds). 1992. Computational Theories ofCommunication and their Applications. Berlin: Springer Verlag.
* [Penman 88] The Penman project. 1988. The Penman Primer, User Guide, and ReferenceManual. Unpublished USC/ISI documentation.
[Petre & Green 90] Petre, M. and Green, T.R.G. 1990. Is Graphical Notation Really Superiorto Text, or Just Different? Some Claims by Logic Designers about Graphics in Notation.Proceedings of the ECCE-5, Urbino, Italy.
[Roth & Mattis 90] Roth, S.F. and Mattis, J. 1990. Data Characterization for IntelligentGraphics Presentation. CHI'90 Proceedings (193-200).
[Sullivan & Tyler 91] Sullivan and Tyler (eds). 1991. Intelligent User Interfaces. New York:ACM Press.
[Tufte 83] Tufte, Edward R. 1983. The Visual Display of Quantitative Information. Cheshire,CT: Graphics Press.
[Tufte 901 Tufte, Edward R. 1990. Envisioning Information. Cheshire, CT: Graphics Press.
* [Twyman 85] Twyman, M. 1985. Using Pictorial Language: A Discussion of the Dimensions ofthe Problem. In Duffy, T.M. & Waller, R. (Eds.), Designing Usable Texts. Florida: AcademicPress (245-312).
[Vossers 91] Vossers, M. 1991. Automatic Generation of Formatted text and Line Drawings.Master's thesis, University of Nijmegen, The Netherlands.
25
[Wahlster et al. 92] Wahlster, W., Andr6, E., Bandyopadhyay, S., Graf, W.. Rist. T. 1992.
WIP: The Coordinated Generation of Multiniodal Presentations from a Common Represen-
tation. In Computational Theories of Communication arid their Applications, A. Ortony, J.
Slack, and 0. Stock (eds), Berlin: Springer Verlag.
26
Top Related