


Languages
Pages
Legal

Old friends and new enemies,parties in changing time and space
A thesis submitted for the degree of Doctor ofPhilosophy in Government
Denise Laroze
Department of GovernmentUniversity of Essex
June 2016


To my loving parents
André Laroze and Doris Prehn

Acknowledgements
I would like to thank the academics and students of the Department of Government for
an excellent PhD experience. Forming part of this department has transformed me as a
scholar and provided me with skills that I had never imagined I would obtain. At every
step I found a helping hand, giving advice on how to solve some aspect of my work
or providing valuable feedback on drafts. I would like to give special thanks to the
academics that formed part of my board throughout the years, Thomas Scotto, David
Hugh-Jones, Jonathan Slapin, Thomas Plümper, John Bartle and Todd Landman. Your
help has been essential in transforming me into the academic that I am today. I would
also like to thank the advice received from Daniel Berger and Alex Quiroz. Though
never formally board members, they were always there to offer guidance on how to
improve my teaching. I hope to use that wisdom to train future political scientists.
My HEROES friends are an exceptional group of people. You were there to share
the happy sunny moments and give support during the difficult times, solving coding
issues and sparking my creativity when I got stuck. Life at Essex was filled with great
memories because you were part of it. I especially appreciate all the work Peter Josse
put into copy-editing my papers. My writing is full of typos and Peter helped me reduce
them dramatically. If there are any left, then it is my responsibility.
The Department of Government’s administrative team were an enormous support
throughout my Ph.D. Their counselling in navigating the universities administrative
hurdles and their sunny disposition was fundamental for my smooth progress. So too
was the support provided by the Essex Summer School staff. Their joy made statistics
filled summers one of the highlights of the year.
Moreover, I benefited from the financial support of the Chilean Government Ph.D.
i
scholarship, Becas Chile. I would also like to thank the University of Essex and its
seedcorn funding for experimental research, without which I would not have been able
to write my paper on social identity and coalition formation.
On a personal note, I would like to give a very special thank you to my husband,
Andrés Villar Gertner, for all his support and comprehension. Your guidance and un-
derstanding was a fundamental part of my Ph.D. You’ve been there from the very be-
ginning, helping me with applications, advising me on how to manage the difficulties of
the marathon that is the Ph.D., and providing comfort though the frustrating moments.
I love you dearly, thank you for being there to share some of the best years of my life.
London, March 2016
Denise Laroze
ii
Summary
Political parties are the cornerstone of modern democracies and the decisions they make
can have important consequences for citizens’ well-being. This dissertation studies two
different types of party behaviour. The first is coalition building and how social-identity
concerns can help predict which parties form alliances. The second is the decision of
potential new parties to enter electoral competition.
The effect of social-identity on coalition formation is tested using an experiment on
the ‘pure effect’ of gender, race and political ideology on who is selected as a coalition
partner. The findings showed that gender and race did not affect participants’ decisions.
By contrast, ideology had a strong effect. Substantively, the results provide evidence
that a preference for similar coalition partners can help predict which coalitions form,
even when there are no policy benefits from this alliance to be gained.
Party entry behaviour is analysed through two incentive structures. The first paper
measures the impact of public subsidies on new-party presidential candidates in Latin
America. The results show that campaign subsidies can increase the relative costs of
a campaign and create a barrier for new-party candidate entry. On the other hand,
campaign funding for everyday party activities has the opposite effect. This study con-
tributes to the understanding of the cost-benefit incentives for new party entry and the
consequences of party finance regulations.
The second paper on new parties addresses the dynamic process of party exit and
entry into politics. The study argues that the collapse of a political party opens policy
space that can lead to the successful entrance of new parties. The results provide robust
evidence that the size of the collapsed party has a positive effect on the vote shares for
new parties. However, this is moderated by the permissibility of the electoral formula.
iii

Contents
Acknowledgements i
Summary iii
List of Tables viii
List of Figures x
1 Introduction 11.1 Group identity and coalition formation . . . . . . . . . . . . . . . . . . 5
1.2 Party financing and new-party candidates . . . . . . . . . . . . . . . . 6
1.3 Party collapse and new party entry . . . . . . . . . . . . . . . . . . . . 8
1.4 Plan of the study . . . . . . . . . . . . . . . . . . . . . . . . . . . . . 9
2 Group identity and coalition formation 112.1 Introduction . . . . . . . . . . . . . . . . . . . . . . . . . . . . . . . . 13
2.2 Literature: Coalition-building and social identity . . . . . . . . . . . . 16
2.3 Experimental design and treatments . . . . . . . . . . . . . . . . . . . 19
2.3.1 Treatments . . . . . . . . . . . . . . . . . . . . . . . . . . . . 21
2.4 Hypotheses . . . . . . . . . . . . . . . . . . . . . . . . . . . . . . . . 23
2.5 Data . . . . . . . . . . . . . . . . . . . . . . . . . . . . . . . . . . . . 24
2.6 Empirical analysis . . . . . . . . . . . . . . . . . . . . . . . . . . . . . 25
2.6.1 Comparison of ‘Main’ treatment with ‘Baseline’ and ‘2Dicta-tor’ treatments . . . . . . . . . . . . . . . . . . . . . . . . . . 31
2.7 Conclusions . . . . . . . . . . . . . . . . . . . . . . . . . . . . . . . . 33
2.8 Appendix: Group identity and coalition formation . . . . . . . . . . . . 36
2.8.1 Data . . . . . . . . . . . . . . . . . . . . . . . . . . . . . . . . 36
2.8.2 Experiment materials . . . . . . . . . . . . . . . . . . . . . . . 46
2.8.3 Countries of origin . . . . . . . . . . . . . . . . . . . . . . . . 58
3 Party financing and new-party candidates 593.1 Introduction . . . . . . . . . . . . . . . . . . . . . . . . . . . . . . . . 61
v
Contents
3.2 New-party candidates . . . . . . . . . . . . . . . . . . . . . . . . . . . 633.3 Party finance and the decision to enter . . . . . . . . . . . . . . . . . . 64
3.3.1 Campaign subsidies . . . . . . . . . . . . . . . . . . . . . . . 653.3.2 Post-election subsidies for on-going party activities . . . . . . . 67
3.4 Variable operationalisation and measures . . . . . . . . . . . . . . . . . 693.5 Model specification . . . . . . . . . . . . . . . . . . . . . . . . . . . . 733.6 Results . . . . . . . . . . . . . . . . . . . . . . . . . . . . . . . . . . . 74
3.6.1 Robustness tests . . . . . . . . . . . . . . . . . . . . . . . . . 793.7 Conclusions . . . . . . . . . . . . . . . . . . . . . . . . . . . . . . . . 803.8 Appendix: Party financing and new-party candidates . . . . . . . . . . 83
3.8.1 Names of new-party candidates included in the study . . . . . . 833.8.2 Elections included in empirical models . . . . . . . . . . . . . 893.8.3 Robustness of model specification . . . . . . . . . . . . . . . . 90
4 Party collapse and new party entry 954.1 Introduction . . . . . . . . . . . . . . . . . . . . . . . . . . . . . . . . 974.2 Literature and theories on new party entry . . . . . . . . . . . . . . . . 99
4.2.1 Viability caused by a collapsed party . . . . . . . . . . . . . . . 1024.3 Estimation strategy and data . . . . . . . . . . . . . . . . . . . . . . . 1054.4 Data analyses . . . . . . . . . . . . . . . . . . . . . . . . . . . . . . . 109
4.4.1 Robustness tests . . . . . . . . . . . . . . . . . . . . . . . . . 1134.5 Conclusions . . . . . . . . . . . . . . . . . . . . . . . . . . . . . . . . 1164.6 Appendix: Party collapse and new party entry . . . . . . . . . . . . . . 119
5 Conclusions 1295.1 Implications for further research . . . . . . . . . . . . . . . . . . . . . 133
Bibliography 135
vi
List of Tables
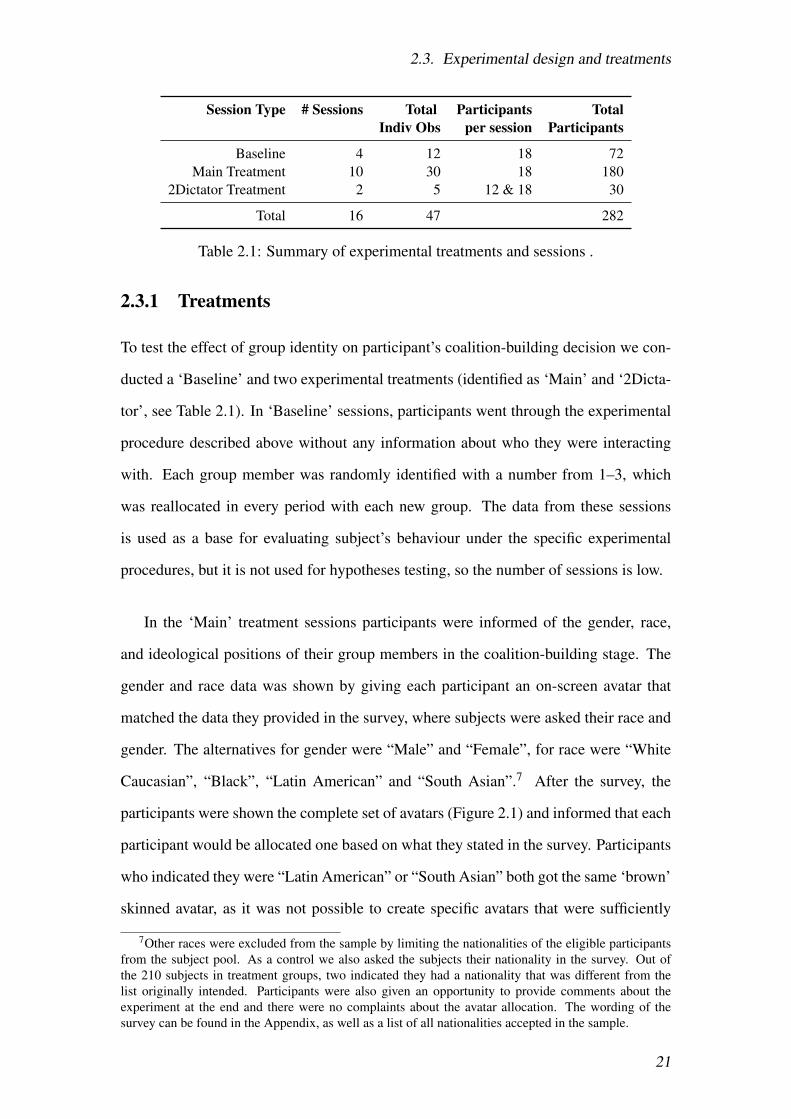
2.1 Summary of experimental treatments and sessions . . . . . . . . . . . . 21
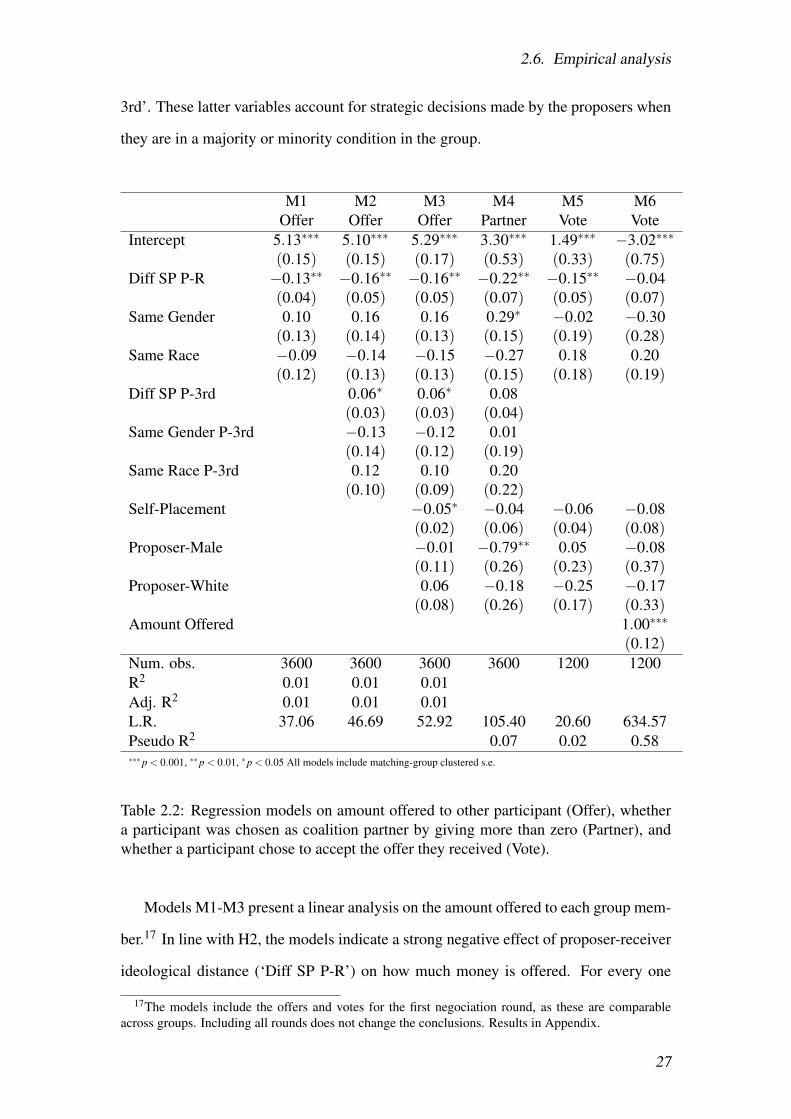
2.2 Regression models on amount offered to other participant (Offer), whethera participant was chosen as coalition partner by giving more than zero(Partner), and whether a participant chose to accept the offer they re-ceived (Vote). . . . . . . . . . . . . . . . . . . . . . . . . . . . . . . . 27
2.3 Types of coalitions formed in ‘Main’ treatment and ‘Baseline’ samples. 31
2.4 Regression models on amount offered to other participant in the coali-tion bargaining game (Offer), the first dictator game (DG-1) and thesecond dictator game (DG-2) – in ‘2Dictator’ treatment group. . . . . . 32
2.5 Frequences of Gender and Race in Main treatment sample. . . . . . . . 36
2.6 Random and Fixed Effects models with Arellano-Bond s.e. on proposalbehaviour. . . . . . . . . . . . . . . . . . . . . . . . . . . . . . . . . . 37
2.7 Statistical models on proposal and voting behavior using a disaggre-gated race category. . . . . . . . . . . . . . . . . . . . . . . . . . . . . 38
2.8 Models M1-M6 in main text, but including all rounds. . . . . . . . . . . 39
2.9 Statistical models on proposal and voting behaviour with interaction ofGender and Standard Deviation of Self-Placement in Groups. . . . . . . 44
2.10 Statistical models on proposal and voting behaviour with interaction ofRace and Standard Deviation of Self-Placement in Groups. . . . . . . . 45
3.1 Summary of variables included in the study. . . . . . . . . . . . . . . . 73
3.2 Poisson models on the number of new-party candidates at the 5% thresh-old. . . . . . . . . . . . . . . . . . . . . . . . . . . . . . . . . . . . . 75
3.3 Poisson models on the number of new-party candidates at the 5% thresh-old. . . . . . . . . . . . . . . . . . . . . . . . . . . . . . . . . . . . . 79
3.4 Outsiders and new-party candidates in Latin America (1978–2013). . . 83
3.5 Elections Included in the study. . . . . . . . . . . . . . . . . . . . . . . 89
3.6 Robustness tests for method of estimation. . . . . . . . . . . . . . . . . 90
3.7 Robustness tests for method of estimation (cont.). . . . . . . . . . . . . 91
3.8 Robustness tests for interaction between the independent variables ofinterest and limits to campaign spending. . . . . . . . . . . . . . . . . 92
vii

List of Tables
3.9 Robustness tests for endogeneity. . . . . . . . . . . . . . . . . . . . . . 93
4.1 Countries and elections years included in the sample. . . . . . . . . . . 1064.2 Summary statistics. . . . . . . . . . . . . . . . . . . . . . . . . . . . . 1084.3 Empirical models on the association between size of party crash, its
location and interaction of size with electoral system. The dependentvariable is the logged vote share for new parties. . . . . . . . . . . . . . 111
4.4 Table listing the largest parties that crashed in the sample. The tableincludes all crashed parties that previously held > 20% of the votes.Some alliances such as Freedom Pole Italy 2001 are included, becausethe sum of alliance members lost at least 50% of their votes in the nextelection. . . . . . . . . . . . . . . . . . . . . . . . . . . . . . . . . . 119
4.5 Empirical models on the association between size of party crash, itslocation and interaction of size with electoral system. The dependentin M1 is the sum of votes obtained by new parties in the first legislativeelection they participated. Model M2-7 use a logged version of thedependent variable (+1). . . . . . . . . . . . . . . . . . . . . . . . . . 120
4.6 Alternative control variables for models M1-3 in the main text. . . . . . 1214.7 Pooled linear models controlling for the impact of elections in post-
soviet (East European) countries, their interaction with the size of thecollapsed party and location. The dependent variable is the log share ofvotes for new parties (+1). . . . . . . . . . . . . . . . . . . . . . . . . 122
4.8 Count models on the existence of successful new parties and the num-ber of successful new parties that enter. A successful new party is de-fined as one that obtains enough votes to gain a seat in the legislature. . 124
4.9 Empirical models on the association between size of party crash, itslocation and interaction of size with electoral system. With collapsedparties defined as those that completely exit electoral competition. Thatis, they do not compete in the next election. The dependent variable isthe logged vote share for new parties . . . . . . . . . . . . . . . . . . . 125
4.10 Empirical models on the association between size of party crash, its lo-cation and interaction of size with electoral system. With party collapsedefined as a party that looses more than 70% of the vote share it heldin the past election.The dependent variable is the logged vote share fornew parties . . . . . . . . . . . . . . . . . . . . . . . . . . . . . . . . 126
viii

List of Figures
2.1 Avatar set and political self-placement scale presented to the treatmentgroups in the experiment. A screen-shot of the treatment is available inthe Appendix. . . . . . . . . . . . . . . . . . . . . . . . . . . . . . . . 23
2.2 Self-placement and ideological distance in ‘Main’ treatment. Left panel:Distribution of self-placements of participants on the ideological scale- 0 meaning extreme left and 10 extreme right (not observed). Rightpanel: Distribution of absolute differences in self-placements withinparticipants-dyads. . . . . . . . . . . . . . . . . . . . . . . . . . . . . 25
2.3 Distribution of offers and votes in ‘Main’ treatment. Left panel: Jointdistribution of largest and smallest offer made by the proposer to theother two group members. ‘NE’ indicates the Nash Equilibrium of theBaron-Ferejohn game. Right panel: Share of first round offers to thegroup that were accepted and rejected by a majority of group members.In the ‘Main’ treatment 7.66% of proposals were rejected, slightly morethan the zero theoretically predicted. . . . . . . . . . . . . . . . . . . . 26
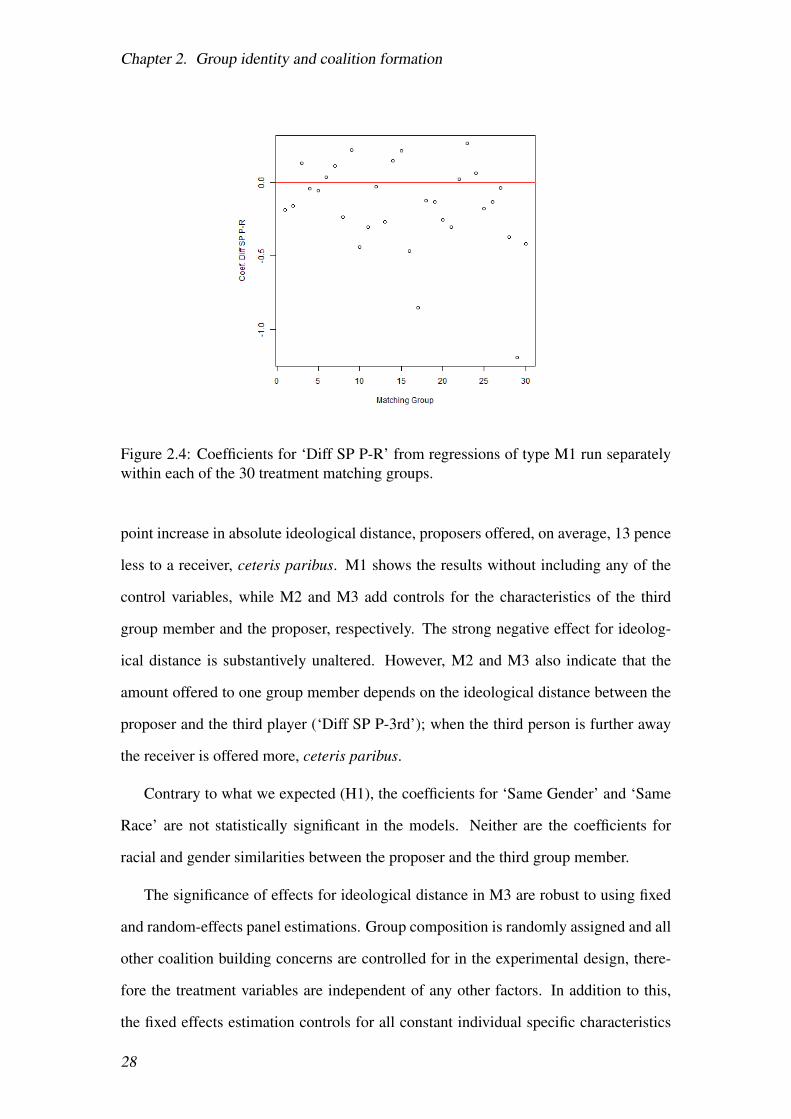
2.4 Coefficients for ‘Diff SP P-R’ from regressions of type M1 run sepa-rately within each of the 30 treatment matching groups. . . . . . . . . . 28
2.5 Distribution of offers and votes for ‘2Dictator’ sample. . . . . . . . . . 36
2.6 M3 Bootstrapped coefficients of ‘Diff SP P-R’ for 10,000 iterations,red lines at ±1.96 sd from the mean. . . . . . . . . . . . . . . . . . . . 40
2.7 M3 Bootstrapped coefficients of ‘Diff SP P-3rd’ for 10,000 iterations,red lines at ±1.96 sd from the mean. . . . . . . . . . . . . . . . . . . . 40
2.8 M4 Bootstrapped coefficients of ‘Diff SP P-R’ for 10,000 iterations,red lines at ±1.96 sd from the mean. . . . . . . . . . . . . . . . . . . . 41
2.9 M4 Bootstrapped coefficients of ‘Diff SP P-3rd’ for 10,000 iterations,red lines at ±1.96 sd from the mean. . . . . . . . . . . . . . . . . . . . 41
2.10 M4 Bootstrapped coefficients of ‘Same Gender’ for 10,000 iterations,red lines at ±1.96 sd from the mean. . . . . . . . . . . . . . . . . . . . 42
2.11 Coefficients for ‘Same Gender’ in matching group level regressions ofmodel M1. . . . . . . . . . . . . . . . . . . . . . . . . . . . . . . . . . 42
ix

List of Figures
2.12 Coefficients for ‘Same Race’ in matching group level regressions ofmodel M1. . . . . . . . . . . . . . . . . . . . . . . . . . . . . . . . . . 43
2.13 Screen shot of treatment sessions. . . . . . . . . . . . . . . . . . . . . 46
3.1 Distribution of new-party candidates. . . . . . . . . . . . . . . . . . . . 713.2 First differences on the effects of public subsidies for new-party candi-
dates at the 5% threshold. . . . . . . . . . . . . . . . . . . . . . . . . 77
4.1 Share of votes obtained by new parties. The left panel displays thedensity of the share of votes. The right panel provides the density ofthe logged share of votes. . . . . . . . . . . . . . . . . . . . . . . . . 109
4.2 Scatter plot of the location of the collapsed party and the vote share itheld before the crash. Location is the absolute distance from the centre(i.e. 5 in the 0–10 left–right ideological scale) . . . . . . . . . . . . . . 110
4.3 Scatter plot of the interaction effect of collapsed party size and electoralformula. The graph presents the predicted new party vote shares basedon the results of model M7. . . . . . . . . . . . . . . . . . . . . . . . . 114
4.4 Predicted log vote share for new parties, interaction of East Europeancountry dummy with size. . . . . . . . . . . . . . . . . . . . . . . . . . 115
4.5 Predicted log vote share for new parties, interaction of East Europeancountry dummy with location (right). . . . . . . . . . . . . . . . . . . . 115
4.6 Bootstrap coef. on collapsed party size. . . . . . . . . . . . . . . . . . 1164.7 Bootstrap coef. on collapsed party location. . . . . . . . . . . . . . . . 1164.8 Histogram of alternative definitions of the dependent variable. On the
left is a count of significant new parties (i.e. those that obtained enoughvotes win a seat). On the right is the dummy variable indicating theexistence of a significant new party entry. . . . . . . . . . . . . . . . . 123
4.9 Bootstrap coefficients on the share of votes. Bootstrapped taking a ran-dom sample of elections. . . . . . . . . . . . . . . . . . . . . . . . . . 127
4.10 Bootstrap coefficients on collapsed party location. Bootstrapped takinga random sample of elections. . . . . . . . . . . . . . . . . . . . . . . 127
4.11 Interaction effect of collapsed party location and first-past-the-post elec-toral formula. . . . . . . . . . . . . . . . . . . . . . . . . . . . . . . . 128
x

Chapter 1
Introduction
Modern democracies are a far cry from the public discussions of the ancient Greek
Agora where all free men could take part in decisions. Today the principal actors in the
political stage are parties and their leaders. But parties do not simply aggregate their
voters’ opinions; they have interests and biases of their own that shape the decisions
they make. Who to form alliances with? When to run as an independent body? What
policy position to take? The answers parties give to these questions, the way they
behave, have substantive consequences for the functioning of a democratic system.
Not surprisingly, political science has a long history of research into party behaviour
(Duverger 1959, Riker 1962, 1982, Axelrod 1970, de Swann 1973, Laver & Schofield
1990, Laver & Budge 1992, Cox 1997, Baron & Diermeier 2001, Hug 2001, among
many others).
The research presented in this dissertation contributes to this field by studying the
impact of incentives that alter two types of party behaviour: i) coalition building and
ii) the entry of potential new parties into electoral competition. These two decision
making processes have distinct outcomes and procedures, however, they share an un-
derlying principle: both are implemented by party leaders who are subject to varying
costs, benefits and non-monetary incentives.
Starting from a common rational choice approach, the three papers in the disserta-
tion focus on different aspects of party behaviour, each making a unique contribution
to their area of research. Chapter 2 tests the impact of (non-monetary) social identity
1
Chapter 1. Introduction
on coalition formation, eliminating all office or policy seeking benefits that could oth-
erwise explain the behaviour. The results provide evidence that social identity concerns
can affect coalition formation, suggesting that the inclusion of this variable in formal
models could help resolve the differences between predicted and observed coalitions.
Chapter 3 addresses the impact of party financing on new party entry. The results high-
light the contrasting effects of different types of party financing on the stability of the
party system and, consequently, the trade-offs faced by policy makers. Chapter 4 fo-
cuses on the impact of opportunities for new party entry created by an opening in the
policy space after a party collapse. In doing so, it is the first paper to empirically test
spatial arguments of party entry from a dynamic exit-entry perspective. Together all
three papers add to the broader understanding of how decisions made by political par-
ties are affected by the circumstances under which they are made and personal biases.
The first paper (Chapter 2) looks at coalition building behaviour. Political coali-
tions are an integral part of modern politics. It is therefore important to understand the
process through which coalitions emerge. There is a large empirical and game theo-
retic literature on this topic. Typically, game-theoretic models cannot predict a unique
equilibrium and, when they do, results suggest alliances between the largest party and
weakest partner (or partners) that produce a sustainable coalition (see Austen-Smith
& Banks 1988, Baron & Diermeier 2001). However, these outcomes can imply coali-
tions between parties at different sides of the policy spectrum, which are not supported
by empirical evidence. On the contrary, studies of parliamentary democracies indicate
that coalitions (and pre-electoral alliances) are less likely to form as the ideological dis-
tance between potential partners increases (Martin & Stevenson 2001, Golder 2006b).
An example is the current German government. Although the party alliance of the con-
servative CDU/CSU was just five seats short of an absolute parliamentary majority it
formed a coalition with the second largest party, the social-democratic SPD. The alter-
native was forming a coalition with one of the two smaller parties (the Greens and the
Left). However, they were deemed too ideologically distant and unacceptable partners.
The study presented in Chapter 2 suggests that one factor that may improve theo-
2
retical predictions about coalition formation is membership in predefined groups. Ex-
perimental and formal research finds that social identity is relevant for individuals’
decision making processes, including political biases, policy preferences, cooperation
and the number of candidates (Tajfel et al. 1971, Tajfel & Turner 1986, Chen & Li 2009,
Akerlof & Kranton 2000, 2010, Bartels 2002, Green et al. 2004, Iyengar et al. 2012,
Charness et al. 2007, Fershtman & Gneezy 2001, Dickson & Scheve 2010, among many
others). The argument is tested using a laboratory experiment to measure the effect of
social identity in a coalition building game. Results indicate that ideological distance
has a strong effect on who is selected as a coalition partner.
Chapters 3 and 4 of the dissertation concentrate on new political parties. Studies
on new party entry have a relatively short history. One line of research analyses the
impact of institutions and how they alter the costs and benefits of entry (cf. Cox 1997).
The insights from this literature highlight the level of permissiveness in electoral sys-
tems as one of the strongest enablers of (or limitations to) new party entry (see Harmel
& Robertson 1985, Cox 1997, Tavits 2006). Another relevant factor is the amount of
party regulation, where more rules are associated with lower a number of new parties
(van Biezen & Rashkova 2014). The empirical evidence also shows that country char-
acteristics, such as the time since democratization, the level of ethnic heterogeneity and
size of the population are associated with the number of new parties (Hug 2001, Tavits
2006, 2008a, van Biezen & Rashkova 2014).
The investigation in Chapter 3 contributes to understanding how public subsidies for
parties alter the costs and benefits of entry. The paper provides a disaggregated analysis
on how the allocation of subsidies for campaigns and on-going party activities affect
new party entry. Previous literature on party finance finds evidence of the importance
of these regulations on the party system (Hug 2001, Hooghe et al. 2006, Scarrow 2007,
Tavits 2006, 2008a, among many others). However, with the notable exception of Pot-
ter & Tavits (2013), many studies estimate an aggregate effect of the presence/absence
of public funding for political parties.1 In contrast to that approach, this chapter ar-
1Potter & Tavits (2013) measure the effect of inequality in the distribution of public funds amongdifferent types of parties (e.g. large, small, old and new) on the size of the party system.
3
Chapter 1. Introduction
gues that different types of subsides have opposite effects on entry, depending on what
stage of the electoral cycle the funding is designated for and, therefore, these should
be studied independently. The hypothesis tested in the paper proposes that monetary
and media subsidies for campaigns, allocated based on past electoral results, generate
higher relative costs for presidential candidates running for new parties, decreasing the
number of entries. On the other hand, funding for on-going party activities, distributed
as a function of upcoming electoral results, are assumed to generate incentives for new
parties to sponsor a presidential candidate. Empirical results on Latin American presi-
dential elections provide evidence in favour of these hypotheses.
A second strand of literature on new parties concentrates on the impact of policy
supply. Laver & Schilperoord (2007) use an agent based approach to create an en-
dogenous model of party birth and death, using the dynamics of supply and demand to
observe new party entry. Their results identify the threshold of survival as the key limi-
tation to party birth. Zons (2013) and Lago & Martínez (2011), on the other hand, focus
on variations in the characteristics of the party system that change within a country over
time. Zons (2013) indicates that new parties are more likely to enter when policies of-
fered by existing parties are less diverse. That is, when voters are not appropriately
represented by existing parties. Lago & Martínez (2011) measure the effect of turnout
(market failures), seat threshold and volatility (voter elasticity) on successful new party
entry. Their study of Spanish sub-national elections finds that higher volatility is asso-
ciated with a higher probability of a successful entry. However, they also argue that the
electoral threshold to obtain a seat in the legislature conditions the likelihood that new
parties can take advantage of market failures.
The research in Chapter 4 makes a contribution to the literature on the impact of
policy supply on new party entry. It is, to my knowledge, the first paper to empirically
measure the impact of party exit on new party entry. In doing so it identifies when op-
portunities for new party entry are created within a country’s institutional and cultural
setting. The study tests the hypothesis that possibilities for successful entry are created
after an existing political party collapses. The paper argues that a party collapse, un-
4

1.1. Group identity and coalition formation
derstood as a loss of more than 50% of a party’s vote share, leaves a group of voters
without adequate representation, thus creating space for new parties to enter in the next
election. Consequently, the larger the space opened by a collapse the higher the new
party vote shares one can expect. However, the study proposes that this effect is condi-
tioned by the permissibility of the electoral formula. Empirical results on data from 33
parliamentary democracies produce robust evidence in favour of these arguments.
1.1 The impact of group identity on coalition formation
This first paper addresses the question of whether social identity impacts the selection of
coalition partners. However, an important problem with measuring the effect of social
identity is that expressed identities are created by group members in reaction to what
they can observe about others within existing political environments (cf. Michelitch
2015, Posner 2004, Jenkins 1996). This makes it impossible to disentangle the effect of
identity using conventional observational data approaches. To account for this problem
the study uses a laboratory experiment.
The experiment consists of a divide-the-dollar game where participants must decide
how to split a £17.00 ‘pie’ among three group members (including themselves). The
game includes ten coalition-building periods, each of which is composed of a maximum
of five rounds. After each round the pie is discounted by a factor of δ = 0.7 if no
coalition is agreed, thus generating a cost for delaying the negotiation. If the offer is
rejected in the fifth round, all players in the group get zero and move on to a new period.
Each negotiation group is composed of three participants and subjects are re-grouped
in every period with players from their matching group (known as stranger design in
experimental literature).
A baseline and two experimental treatments (identified as ‘Main’ and ‘2Dictator’)
are used to test the effect of group identity on participants’ coalition-building deci-
sions. In baseline sessions, participants go through the experimental procedure without
any information about who they are interacting with. In the ‘Main’ treatment sessions
participants are informed of the gender, race, and ideological positions of their group
5
Chapter 1. Introduction
members. Gender and race data is shown by giving each participant an on-screen avatar
that matches the characteristics they provide in a pre-treatment survey. The ideological
position of each group member is displayed on screen on a left-right scale that indicates
the location of each member. The ‘2Dictator’ treatment maintains the same structure
but adds two dictator games (with social identity information), one before and another
after the ten coalition-building periods. This allows us to explore whether majority
bargaining can increase group identity concerns (see Posner 2004).
The experiment is structured in such a way that an ‘offer’ simply consists of a
division of material benefits between the participants. Coalitions are then formed only
on the basis of these monetary offers, minimizing any concerns partners may have
about future policy outputs from coalition bargaining. This design allows one to test
for a ‘pure effect’ of group identity. Results show that gender and race do not affect
participants’ decisions. By contrast, ideology has a strong effect. Participants offer less,
and are less likely to offer any positive amount, to those who are more distant from them
ideologically. The results provide evidence that preference for similar coalition partners
can help predict which coalitions form, even in the absence of policy concerns. This
implies that coalition formateurs are not purely rational actors pursuing policy goals
and/or the benefits of office. Rather, they also care about the identity of their partners,
preferring others who are more like themselves.
1.2 Party financing and the entrance of new-party can-
didates
The second paper analyses the question of how party financing regulations affect the
entrance of new-party candidates in presidential elections Latin America. There have
been a substantial number of new-party candidates in recent Latin American elections.
Among noteworthy examples are, presidents Rafael Correa and Lucio Gutiérrez in
Ecuador, Alberto Fujimori in Peru and Hugo Chávez in Venezuela.
The paper argues that one reason new-party candidates enter are the incentives in-
6

1.2. Party financing and new-party candidates
troduced by regulations regarding the public financing of political parties. Campaign-
period subsidies (allocated based on past electoral results), are hypothesised to increase
the relative costs of the campaign, creating a potential barrier to entry that can reduce
the number of presidential candidates sponsored by new parties. On the other hand,
performance based subsidies for inter-election (i.e. on-going) party activities are sug-
gested to have the opposite effect. As subsidies for on-going activities are obtained as
a consequence of a successful campaign, when these funds are available new parties
would have incentives to run the most competitive election campaigns possible. An
efficient way of doing this is by running a presidential candidate and using his or her
‘coattail’ effects (cf. Golder 2006a, West & Spoon 2015, among others) to improve the
party’s overall results.
To test this argument the study uses a Time-Series Cross-Section estimation on the
number of new-party candidates participating in 113 democratic elections in 18 Latin
American countries between 1978 and 2013. A novel dataset on new-party candidates
and party finance regulations was coded specifically for this purpose. It includes an
adaptation of the concept of ‘new parties’ defined by Hug (2001) that accounts for the
predominance of presidential elections in the region. Furthermore, this operationalisa-
tion focuses the analysis on new parties that appeal to a national audience, excluding
regional parties that don’t aspire to represent voters outside a local constituency. To the
best of my knowledge this is the first dataset of its kind, and creates opportunities to
test the generalizability of new party theories on a broader institutional, economic and
cultural setting. Additionally the dataset includes the first time-series categorization of
party finance regulations in Latin America.
The empirical results corroborate the hypotheses indicating a strong impact of pub-
lic funding for political parties on the number of new-party presidential candidates that
enter. Substantively, the study highlights the importance of looking at the effects of
specific public funding provisions and carefully considering their impacts for future
institutional reforms. In the case presented here, increases in costs for new-party can-
didates, produced by unequal monetary and media funding for campaigns, reduce the
7
Chapter 1. Introduction
incentives for entry. This, in turn, corresponds with a more stable electoral arena, where
the number of new entries is small and the status quo tends to prevail. On the other
hand, public subsidies for political parties’ inter-election (on-going) activities increase
the incentives to participate in the election, other costs being constant. Consequently,
these types of benefits can lead to more variation in the actors and policy offers avail-
able to the electorate.
1.3 Party collapse and new party entry
The third paper studies when new parties emerge. The main hypothesis is that oppor-
tunities for successful entry are created after a large political party collapses. However,
endogeneity in the process of party entry and exit limits the reliability of contempora-
neous empirical estimations of causal effects (cf. Laver & Schilperoord 2007). Take,
for example, the Spanish 2015 general elections. The governing Partido Popular (PP)
lost its parliamentary majority, while at the same time the new party Podemos obtained
20.66% of the votes in its first general election.2 The rise of Podemos can be explained
by PP supporters dissatisfied with the party’s corruption scandals or by Podemos’ anti-
austerity message, or most likely a bit of both.3 If one were to estimate the effect of exit
on entry at one point in time it would be impossible to identify which of the scenarios
explains the new party’s result.
To addresses the endogeneity issue this paper measures the effect of party collapse
in the previous election on the vote share for new parties in the current one. Since,
the entrance of a new party in an election cannot cause a party to crash in the previous
one, this approach allows one to identify the impact an opening in the policy space,
without the contamination of the new party’s behaviour. One concern would be that
time trend could explain both the crash of a party in one election and the success of a
new party in the next. However, this is minimised by focusing on the characteristics of
2Election results obtained from the newspaper El País http://elpais.com/tag/elecciones_generales_2015/a/on 07-01-2016
3Data on corruption in Spain obtained from http://www.elperiodico.com/es/temas/corrupcion-partido-popular-270 on Feb 1, 2016. Data on Podemos was obtained from http://podemos.info/programa/the same day.
8
1.4. Plan of the study
the collapsed party in the election before the crash occurred, introducing a two election
interval between the values of the dependent and independent variables of interest.
To test the hypothesis, empirical estimations are conducted on a broad dataset of 33
developed democracies between 1945 and 2011. The results provide strong evidence
that the size of the collapsed party (a measure of the space created) is associated with
new party electoral success. But the magnitude of the effect of size on new party
vote share is conditioned by the permissibility of the electoral system. The results are
robust to multiple methods of estimation, controls for outliers in the data and different
operationalisations of the dependent variable.
1.4 Plan of the study
The study proceeds with three self-contained papers. Chapter 2 presents an experimen-
tal study on the impact of social identity in coalition formation. Chapter 3 evaluates
the effect of party financing on the entry of new political parties. Chapter 4 investigates
how changes in a country’s party system, caused by a collapse of a political party, can
generate opportunities for new party entry. Chapter 5 summarizes the results and pro-
vides an overview of implications and further research questions that are raised by this
dissertation.
9


Chapter 2
The impact of group identity on
coalition formation
This study is co-authored with David Hugh-Jones, University of East Anglia, and Arndt
Leininger, Hertie School of Governance
11
Chapter 2. Group identity and coalition formation
Abstract
Bargaining and coalition building is a central part of modern politics. Typically, game-
theoretic models have difficulties predicting a unique equilibrium. In this paper we
argue that the predictions could be improved by incorporating group-identity prefer-
ences in coalition formation. We test the effect of gender, race and ideological distance
on coalition formation in a majority-rule bargaining experiment. Despite the absence
of any incentives to do so, we find that ideological distance significantly affects offers
made to potential coalition partners. As a result, coalitions tend to be ideologically
coherent, even though there is no ideological policy output. We conclude that social
identity considerations can determine equilibria in coalition formation.
Keywords— Coalition Formation, Laboratory Experiments, Baron and Ferejohn
Model, Legislative Bargaining, Social Identity
12

2.1. Introduction
2.1 Introduction
Coalitions are an integral part of modern politics. They play a fundamental role in gov-
ernment formation and legislation. It is therefore important to understand the process
by which coalitions emerge. There is a large empirical and game theoretic literature on
the topic; however, typically, game-theoretic models cannot predict a unique equilib-
rium.
One factor that may help predict coalition formation is membership in predefined
groups. In some countries, political coalitions and parties are formed on the basis of
ethnicity (cf. Horowitz 1993, Posner 2004, Madrid 2008). In others, parties are based
on shared ideological positions. Empirically, coalitions in parliamentary democracies
are less likely to form as the ideological distance between potential partners increases
(Martin and Stevenson 2001). Similarly, pre-election coalitions are more likely to
form, and are more acceptable to voters, if they include ideologically congruent parties
(Golder 2006, Gschwend and Hooghe 2008). As a consequence, ‘oversized’ coalitions
are frequently observed in actual politics. A particularly striking example is the cur-
rent German government. Although the party alliance of the conservative CDU/CSU
was just five seats short of an absolute parliamentary majority it formed a coalition
with the second largest party, the social-democratic SPD. The alternative was forming
a coalition with one of the two smaller parties (the Greens and the Left). However,
they were deemed too ideologically distant and unacceptable partners. Social identity
could also limit the possibility of forming a coalition altogether. Take for example the
Spanish 2015 election, for the first time since the transition to democracy in 1978 no
party won a clear majority of votes forcing parties into coalition negotiations.1 After
several months of talks the largest parties were not able to form a working coalition and
new elections are scheduled for June 2016.2 One reason that could explain this unwill-
ingness of parties to form alliances, despite negotiations over office and policy benefits,
1For data on the Spanish transition see http://www.systemicpeace.org/polity/Spain2010.pdfretrieved May 25, 2016. Election results obtained from the newspaper El Paíshttp://elpais.com/tag/elecciones_generales_2015/a/ on 07-01-2016.
2Electoral calendar in http://www.elmundo.es/espana/2016/02/15/56c225f722601d07128b45a9.html,obtained May 25, 2016.
13
Chapter 2. Group identity and coalition formation
is social identity. In the Spanish case, the four parties that could form a government
were on opposite sides of a left-right and a new (anti establishment) vs. old party dis-
tinctions, with no majority coalition on any side of these cleavages. For a coalition to
form, parties would have needed to incur in strong social identity concessions.
Thus far, theoretical models have successfully incorporated policy and office seek-
ing preferences into coalition formation. However, their results tend to predict coali-
tions will form between the largest party and the one with the smallest bargaining
power, which may or may not produce ideologically coherent alliances (Austen-Smith
and Banks 1988, Baron and Diermeier 2001). We believe that the incorporation of
group-identity preferences can help improve the predictions and bring them closer to
the patterns observed in empirical data (e.g. ideological coherence) (Martin and Steven-
son 2001).
There are two reasons that groups could matter in coalition formation. Firstly, if
government outputs include policy decisions (as opposed to distributive benefits, a.k.a.
the ‘spoils of office’), and if negotiating actors have preferences over these policy out-
puts, then groups may reflect these preferences. For example, in many countries, mem-
bers of political parties have shared ideological positions on the left–right dimension.
Ethnic group membership may also correlate with policy preferences if, say, groups
have different income levels, or if groups living in different geographic areas want to
tilt spending towards their homeland. Some models of coalition bargaining incorporate
policy preferences (see Axelrod 1970, de Swann 1973, Austen-Smith and Banks 1988,
Baron and Diermeier 2001, among others). However, these ‘policy-seeking’ models
can be complex and make strong assumptions about the trustworthiness of negotiation
results (cf. McKelvey and Schofield 1986, Laver and Schofield 1990, Laver and Budge
1992, Laver 1997, Bandyopadhyay and Chatterjee 2006).
A second reason is that actors may simply prefer to have others like themselves, or
fellow members of their group, as coalition partners, irrespective of any policy outputs.
According to social identity theory, a person’s membership in a group may form an im-
portant part of their personal identity (Tajfel et al. 1971, Tajfel and Turner 1986, Akerlof
14

2.1. Introduction
and Kranton 2010). They may then behave more altruistically towards, and preferen-
tially associate with, in-group members (see Chen and Li 2009, Akerlof and Kranton
2010, Charness et al. 2007, Fershtman and Gneezy 2001, among others). Political al-
legiance is itself a form of group identity (Campbell et al. 1960, Green et al. 2004).
Similarly, ethnic group membership often induces strong feelings of group identity. As
well as preferences for their own group, actors may have emotions about particular
out-groups. Aneurin Bevan, a British Labour party politician, stated: “No amount of
cajolery, and no attempts at ethical or social seduction, can eradicate from my heart a
deep burning hatred for the Tory Party. So far as I am concerned they are lower than
vermin.” An example of how both in-group preferences and out-group aversion might
affect coalition bargaining even in the absence of policy concerns.
An important problem with measuring the effect of social identity is that expressed
identities are created by group members in reaction to what they can observe about
others and within existing political environments (cf. Michelitch 2015, Posner 2004,
Jenkins 1996). This makes it impossible to disentangle the effect of identity using con-
ventional observational data approaches. To do so, we use a laboratory experiment, a
standard divide-the-dollar majority bargaining game where policy is purely distributive
(Baron and Ferejohn 1989).3 In this paradigm, an offer simply consists of a division
of material benefits between the participants. Thus, we remove or minimize any con-
cerns about future policy outputs of coalition bargaining, allowing us to test for a ‘pure
effect’ of group identity in the experiment. Participants are informed of their potential
coalition partners’ gender, race and political ideology. Our results show that gender and
race does not affect participants’ decisions. By contrast, ideology has a strong effect.
Participants offer less, and are less likely to offer any positive amount, to those who are
more distant from them ideologically.
Of course students in a lab cannot be equated to professional politicians who make
decisions in representation of larger groups. However, political parties are not strictly
outcome-oriented black boxes either. Parties are formed by individuals, leaders, sup-
3With the exception of Tremewan (2010), who uses exogenous stimuli to induce group identity, thereis no other research known to us addressing the impact of group identity on coalition-building.
15

Chapter 2. Group identity and coalition formation
porters, grass-roots campaigners, and donors, among others, all of whom can have per-
sonal biases. The experiment shows that, even in a stylized environment where choices
don’t have policy consequences or affect future political results, people express prefer-
ences for those that are ideologically closer to them. We argue that these concerns can
also be relevant for party leaders. For one, they can have personal biases that limit their
willingness to initiate negotiations with ’opposition’ parties. However, even if profes-
sional politicians are pragmatic and outcome-oriented with no social identity concerns,
they must reckon with the preferences of their selectorate, which may have strong par-
tisanship and group-based emotions (cf. Green et al. 2004, Iyengar et al. 2012, Lehrer
2012, among many others). They may therefore be forced to internalize their sup-
porters’ dislikes of other parties and groups, as forming alliances with ideologically
opposing parties can have important electoral consequences. An example of this is the
loss in support for the Liberal Democrats after the 2010-15 coalition government with
the Conservatives in Britain.
2.2 Literature: Coalition-building and social identity
Coalition building behaviour has been studied within the game theoretic literature.
Good summaries can be found in Laver (1997), Bandyopadhyay and Chatterjee (2006),
Martin and Stevenson (2001). Broadly speaking there are two main strands in this line
of research: one that only includes ‘office-seeking’ incentives (von Neumann and Mor-
genstern 1953, Riker 1962, Baron and Ferejohn 1989, among many others) and another
that adds ‘policy-seeking’ benefits to the utility calculation (Axelrod 1970, de Swann
1973, Baron and Diermeier 2001, among many others). Both perspectives include co-
operative and non-cooperative game theoretic approaches.
Office-seeking models typically predict some form of minimal winning coalitions
(i.e. coalitions that have just enough voting power to pass legislation). These models,
though better than random, have not performed well empirically (Laver and Schofield
1990) and do not always yield unique predictions. For example, if many actors have
equivalent voting power, then there are many possible minimal winning coalitions and
16
2.2. Literature: Coalition-building and social identity
any of these may emerge in equilibrium, including ones that consist of parties at differ-
ent extremes of the policy space. Ideologically incoherent coalitions are, however, not
regularly observed empirically (Martin and Stevenson 2001).
Experimental research using office-seeking models of coalition building (e.g. Baron
and Ferejohn (1989)) has provided important insights on how rules alter coalition for-
mation behaviour (see also Gamson 1961, McKelvey 1991, Drouvelis et al. 2010, Tsai
2009, Fréchette et al. 2003, 2005, Tremewan 2010, Diermeier and Morton 2005). Ex-
perimental results tend to confirm the general intuitions of the theoretical models: the
importance of the relative power of partners with different voting weights in coalition
formation; the (in)equality in division of spoils and duration of the negotiations caused
by different approval rules (unanimity vs simple majority) and size of the discount
factor. However, experimental results have also produced a smaller than predicted pro-
poser advantage and a substantive number of ‘Grand’ coalitions (i.e. those that include
more than the minimum necessary number of coalition partners). Equal distributions
of the pie (or equal among ‘coalition partners’), though not the majority of cases, are
a fairly regular occurrence (cf. Diermeier and Morton 2005). Experience also plays a
role and actions tend to get closer to equilibrium predictions as participants have more
experience with the game (Fréchette et al. 2005, Drouvelis et al. 2010).
Policy-seeking models, add a second ‘policy’ dimension to actors’ preferences. The
earlier models in this tradition argued in favour of minimal-connected coalitions (Axel-
rod 1970) or minimal-winning coalitions with the smallest ideological range (de Swann
1973). More recently Austen-Smith and Banks (1988) and Baron and Diermeier (2001)
have updated these types of models to incorporate institutional structures to the negoti-
ation procedures. However, in this process, they tend to make strong assumptions about
the credibility of coalition agreements and the possibility of separating office and pol-
icy benefits. These assumptions lead to predictions of coalition formation between the
largest party and the one with the smallest bargaining power (i.e. continuation value)
that can form a winning coalition. “For example, if an incumbent party were selected
as formateur, it would prefer to form a government with the party that was previously
17

Chapter 2. Group identity and coalition formation
in the opposition” (Baron and Diermeier 2001, p.936). Baron and Diermeier (2001)
hint at some limitations regarding how ideologically distant the potential partner can
be, but overall their model emphasises partner selection on the basis of weakness rather
than policy similarity.
One aspect that coalition building theories have ignored is the potential impact of
social identity. Theoretical and experimental research has found that social identity
is relevant for individuals’ decision making processes, including effects on preferences
for social outcomes, policy and re-distribution (Chen and Li 2009, Cohen 2003, Akerlof
and Kranton 2000, 2010, Kranton et al. 2012), cooperation and punishment (Tajfel et al.
1971, Tajfel and Turner 1986, Goette et al. 2006), as well as trust and discrimination
(Charness et al. 2007, Fershtman and Gneezy 2001, Hargreaves Heap and Zizzo 2009).
Social identity is also present in partisanship, with party members expressing in- and
out-group biases regarding actions and opinions of members of the opposition (Camp-
bell et al. 1960, Bartels 2002, Green et al. 2004, Iyengar et al. 2012, among others).
Coalitions are formed by individuals and the groups they represent, as such, they
poses an identity —a sense of self (Akerlof and Kranton 2000). Coalition formation,
thus, can be influenced by a formateurs’ preference for working with a party (or parties)
that are similar to their own (or a dislike of those that are different). These preferences
could explain coalition formation among similar types of parties, despite those coali-
tions being more costly for the proposer in terms of office and policy concessions.
We believe that the predictions of coalition models could be improved if they in-
corporate group-identity preferences into the calculations. By accounting for the cost
of forming a coalition with a political party at a different extreme of the ideological
spectrum, the models could better predict the types of coalitions observed empirically.
An example of this type of adjustment can be found in Dickson and Scheve (2010),
who adds social-identity to theoretical models of numbers of candidates.
18

2.3. Experimental design and treatments
2.3 Experimental design and treatments
Our experiment, as much of the experimental literature on coalition-building, is based
on the seminal Baron and Ferejohn (1989) model. In it, n members of a legislature
vote by majority rule on proposals to divide a fixed unit of income. In each period, one
legislator is randomly selected to make a proposal. If a proposal is accepted, the game
ends; if it is rejected, the pie is multiplied by a positive discount rate δ ≤ 1 and the
game continues with a new round of proposals. In the version we used, each legislator
was equally likely to be selected as a proposer. In the natural, symmetric equilibrium
focused on by Baron and Ferejohn (1989), the proposer offers
δ
n
to (n−1)/2 group members, and keeps
1− δ (n−1)2n
to herself. The proposal is accepted by a majority and the game ends in the first round.
In our implementation of the model, experiments started with a short questionnaire
on demographics and political identity. For the coalition building stage, participants
played ten rounds of a divide-the-dollar game in three-person groups (description be-
low). After that, subjects played a one shot three-person dictator game (pie of £3.00),
that was used to measure participants’ pro-social orientation. Finally, participants filled
out a short survey regarding their experience in the experiment.
In the coalition-building stage participants decided how to split £17.00 among the
three group members (including themselves). There were ten negotiation periods, each
of which was composed of a maximum of five rounds. In the first round all group mem-
bers submitted a proposal (a division of the £17.00 pie). One proposal was randomly
selected and presented to all group members, who then voted to accept or reject it. If
the offer was accepted, it was recorded as the result of that negotiation period and par-
19

Chapter 2. Group identity and coalition formation
ticipants went on to the next period. If it was rejected, members went on the next round
(within the same period). The second round had the same structure as before, but the
pie was discounted by a factor of δ = 0.7 (i.e. in each round pie = 17.00 ∗ δ round−1).
The process was repeated if the proposal was disapproved a second time. In each round
participants were shown the exact size of the pie in pounds and pence.4 If the offer
was rejected in the fifth round, every player in the group got zero and moved on to a
new period. Subjects were informed of the results of the negotiation at the end of each
period.
We implemented this design to make the delay in forming a coalition costly and
because it is an integral part of the original Baron and Ferejohn (1989) model. This
set-up is similar to that used by Drouvelis et al. (2010) and allowed us to collect data
on all participants’ proposals in each period.
Each negotiation group was composed of three participants and subjects were re-
grouped in every period with players from their matching group (composed of six sub-
jects), in a stranger design.5 This design was used to reduce any incentives for partic-
ipants to choose partners of their same type and avoid any consequences of the out-
comes of coalition formation for following periods. Subjects were randomly assigned
into each matching group and the answers to survey question had no influence on group
formation.6
Experiment instructions were read out loud (with printed and on-screen versions
available) and questions were answered in private (details in Appendix.) This process
took no more than ten minutes. There were no trial periods. Participants were paid for
the outcome of one randomly selected negotiation period, plus their earnings from the
dictator game and a £2.50 show-up fee.
4To make it easier for the participants, the discounted pies were rounded to the nearest ten pence andsubjects were provided with pen, paper and a calculator.
5Subjects were informed that in each period they would be rematched into a different group, but thesize of the matching group was not mentioned. Instructions in Appendix.
6The experiment was coded using the betr package for R (code available upon request).betr is anR package for conducting social science experiments (https://github.com/hughjonesd/betr). All code isavailable for replication.
20
2.3. Experimental design and treatments
Session Type # Sessions Total Participants TotalIndiv Obs per session Participants
Baseline 4 12 18 72Main Treatment 10 30 18 180
2Dictator Treatment 2 5 12 & 18 30
Total 16 47 282
Table 2.1: Summary of experimental treatments and sessions .
2.3.1 Treatments
To test the effect of group identity on participant’s coalition-building decision we con-
ducted a ‘Baseline’ and two experimental treatments (identified as ‘Main’ and ‘2Dicta-
tor’, see Table 2.1). In ‘Baseline’ sessions, participants went through the experimental
procedure described above without any information about who they were interacting
with. Each group member was randomly identified with a number from 1–3, which
was reallocated in every period with each new group. The data from these sessions
is used as a base for evaluating subject’s behaviour under the specific experimental
procedures, but it is not used for hypotheses testing, so the number of sessions is low.
In the ‘Main’ treatment sessions participants were informed of the gender, race,
and ideological positions of their group members in the coalition-building stage. The
gender and race data was shown by giving each participant an on-screen avatar that
matched the data they provided in the survey, where subjects were asked their race and
gender. The alternatives for gender were “Male” and “Female”, for race were “White
Caucasian”, “Black”, “Latin American” and “South Asian”.7 After the survey, the
participants were shown the complete set of avatars (Figure 2.1) and informed that each
participant would be allocated one based on what they stated in the survey. Participants
who indicated they were “Latin American” or “South Asian” both got the same ‘brown’
skinned avatar, as it was not possible to create specific avatars that were sufficiently
7Other races were excluded from the sample by limiting the nationalities of the eligible participantsfrom the subject pool. As a control we also asked the subjects their nationality in the survey. Out ofthe 210 subjects in treatment groups, two indicated they had a nationality that was different from thelist originally intended. Participants were also given an opportunity to provide comments about theexperiment at the end and there were no complaints about the avatar allocation. The wording of thesurvey can be found in the Appendix, as well as a list of all nationalities accepted in the sample.
21

Chapter 2. Group identity and coalition formation
different from each other to produce meaningful treatments. The ideological position
of each group member was shown on a left-right scale (Figure 2.1). The information
was also taken from the survey, where subjects were asked to place themselves on an
11-point scale from 0 (left) to 10 (right).8 Because the dictator game at the end of
the experimental session was intended as a general measure of the individual’s pro-
social behaviour, subjects played that stage without any information about the other
participants.
The design and information provided to participants was selected in the interest of
testing (social-identity) factors that may influence an individuals coalition-building be-
haviour, independent of policy or office concerns. Gender and race represent classic
social-identity traits that affect human behaviour (Jenkins 1996). In certain countries
political parties are formed on the basis of ethnicity (cf. Horowitz 1993, Posner 2004)
and same gender groups can cut across party lines to address in-group concerns (e.g. the
Women’s Caucus in the United States). There is also observational evidence suggest-
ing that, in the United States, Women, Latino and African American legislators exhibit
different legislative behaviour than white males (cf. Barrett 1997, Bratton 2006). Ideo-
logical self-placement, on the other hand, is a prominent aspect of politics, yet, has the
advantage of a lower social-desirability bias, as people are less ashamed to discriminate
against political out-groups (e.g. Aneurin Bevan). Furthermore, by including informa-
tion on all three characteristics we avoid simply adding one obvious focal point and
allowing participants to use the information that is most relevant to them.
The ‘2Dictator’ treatment included two dictator games (with social identity infor-
mation) in the experimental procedure, one before and another after the ten coalition-
building periods. This allowed us to explore whether majority bargaining can increase
group identity concerns (see Posner 2004). The dictator games had the same structure
as the negotiation rounds but without voting: there was a £17.00 pie, all participants
proposed a distribution, one was randomly selected as the ‘offer’ and the result was
displayed to the group. Subjects were shown the avatars and ideological positions of
8Research by Kroh (2007) suggests that using an 11-point scale with natural mid-point is superior toother alternatives.
22

2.4. Hypotheses
Figure 2.1: Avatar set and political self-placement scale presented to the treatmentgroups in the experiment. A screen-shot of the treatment is available in the Appendix.
the group-members. Instructions for the different games were provided right before the
change occurred.9
2.4 Hypotheses
The theoretical predictions of the Baron and Ferejohn (1989) model indicate one would
expect subjects to offer 3.9667̄ ≈ 4.00 pounds to one of the group members and keep
the rest. However, experimental research on this model suggests this result is unlikely
and one should expect a smaller proposer advantage (see Fréchette et al. 2005, Dier-
meier and Morton 2005). Regarding partner selection, pure rational choice perspectives
predict coalitions between the formateurs and the weakest (a.k.a. cheapest) group mem-
ber. However, in this experimental design all group members have equal probabilities
of being selected as formateurs and the same voting power, so one would expect partner
selection to be random, unless other factors mattered.
On the other hand, building on the literature on social-identity and coalition-building
we argue that social identity co-determines coalition formation, even if it plays no role
in a game’s payoff function. Our hypotheses then are as follows:
9In a slight variation from the ‘Main’ treatment, in ‘2Dictator’ one of the, now twelve periods (in-cluding the two dictator games) was randomly chosen for payment. As this design eliminated the extraearnings from the dictator game, we increased the show-up fee to £5.00 to maintain similar averagepayments.
23
Chapter 2. Group identity and coalition formation
H1 Offers to same gender and/or race group members will be higher than the offers
made to group members of different gender and/or race.
H2 Offers to other group members will be higher when the ideological distance be-
tween the proposer and receiver is smaller.
H3 Holding offers constant, group members will be more likely to accept offers from
a proposer of the same gender/race, and from proposers who are closer to them
ideologically.
H4 As a result, coalitions of those voting yes on a proposition will be more likely to
be ideologically ‘connected’, and more likely to be composed of same-race and
same-gender members, than would happen by chance.
2.5 Data
All experimental sessions were conducted at the University of Essex Social Science
Experimental Laboratory (ESSEXLab) in December 2014, February and May 2015.
We ran four ‘Baseline’ group sessions, ten ‘Main’ treatment group sessions and two
sessions of the ‘2Dictator’ treatment. Each session consisted of 18 individuals (see
Table 2.1).10 The participants were recruited from the ESSEXLab subject pool, who
declared their nationality to be of a stable democracy according to Polity IV measures
(Marshall and Cole 2014). Participation was also limited to subjects that had taken part
in less than five experiments overall, none of which were bargaining experiments.11
Sessions lasted between 50-80 minutes. Subjects were paid a mean of £11.01, with a
minimum of £4.00 and maximum of £17.40.12 Participants in ‘Main’ treatment sessions
were predominantly female (138, 66%) and white (150, 71%). Nevertheless, all of
the combinations of gender and race were represented. Due to the small number of
10One of the ‘2Dictator’ treatments was conducted with 12 participants due to low turnout.11East Asian nationalities were excluded from the sample as there are very few countries within the
stable democracy category and, consequently, low numbers of subjects in the pool.12In sessions that lasted more than 70 minutes (three cases) subjects were paid an extra pound for their
time.
24

2.6. Empirical analysis
Figure 2.2: Self-placement and ideological distance in ‘Main’ treatment. Left panel:Distribution of self-placements of participants on the ideological scale - 0 meaningextreme left and 10 extreme right (not observed). Right panel: Distribution of absolutedifferences in self-placements within participants-dyads.
participants that were ‘Black’, ‘Latin American’ or ‘South Asian’, we pool their races
into a non-white ‘others’ category for the empirical analysis.13
Figure 2.2 shows the distribution of ideological self-placement, as well as the dis-
tribution of distances between all pairs of participants who interacted with each other
in ‘Main’ treatment groups. Most participants are in the centre of the spectrum.14
2.6 Empirical analysis
To analyse proposal behaviour (H1 and H2) we looked at first round offers, of all par-
ticipants, to each of the other group members in the ‘Main’ treatment sample.15 Figure
2.3 shows the smallest and largest offers made by the proposer to the other two group
members. As can be expected, given other experimental results, there are very few of-
fers near the symmetric equilibrium (bin (4,0)) identified with the letters ‘NE’ on the
graph. The largest amount of offers corresponds with a three way equal split, at the
13Empirical analyses using the disaggregated race categories produce the same substantive conclu-sions, however the small number of cases does not allow a reliable estimation of effects. Results inAppendix.
14The ‘2Dictator’ treatment presents similar patterns.15This makes it easier to compare behaviour across groups. Conclusions are substantively unchanged
if we included all offers.
25

Chapter 2. Group identity and coalition formation
Figure 2.3: Distribution of offers and votes in ‘Main’ treatment. Left panel: Jointdistribution of largest and smallest offer made by the proposer to the other two groupmembers. ‘NE’ indicates the Nash Equilibrium of the Baron-Ferejohn game. Rightpanel: Share of first round offers to the group that were accepted and rejected by amajority of group members. In the ‘Main’ treatment 7.66% of proposals were rejected,slightly more than the zero theoretically predicted.
(5.60− 5.70,5.60− 5.70) intersection.16 There is also a substantial number of cases
along the diagonal, where the proposer offers equal amounts to the other two group
members, but keeps a larger portion of the pie for him/herself, and many cases of ‘min-
imal coalitions’ where one group-member is offered zero. In particular, many offers are
between (7,0) and (9,0) corresponding to a roughly equal split between proposer and
one other group member.
The unit of analysis is the dyadic offer of each proposer to one of the other two
group members (the amount kept by the proposer is excluded). Our independent vari-
ables are: ‘Same Gender’ and ‘Same Race’ dummies, indicating whether the receiver
shared the same characteristics with the proposer. We also include the distance between
the ideological self-placement of the proposer and receiver, denoted ‘Diff SP P-R’. As
control variables we add the gender, race and self-placement of the proposer, and the
similarities between the proposer and the third group member, the person excluded
from a proposer-receiver dyad: ‘Diff SP P-3rd’, ‘Same Gender P-3rd’, ‘Same Race P-
16 A proposal of £5.70, £5.70, £5.60, was the most equal possible split, as the minimum divisibilitywas in 10 pence.
26
2.6. Empirical analysis
3rd’. These latter variables account for strategic decisions made by the proposers when
they are in a majority or minority condition in the group.
M1 M2 M3 M4 M5 M6Offer Offer Offer Partner Vote Vote
Intercept 5.13∗∗∗ 5.10∗∗∗ 5.29∗∗∗ 3.30∗∗∗ 1.49∗∗∗ −3.02∗∗∗
(0.15) (0.15) (0.17) (0.53) (0.33) (0.75)Diff SP P-R −0.13∗∗ −0.16∗∗ −0.16∗∗ −0.22∗∗ −0.15∗∗ −0.04
(0.04) (0.05) (0.05) (0.07) (0.05) (0.07)Same Gender 0.10 0.16 0.16 0.29∗ −0.02 −0.30
(0.13) (0.14) (0.13) (0.15) (0.19) (0.28)Same Race −0.09 −0.14 −0.15 −0.27 0.18 0.20
(0.12) (0.13) (0.13) (0.15) (0.18) (0.19)Diff SP P-3rd 0.06∗ 0.06∗ 0.08
(0.03) (0.03) (0.04)Same Gender P-3rd −0.13 −0.12 0.01
(0.14) (0.12) (0.19)Same Race P-3rd 0.12 0.10 0.20
(0.10) (0.09) (0.22)Self-Placement −0.05∗ −0.04 −0.06 −0.08
(0.02) (0.06) (0.04) (0.08)Proposer-Male −0.01 −0.79∗∗ 0.05 −0.08
(0.11) (0.26) (0.23) (0.37)Proposer-White 0.06 −0.18 −0.25 −0.17
(0.08) (0.26) (0.17) (0.33)Amount Offered 1.00∗∗∗
(0.12)Num. obs. 3600 3600 3600 3600 1200 1200R2 0.01 0.01 0.01Adj. R2 0.01 0.01 0.01L.R. 37.06 46.69 52.92 105.40 20.60 634.57Pseudo R2 0.07 0.02 0.58∗∗∗p < 0.001, ∗∗p < 0.01, ∗p < 0.05 All models include matching-group clustered s.e.
Table 2.2: Regression models on amount offered to other participant (Offer), whethera participant was chosen as coalition partner by giving more than zero (Partner), andwhether a participant chose to accept the offer they received (Vote).
Models M1-M3 present a linear analysis on the amount offered to each group mem-
ber.17 In line with H2, the models indicate a strong negative effect of proposer-receiver
ideological distance (‘Diff SP P-R’) on how much money is offered. For every one
17The models include the offers and votes for the first negociation round, as these are comparableacross groups. Including all rounds does not change the conclusions. Results in Appendix.
27
Chapter 2. Group identity and coalition formation
Figure 2.4: Coefficients for ‘Diff SP P-R’ from regressions of type M1 run separatelywithin each of the 30 treatment matching groups.
point increase in absolute ideological distance, proposers offered, on average, 13 pence
less to a receiver, ceteris paribus. M1 shows the results without including any of the
control variables, while M2 and M3 add controls for the characteristics of the third
group member and the proposer, respectively. The strong negative effect for ideolog-
ical distance is substantively unaltered. However, M2 and M3 also indicate that the
amount offered to one group member depends on the ideological distance between the
proposer and the third player (‘Diff SP P-3rd’); when the third person is further away
the receiver is offered more, ceteris paribus.
Contrary to what we expected (H1), the coefficients for ‘Same Gender’ and ‘Same
Race’ are not statistically significant in the models. Neither are the coefficients for
racial and gender similarities between the proposer and the third group member.
The significance of effects for ideological distance in M3 are robust to using fixed
and random-effects panel estimations. Group composition is randomly assigned and all
other coalition building concerns are controlled for in the experimental design, there-
fore the treatment variables are independent of any other factors. In addition to this,
the fixed effects estimation controls for all constant individual specific characteristics
28

2.6. Empirical analysis
that could be correlated with the selection of an ideological position. Tables in the Ap-
pendix indicate these methods of estimation do not alter the conclusions. To account for
variations in the effects caused by the sample, we estimated bootstrapped coefficients
(randomized over matching groups). Once again, the negative effect of ideological dis-
tance is significant.18 We also ran analyses at the matching group level, since matching
groups are independent observations. To do this we estimated coefficients for M1 for
each matching group separately. Figure 2.4 displays the coefficients for ‘Diff SP P-R’
for each individual matching group regression. The median of these is significantly
less than zero (two-tailed Wilcoxon test, p-value 0.005). These circumstances lead us
to believe in the causal interpretation of the results.
A different way of addressing H1 and H2 is by looking at the probability of offering
more than zero to another group-member, as shown in model M4. In other words, the
probability of including the other as a coalition partner. Results are similar to the pre-
vious models. The likelihood of being a partner (i.e. being offered a non-zero amount),
decreases as the ideological distance to the proposer increases. The position of the third
group member, only significant at the 90% confidence level (p-value 0.0515), has the
same positive association as before, with higher distances to the third person increasing
the likelihood of the receiver being included in a coalition. ‘Same Gender’ appears
to be significant and positively associated with being part of the coalition, however,
this is not robust to all model specifications (see Appendix). Race is not statistically
significant.
A second aspect of the negotiation process is voting behaviour. According to our
hypothesis (H3), we expected participants that were similar to the proposer to be more
likely to vote in favour of a given offer. In contrast to proposal behaviour, we can
only evaluate the results for the proposal that was randomly selected and displayed to
the group in each round, that is, one in every three offers (hence the smaller number
of observations in the models). Fig 2.3 displays the share of first round offers to the
group that were accepted and rejected by a majority of group members. As can be seen,
18Results of robustness tests in Appendix.
29
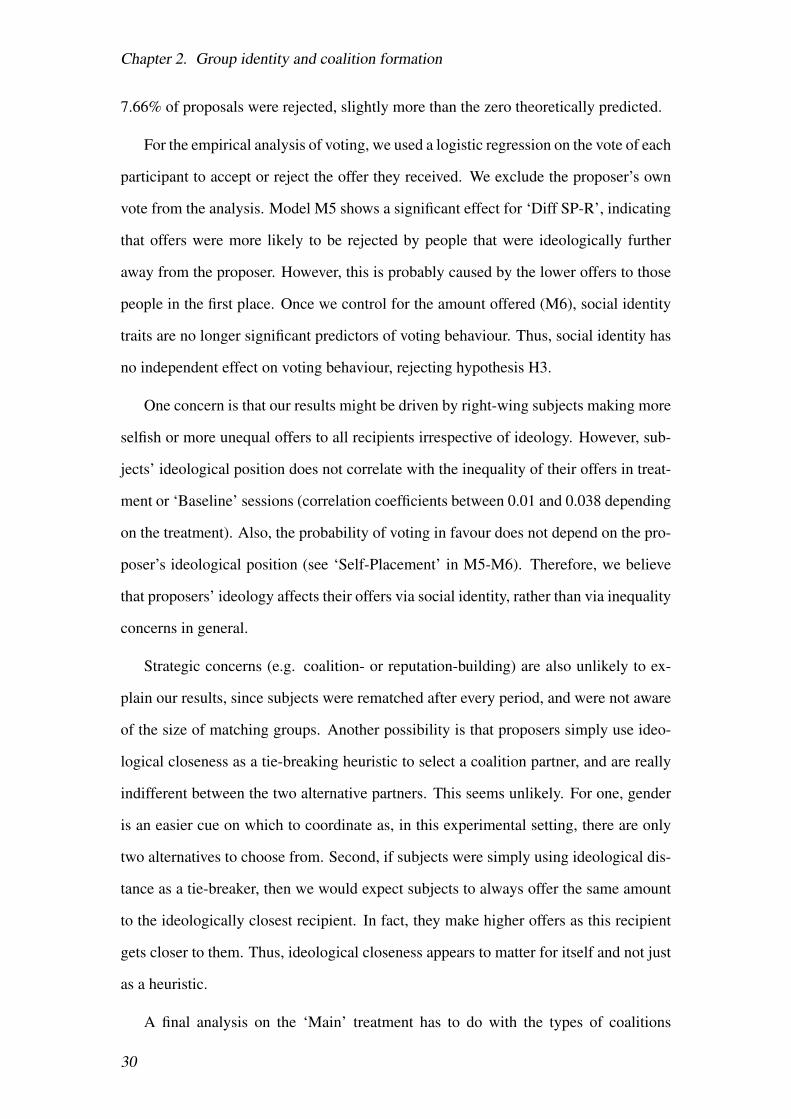
Chapter 2. Group identity and coalition formation
7.66% of proposals were rejected, slightly more than the zero theoretically predicted.
For the empirical analysis of voting, we used a logistic regression on the vote of each
participant to accept or reject the offer they received. We exclude the proposer’s own
vote from the analysis. Model M5 shows a significant effect for ‘Diff SP-R’, indicating
that offers were more likely to be rejected by people that were ideologically further
away from the proposer. However, this is probably caused by the lower offers to those
people in the first place. Once we control for the amount offered (M6), social identity
traits are no longer significant predictors of voting behaviour. Thus, social identity has
no independent effect on voting behaviour, rejecting hypothesis H3.
One concern is that our results might be driven by right-wing subjects making more
selfish or more unequal offers to all recipients irrespective of ideology. However, sub-
jects’ ideological position does not correlate with the inequality of their offers in treat-
ment or ‘Baseline’ sessions (correlation coefficients between 0.01 and 0.038 depending
on the treatment). Also, the probability of voting in favour does not depend on the pro-
poser’s ideological position (see ‘Self-Placement’ in M5-M6). Therefore, we believe
that proposers’ ideology affects their offers via social identity, rather than via inequality
concerns in general.
Strategic concerns (e.g. coalition- or reputation-building) are also unlikely to ex-
plain our results, since subjects were rematched after every period, and were not aware
of the size of matching groups. Another possibility is that proposers simply use ideo-
logical closeness as a tie-breaking heuristic to select a coalition partner, and are really
indifferent between the two alternative partners. This seems unlikely. For one, gender
is an easier cue on which to coordinate as, in this experimental setting, there are only
two alternatives to choose from. Second, if subjects were simply using ideological dis-
tance as a tie-breaker, then we would expect subjects to always offer the same amount
to the ideologically closest recipient. In fact, they make higher offers as this recipient
gets closer to them. Thus, ideological closeness appears to matter for itself and not just
as a heuristic.
A final analysis on the ‘Main’ treatment has to do with the types of coalitions
30

2.6. Empirical analysis
Treatment BaselineNumber % % Number %
Minimal-Connected 140 23.33 45.90Minimal-Disconnected 97 16.17 31.80 124 51.67Minimal-Equal 68 11.33 22.30Grand 295 49.17 – 116 48.33
Table 2.3: Types of coalitions formed in ‘Main’ treatment and ‘Baseline’ samples.
formed by those voting yes on a proposition.19 According to H4 we expected that min-
imal winning coalitions (those where two out of three group-members voted in favour)
would be ideologically connected. Contrary to conventional theory, 49% of cases were
‘Grand’ coalitions, where all three participants accepted the offer (Table 2.3). This is
reasonable considering the large number of three-way equal split offers (Figure 2.3).
Out of the minimal coalitions, 46% are ideologically ‘Connected’ and 32% ‘Discon-
nected’ (i.e. leap-frogged a member that was ideologically closer). In 22% of cases,
the two other group-members were equally distant to the proposer: these cases are not
informative, since any possible coalition would be connected. There are no more con-
nected coalitions than the 2/3 we would expect by chance. This result is probably due to
our small number of observations; the evidence from the empirical models, particularly
M4, suggests that people did try to form coalitions with the closer person.
2.6.1 Comparison of ‘Main’ treatment with ‘Baseline’ and ‘2Dic-
tator’ treatments
When we compare the results of the ‘Main’ treatment and ‘Baseline’ groups without
information we do not find any strong differences. The types of coalitions that are
formed are equivalent, with 48% of Grand coalitions and the rest Minimal. In terms of
the inequality in the accepted offers, the mean is not significantly different across the
two samples (p-value 0.126). The only significant difference is that in the ‘Baseline’
groups, members were willing to tolerate higher variance in the inequality of offers
19An alternative measure of coalitions, defined by those receiving a non-zero offer, produce substan-tively the same results.
31

Chapter 2. Group identity and coalition formation
and still vote in favour (variance test p-value 0.005). In other words, profit maximizing
offers were accepted more often in the ‘Baseline’ sample. Overall behaviour does not
vary substantially across the ‘Baseline’ and ‘Main’ treatment samples.
There is a concern among political scientists’ that democratic politics can some-
times exacerbate intergroup tension (cf. Posner 2004). The ‘2Dictator’ treatment, with
one dictator game at the beginning and another at end of the coalition-bargaining stage,
allows us to explore whether majority bargaining can increase group identity behaviour.
M7 M8 M9Offer DG-1 DG-2
Intercept 5.52∗∗∗ 4.85∗ 4.57∗∗
(0.19) (2.08) (1.49)Diff SP P-R −0.17∗∗ −0.14 −0.34
(0.06) (0.13) (0.23)Same Gender 0.00 0.01 1.53∗∗∗
(0.05) (0.19) (0.42)Diff SP P-3rd 0.11∗∗∗ −0.23 −0.31
(0.03) (0.15) (0.20)Same Gender P-3rd 0.00 0.16 1.19·
(0.07) (0.23) (0.61)Self-Placement −0.01 0.05 −0.33
(0.01) (0.31) (0.22)Proposer-Male −0.17 0.35 −0.74·
(0.11) (0.93) (0.40)Num. obs. 600 60 60R2 0.05 0.08 0.20Adj. R2 0.04 -0.02 0.11L.R. 31.15 5.26 13.72∗∗∗p < 0.001, ∗∗p < 0.01, ∗p < 0.05, ·p < 0.1
Table 2.4: Regression models on amount offered to other participant in the coalitionbargaining game (Offer), the first dictator game (DG-1) and the second dictator game(DG-2) – in ‘2Dictator’ treatment group.
Overall, participants’ behaviour in the coalition-building periods of the ‘2Dictator’
and ‘Main’ treatments are similar (figures depicting offers and votes in Appendix). Ta-
ble 2.4 shows the results for the ‘2Dictator’ treatment. Model M7 mirrors M3, but
excludes the race variables as only four people in the ‘2Dictator’ treatment were non-
white and the estimations would be unreliable (including race does not alter the con-
32
2.7. Conclusions
clusions). As can be observed, the same patterns appear, with a significant negative
effect for ideological distance on the amount being offered and a positive effect of the
distance to the third group member. Again, same gender is not a significant predictor
of offers.
Table 2.4 also shows the results for the first and second dictator games, M8 and
M9 respectively. Both are linear models on the amount given to other group members.
The unit of analysis is dyadic, where one observation is the amount given to one of
the two group-members. Again, participants’ allocations to themselves were excluded.
The logic in these decisions was different from the negotiation periods, as there was no
voting. Proposers didn’t have to give any amount away, but could choose to do so if
they wanted.
In the first dictator game (M8) social identity traits do not predict giving behaviour.
However, in the second dictator game (M9), group-identity traits significantly predicted
behaviour. Subjects gave substantively more to group members of the same gender,
significantly increasing the average payment to the receiver by £1.52 (and to the same
gender third person by £1.00) in the second dictator game. Furthermore, the ideological
distance between the proposer and receiver, indicates participants on average gave less
to group members that were ideologically further away from them. These results are not
significant at conventional levels, however, one can observe a substantive increase in the
magnitude of the effect between the first and second dictator game (from -0.14 to -0.34).
These results should be interpreted with caution as the number of observations is low
and there are only five matching groups. However, they provide suggestive evidence
that majoritarian bargaining situations can lead to increased group discrimination.
2.7 Conclusions
Coalition theories have a long history in political science. Yet, experimental research
addressing the social dynamics involved in coalition building is still relatively scarce.
In this paper we tested for the effect of social identity on the selection of coalition part-
ners. Our results show that participants systematically favour group members that are
33

Chapter 2. Group identity and coalition formation
closer to them ideologically, offering them more, and making them fewer zero offers.
Thus, social identity can create coalitions of ideologically like-minded actors, even in
the absence of a policy dimension. We suggest that this may also occur in coalition
formation outside the laboratory, either when political actors themselves have a social
identity, or when they are constrained by the social identity of their supporters.
We found no evidence for in-group bias based on race or gender. One reason could
be that social desirability reduces the effect of these variables. In some countries’ polit-
ical coalitions do form based on ethnicity (Posner 2004, Madrid 2008). This may hap-
pen in contexts where racial and/or gender discrimination is more socially acceptable.
Alternatively, ethnic coalitions may occur because in these countries, ethnic patronage
is a strategically important resource for winning elections.
In conclusion, our results show that preferences for similar coalition partners can
help predict which coalitions form, even in the absence of policy concerns. This implies
that coalition formateurs are not purely rational actors pursuing policy goals and/or the
benefits of office. Rather, they also care about the identity of their partners, preferring
others who are like themselves. Of course, ideologically connected coalitions may also
form due to similar preferences over policy.
In the context of majoritarian coalition-building, small biases can lead to large in-
tergroup differences, since a marginally less-preferred partner will be wholly excluded
from the coalition. The evidence from our ‘2Dictator’ treatment suggests that this con-
text can exacerbate group discrimination, perhaps by embittering intergroup relations.
We see this as an important topic for future research.
Another line of future research would be to test the impact of social identity in an
empirical setting. To do this it would be necessary to identify cases where politicians
differ only with respect to one relevant characteristic (e.g. gender or race), keeping
constant all other incentives that can affect coalition making decisions, such as policy
outcomes and constituency preferences. One such circumstance could be observed by
comparing voting behaviour of male and female legislators on issues that are proposed
by members of their same/different gender and testing if they express any willingness to
34
2.7. Conclusions
vote along gender lines. To isolate the effect of social identity, the observed legislators
would have to be equivalent in every aspect except for gender (same party, constituency,
political competence, etc.). One possibility would be to compare incumbents who nar-
rowly lost an internal party primary to a challenger of the opposite gender who went
on to win the seat. The issues voted on could only include laws with outcomes that
are equivalent to both genders, to avoid any interference of policy benefits in alliance
formation. To control for constituency preferences only the votes in a short period be-
fore and after the challenger gets into office could be included in the empirical analysis.
Meeting these criteria is not impossible and, given a sufficient number of cases, would
provide evidence of the generalizability of the impact of social identity on coalition
formation.
35
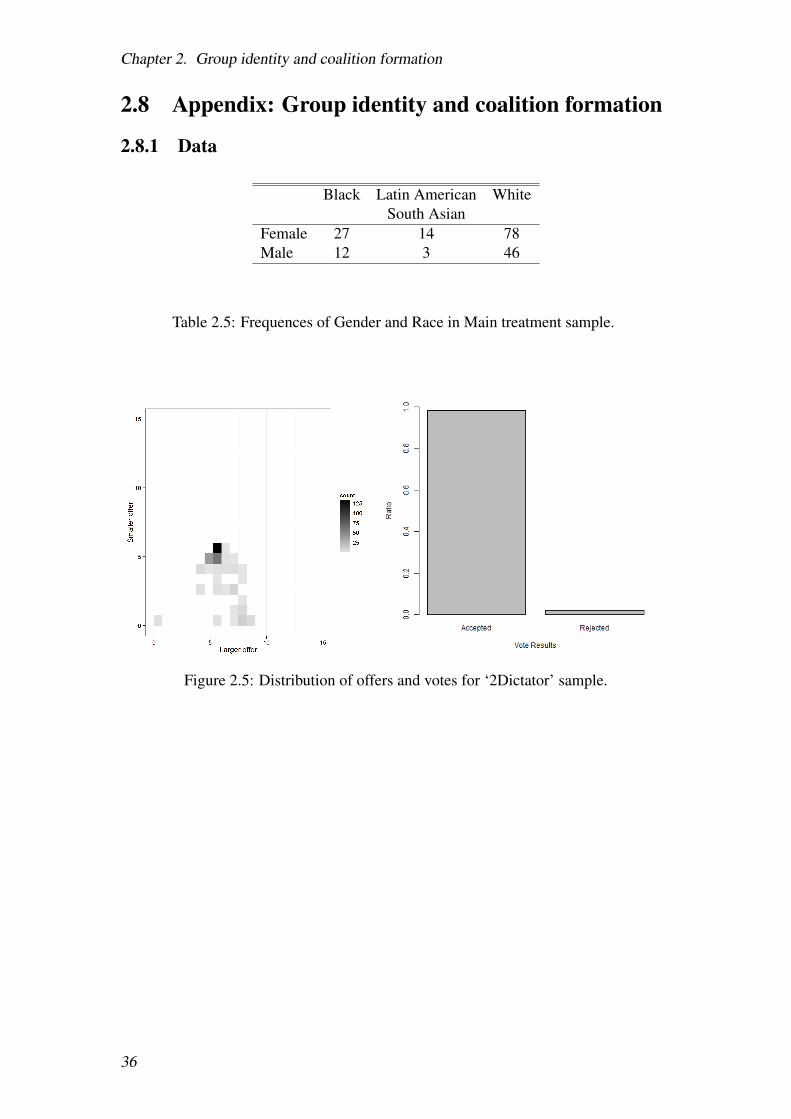
Chapter 2. Group identity and coalition formation
2.8 Appendix: Group identity and coalition formation
2.8.1 Data
Black Latin American WhiteSouth Asian
Female 27 14 78Male 12 3 46
Table 2.5: Frequences of Gender and Race in Main treatment sample.
Figure 2.5: Distribution of offers and votes for ‘2Dictator’ sample.
36

2.8. Appendix: Group identity and coalition formation
A.M1 A.M2RE FE
Intercept 5.29∗∗∗
(0.19)Diff SP P-R −0.17∗∗∗ −0.18∗∗∗
(0.04) (0.05)Same Gender 0.19 0.22
(0.12) (0.13)Same Race −0.18 −0.22
(0.13) (0.14)Diff SP P-3rd 0.06∗ 0.05∗
(0.03) (0.02)Same Gender P-3rd −0.12 −0.11
(0.08) (0.06)Same Race P-3rd 0.13 0.15∗
(0.08) (0.08)Self-Placement −0.05
(0.03)Proposer-Male 0.00
(0.11)Proposer-White 0.06
(0.12)R2 0.01 0.01Adj. R2 0.01 0.01Num. obs. 3600 3600∗∗∗p < 0.001, ∗∗p < 0.01, ∗p < 0.05
Table 2.6: Random and Fixed Effects models with Arellano-Bond s.e. on proposalbehaviour.
37

Chapter 2. Group identity and coalition formation
A.M3 A.M4 A.M5 A.M6 A.M7 A.M8Offer Offer Offer Partner Vote Vote
Intercept 5.15∗∗∗ 5.11∗∗∗ 5.44∗∗∗ 3.78∗∗∗ 1.69∗∗∗ −2.93∗∗∗
(0.15) (0.16) (0.16) (0.67) (0.35) (0.77)Diff SP P-R −0.13∗∗ −0.16∗∗ −0.15∗∗ −0.21∗∗ −0.14∗∗ −0.04
(0.04) (0.05) (0.05) (0.06) (0.05) (0.07)Same Gender 0.09 0.16 0.15 0.28 −0.02 −0.29
(0.13) (0.14) (0.13) (0.16) (0.19) (0.28)Same Race All −0.14 −0.22 −0.25 −0.32∗ 0.12 0.21
(0.12) (0.13) (0.13) (0.15) (0.21) (0.19)Diff SP P-3rd 0.07∗ 0.07∗ 0.10
(0.03) (0.03) (0.05)Same Gender P-3rd −0.14 −0.13 −0.00
(0.14) (0.12) (0.19)Same Race P-3rd All 0.17 0.12 0.17
(0.12) (0.11) (0.25)Self-Placement −0.04∗ −0.02 −0.05 −0.08
(0.02) (0.06) (0.04) (0.08)Proposer-Male −0.03 −0.86∗∗ 0.03 −0.09
(0.11) (0.28) (0.23) (0.37)Proposer-LA or SA −0.54∗ −1.33∗ −0.62 −0.23
(0.23) (0.64) (0.42) (0.65)Proposer-White −0.05 −0.68 −0.44∗ −0.26
(0.10) (0.39) (0.22) (0.33)Amount Offered 1.00∗∗∗
(0.12)Num. obs. 3600 3600 3600 3600 1200 1200R2 0.01 0.01 0.02Adj. R2 0.01 0.01 0.02L.R. 39.14 50.40 70.49 135.36 26.51 635.21Pseudo R2 0.08 0.03 0.58∗∗∗p < 0.001, ∗∗p < 0.01, ∗p < 0.05 All models include matching-group clustered s.e.
Table 2.7: Statistical models on proposal and voting behavior using a disaggregatedrace category.
38
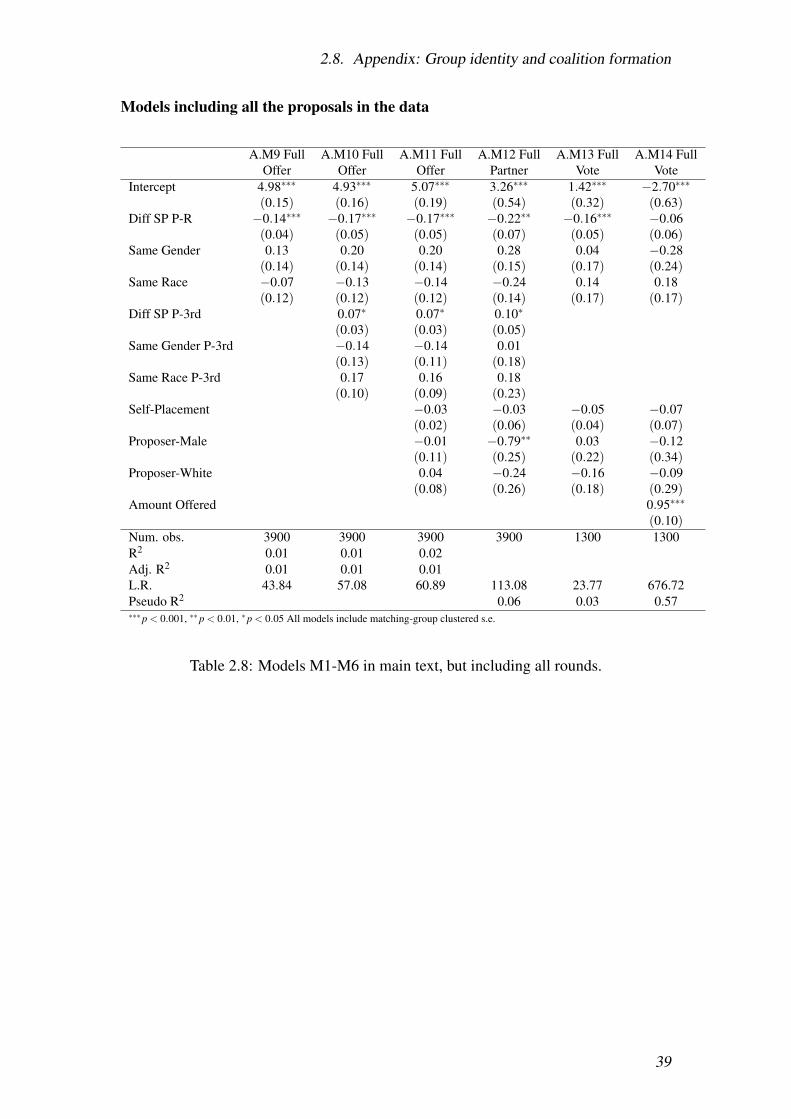
2.8. Appendix: Group identity and coalition formation
Models including all the proposals in the data
A.M9 Full A.M10 Full A.M11 Full A.M12 Full A.M13 Full A.M14 FullOffer Offer Offer Partner Vote Vote
Intercept 4.98∗∗∗ 4.93∗∗∗ 5.07∗∗∗ 3.26∗∗∗ 1.42∗∗∗ −2.70∗∗∗
(0.15) (0.16) (0.19) (0.54) (0.32) (0.63)Diff SP P-R −0.14∗∗∗ −0.17∗∗∗ −0.17∗∗∗ −0.22∗∗ −0.16∗∗∗ −0.06
(0.04) (0.05) (0.05) (0.07) (0.05) (0.06)Same Gender 0.13 0.20 0.20 0.28 0.04 −0.28
(0.14) (0.14) (0.14) (0.15) (0.17) (0.24)Same Race −0.07 −0.13 −0.14 −0.24 0.14 0.18
(0.12) (0.12) (0.12) (0.14) (0.17) (0.17)Diff SP P-3rd 0.07∗ 0.07∗ 0.10∗
(0.03) (0.03) (0.05)Same Gender P-3rd −0.14 −0.14 0.01
(0.13) (0.11) (0.18)Same Race P-3rd 0.17 0.16 0.18
(0.10) (0.09) (0.23)Self-Placement −0.03 −0.03 −0.05 −0.07
(0.02) (0.06) (0.04) (0.07)Proposer-Male −0.01 −0.79∗∗ 0.03 −0.12
(0.11) (0.25) (0.22) (0.34)Proposer-White 0.04 −0.24 −0.16 −0.09
(0.08) (0.26) (0.18) (0.29)Amount Offered 0.95∗∗∗
(0.10)Num. obs. 3900 3900 3900 3900 1300 1300R2 0.01 0.01 0.02Adj. R2 0.01 0.01 0.01L.R. 43.84 57.08 60.89 113.08 23.77 676.72Pseudo R2 0.06 0.03 0.57∗∗∗p < 0.001, ∗∗p < 0.01, ∗p < 0.05 All models include matching-group clustered s.e.
Table 2.8: Models M1-M6 in main text, but including all rounds.
39

Chapter 2. Group identity and coalition formation
Bootstrapped coefficients proposal behaviour, model M3
Figure 2.6: M3 Bootstrapped coefficients of ‘Diff SP P-R’ for 10,000 iterations, redlines at ±1.96 sd from the mean.
Figure 2.7: M3 Bootstrapped coefficients of ‘Diff SP P-3rd’ for 10,000 iterations, redlines at ±1.96 sd from the mean.
40

2.8. Appendix: Group identity and coalition formation
Bootstrapped coefficients partner selection, model M4
Figure 2.8: M4 Bootstrapped coefficients of ‘Diff SP P-R’ for 10,000 iterations, redlines at ±1.96 sd from the mean.
Figure 2.9: M4 Bootstrapped coefficients of ‘Diff SP P-3rd’ for 10,000 iterations, redlines at ±1.96 sd from the mean.
41

Chapter 2. Group identity and coalition formation
Figure 2.10: M4 Bootstrapped coefficients of ‘Same Gender’ for 10,000 iterations, redlines at ±1.96 sd from the mean.
Matching group level statistics
Figure 2.11: Coefficients for ‘Same Gender’ in matching group level regressions ofmodel M1.
42

2.8. Appendix: Group identity and coalition formation
Figure 2.12: Coefficients for ‘Same Race’ in matching group level regressions of modelM1.
43
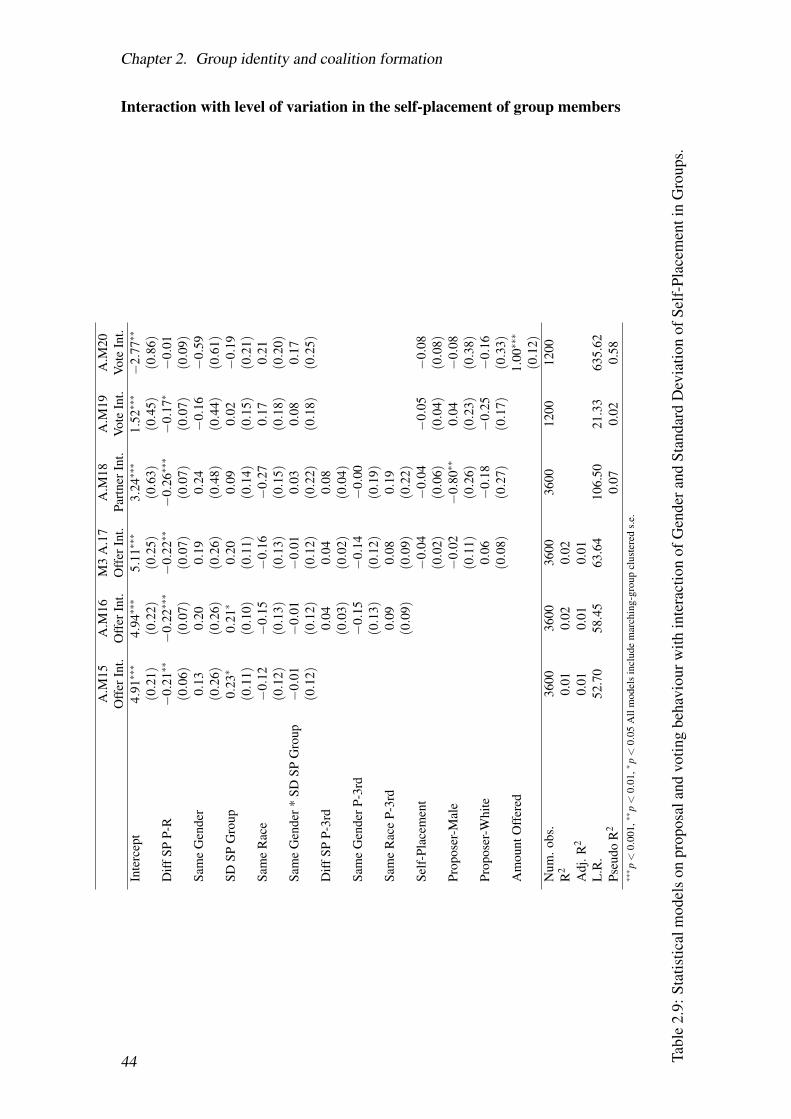
Chapter 2. Group identity and coalition formation
Interaction with level of variation in the self-placement of group membersA
.M15
A.M
16M
3A
.17
A.M
18A
.M19
A.M
20O
ffer
Int.
Off
erIn
t.O
ffer
Int.
Part
nerI
nt.
Vote
Int.
Vote
Int.
Inte
rcep
t4.
91∗∗∗
4.94∗∗∗
5.11∗∗∗
3.24∗∗∗
1.52∗∗∗−
2.77∗∗
(0.2
1)(0.2
2)(0.2
5)(0.6
3)(0.4
5)(0.8
6)D
iffSP
P-R
−0.
21∗∗
−0.
22∗∗∗−
0.22∗∗
−0.
26∗∗∗
−0.
17∗
−0.
01(0.0
6)(0.0
7)(0.0
7)(0.0
7)(0.0
7)(0.0
9)Sa
me
Gen
der
0.13
0.20
0.19
0.24
−0.
16−
0.59
(0.2
6)(0.2
6)(0.2
6)(0.4
8)(0.4
4)(0.6
1)SD
SPG
roup
0.23∗
0.21∗
0.20
0.09
0.02
−0.
19(0.1
1)(0.1
0)(0.1
1)(0.1
4)(0.1
5)(0.2
1)Sa
me
Rac
e−
0.12
−0.
15−
0.16
−0.
270.
170.
21(0.1
2)(0.1
3)(0.1
3)(0.1
5)(0.1
8)(0.2
0)Sa
me
Gen
der*
SDSP
Gro
up−
0.01
−0.
01−
0.01
0.03
0.08
0.17
(0.1
2)(0.1
2)(0.1
2)(0.2
2)(0.1
8)(0.2
5)D
iffSP
P-3r
d0.
040.
040.
08(0.0
3)(0.0
2)(0.0
4)Sa
me
Gen
derP
-3rd
−0.
15−
0.14
−0.
00(0.1
3)(0.1
2)(0.1
9)Sa
me
Rac
eP-
3rd
0.09
0.08
0.19
(0.0
9)(0.0
9)(0.2
2)Se
lf-P
lace
men
t−
0.04
−0.
04−
0.05
−0.
08(0.0
2)(0.0
6)(0.0
4)(0.0
8)Pr
opos
er-M
ale
−0.
02−
0.80∗∗
0.04
−0.
08(0.1
1)(0.2
6)(0.2
3)(0.3
8)Pr
opos
er-W
hite
0.06
−0.
18−
0.25
−0.
16(0.0
8)(0.2
7)(0.1
7)(0.3
3)A
mou
ntO
ffer
ed1.
00∗∗∗
(0.1
2)N
um.o
bs.
3600
3600
3600
3600
1200
1200
R2
0.01
0.02
0.02
Adj
.R2
0.01
0.01
0.01
L.R
.52
.70
58.4
563
.64
106.
5021
.33
635.
62Ps
eudo
R2
0.07
0.02
0.58
∗∗∗
p<
0.00
1,∗∗
p<
0.01
,∗p<
0.05
All
mod
els
incl
ude
mar
chin
g-gr
oup
clus
tere
ds.
e.
Tabl
e2.
9:St
atis
tical
mod
els
onpr
opos
alan
dvo
ting
beha
viou
rwith
inte
ract
ion
ofG
ende
rand
Stan
dard
Dev
iatio
nof
Self
-Pla
cem
enti
nG
roup
s.
44
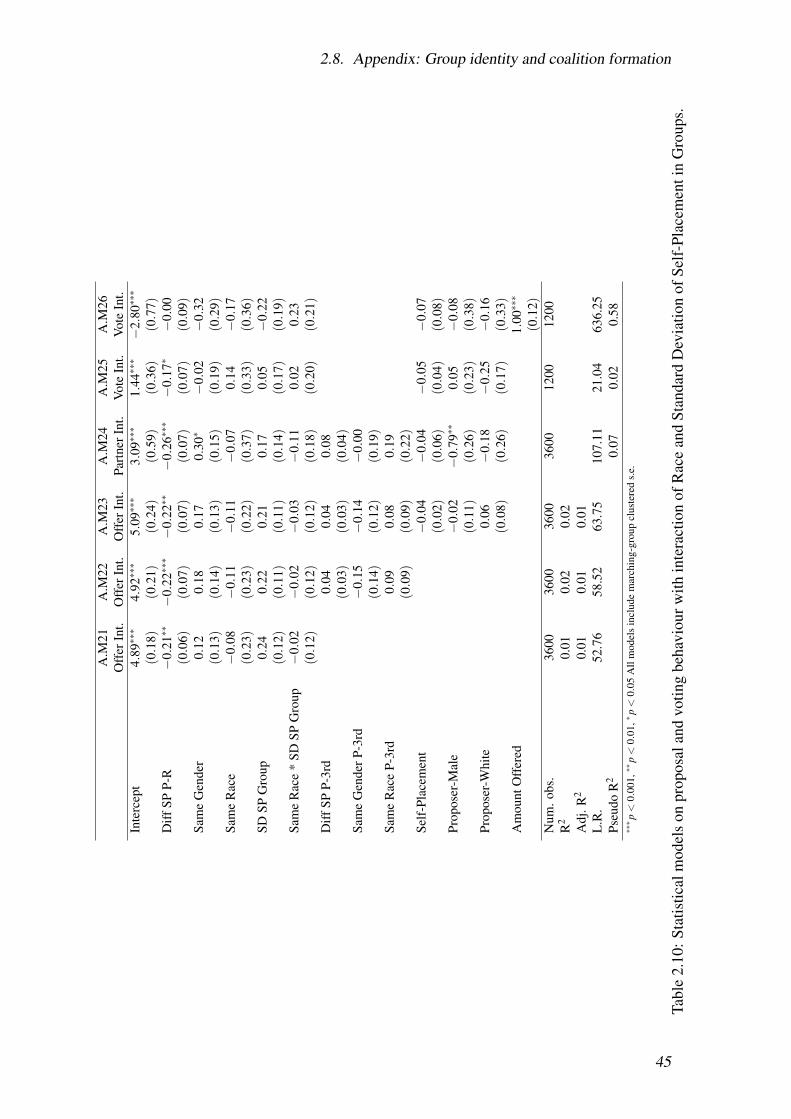
2.8. Appendix: Group identity and coalition formation
A.M
21A
.M22
A.M
23A
.M24
A.M
25A
.M26
Off
erIn
t.O
ffer
Int.
Off
erIn
t.Pa
rtne
rInt
.Vo
teIn
t.Vo
teIn
t.In
terc
ept
4.89∗∗∗
4.92∗∗∗
5.09∗∗∗
3.09∗∗∗
1.44∗∗∗−
2.80∗∗∗
(0.1
8)(0.2
1)(0.2
4)(0.5
9)(0.3
6)(0.7
7)D
iffSP
P-R
−0.
21∗∗
−0.
22∗∗∗−
0.22∗∗
−0.
26∗∗∗
−0.
17∗
−0.
00(0.0
6)(0.0
7)(0.0
7)(0.0
7)(0.0
7)(0.0
9)Sa
me
Gen
der
0.12
0.18
0.17
0.30∗
−0.
02−
0.32
(0.1
3)(0.1
4)(0.1
3)(0.1
5)(0.1
9)(0.2
9)Sa
me
Rac
e−
0.08
−0.
11−
0.11
−0.
070.
14−
0.17
(0.2
3)(0.2
3)(0.2
2)(0.3
7)(0.3
3)(0.3
6)SD
SPG
roup
0.24
0.22
0.21
0.17
0.05
−0.
22(0.1
2)(0.1
1)(0.1
1)(0.1
4)(0.1
7)(0.1
9)Sa
me
Rac
e*
SDSP
Gro
up−
0.02
−0.
02−
0.03
−0.
110.
020.
23(0.1
2)(0.1
2)(0.1
2)(0.1
8)(0.2
0)(0.2
1)D
iffSP
P-3r
d0.
040.
040.
08(0.0
3)(0.0
3)(0.0
4)Sa
me
Gen
derP
-3rd
−0.
15−
0.14
−0.
00(0.1
4)(0.1
2)(0.1
9)Sa
me
Rac
eP-
3rd
0.09
0.08
0.19
(0.0
9)(0.0
9)(0.2
2)Se
lf-P
lace
men
t−
0.04
−0.
04−
0.05
−0.
07(0.0
2)(0.0
6)(0.0
4)(0.0
8)Pr
opos
er-M
ale
−0.
02−
0.79∗∗
0.05
−0.
08(0.1
1)(0.2
6)(0.2
3)(0.3
8)Pr
opos
er-W
hite
0.06
−0.
18−
0.25
−0.
16(0.0
8)(0.2
6)(0.1
7)(0.3
3)A
mou
ntO
ffer
ed1.
00∗∗∗
(0.1
2)N
um.o
bs.
3600
3600
3600
3600
1200
1200
R2
0.01
0.02
0.02
Adj
.R2
0.01
0.01
0.01
L.R
.52
.76
58.5
263
.75
107.
1121
.04
636.
25Ps
eudo
R2
0.07
0.02
0.58
∗∗∗
p<
0.00
1,∗∗
p<
0.01
,∗p<
0.05
All
mod
els
incl
ude
mar
chin
g-gr
oup
clus
tere
ds.
e.
Tabl
e2.
10:S
tatis
tical
mod
els
onpr
opos
alan
dvo
ting
beha
viou
rwith
inte
ract
ion
ofR
ace
and
Stan
dard
Dev
iatio
nof
Self
-Pla
cem
enti
nG
roup
s.
45

Chapter 2. Group identity and coalition formation
2.8.2 Experiment materials
Figure 2.13: Screen shot of treatment sessions.
46
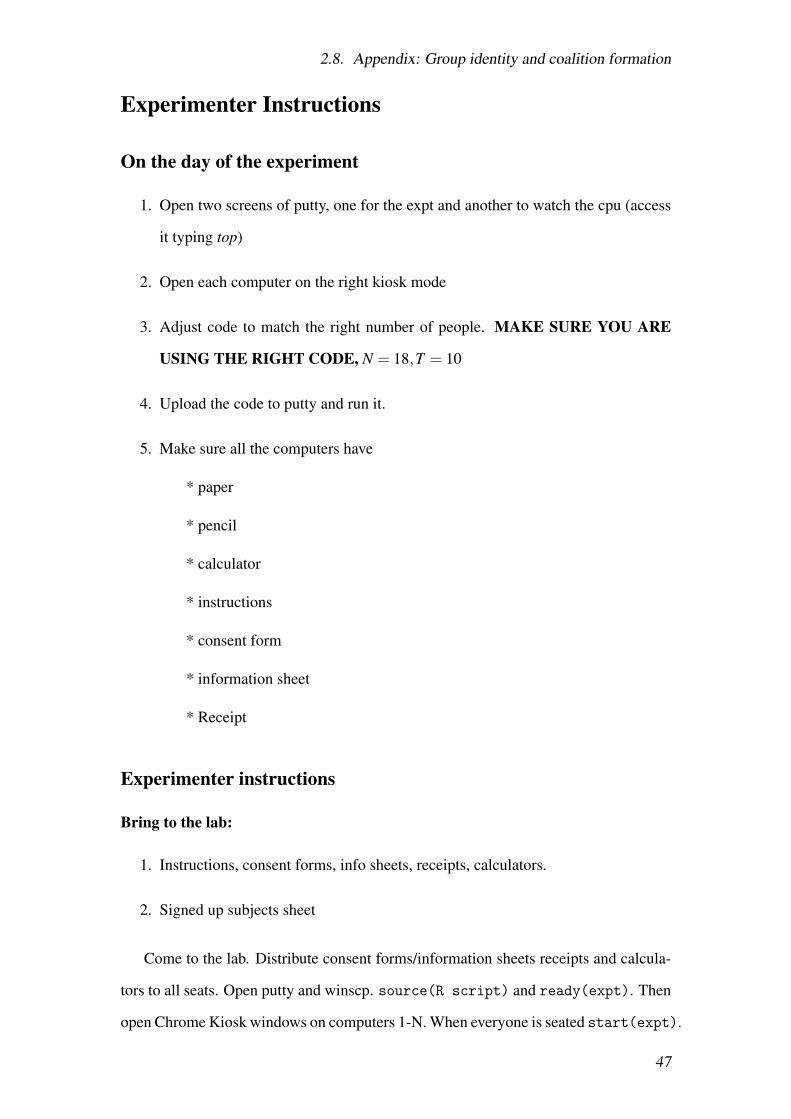
2.8. Appendix: Group identity and coalition formation
Experimenter Instructions
On the day of the experiment
1. Open two screens of putty, one for the expt and another to watch the cpu (access
it typing top)
2. Open each computer on the right kiosk mode
3. Adjust code to match the right number of people. MAKE SURE YOU ARE
USING THE RIGHT CODE, N = 18,T = 10
4. Upload the code to putty and run it.
5. Make sure all the computers have
* paper
* pencil
* calculator
* instructions
* consent form
* information sheet
* Receipt
Experimenter instructions
Bring to the lab:
1. Instructions, consent forms, info sheets, receipts, calculators.
2. Signed up subjects sheet
Come to the lab. Distribute consent forms/information sheets receipts and calcula-
tors to all seats. Open putty and winscp. source(R script) and ready(expt). Then
open Chrome Kiosk windows on computers 1-N. When everyone is seated start(expt).
47
Chapter 2. Group identity and coalition formation
At experiment time
At the door ask “Has everyone got university ID or another form of ID?” Those who
haven’t will only be used if we have insufficient of those who have; warn them, in future
bring ID.
Randomize over subjects using the lab tokens (Sara knows where these are). Sur-
plus subjects given £2.50 and sent off.
You need 18 participants. (The can only run using 18 participants, on the Factor
Analysis won’t work and matching groups are of size 6). Only use the chrome kiosk
pages for the 18 people
If you get number 1-18, come in and sit quietly at that desk. Please do not talk or
communicate with other participants while you are in the room. Keep mobile phones
and other communication devices silent, and do not use them while in the room. If you
get a 13 or higher, wait outside.
Subjects 1-18 come in with ID checked at the door.
When everyone is seated, say
“Welcome to this experimental session.
Your behaviour in this experiment will be confidential. Data is collected based
on your computer number, which was assigned randomly. Personally identifying in-
formation about you will never be linked to this computer number. At the end of the
experiment, you will be paid privately, so that no other participants will know how
much you have earned.
You may have heard about experiments in which participants were deceived. Exper-
iments in ESSEXLab never involve deception by the experimenters. That is, everything
the experimenter tells you, and all on-screen instructions, are true and accurate. If you
have any questions about this, please email [email protected].
Fire exits are here and here [point them out]. Is there anyone who will have diffi-
culty exiting the lab in an emergency? If so, please put your hand up.” [If so, ask if
they have a Personal Emergency Plan; if they do not, use your judgement as to whether
48
2.8. Appendix: Group identity and coalition formation
it is safe for them.]
“On your desk there is a consent form for this experiment, as well as an information
sheet. There is also a receipt. At the end of the experiment you will be asked to fill
it out with the amount you have won, and return it with the signed consent form to
the experimenter. You may keep the information sheet if you wish. Lastly there are
experiment instructions and a number of blank papers for you to take notes on during
the experiment.
I will now read out experiment instructions. At the end you will have an opportunity
to ask questions. If at any time you have a question or a problem with your computer,
please put your hand up, and an experimenter will help you privately.”
Start the corresponding treatment on putty using start(expt). The participants
will see the instructions screen.
Read the instructions
When you finish reading the instructions, “Once you finish reading the instructions
please press the ‘Continue’ button to start the experiment”
When the experiment is over:
“Please sign and date your receipts with the amount shown on your screen, and then
click “Payment” on screen to show that you have done so.”
While this is happening prepare payment envelopes.
“The experiment is now over. I will come round to each of you in turn with your
payment in an envelope. Check that you have received the correct payment. Note that
amounts have been rounded to the nearest 10 pence. Please hand over your receipt and
consent form when I do so. After you have received payment, please quietly leave the
laboratory.”
“Please check the amount and if it’s wrong, raise your hand.”
Go round swapping envelopes for receipts. To each individual:
Email the results to me and store them safely somewhere, then delete them from the
server.
49

Chapter 2. Group identity and coalition formation
Instructions
Welcome to the experiment.
During this experiment, please follow the instructions of the experimenters at all
times. Please do not communicate with any other participants or anyone outside the
lab, either directly or via mobile devices. If you do not follow these rules, you may be
removed from the experiment without payment and you may not be allowed to partici-
pate in future experiments.
Please switch off your mobile phones and other electronic devices.
Once you have finished reading the instructions, please sign the consent form on
your desk.
Experiment
The experiment starts with a short survey on general demographics and your views
about some political topics. All the data that you enter are completely anonymous and
no personal information will be recorded.
Later on, you will take part in a series of group decision-making periods in which
each of you will propose how to divide £17.00 amongst the members of your group.
Participants will be randomly allocated to groups of 3 by the computer. You will com-
plete 10 periods and in each period you will be rematched into a different group. All of
the interaction with your group will be conducted via your computer.
Each period will happen as follows:
1. In the Proposal Stage you will make an offer to each participant in your group.
You can offer any quantity, by increments of 10 pence, to each player. The offers
must add up to a ‘pie’ of £17.00.
2. Once all offers have been made, the computer will choose one of the proposals
randomly and present it to all of the group members. If you accept the offer, then
press the ‘Accept’ button. If you do not want to accept the offer, then reject it by
50

2.8. Appendix: Group identity and coalition formation
pressing the ‘Reject’ button.
3. If more than half of the group members ‘Accept’ the offer it will be approved
and each group member will be allocated that amount for the current period. If
more than half of the group members ‘Reject’ the offer, it will be rejected by
the group and all group members will be asked to propose a new division of the
‘pie’, but this time you will only have £11.90 to divide. Again, one proposal will
be chosen randomly and presented to all group members. If the new proposal is
rejected you will repeat the process, but the ‘pie’ will again be reduced, this time
to £8.30. Each of these steps is called a ‘round’ and you can play up to 5 rounds
per period, but in each round the ‘pie’ will get smaller. If the proposal is rejected
in the fifth round, all group members will be allocated £0.00 for that period and
you will all pass on to a new negotiation with a new group.
4. When you finish the 10 periods, you will be asked to complete a final decision
making process. This time you will have to divide £3.00 amongst three group
members and, in this section, whatever you allocate to each person is what they
will get. In this section there will be no voting.
5. At the end of the experiment we will ask you to fill in a few questions regarding
your experience in the lab. Once again, all the data that you enter are completely
anonymous and no personal information will be recorded. After you finish the
survey, a screen will appear indicating which period was chosen for payment and
how much you will be paid.
Payment
In this experiment you will be paid according to the decisions that you have made.
One of the ten negotiation periods will be chosen at random, and each will have a
1/10 chance of being chosen. You will also be paid for the decisions you make in the
‘decision’ section and a £2.50 show-up fee. At the end of the experiment you will be
51

Chapter 2. Group identity and coalition formation
informed of how much you have earned in each section and your total payment.
Treatment Information - Provided after the survey
The information you have provided has been used to allocate each participant one of
the following avatars.
There are only 6 avatars, so more than one participant will be allocated the same
image, based on the race and gender each person stated in the survey.
The survey data has also been used to calculate a score that places each participant
and their political views on the left right political spectrum.
52

2.8. Appendix: Group identity and coalition formation
Bargaining Experiment Survey
Survey Questions
Please answer the following questions. As indicated in the instructions, personal
data will not be disclosed and all information you provide is anonymous.
• What year were you born? Year
• What gender do you identify with?
Male
Female
• What is your nationality? Country (Drop-down menu with all countries
accepted in the sample plus and ‘other’ option)
• What race to you identify with? If you are mixed race, please state the one you
feel closest to.
White Caucasian
Black
Latin American
South Asian
• Are you a student at the University of Essex?
Yes
No
• If Yes, are you an undergraduate or graduate student?
Undergraduate
53

Chapter 2. Group identity and coalition formation
Graduate
Does not apply
• If you are a student, in what academic year did you start your course/degree?
Academic Years (Drop-down menu with a list of academic years)
• If you are a student, what is the name of your course/degree?
Empty for participants to fill in
———- Next Screen ———-
Survey Questions Continued
Could you please state how strongly you agree or disagree with the following
statements
• There is one law for the rich and one law for the poor.
Strongly Disagree Disagree
• There is no need for strong trade unions to protect employees’ working conditions
and wages.
Strongly Disagree Disagree
• Major public services and industries ought to be in state ownership.
54

2.8. Appendix: Group identity and coalition formation
Strongly Disagree Disagree
• Ordinary people get their fair share of the nation’s wealth.
Strongly Disagree Disagree
• Government should reduce the taxes paid by higher-income citizens.
Strongly Disagree Disagree
• Same sex couples should enjoy the same rights as heterosexual couples to marry.
Strongly Disagree Disagree
• Women should be free to decide on matters of abortion.
Strongly Disagree Disagree
• The government should try to reduce the income differences between rich and
poor citizens.
Strongly Disagree Disagree
• The UK should be allowed to set quotas on the number of EU immigrants enter-
ing the country.
Strongly Disagree Disagree
• Free market competition makes the health care system function better.
55
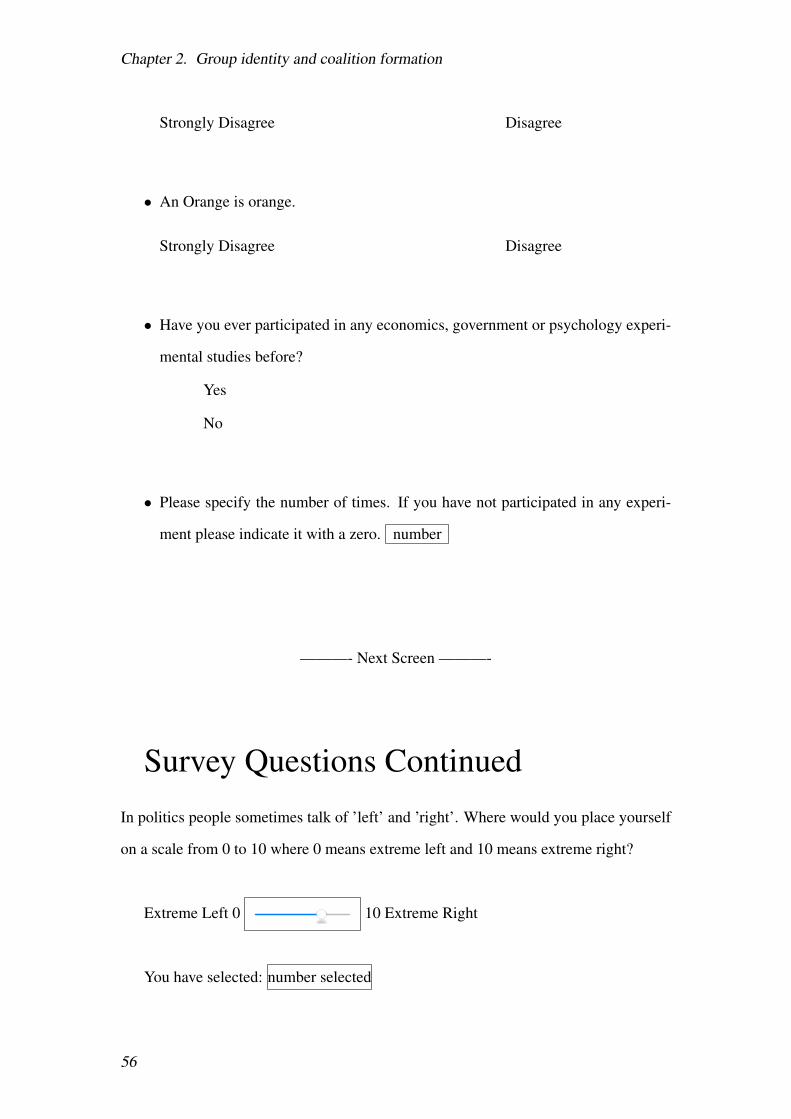
Chapter 2. Group identity and coalition formation
Strongly Disagree Disagree
• An Orange is orange.
Strongly Disagree Disagree
• Have you ever participated in any economics, government or psychology experi-
mental studies before?
Yes
No
• Please specify the number of times. If you have not participated in any experi-
ment please indicate it with a zero. number
———- Next Screen ———-
Survey Questions Continued
In politics people sometimes talk of ’left’ and ’right’. Where would you place yourself
on a scale from 0 to 10 where 0 means extreme left and 10 means extreme right?
Extreme Left 0 10 Extreme Right
You have selected: number selected
56
2.8. Appendix: Group identity and coalition formation
——- At the End of the Experiment ———-
Please take a few minutes and to answer the following questions
• From your experience, what did you think the experiment was about?
Empty for participants to fill in
• What was your overall impression of the experiment?
Empty for participants to fill in
57
Chapter 2. Group identity and coalition formation
2.8.3 Countries of origin
The sample was restricted to participants who were in the [omitted for anonymity]
subject pool and stated their country of origin as one of the following 42: Albania,
Argentina, Australia, Austria, Belgium, Botswana, Bulgaria, Canada, Chile, Costa
Rica, Croatia, Cyprus, Czech Republic, Denmark, Estonia, Finland, France, Germany,
Greece, Hungary, Ireland, Italy, Jamaica, Latvia, Lithuania, Luxembourg, Macedonia,
Mauritius, Montenegro, Netherlands, New Zealand, Norway, Poland, Portugal, Slo-
vak Republic, Slovenia, Spain, Sweden, Switzerland, United Kingdom, United States,
Uruguay. Checks were included in the experiment and only two participants in treat-
ment sessions indicate they came from a country that was not in this original list.
58
Chapter 3
Party financing and the entrance of
new-party candidates
59
Chapter 3. Party financing and new-party candidates
Abstract
The literature on party finance regulations has increasingly found evidence of its impact
on the structure and characteristics of the party system. This paper extends the liter-
ature by disaggregating the effect of different types and timing of funding (campaign
vs on-going), and their allocation mechanisms, on the number of new-party candidates
that compete in presidential elections. The paper argues that subsidies for campaigns
based on past electoral results create a barrier to the entrance of candidates sponsored
by new political parties. However, this effect can be counteracted by the potential to ac-
cess post-election benefits in the form of on-going party funding. The empirical results
provide evidence in favour of these arguments and are robust to a wide range of model
specifications and definitions of new-party candidates. Substantively, the findings indi-
cate that the design of party funding regulations can have significant consequences for
the stability of the party system.
Keywords— New Parties, Latin America, Party Finance, Presidential Candidates
60

3.1. Introduction
3.1 Introduction
A substantial number of candidates in Latin America now compete using a new-party
logo. These ‘new-party presidential candidates’ include a wide range of political ac-
tors, starting from a standard bearer of a small issue party, to strong ‘outsiders’ that
compete for the presidency (cf. Barr 2009, Carreras 2012, Kenney 1998). Among note-
worthy examples are presidents Rafael Correa and Lucio Gutiérrez in Ecuador, Alberto
Fujimori in Peru and Hugo Chávez in Venezuela.
There are multiple reasons for a new party to enter by sponsoring a presidential
candidate. This paper tests the hypotheses that one of those reasons are the incentives
introduced by regulations regarding the public finance of political parties. Campaign-
period subsidies (allocated based on past electoral results), are argued to increase the
relative costs of the campaign, creating a potential barrier to entry and that could re-
duce the number of new-party candidates in presidential elections. On the other hand,
performance based subsidies for inter-election (i.e. on-going) party activities are hy-
pothesised to have the opposite effect. As subsidies for on-going activities are obtained
as a consequence of a successful campaign, when these funds are available new parties
would have incentives to run the most competitive elections possible (assuming that
more funds are always preferable). An efficient way of doing this is by running a pres-
idential candidate and using his or her visibility to improve the party’s overall results
(see Ferejohn and Calvert 1984, Golder 2006, West and Spoon 2015, among others).
To test this argument the study uses a time-series cross-section Poisson estimation
on the number of new-party candidates participating in 113 democratic presidential
elections in 18 Latin American countries between 1978 and 2013. The paper focuses
on the incentives introduced by the different allocation mechanisms for monetary and
media subsidies for campaigns, as well as post-election funding for on-going party
activities. The empirical results corroborate the hypotheses, suggesting a strong impact
of public funding on the number of new-party candidates that enter. These findings
are robust to the inclusion of a standard battery of covariates, different methods of
estimation, varying definitions of the dependent variable and concerns of endogeneity.
61

Chapter 3. Party financing and new-party candidates
This study contributes to the literature on party financing and its effects on the
party system by differentiating between consequences produced by resources allocated
to campaigns from those destined for on-going party activities. Until now, the liter-
ature has focused on aggregate effects, only distinguishing between the presence (or
absence) of some type of funding, without distinguishing between when and how these
resources are allocated (Hug 2001, Hooghe et al. 2006, Scarrow 2007, Tavits 2006,
2008a, among others).1 The results in this research highlight the impact of different
types of campaign funding on the stability of the party system and the trade-offs policy
makers face when choosing an institutional design. On the one hand, equal funding for
campaigns and funding for on-going party activities can help increase representation
by creating conditions for new parties to enter. On the other, they can add instability
and reduce governance, by enabling a constant stream of new parties into the system.
This latter aspect is especially important as too many parties can limit policy making
capabilities of the party system in general, potentially rendering ineffective the increase
in representation by reducing each party’s power to influence policy (cf. Sartori 1976,
Lijphart 1984, Powell 1982).
Whether it is preferable to introduce barriers to entry (e.g. through past-performance
based campaign funding) or to encourage a more dynamic party system (through on-
going funding) is a decision each country has to make based on its unique circum-
stances. What is important is that these effects are considered when the policies are
designed. Up to now, this does not appear to be the case in Latin America, where party
funding has been mainly introduced to address the issue of private money in politics
(Zovatto and Orozco 2008, Zovatto 2008, Potter and Tavits 2013)
This research also contributes to the expansion of data on new political parties to
developing countries with presidential systems which, to my knowledge, has not been
previously coded. Following Hug (2001, p.172) the present research adapts the coding
1One exception to this is the research conducted by Potter and Tavits (2013), who measure the effectof fund parity and identify that the more unequal the funding (between small and large parties) the lowerthe effective number of parties in the system.Potter and Tavits (2013), describe fund parity as the level of(in)equality in the distribution of public funds between political parties in the system (large, small, oldand new) (see also Scarrow 2006, Hogan 2001, Hooghe et al. 2006).
62
3.2. New-party candidates
criteria used for new legislative parties in parliamentary system to account for the pre-
dominance of the chief executive in presidential systems. In doing so, the study creates
a comparable dataset on new party entry, and generates opportunities to test the gener-
alizability of theories on new parties in a broader institutional, economic and cultural
setting. As a complement, the study also codes the first longitudinal dataset (1978-
2013) on party finance regulations for Latin America. This data can be used for various
research agendas, including comparative studies on the effects of money in politics. All
the data will be made publicly available upon publication.
The next two sections provide a definition of new-party candidates and the incen-
tives produced by party finance laws. These are followed by an operationalisation of
the variables of interest and the model specifications. The final two sections present
results and conclusions.
3.2 New-party candidates
The appearance of new political parties and their leaders is studied from a wide range of
perspectives in Latin America, including ‘populism’ or ‘neopopulism’ (Roberts 2006,
2007, Seligson 2007, Weyland 2001, 2003) and ‘insiders’ vs. ‘outsiders’ with respect
to the party system (Barr 2009, Corrales 2008, Carreras 2012, Kenney 1998). These
studies are insightful and contribute to the empirical models and theory used in this
paper. However, operationalising these definitions for large cross-national studies can
be complicated and unintentionally biased by the (un)availability of data. An alternative
is to look at the emergence of relevant new political actors from the perspective of the
literature on the entry and success of new parties (cf. Harmel and Robertson 1985, Hug
2001, Mustillo 2009, Tavits 2008a,b, 2006).
The ‘new party’ approach characterizes political parties (and, consequently, their
candidates) as ‘new’ on the basis of when they enter the electoral arena and how they
were formed. A ‘new party’ is defined as one that presents candidates to the general
election for the first time and a) has no previous affiliation to other existing parties, or
b) is the result of a split or fission from an existing party (Sjöblom 1968, Hug 2001,
63

Chapter 3. Party financing and new-party candidates
Mustillo 2009, Tavits 2008a). With this definition, new parties add an actor to the
electoral competition, altering the dynamics of the election. Other possible categories,
such as alliances and mergers, are not counted as new parties, as they maintain their
party structures and political histories without adding a new player to the competition.
3.3 Party finance and the decision to enter
From a rational choice perspective, one can expect new-party presidential candidates to
emerge when the probability of obtaining benefits outweighs the costs of running (see
Feddersen et al. 1990, Osborne and Slivinski 1996, Cox 1997, Tavits 2006). Among the
potential benefits of competing is, obviously, the possibility of winning the presidency.
But there can also be long term benefits such as contributing to the consolidation of their
political party, getting an issue on the political agenda, or establishing the credibility
of their party as a contender (Cox 1997, West and Spoon 2013). While these different
benefits are not observationally identifiable, all require the party to survive the election.
In terms of costs, new parties and their candidates face important obstacles to entry.
In order to compete they must incur the organizational and economic costs of legally
registering the political party, as well as the costs of the campaign itself. Furthermore,
new parties have lower levels of grass-roots or long-term supporters than existing par-
ties, giving their presidential candidates less access to volunteers and making them
more dependent on subsidies and monetary resources.
A review of the party finance laws in Latin America shows that countries in the sam-
ple have either relied exclusively on private funding for political parties, or have mixed
sources of funding, with the state providing some subsidies. Overall, the main sources
of public funding include monetary and television subsidies for political campaigns
and/or funding for inter-election ‘on-going’ party activities. The allocation mechanisms
by which the funds are distributed are predominantly a) based on past electoral results,
or b) distributed equally between all contending parties.2 The next sections present an
2A dataset containing specific regulations for all countries and years will be made public upon publi-cation.
64

3.3. Party finance and the decision to enter
argument as to why the different types of public subsidies can alter the incentives for
new-party candidates to enter.
3.3.1 Campaign subsidies
As indicated above, public subsidies for political campaigns are predominantly com-
posed of a) monetary transfers to the party and b) subsidies for (or free) time on televi-
sion. On their own, these funds should not, per se, increase the costs of an election, but
they can increase the relative costs for a new-party candidates, if they are allocated on
the basis of past electoral performance. That is, new-party candidates would face rela-
tively higher campaign costs, in addition to the costs of registering a new party (which
existing parties do not have to pay).
New party candidates, by definition, do not have a previous electoral history, hence
they would not get access to any resources allocated based on past results. To level
up, the new-party candidates would need to obtain equivalent funds from the private
sector. However, that requires fund-raising capabilities that newly formed parties may
not have, given their inherently weak institutional structure.
In cases where fund-raising capabilities do exist, economic disadvantages at an
early stage of a campaign can still have knock-on effects later on. Political candi-
dates, in general, need to build a narrative of success around their candidacy early in
the campaign cycle in order to succeed. Campaigns are costly enterprises that require
large and constant influxes of funds. However, private donors only have incentives to
fund candidates that (they believe) have a reasonable possibility of success; otherwise
they would be throwing away money. If candidates don’t present themselves as viable
contenders from the beginning, they are less likely to raise the necessary funds to run
an effective campaign. One way of signalling competitiveness for any kind of candi-
date, is through the use of, expensive, media campaigns from early on in the campaign
cycle.3 Of course, this requires access to funds for media in the initial stages of the
campaign where new-party candidates are at an economic disadvantage.
3For literature on the importance of media in Latin American elections see Levitsky and Cameron(2003), Boas (2005), Mainwaring (2006).
65

Chapter 3. Party financing and new-party candidates
Access to resources is especially important for new-party candidates given the di-
minishing returns of spending on the number of votes obtained (cf. Samuels 2001, Ja-
cobson 1990, Gerber 1998, Levitt 1994). Monetary and media funding at the beginning
of a campaign can help build name recognition and visibility for the candidate. While
some new-party candidates may be known to the electorate, the parties they represent
do not have a policy or executive histories that voters can rely on as cues for govern-
mental capabilities. The candidate has to convince voters of the viability of his or her
government, which requires physical and media contact with voters. Public subsidies
can be an important source of initial endowment from which to start this process, but
only for those that have access to it. If funds are allocated based on past-performance,
candidates from existing parties will start the campaign at a substantial advantage.
Monetary funds and media subsidies do not necessarily produce the same magni-
tude of effects on the likelihood of a successful new-party candidate. Monetary re-
sources are, indeed, more flexible and can be used for multiple purposes; while media
subsidies are limited to a time, space and use predefined by the corresponding legisla-
tion. However, both resources leave the new-party candidate at a relative disadvantage
with respect to other candidates (if the funds are past performance-based) and thus in-
crease the costs for a new-party candidate. When the funding is allocated equally, or
there is no funding, new-party candidates would find themselves in an equivalent po-
sition to candidates from existing parties and, thus, should not alter their decision to
enter. Hence, one would expect:
H1 Past performance-based public funding for campaigns to be associated with a lower
number of new-party candidates, ceteris paribus.
H2 Public subsidies for media access, allocated as a function of past electoral results,
to be associated with a lower number of new-party candidates, ceteris paribus.
If this is the case, past performance based subsidies would contribute to maintain-
ing the party system status quo and potentially reducing volatility and fostering party
system institutionalization –two aspects where Latin American party systems are weak
66
3.3. Party finance and the decision to enter
(Remmer 1991, Mainwaring and Scully 1995). However, the trade-off would imply
limiting the possibilities of new actors entering and addressing new policy concerns
that are relevant to the population, potentially jeopardising the representativeness of
political parties (Kitschelt 1988, Hug 2001, Meguid 2008).
One important caveat to this argument would be the existence of upper limits on
campaign spending, as these restrictions could counteract the original funding differen-
tial by putting a ceiling on the overall costs of the campaign. However, in Latin Amer-
ica the limitations on spending, when they exist, are weak and rarely fully enforced
(cf. Gutiérrez and Zovatto 2011, Zovatto and Orozco 2008). Even so, the existence of
spending limits is accounted for in the empirical models.
3.3.2 Post-election subsidies for on-going party activities
Public funds for on-going party activities are resources that are made available to sub-
sidize a party’s operational costs (e.g. recruitment of members, maintenance of party
offices, etc.). Among the countries in the sample, these funds (when available) are pre-
dominantly allocated as a function of the votes or seats obtained by the party in the
previous election. A new party would therefore only get access to those funds after
their first election.
When funding is available, the new party has strong incentives to maximize their
votes/seats shares (depending on country specific criteria) in the up-coming election.
More votes/seats will allow them to gain access to a greater amount funds for the next
inter-election period and, thus, make it easier to institutionalize the new party and es-
tablish grass-roots for the next campaign. This paper argues that presidential candidates
can help the new party achieve this objective through his or her ‘coattail effects’ (cf.
Ferejohn and Calvert 1984, Campbell and Sumners 1990, Golder 2006, West and Spoon
2015).
Before a general election a potential new party can choose between entering a) with
presidential candidate, b) only in legislative elections, or c) staying out. If the party en-
ters without a new-party candidate it will have to distribute its resources among multiple
67

Chapter 3. Party financing and new-party candidates
legislative candidates. However, with a new-party candidate the party can concentrate
organizational and monetary resources on one individual and use its visibility to in-
form the voters of the party’s policy offers. Presidential candidates get more free media
attention, access to national debates and have higher fund-raising capabilities than leg-
islative candidates (cf. Cox 1997, Ferejohn and Calvert 1984, West and Spoon 2013).
The ‘coattail effects’ of his or her campaign can improve the new party’s overall leg-
islative results (relative to not having a new-party candidate) and help secure higher
on-going funding for the next period. As Golder (2006, p. 35) indicates “the fortunes
of electoral parties are tied to the fate of their party’s presidential candidate.” Further-
more, West and Spoon (2015) find evidence that the electoral benefits of sponsoring
a presidential candidate are higher for small parties than they are for large ones, as it
adds visibility to their policies and highlights their potential as a national competitor.
The authors’ results suggest that joining a pre-electoral coalition, without running a
presidential candidate of their own, does not enhance a party’s legislative outcomes.
Therefore, if a new party decides to enter, it is more efficient to do so with a new-party
candidate.
Staying out is always an alternative. As campaign costs are high, new-party candi-
dates need to obtain substantial benefits to justify running. Getting into office would
yield the highest returns, yet income from public subsidies for future on-going party
activities can help cancel out the costs of a campaign. If the extra visibility and votes
associated with running a presidential candidate can improve the likelihood of recov-
ering the money spent on the campaign, through monetary subsidies for the next inter-
election period, the new party would be better off doing so. One would therefore predict
that:
H3 The existence of public funds for on-going party activities allocated based on elec-
toral results, ceteris paribus, to be positively associated with the number of new-
party candidates.
If these hypotheses are correct, party finance legislation intended to regulate the im-
pact of private money on politics (and its relationship with corruption), can also affect
68

3.4. Variable operationalisation and measures
the structure of the party system. On the one hand, public funding for campaigns (based
on past electoral results) can introduce barriers to entry and limit the emergence of new
political actors. On the other, performance-based funding for on-going party activities
can increase the incentives for new parties to compete in presidential elections, even
when barriers to entry are high. Independently of whether an increase in party system
stability or enhancing representation is preferable, it is important to acknowledge the
potentially unintended consequences of these regulations on the political system.
3.4 Variable operationalisation and measures
Following the influential research conducted by Hug (2001) a new-party candidate is
operationally defined as a first round presidential candidate that a) he/she is the can-
didate of a political party that does not have links with parties with a past electoral
history; or b) is the candidate of a party that has resulted from a split in an existing
party. A ‘political party’ is defined as an organization that legally presents candidates
to the country’s representative assembly.4 In congruence with new party literature in
parliamentary systems, this coding focuses on new parties that appeal to a national
audience and excludes regional parties that don’t aspire to represent voters outside a
local constituency. Examples of new-party candidates include Keiko Fujimori in Peru
(2011), Hugo Chávez in Venezuela (1998), Fernando Collor de Melo in Brazil (1989).
To control for voter’s the level of information, candidates are only considered ‘new’
the first time they compete in an election, if that first election was as a candidate for an
existing party he or she can never be considered a new-party candidate.5 For example
Ollanta Humala is not counted as a new-party candidate in 2011, because he had been
a presidential candidate for Unión por el Perú (UPP) in 2006. The UPP was founded
in 1994 and had participated in legislative elections before 2006.6 Furthermore, parties
4Political organizations that have only presented candidates to local or other non-national electionscan, later on, present a new-party candidate.
5Tests on alternative coding of new-party candidates that did not include this restriction criterionproduced substantially equivalent empirical results.
6Data on UPP was obtained from http://www4.congreso.gob.pe/grupo_parlamentario/upp/_historia.htmon Feb 05, 2016.
69
Chapter 3. Party financing and new-party candidates
that simply change their name but keep their policy positions and main members are
not counted as new parties. This criterion is included to differentiate between simple
re-branding efforts by existing parties from new actors. Independents are also excluded
from the status of new-party candidates, as they don’t have a party affiliation. A can-
didate that is sponsored by a coalition of parties is a new-party candidate if the main
party in the coalition is ‘new’ under the above criteria, because is adds a relevant new
actor to the electoral competition. The coding was done by the author and a full list of
new-party candidates is presented in the Appendix.
This paper focuses on ‘relevant’ new-party candidates, given that incentives for
‘relevant’ and ‘non-relevant’ actors differ (Adams et al. 2006, Ezrow et al. 2011). This
decision reduces the heterogeneity that has to be accounted for in the statistical mod-
els and allows comparability with similar literature (Carreras 2012, West and Spoon
2013). For simplicity of operationalisation (and comparability), a ‘relevant’ candidate
is defined as one that obtained a minimum of 5 per cent of the valid votes in a presiden-
tial election. However, as this is an arbitrary decision, the main empirical model is also
estimated using a definition of new-party candidates at: no-threshold, 0.5 and 10 per
cent thresholds. For further robustness, estimations are conducted on Carreras’ (2012)
definition of ‘Full Outsiders’, which only includes relevant presidential candidates from
outside the mainstream parties, excluding splinter-party candidates.
The new-party candidates included in the dataset participated in democratic presi-
dential elections in 18 Latin American countries from 1978–2013.7 A list of the elec-
tions included in the dataset can be found in the Appendix. Figure 3.1 presents a his-
togram of the number of new-party candidates per election with a 5 and 0.5 per cent
threshold. The dependent variable is discrete and consistent with a Poisson distribu-
tion. The means and standard deviation of all versions of the dependent variable are
equivalent (see Table 3.1). However, for robustness, the main empirical model is also
estimated using a negative binomial distribution. This does not produce substantive
differences (see Appendix).
7Democratic elections are those for which Polity IV catalogued the country with an overall mark ofat least 5 (Marshall and Jaggers 2013).
70
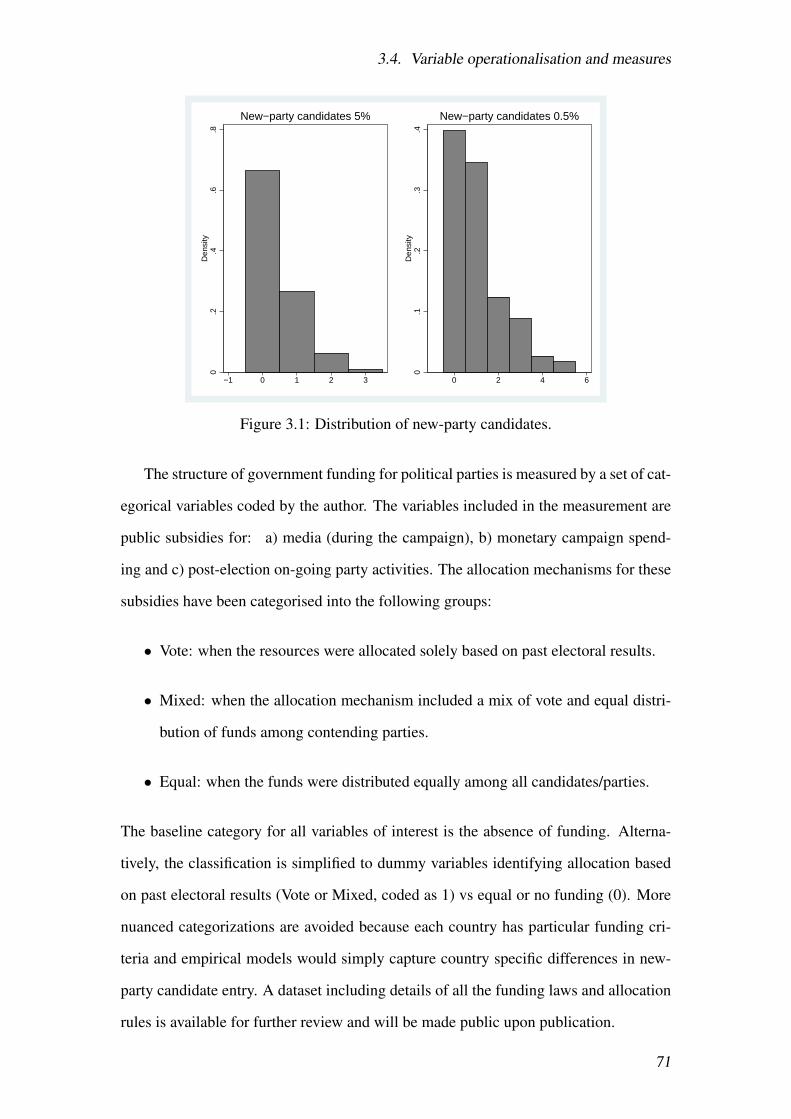
3.4. Variable operationalisation and measures
0.2
.4.6
.8D
ensi
ty
−1 0 1 2 3
New−party candidates 5%
0.1
.2.3
.4D
ensi
ty
0 2 4 6
New−party candidates 0.5%
Figure 3.1: Distribution of new-party candidates.
The structure of government funding for political parties is measured by a set of cat-
egorical variables coded by the author. The variables included in the measurement are
public subsidies for: a) media (during the campaign), b) monetary campaign spend-
ing and c) post-election on-going party activities. The allocation mechanisms for these
subsidies have been categorised into the following groups:
• Vote: when the resources were allocated solely based on past electoral results.
• Mixed: when the allocation mechanism included a mix of vote and equal distri-
bution of funds among contending parties.
• Equal: when the funds were distributed equally among all candidates/parties.
The baseline category for all variables of interest is the absence of funding. Alterna-
tively, the classification is simplified to dummy variables identifying allocation based
on past electoral results (Vote or Mixed, coded as 1) vs equal or no funding (0). More
nuanced categorizations are avoided because each country has particular funding cri-
teria and empirical models would simply capture country specific differences in new-
party candidate entry. A dataset including details of all the funding laws and allocation
rules is available for further review and will be made public upon publication.
71
Chapter 3. Party financing and new-party candidates
To control for possible confounding variables, the empirical models account for a
series of election and country specific characteristics that are correlated with both the
dependent and independent variables of interest. Among the control variables included
are: 1) the existence of limits to campaign spending, as these can create a ceiling that
levels off the cost differential produced by campaign subsidies (coded by the author);
2) the time since the country (re)obtained democratic status, because countries with
longer democratic histories have had more time to implement reforms to the party sys-
tem (source: Polity IV); 3) the level of economic development, given that more pros-
perous countries have higher capabilities of financing political parties (source: IMF
and World Bank); 4) concurrent elections, as this can alter the possibilities of obtain-
ing funding for on-going party activities (source: Bormann and Golder (2013)); 5) the
possibility that independents can run as candidates, as that would lower the incentives
to create a new party for competing in the election by avoiding organizational costs
(coded by the author); 6) the effective number of political parties in past elections, as
the existence of more parties can saturate the programmatic space open for new parties
to enter (cf. Zons 2013) and also alter the regulations regarding the equality in distribu-
tion of funding (source: Bormann and Golder (2013)), and; 7) relevant country and
election specific characteristics, such as ethno-linguistic fractionalization, the mean
district magnitude, and the size of the population (source: Fearon and Leitin (2003),
Bormann and Golder (2013) and World Bank data, respectively). For literature on how
these controls can affect new party entry see Lipset and Rokkan (1967), Ordeshook and
Shvetsova (1994), Hug (2001), Cox (1997), Jones (1994, 2004), Tavits (2006, 2008a),
Carreras (2012).
A summary of the variables used in the analysis are presented in Table 3.1. Other
variables, such as open or closed lists, presidential powers, and federalism may also
affect entry decisions by new-party candidates (cf. Hicken and Stoll 2008, Spoon and
West 2015). However, they are not included because there is no reason to believe
these institutions are correlated with party funding allocation and, therefore, would not
introduce bias in the estimation of the variables of interest. This claim is corroborated
72

3.5. Model specification
(1) (2) (3) (4) (5)VARIABLES N mean sd min max
Non-Partisan 113 0.451 0.500 0 1Uneq. On-going (dummy) 113 0.487 0.502 0 1On-going fund 113 1.150 1.234 0 3Uneq. Campaign (dummy) 113 0.779 0.417 0 1Campaign fund 113 2 1.217 0 3Media fund 113 0.973 0.949 0 4Concurrent 113 0.761 0.428 0 1Incumbent 113 0.142 0.350 0 1NPC 0% 113 2.363 2.612 0 12NPC 0.5% 113 1.053 1.187 0 5NPC 5% 113 0.416 0.651 0 3NPC 10% 113 0.336 0.592 0 2Log Time (+1) 113 2.852 0.923 0.693 4.804ELF 113 0.254 0.216 0.0370 0.678Uneq. Media (dummy) 113 0.204 0.404 0 1FPTP 108 0.343 0.477 0 1Mean Dist. Mag. 104 6.030 4.185 1 19Full Outsiders 92 0.380 0.644 0 2Log GDP pc 113 7.800 0.776 5.501 9.305Lag ENPP 93 3.592 1.645 1.970 9.320Lag NPC dummy 95 0.358 0.482 0 1Log Population 113 16.31 1.082 14.61 19.09
Table 3.1: Summary of variables included in the study.
by empirical tests (included in replication material).8
3.5 Model specification
The empirical analysis was conducted on an unbalanced election-year, time-series cross-
sectional original dataset with 18 countries and an average of 6.278 elections per coun-
try, giving a total of 113 observations. For ease of comparison with the literature on
new legislative parties, the main method of estimation for the statistical tests was a
pooled Poisson Maximum Likelihood Estimation (MLE) (cf. Hug 2001, Tavits 2006,
2008a). Auto-correlation concerns were controlled for through a dummy variable in-
dicating the presence of new-party candidates in the previous election (as frequentist8I would like to thank Hicken and Stoll (2008) for sharing their data on presidential powers to conduct
these tests.
73

Chapter 3. Party financing and new-party candidates
statistics do not produce lags of latent dependent variables).9 To account for potential
biases introduced by the coding of the dependent variable, models were also estimated
on four variations of the ‘new-party candidate’ definition.10
Concerns of endogeneity between the number of new-party candidates and govern-
ment funding regulations are reduced by two factors. The first is that these countries
enacted party finance legislation due to pressure from the international community for
the adoption of ‘normatively desirable’ institutions, instead of internal factors such as
the number of parties or electoral volatility (Potter and Tavits 2013). That is to say,
decisions about party funding were not explicitly designed to deter the entrance of new
political parties. And second, logit estimations indicate that the past number of new-
party candidates do not correlate with current funding structures, when controlling for
country characteristics (results in Appendix).
3.6 Results
The findings in Table 3.2 model 1 provide support for the hypotheses. When campaign
funding is allocated based on votes in a previous elections (increased relative costs),
one observes a significantly lower number of new-party candidates, ceteris paribus.
The same is true when media funding is unequally distributed, favouring existing par-
ties over new entries. On the other hand, the allocation of funds for on-going party
activities based on votes or mixed allocation criteria (benefits of good electoral results)
is associated with a higher number of new-party candidates, ceteris paribus.11
9Even so, a model with a lag of the dependent variable was estimated and did not substantively orsignificantly change the conclusions (see Appendix).
10The MLE models do not use so called ‘robust’ or ‘clustered’ standard errors, because maximumlikelihood estimators such as the Poisson models include fixed assumptions about the distribution of thevariance, and thus, do not present problems of heteroskedasticity (Greene 2003, Long 1997).
11The baseline for on-going funding is “no-funding”, within the sample “Equal on-going” allocationwas not observed.
74

3.6. Results
(1) (2) (3) (4) (5)VARIABLES NPC 5% NPC 5% NPC 5% NPC 5% NPC 5%
Campaign: Votes -1.373**(0.692)
Campaign: Mixed -0.819(0.679)
Campaign: Equal -13.66(1,322)
On-going: Votes 1.941***(0.658)
On-going: Mixed 1.420**(0.696)
Uneq. Campaign (dummy) -1.229** -1.515** -1.024 -1.398**(0.601) (0.756) (0.629) (0.695)
Uneq. On-going (dummy) 1.825*** 2.302*** 1.723*** 2.030***(0.616) (0.781) (0.623) (0.701)
Uneq. Media (dummy) -1.273** -1.220** -1.357** -1.204** -1.165**(0.543) (0.478) (0.570) (0.494) (0.535)
Log Time (+1) 0.286 0.317 0.548* 0.392 0.568*(0.217) (0.224) (0.323) (0.252) (0.316)
Log GDP pc -0.570* -0.664** -1.110*** -0.621* -0.907***(0.298) (0.293) (0.360) (0.320) (0.322)
Spending limits 0.248 0.125 0.341 0.0710 0.156(0.382) (0.367) (0.436) (0.399) (0.401)
Concurrent -0.196 -0.357 -0.419 -0.422 -0.386(0.552) (0.545) (0.641) (0.605) (0.653)
Non-Partisan 0.339 0.230 0.196 0.196 0.221(0.318) (0.316) (0.349) (0.341) (0.345)
Log Population 0.384* 0.394* 0.357 0.463 0.495*(0.228) (0.218) (0.295) (0.313) (0.267)
ELF 0.979 1.083 4.085* 0.996 1.462(0.935) (0.959) (2.231) (1.567) (1.081)
EFL*Lag ENPP -0.760(0.547)
Lag ENPP 0.226(0.203)
Mean Dist. Mag. -0.0282(0.0792)
EFL*Mean Dist. Magn. 0.0625(0.176)
Lag NPC dummy -0.195(0.338)
Constant -3.878 -3.307 -0.878 -4.874 -3.944(3.954) (3.951) (5.331) (4.791) (4.849)
Observations 113 113 93 104 95Log likelihood -75.88 -77.10 -61.09 -72.87 -62.07
Standard errors in parentheses*** p<0.01, ** p<0.05, * p<0.1
Table 3.2: Poisson models on the number of new-party candidates at the 5% threshold.
75

Chapter 3. Party financing and new-party candidates
The estimation of model 1 includes on-going and campaign funding distributions at
their most disaggregated state. However, the number of observations in the dataset is
limited due to the short history of democratic elections since the third wave of democ-
racy in Latin America (Huntington 1991). The small number of observations can lead
to over-fitting the models and biased results. To manage these concerns models 2–5
are estimated using dummy variables for presence/absence of performance-based sub-
sidies. Likelihood ratio tests indicate there is no significant loss of fit between models
1 and 2, justifying the use of this simplified coding in further analyses.
The patterns in models 1 and 2 are similar, campaign (‘Uneq. Campaign’) and me-
dia funding (‘Uneq. Media’) based on performance in past elections is, as hypothesised
(H1-2), negatively associate with the new-party candidates. However, one observes
more of these candidates in the presence of potential funding for future on-going party
activities, allocated as a consequence of current electoral outcomes (‘Uneq. On-going’).
This result is consistent with hypothesis H3. The coefficients in models 3–5 indicate
the robustness of these inferences to the inclusion of various control variables. Model
3 accounts for the impact of the effective number of parties in the legislature and its
interaction with the level of ethno-linguistic fractionalization in the country. Model 4
controls for the level of permissibility of the electoral system by including the mean
district magnitude. Finally, model 5 deals with potential autocorrelation problems by
including a dummy for the presence of new-party candidates in the previous election.
As can be observed, the variables of interest are consistently significant and the magni-
tude of their effect only varies slightly. Furthermore, likelihood ratio tests indicate no
significant difference of fit between most parsimonious model 2 and models 3–5. For
this reason, further test are conducted using model 2 as a base.
All estimations include controls for the existence of campaign spending limits. As
can be observed, spending limitations are never significant predictors of new-party can-
didate entry, despite their potential to level off funding inequalities among competitors.
Further controls for a possible interaction effect between spending limits and types of
funding are not significant either (see Appendix). This absence of a distinguishable
76

3.6. Results
0.5
11.
5P
redi
cted
num
ber
of N
PC
s
No Yes
Uneq. Campaign Funding
0.5
11.
5
No Yes
Uneq. On−going Funding
0.5
11.
5P
redi
cted
num
ber
of N
PC
s
No Yes
Uneq. Media Funding
Figure 3.2: First differences on the effects of public subsidies for new-party candidatesat the 5% threshold.
effect is likely caused by a weak execution of controls and sanctions by enforcement
agencies (cf. Gutiérrez and Zovatto 2011, Zovatto and Orozco 2008). It is possible that
spending restrictions could have an effect when adequately implemented, but further
research would have to be conducted.
Overall the results in Table 3.2 indicate that the more disadvantaged new-parties
are regarding funding and media during a campaign, the less likely one can observe
relevant new-party candidates entering, other variables constant. On the other hand,
more of these candidates are willing to take the risk if there is a increased potential for
funding for their party’s future activities, ceteris paribus. As previously indicated, these
effects are robust to multiple methods of estimations and sample selection, attesting to
the reliability of the inferences outlined above (tables in Appendix).
The substantive effect of public subsidies can be observed in the first difference
plots in Figure 3.2.12 The y-axis is the expected number of new-party candidates
12The effects are calculated from model 2, holding constant non-partisans at 0, limits to spending at1, concurrence of elections at 1, and Log of Time, ELF, and Log GDP per capita at their means.
77

Chapter 3. Party financing and new-party candidates
(NPCs) and the x-axis indicates the presence or absence of performance-based funding.
Figure 3.2 top-left shows that roughly in 1/4 of the elections that do not including fund-
ing for campaigns (or allocate it equally) one can expect a relevant new-party candidate
entry. However, when campaign funding is allocated based on past-electoral results the
mean expectation is reduced to 1/10. Nevertheless, in the absence of funding, the vari-
ation in number of candidates is large, and whether a new party sponsors a presidential
candidate (or not), or avoids entering altogether will depend on other factors. The effect
of campaign subsidies simply decreases the expectation of entry to a negligible number.
The predictions for media subsidies determined by past votes, Figure 3.2 bottom-
left, are similar to those of campaign funding. The expected number of relevant candi-
dates running for new parties is substantially higher when there are no media subsidies
(or these are equally distributed). The size of this effect is equivalent to the one by mon-
etary campaign funding and larger than hypothesised —given that media subsidies are
earmarked for limited purposes and monetary subsidies can be used at the discretion
of the candidate or party. However, it corresponds with the similarity in coefficients
estimated for unequal campaign and media funding in model 2. Another factor that is
important to note is the small variation in the expected number of new-party candidates
when past-performance based media funds are available. As one can observe, the 95%
confidence interval in the presence of media funding is roughly one third the size of
those when no subsidies exist (or are equally allocated). The same goes for campaign
funding. These results imply that, even if the confidence intervals overlap, the availabil-
ity of unequal funding during the campaign period systematically reduces the expected
number of new-party candidates. In other words, the absence of barriers to entry does
not imply new-party candidates will compete. However, when they are present, one can
be confident in predicting that the number of relevant new-party entries will be low.
As hypothesised, funding for on-going activities has the opposite effect. Even when
campaign funding exists, the presence of potential benefits of entry is associated with
a substantially higher number of relevant new-party candidates. In the absence of on-
going funding one can expect a new-party candidate every ten elections. However, the
78
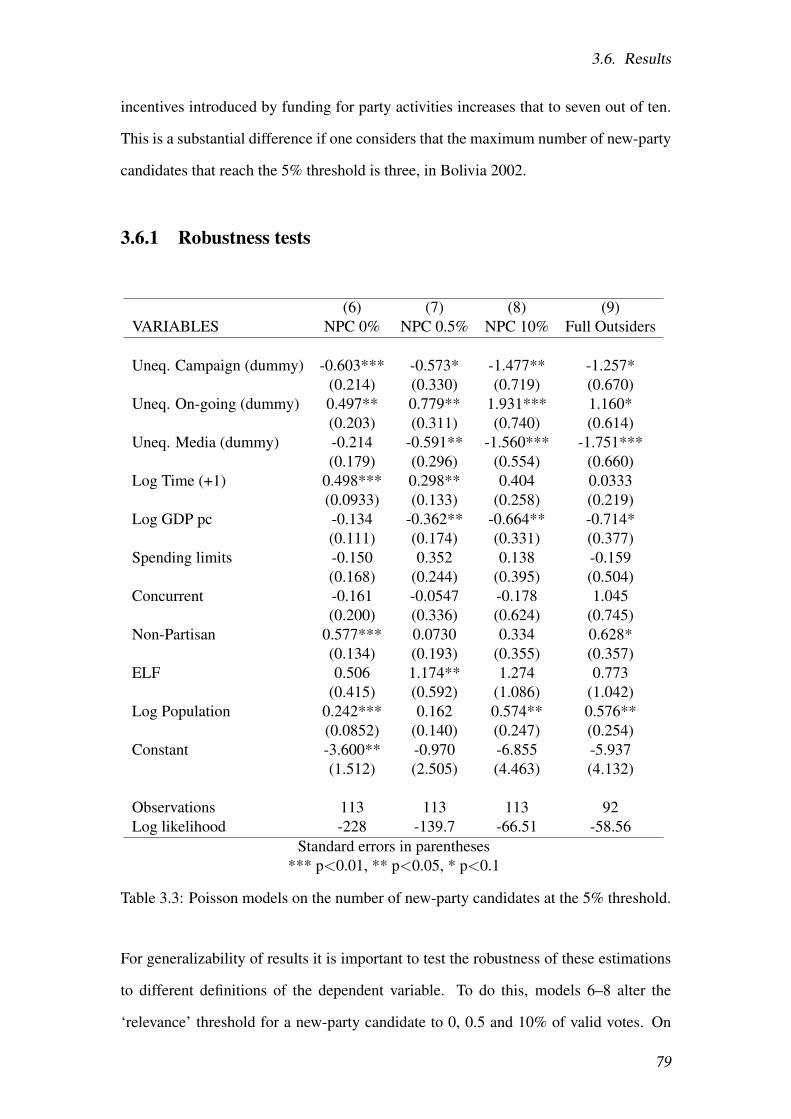
3.6. Results
incentives introduced by funding for party activities increases that to seven out of ten.
This is a substantial difference if one considers that the maximum number of new-party
candidates that reach the 5% threshold is three, in Bolivia 2002.
3.6.1 Robustness tests
(6) (7) (8) (9)VARIABLES NPC 0% NPC 0.5% NPC 10% Full Outsiders
Uneq. Campaign (dummy) -0.603*** -0.573* -1.477** -1.257*(0.214) (0.330) (0.719) (0.670)
Uneq. On-going (dummy) 0.497** 0.779** 1.931*** 1.160*(0.203) (0.311) (0.740) (0.614)
Uneq. Media (dummy) -0.214 -0.591** -1.560*** -1.751***(0.179) (0.296) (0.554) (0.660)
Log Time (+1) 0.498*** 0.298** 0.404 0.0333(0.0933) (0.133) (0.258) (0.219)
Log GDP pc -0.134 -0.362** -0.664** -0.714*(0.111) (0.174) (0.331) (0.377)
Spending limits -0.150 0.352 0.138 -0.159(0.168) (0.244) (0.395) (0.504)
Concurrent -0.161 -0.0547 -0.178 1.045(0.200) (0.336) (0.624) (0.745)
Non-Partisan 0.577*** 0.0730 0.334 0.628*(0.134) (0.193) (0.355) (0.357)
ELF 0.506 1.174** 1.274 0.773(0.415) (0.592) (1.086) (1.042)
Log Population 0.242*** 0.162 0.574** 0.576**(0.0852) (0.140) (0.247) (0.254)
Constant -3.600** -0.970 -6.855 -5.937(1.512) (2.505) (4.463) (4.132)
Observations 113 113 113 92Log likelihood -228 -139.7 -66.51 -58.56
Standard errors in parentheses*** p<0.01, ** p<0.05, * p<0.1
Table 3.3: Poisson models on the number of new-party candidates at the 5% threshold.
For generalizability of results it is important to test the robustness of these estimations
to different definitions of the dependent variable. To do this, models 6–8 alter the
‘relevance’ threshold for a new-party candidate to 0, 0.5 and 10% of valid votes. On
79
Chapter 3. Party financing and new-party candidates
the other hand, model 9 uses Carreras’ (2012) definition of ‘Full Outsiders’ as the de-
pendent variable. His operational approach focuses on how candidates emerged (from
inside or outside the mainstream parties) as the distinctive condition, excluding splinter-
party candidates as they would be considered insiders despite running for a new party.
Nevertheless, in practice, ‘Full Outsiders’ and new-party candidates at the 5% threshold
overlap substantively (comparison table in Appendix).
The results are consistent with the theory. Unequal campaign and media funding
are always significantly associated with a lower number of new-party candidates. As
before, the association with the existence of potential monetary benefits for on-going
party activities is positive. The magnitudes of these effects vary, but that is caused
by differences in the operational definitions of the dependent variable. As presented in
Table 3.1, new-party candidates fluctuate between 0–12 per election at 0% threshold, to
0–2 at the 10% level. On the other hand, the coefficients for ‘Full Outsiders’ and new-
party candidates at the 10% threshold are very similar to the ones in the main models
(Table 3.2).
To further test the robustness of the analysis to characteristics, structure and clus-
tering of the sample, the estimations of models 1–5 were conducted using: a logit on
the existence of new-party candidates, an ordered logit on the number of new-party
candidates, Panel Poisson with Random Effects (RE) and Fixed effects (FE), a pooled
ordinary least squares (OLS) with country clustered standard errors; and pooled Pois-
son with Jackknife and Bootstrapped standard errors. The results of these tests are
included in the Appendix, and the conclusions are substantively in line with the find-
ings presented in the paper.
3.7 Conclusions
The results provide evidence that entry decisions by new-party candidates are associ-
ated with incentives introduced by party finance regulations. As hypothesized, higher
relative costs of competing (produced by past-performance based campaign and media
subsidies) are associated with a lower number of presidential candidates running for
80
3.7. Conclusions
new parties. These statistically significant effects contribute to reducing the expected
number of new-party candidates that enter. However, even in the absence of unequal
media and monetary campaign subsidies there are elections in which new-party candi-
dates do not compete. On the other hand, one can observe a significantly higher number
of these candidates entering when there are subsidies for on-going party activities, even
under unequal access to campaign funding. These results suggest that the potential to
gain monetary support for a new party to institutionalize itself in the up-coming inter-
election period can outweigh the extra costs of running a presidential campaign.
The observational nature of the data (and estimation strategy used) caution against
a strict causal interpretation of the results. However, robustness tests provide assurance
that the associations found in the data are not the product of sample selection, method
of estimation, or definition of the phenomena of interest. The incentive structures have
significant effects on new-party candidates, independent of the assumptions regarding
the data generating process. That is to say, the effects are persistent whether one be-
lieves the incentive schemes alter the existence (or not) of candidates sponsored by
new parties, or how many of them enter an election. Furthermore, the impact of public
subsidies is not only associated with ‘relevant’ candidates, but also with multiple and
flexible definitions of the phenomena of interest. Party subsidies can thus have an effect
on the decisions of a wide range of political actors. These results corroborate Tavit’s
(2006) argument regarding the rational behaviour of new parties, and expands scientific
evidence to developing counties with presidential systems.
Substantively, this study highlights the importance of looking at the effects of spe-
cific public funding provisions. Different types of subsidies and regulations can have
contrasting effects on the incentive structures faced by new-party candidates. In the
case presented here, increases in costs produced by unequal funding for campaigns re-
duce the incentives for entry. This, in turn, corresponds with a more stable electoral
arena, where the number of new parties that enter sponsoring a presidential candidate
is small and the status quo tends to prevail. On the other hand, public subsidies for po-
litical parties’ inter-election (on-going) activities increase the incentives to participate,
81
Chapter 3. Party financing and new-party candidates
other costs constant. Consequently, these types of benefits can lead to more variation
in the actors and policy offers available to voters.
In conclusion, while there are many reasons to regulate money in politics, this study
provides empirical evidence to suggest that funding mechanisms have consequences
with respect to the structure of a party system. Whether a country benefits from an in-
crease in party entry flexibility, or would do better if they reduce the level of instability,
depends on the particular circumstance in that country. All objectives are valid, as long
as policy makers are aware of the consequences of their decisions. They would be wise
to consider the effects shown in this paper in the institutional design of future funding
policies and, thus, avoid having to deal with unintended outcomes further on.
The impact of public funding policies on the stability/flexibility of the party system
reinforces the need to analyse these matters in more detail. Further research with more
nuanced measures could provide insights into how or at what levels the incentives be-
come relevant. For reasons of comparability across countries it was not possible to do
so in this study. However, research at the sub-national level could address this issue in
more detail. It would be particularly interesting to study changes in the number of new-
party candidates across constituencies in the same country, before and after regulatory
reforms.
82
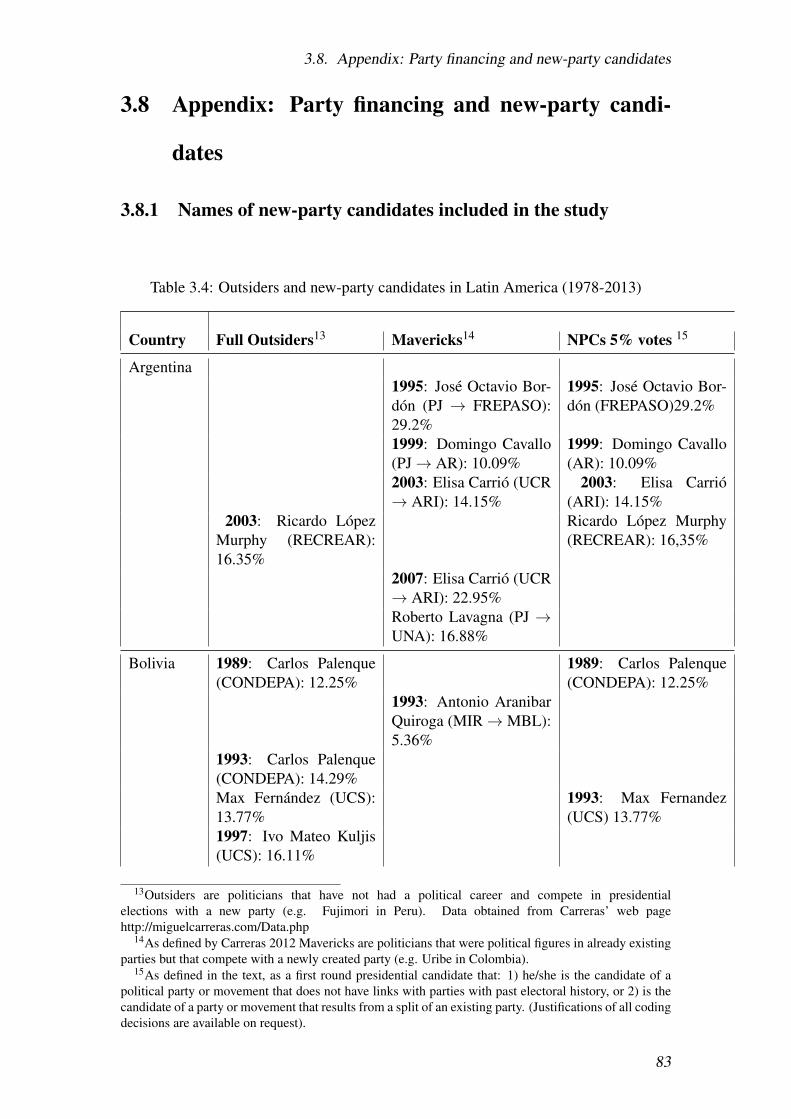
3.8. Appendix: Party financing and new-party candidates
3.8 Appendix: Party financing and new-party candi-
dates
3.8.1 Names of new-party candidates included in the study
Table 3.4: Outsiders and new-party candidates in Latin America (1978-2013)
Country Full Outsiders13 Mavericks14 NPCs 5% votes 15
Argentina1995: José Octavio Bor-dón (PJ → FREPASO):29.2%
1995: José Octavio Bor-dón (FREPASO)29.2%
1999: Domingo Cavallo(PJ→ AR): 10.09%
1999: Domingo Cavallo(AR): 10.09%
2003: Elisa Carrió (UCR→ ARI): 14.15%
2003: Elisa Carrió(ARI): 14.15%
2003: Ricardo LópezMurphy (RECREAR):16.35%
Ricardo López Murphy(RECREAR): 16,35%
2007: Elisa Carrió (UCR→ ARI): 22.95%Roberto Lavagna (PJ →UNA): 16.88%
Bolivia 1989: Carlos Palenque(CONDEPA): 12.25%
1989: Carlos Palenque(CONDEPA): 12.25%
1993: Antonio AranibarQuiroga (MIR→MBL):5.36%
1993: Carlos Palenque(CONDEPA): 14.29%Max Fernández (UCS):13.77%
1993: Max Fernandez(UCS) 13.77%
1997: Ivo Mateo Kuljis(UCS): 16.11%
13Outsiders are politicians that have not had a political career and compete in presidentialelections with a new party (e.g. Fujimori in Peru). Data obtained from Carreras’ web pagehttp://miguelcarreras.com/Data.php
14As defined by Carreras 2012 Mavericks are politicians that were political figures in already existingparties but that compete with a newly created party (e.g. Uribe in Colombia).
15As defined in the text, as a first round presidential candidate that: 1) he/she is the candidate of apolitical party or movement that does not have links with parties with past electoral history, or 2) is thecandidate of a party or movement that results from a split of an existing party. (Justifications of all codingdecisions are available on request).
83
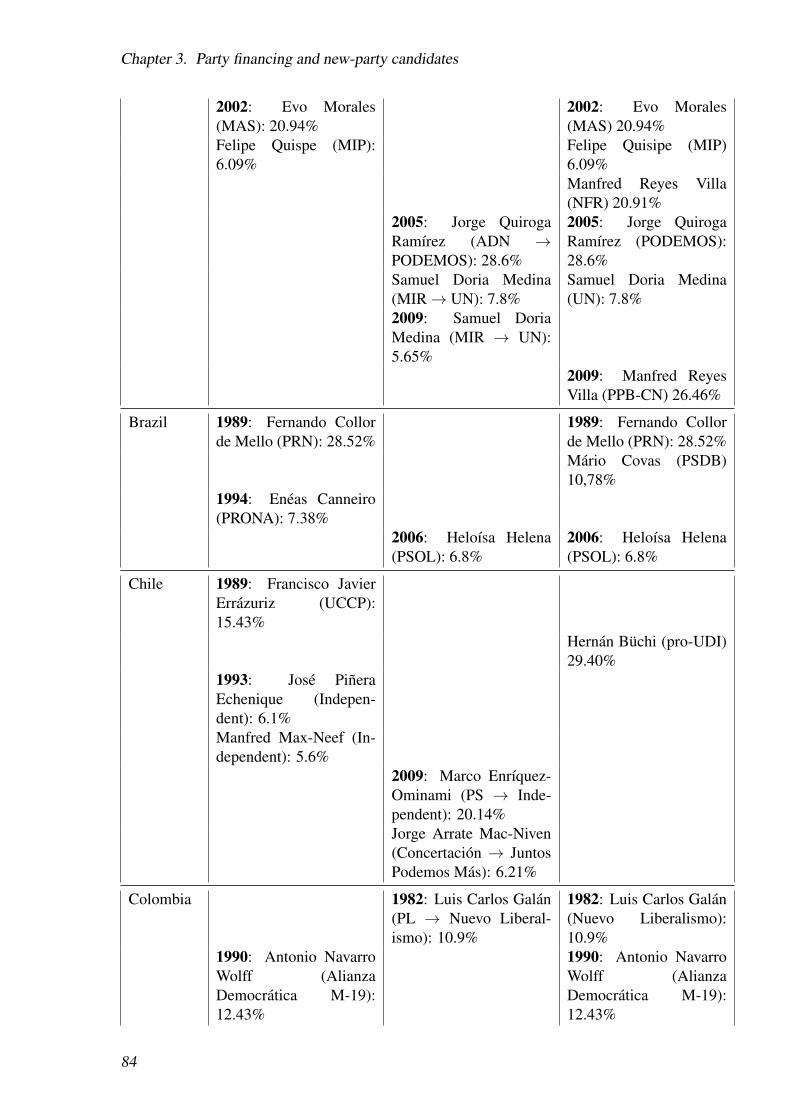
Chapter 3. Party financing and new-party candidates
2002: Evo Morales(MAS): 20.94%
2002: Evo Morales(MAS) 20.94%
Felipe Quispe (MIP):6.09%
Felipe Quisipe (MIP)6.09%Manfred Reyes Villa(NFR) 20.91%
2005: Jorge QuirogaRamírez (ADN →PODEMOS): 28.6%
2005: Jorge QuirogaRamírez (PODEMOS):28.6%
Samuel Doria Medina(MIR→ UN): 7.8%
Samuel Doria Medina(UN): 7.8%
2009: Samuel DoriaMedina (MIR → UN):5.65%
2009: Manfred ReyesVilla (PPB-CN) 26.46%
Brazil 1989: Fernando Collorde Mello (PRN): 28.52%
1989: Fernando Collorde Mello (PRN): 28.52%Mário Covas (PSDB)10,78%
1994: Enéas Canneiro(PRONA): 7.38%
2006: Heloísa Helena(PSOL): 6.8%
2006: Heloísa Helena(PSOL): 6.8%
Chile 1989: Francisco JavierErrázuriz (UCCP):15.43%
Hernán Büchi (pro-UDI)29.40%
1993: José PiñeraEchenique (Indepen-dent): 6.1%Manfred Max-Neef (In-dependent): 5.6%
2009: Marco Enríquez-Ominami (PS → Inde-pendent): 20.14%Jorge Arrate Mac-Niven(Concertación → JuntosPodemos Más): 6.21%
Colombia 1982: Luis Carlos Galán(PL → Nuevo Liberal-ismo): 10.9%
1982: Luis Carlos Galán(Nuevo Liberalismo):10.9%
1990: Antonio NavarroWolff (AlianzaDemocrática M-19):12.43%
1990: Antonio NavarroWolff (AlianzaDemocrática M-19):12.43%
84
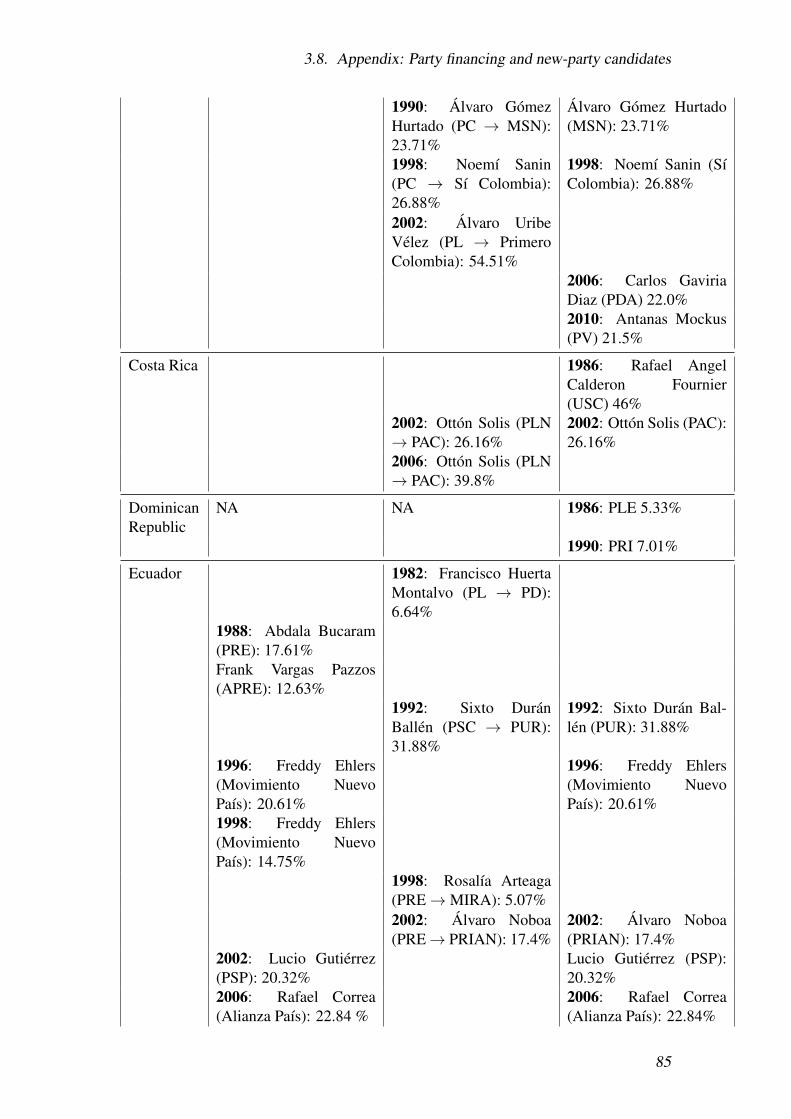
3.8. Appendix: Party financing and new-party candidates
1990: Álvaro GómezHurtado (PC → MSN):23.71%
Álvaro Gómez Hurtado(MSN): 23.71%
1998: Noemí Sanin(PC → Sí Colombia):26.88%
1998: Noemí Sanin (SíColombia): 26.88%
2002: Álvaro UribeVélez (PL → PrimeroColombia): 54.51%
2006: Carlos GaviriaDiaz (PDA) 22.0%2010: Antanas Mockus(PV) 21.5%
Costa Rica 1986: Rafael AngelCalderon Fournier(USC) 46%
2002: Ottón Solis (PLN→ PAC): 26.16%
2002: Ottón Solis (PAC):26.16%
2006: Ottón Solis (PLN→ PAC): 39.8%
DominicanRepublic
NA NA 1986: PLE 5.33%
1990: PRI 7.01%
Ecuador 1982: Francisco HuertaMontalvo (PL → PD):6.64%
1988: Abdala Bucaram(PRE): 17.61%Frank Vargas Pazzos(APRE): 12.63%
1992: Sixto DuránBallén (PSC → PUR):31.88%
1992: Sixto Durán Bal-lén (PUR): 31.88%
1996: Freddy Ehlers(Movimiento NuevoPaís): 20.61%
1996: Freddy Ehlers(Movimiento NuevoPaís): 20.61%
1998: Freddy Ehlers(Movimiento NuevoPaís): 14.75%
1998: Rosalía Arteaga(PRE→MIRA): 5.07%2002: Álvaro Noboa(PRE→ PRIAN): 17.4%
2002: Álvaro Noboa(PRIAN): 17.4%
2002: Lucio Gutiérrez(PSP): 20.32%
Lucio Gutiérrez (PSP):20.32%
2006: Rafael Correa(Alianza País): 22.84 %
2006: Rafael Correa(Alianza País): 22.84%
85

Chapter 3. Party financing and new-party candidates
Gilmar Gutiérrez (PSP):17.42%
El Sal-vador
Guatemala NA NA 1999: Álvaro Colom Ca-balleros (URNG) 12.3%Óscar Berger Perdomo(GANA) 34.46%2007: José EduardoSuger Cofiño (CASA)07.5%2011:Manuel Anto-nio Baldizón Méndez(LIDER) 23.2%
Honduras NA NA
Mexico NA NA
Nicaragua 1990: Violeta Chamorro(UNO): 54.73%2006: Edmundo JarquínCalderón (MRS): 6.3%
2006: Eduardo Mon-tealegre (PLC → ALN-PC): 28.3%
Panama 1994: Rubén Blades(Movimiento PapaEgoró): 17.1%
1994: Rubén Blades(Movimiento PapaEgoró): 17.1%
1999: Alberto Vallarino(PA→ PRC): 17.38%2004: Guillermo EndaraGalimany(PA → PS):30.86%Ricardo Martinelli (PRD- PA→ PCD): 5.31%
2004: Ricardo Martinelli(PCD): 5.31%
Paraguay 1993: Guillermo Ca-ballero (EN): 23.04%2003: Pedro Fadul(MPQ): 21.96%
2003: Pedro Fadul(MPQ): 21.96%
2003: GuillermoSánchez Guffanti (PC→UNACE): 13.9%
2003: GuillermoSánchez Guffanti(UNACE): 13.9%
2008: Fernando Lugo(APC): 42.3%Lino Oviedo (UNACE):22.8%
86

3.8. Appendix: Party financing and new-party candidates
Peru 1990: Mario VargasLlosa (FREDEMO):33%Alberto Fujimori (Cam-bio 90): 29%
1990: Alberto Fujimori(Cambio 90): 29%
2001: Alejandro Toledo(PP): 36.5%
2001: Alejandro Toledo(PP): 36.5%
2006: Ollanta Humala(UPP): 30.06%
2011: Keiko FujimoriHiguchi (F2011) 23.5%
Uruguay 1989: Hugo Batalla(FA → Nuevo Espacio):9.01%
1989: Hugo Batalla(Nuevo Espacio): 9.01%
Venezuela 1993: Andrés Velásquez(La Causa Radical):21.95%
1993: Rafael Caldera(COPEI→ CN): 30.46%
1993: Rafael Caldera(CN): 30.46%
1998: Hugo Chávez(MVR): 56.20%
1998: Hugo Chávez(MVR): 56.20%
Henrique Salas Römer(Proyecto Venezuela):39.97%
Henrique Salas Römer(Proyecto Venezuela):39.97%
2000: Francisco AriasCárdenas (LCR):35.75%
Glossary of Latin American Party and Coalition Names
ArgentinaPJ: Partido JusticialistaAR: Acción por la RepúblicaRECREAR: Recrear para el CrecimientoARI: Afirmación para una RepúblicaIgualitariaUCR: Unión Cívica RadicalUNA: Una Nación AvanzadaFREPASO: Frente País Solidario
BoliviaCONDEPA: Conciencia de PatriaUCS: Unión Cívica SolidaridadMIR: Movimiento de la Izquierda Revolu-cionariaMBL: Movimiento Bolivia LibreMAS: Movimiento al Socialismo
MIP: Movimiento Indígena PachakutiADN: Acción Democrática NacionalistaPODEMOS: Poder Democrático y SocialUN: Unidad NacionalNFR: Nueva Fuerza RepublicanaPPB – CN: Plan Progreso por Bolivia -Convergencia Nacional
BrazilPRN: Partido da Reconstrução NacionalPRONA: Partido de Reedificão da OrdemNacionalPSOL: Partido Socialismo e LiberdadePSDB: Partido da Social DemocraciaBrasileira
Chile
87
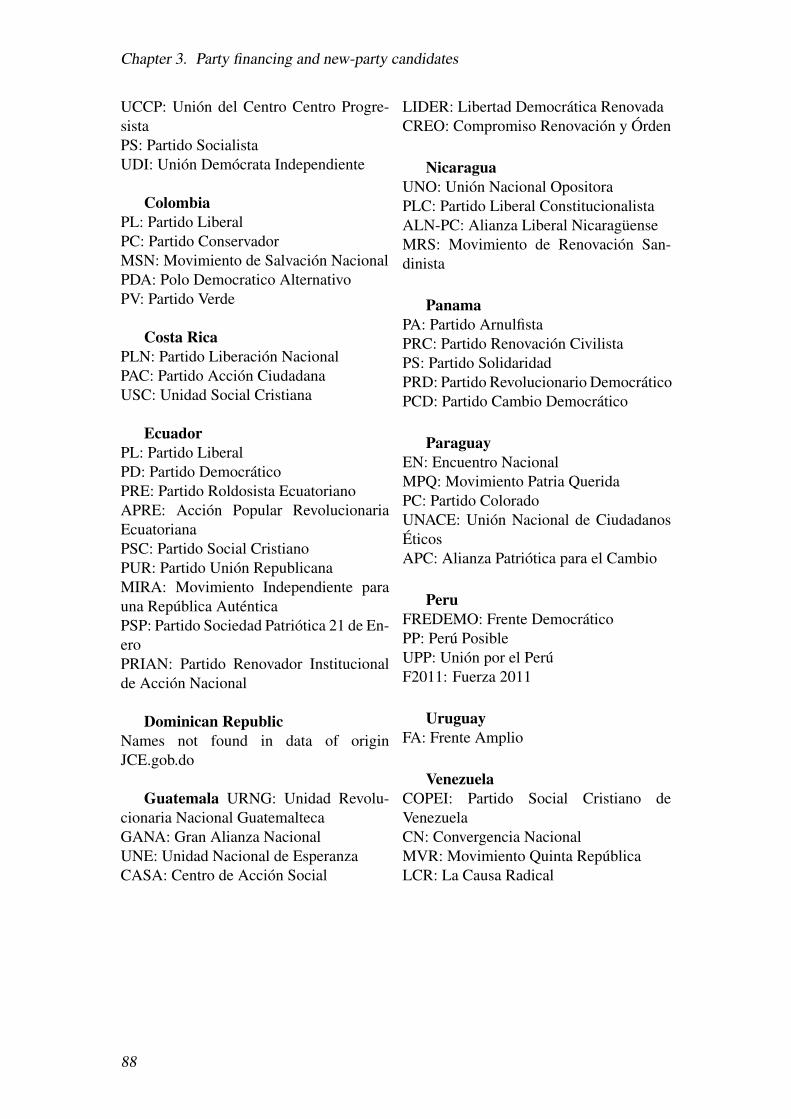
Chapter 3. Party financing and new-party candidates
UCCP: Unión del Centro Centro Progre-sistaPS: Partido SocialistaUDI: Unión Demócrata Independiente
ColombiaPL: Partido LiberalPC: Partido ConservadorMSN: Movimiento de Salvación NacionalPDA: Polo Democratico AlternativoPV: Partido Verde
Costa RicaPLN: Partido Liberación NacionalPAC: Partido Acción CiudadanaUSC: Unidad Social Cristiana
EcuadorPL: Partido LiberalPD: Partido DemocráticoPRE: Partido Roldosista EcuatorianoAPRE: Acción Popular RevolucionariaEcuatorianaPSC: Partido Social CristianoPUR: Partido Unión RepublicanaMIRA: Movimiento Independiente parauna República AuténticaPSP: Partido Sociedad Patriótica 21 de En-eroPRIAN: Partido Renovador Institucionalde Acción Nacional
Dominican RepublicNames not found in data of originJCE.gob.do
Guatemala URNG: Unidad Revolu-cionaria Nacional GuatemaltecaGANA: Gran Alianza NacionalUNE: Unidad Nacional de EsperanzaCASA: Centro de Acción Social
LIDER: Libertad Democrática RenovadaCREO: Compromiso Renovación y Órden
NicaraguaUNO: Unión Nacional OpositoraPLC: Partido Liberal ConstitucionalistaALN-PC: Alianza Liberal NicaragüenseMRS: Movimiento de Renovación San-dinista
PanamaPA: Partido ArnulfistaPRC: Partido Renovación CivilistaPS: Partido SolidaridadPRD: Partido Revolucionario DemocráticoPCD: Partido Cambio Democrático
ParaguayEN: Encuentro NacionalMPQ: Movimiento Patria QueridaPC: Partido ColoradoUNACE: Unión Nacional de CiudadanosÉticosAPC: Alianza Patriótica para el Cambio
PeruFREDEMO: Frente DemocráticoPP: Perú PosibleUPP: Unión por el PerúF2011: Fuerza 2011
UruguayFA: Frente Amplio
VenezuelaCOPEI: Partido Social Cristiano deVenezuelaCN: Convergencia NacionalMVR: Movimiento Quinta RepúblicaLCR: La Causa Radical
88
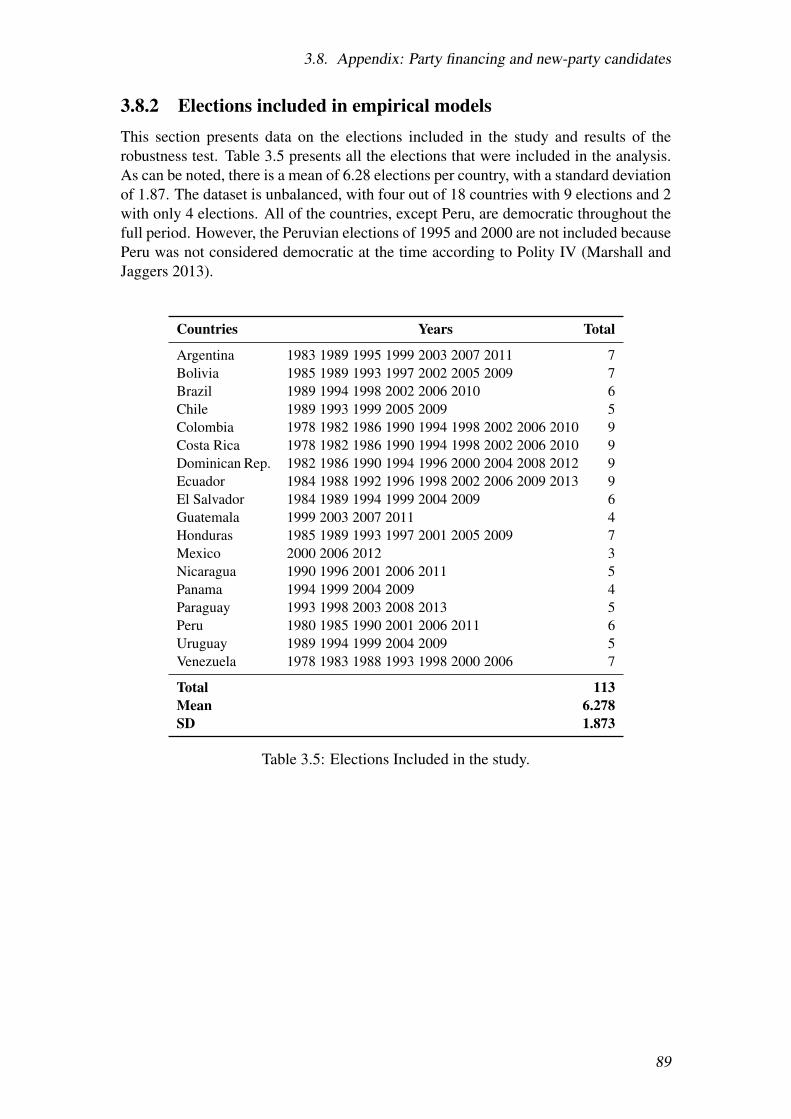
3.8. Appendix: Party financing and new-party candidates
3.8.2 Elections included in empirical modelsThis section presents data on the elections included in the study and results of therobustness test. Table 3.5 presents all the elections that were included in the analysis.As can be noted, there is a mean of 6.28 elections per country, with a standard deviationof 1.87. The dataset is unbalanced, with four out of 18 countries with 9 elections and 2with only 4 elections. All of the countries, except Peru, are democratic throughout thefull period. However, the Peruvian elections of 1995 and 2000 are not included becausePeru was not considered democratic at the time according to Polity IV (Marshall andJaggers 2013).
Countries Years Total
Argentina 1983 1989 1995 1999 2003 2007 2011 7Bolivia 1985 1989 1993 1997 2002 2005 2009 7Brazil 1989 1994 1998 2002 2006 2010 6Chile 1989 1993 1999 2005 2009 5Colombia 1978 1982 1986 1990 1994 1998 2002 2006 2010 9Costa Rica 1978 1982 1986 1990 1994 1998 2002 2006 2010 9Dominican Rep. 1982 1986 1990 1994 1996 2000 2004 2008 2012 9Ecuador 1984 1988 1992 1996 1998 2002 2006 2009 2013 9El Salvador 1984 1989 1994 1999 2004 2009 6Guatemala 1999 2003 2007 2011 4Honduras 1985 1989 1993 1997 2001 2005 2009 7Mexico 2000 2006 2012 3Nicaragua 1990 1996 2001 2006 2011 5Panama 1994 1999 2004 2009 4Paraguay 1993 1998 2003 2008 2013 5Peru 1980 1985 1990 2001 2006 2011 6Uruguay 1989 1994 1999 2004 2009 5Venezuela 1978 1983 1988 1993 1998 2000 2006 7
Total 113Mean 6.278SD 1.873
Table 3.5: Elections Included in the study.
89

Chapter 3. Party financing and new-party candidates
3.8.3 Robustness of model specification
(A.1) (A.2) (A.3) (A.4) (A.5)VARIABLES NPC 5% NPC 5% NPC 5% NPC 5% NPC 5%
Lag NPC Logit entry Ologit Panel Poisson RE Panel Poisson FE
Uneq. Campaign (dummy) -1.403** -1.819** -1.689** -0.430(0.697) (0.796) (0.790) (0.867)
Uneq. On-going (dummy) 2.053*** 2.055*** 2.499*** 0.609** 0.838(0.702) (0.758) (0.787) (0.274) (0.885)
Uneq. Media (dummy) -1.194** -1.376** -1.931*** 0.0329 -0.730(0.535) (0.676) (0.692) (0.359) (0.707)
Log Time (+1) 0.613* 0.456 0.549* 0.0230 -0.0302(0.323) (0.312) (0.309) (0.135) (0.459)
Log GDP pc -0.934*** -0.735* -1.034** -0.102 -2.077***(0.318) (0.427) (0.441) (0.183) (0.659)
Spending limits 0.105 0.429 0.276 0.343 0.304(0.406) (0.646) (0.623) (0.294) (0.681)
Concurrent -0.352 -0.379 -0.510 0.510 -0.986(0.646) (0.748) (0.767) (0.345) (0.883)
Non-Partisan 0.294 0.210 0.389 -0.131 0.335(0.357) (0.504) (0.488) (0.233) (0.535)
ELF 1.572 2.060 1.964 -1.211*(1.088) (1.468) (1.433) (0.694)
Log Population 0.533* 0.383 0.620* -0.131 5.300*(0.275) (0.309) (0.318) (0.139) (2.777)
Lag NPC -0.200(0.217)
Constant cut1 4.393(5.599)
Constant cut2 6.802(5.640)
Constant cut3 9.176(5.736)
Constant Camp. (dummy) 2.144(2.480)
Constant lnalpha -17.76(790.8)
Constant -4.564 -2.470(4.935) (5.564)
Observations 95 113 113 113 92Log likelihood -61.80 -57.46 -76.42 -104.1 -46.29Number of countries 18 14
Standard errors in parentheses*** p<0.01, ** p<0.05, * p<0.1
Table 3.6: Robustness tests for method of estimation.
90

3.8. Appendix: Party financing and new-party candidates
(A.6) (A.7) (A.8) (A.9)VARIABLES NPC 5% NPC 5% NPC 5% NPC 5%
OLS Clustered SE Neg Binomial Bootstrap SE Jackknife SE
Uneq. Campaign (dummy) -0.252 -1.229** -1.229** -1.229**(0.175) (0.601) (0.590) (0.614)
Uneq. On-going (dummy) 0.524*** 1.825*** 1.825*** 1.825***(0.160) (0.616) (0.659) (0.662)
Uneq. Media (dummy) -0.557*** -1.220** -1.220** -1.220***(0.152) (0.478) (0.510) (0.462)
Log Time (+1) 0.135* 0.317 0.317 0.317(0.0681) (0.224) (0.254) (0.239)
Log GDP pc -0.236** -0.664** -0.664** -0.664**(0.0936) (0.293) (0.302) (0.295)
Spending limits 0.0470 0.125 0.125 0.125(0.120) (0.367) (0.402) (0.363)
Concurrent -0.194 -0.357 -0.357 -0.357(0.154) (0.545) (0.624) (0.586)
Non-Partisan 0.0870 0.230 0.230 0.230(0.116) (0.316) (0.338) (0.312)
ELF 0.691 1.083 1.083 1.083(0.407) (0.959) (1.065) (1.012)
Log Population 0.151** 0.394* 0.394 0.394(0.0599) (0.218) (0.276) (0.252)
Constant -0.610 -3.307 -3.307 -3.307(0.906) (3.951) (4.622) (4.460)
Constant NB -15.74(891.9)
Observations 113 113 113 113R-squared 0.298Log likelihood -77.10 -77.10 -77.10
Standard errors in parentheses (robust s.e. for OLS model)*** p<0.01, ** p<0.05, * p<0.1
Table 3.7: Robustness tests for method of estimation (cont.).
91

Chapter 3. Party financing and new-party candidates
(A.10) (A.11) (A.12)VARIABLES NPC 5% NPC 5% NPC 5%
Uneq. Campaign (dummy) -1.328** -1.340** -1.325**(0.629) (0.649) (0.636)
Uneq. On-going (dummy) 1.821*** 1.882*** 1.845***(0.626) (0.634) (0.623)
Uneq. Media (dummy) -1.279*** -1.470** -1.270***(0.486) (0.694) (0.488)
Spending limits -0.348 0.0485 -0.252(0.839) (0.398) (0.865)
Limits*On-going 0.603(0.937)
Limits*Media 0.496(0.933)
Limits*Campaign 0.474(0.966)
Log Time (+1) 0.349 0.312 0.344(0.229) (0.223) (0.230)
Log GDP pc -0.731** -0.661** -0.721**(0.313) (0.293) (0.315)
Concurrent -0.337 -0.274 -0.347(0.546) (0.576) (0.546)
Non-Partisan 0.214 0.228 0.218(0.318) (0.316) (0.318)
ELF 0.947 1.029 0.979(0.980) (0.959) (0.982)
Log Population 0.418* 0.401* 0.415*(0.222) (0.220) (0.223)
Constant -3.168 -3.394 -3.200(3.958) (3.954) (3.954)
Observations 113 113 113Log likelihood -76.88 -76.96 -76.98
Standard errors in parentheses*** p<0.01, ** p<0.05, * p<0.1
Table 3.8: Robustness tests for interaction between the independent variables of interestand limits to campaign spending.
92

3.8. Appendix: Party financing and new-party candidates
(A.13) (A.14) (A.15)VARIABLES Campaign Fund On-going Fund Media Fund
Lag NPC -0.193 0.366 -0.680(0.516) (0.401) (0.545)
Log Time (+1) 2.008** 0.639 0.379(0.879) (0.400) (0.752)
Log GDP pc 0.976 1.251*** 1.008(0.685) (0.433) (0.646)
Spending limits 2.396** 0.475 -0.879(1.143) (0.719) (0.885)
Concurrent 4.499*** -0.119 -3.297**(1.383) (0.701) (1.325)
Non-Partisan -2.094** -0.463 0.933(1.024) (0.548) (0.850)
ELF -6.227** 3.741** 6.299**(2.539) (1.696) (2.978)
Log Population -1.665** 0.575* 2.354***(0.670) (0.305) (0.605)
Constant 15.25* -21.97*** -49.41***(8.587) (6.292) (12.30)
Observations 95 95 95Log likelihood -27.16 -47.43 -25.12
Standard errors in parentheses*** p<0.01, ** p<0.05, * p<0.1
Table 3.9: Robustness tests for endogeneity.
93

Chapter 3. Party financing and new-party candidates
94

Chapter 4
Party collapse and new party entry
95
Chapter 4. Party collapse and new party entry
Abstract
The entry and success of new parties has become a regular event in modern democra-
cies. From the emergence of green to protest parties, new movements have entered the
electoral arena. This paper addresses one of the less studied aspects of new parties: the
dynamic process of party exit and entry into politics. The paper argues that changes to
the party system, produced by the collapse of a political party, can lead to the success-
ful entrance of new parties in the next election. The premise is that one party’s loss is
a future one’s gain. The empirical results provide strong evidence that the size of the
policy space created by a party collapse has a substantive impact on the level of new
parties’ success.
Keywords— New Political Parties, Party Supply, Open Policy Space, Party Collapse
96

4.1. Introduction
4.1 Introduction
Political parties and party systems, while ideally stable (cf. Mainwaring and Scully
1995), need to evolve in order to accommodate changes in society. If parties don’t adapt
fast enough, shifts in social demands can create programmatic space which new parties
can enter (Hug 2001, Zons 2013). Of course parties adapt to changes in society (Adams
et al. 2006, Ezrow et al. 2011, Spoon and Klüver 2014). If one looks at, for example,
the British Labour party’s manifestos during the Tony Blair government (1997-2007)
and compare them to those of Clement Attlee (Prime Minister 1945–1951), it is evident
that the party’s policy proposals changed substantially (Volkens et al. 2015). However,
adaptation by mainstream parties many not be enough to accommodate all new social
demands and new parties may still emerge. Such has been the case with environmental,
anti-immigrant and regional autonomy parties, among others, in Europe (cf. Meguid
2005, 2008).
When do new parties emerge? This paper argues that an opportunity for successful
entry is created when a party collapses (i.e. loses more than 50% of the vote share
it held in the previous election). A party collapse leaves a group of voters without
adequate representation, creating space for new parties to enter in the next election. If
this is the case, a larger space created by a collapse could lead to higher vote shares for
new parties. But this effect would depend on the permissibility of electoral formula.
In proportional systems the threshold for getting into the legislature is relatively low,
making it easier for new parties to transform opportunities into seats. However, in
countries with plurality formulas barriers to entry are high, potentially discouraging
new entries even when space is open.
The study contributes to the spatial literature on political parties and the understand-
ing of how changes in the party system can generate opportunities for new parties to
enter, focusing on within country variations to explain these transformations. Starting
with spatial arguments on the number of parties and their location, there is a broad lit-
erature that argues that new parties enter when there is open policy space that has been
neglected (or inadequately represented) by existing parties (see Downs 1957, Kitschelt
97
Chapter 4. Party collapse and new party entry
1988, Rohrschneider 1993, Cox 1997, Hug 2001, Meguid 2008, among others). This
study extends the argument by testing the impact of opportunities created after a party
collapses. In other words, when policy space (that was once occupied) opens because
of errors committed by an existing party. To my knowledge the current study is the first
to empirically measure the effect of party exit on new party entry using data for multiple
countries over time. The research also complements existing studies on new parties by
focusing on within country variations to explain when new parties enter. Until recently
a large majority of the literature has focused on cross-country variations, such as in-
stitutions and social cleavages (see Cox 1997, Harmel and Robertson 1985, Hug 2001,
Tavits 2006, 2008, among others). These studies provide important insights, but cannot
explain under what circumstances new parties emerge within a given institutional and
social structure.
One limitation of using an empirical approach is the endogeneity of party exit and
entry (cf. Laver and Schilperoord 2007). A party can lose votes because of their ac-
tions or policy failures. But vote loss can also be caused by new parties coming in
and actively competing for electors. Think of the Spanish 2015 general elections, the
governing Partido Popular (PP) lost its parliamentary majority while at the same time
Podemos obtained 20.66% of the votes in its first general election.1 The rise of Pode-
mos could be caused by corruption scandals in the PP or by Podemos’s anti-austerity
message, or both.2 If one looked at the exit-entry process at one point in time (say at
t) the empirical models would pick up both the effect of the collapsing party’s errors
and the new party’s efforts in gaining votes. This situation would, therefore, make it
impossible to clearly associate a new party’s results to an opening in the policy space.
To addresses the identification problem (endogeneity) this paper measures the ef-
fect of party collapse in the previous election on the vote share for new parties in the
current one. A new party in the present (t0) cannot cause a party to collapse in the past
1Election results obtained from the newspaper El País http://elpais.com/tag/elecciones_generales_2015/a/on 07-01-2016.
2Data on corruption in Spain obtained from http://www.elperiodico.com/es/temas/corrupcion-partido-popular-270 on Feb 1, 2016. Data on Podemos was obtained from http://podemos.info/programa/the same day.
98

4.2. Literature and theories on new party entry
(t−1). By estimating the impact of a party collapse (t−1), one can identify the effect
of an opening in the policy space on the results of a new party (or parties) (t0) with-
out the contamination of the new party’s behaviour. One concern would be that party
collapse (t−1) and new party entry (t0) are caused by the same time trend. However,
what is important for the argument are the characteristics of the collapsed party (e.g.
its vote share), which are measured in the election before the crash occurred (t−2). A
two election interval between the values of the dependent and independent variables
substantively reduce this concern. An example of how a party collapse can lead to a
future party entry is the crash of the Christian Democracy in Italy 1992 and the rise to
power of Silvio Berlusconi’s Forza Italia in 1994.
The empirical estimations use a broad dataset on new party entry in 33 developed
democracies between 1945 and 2011. The results provide strong evidence that the size
of the collapsed party (a measure of the space created) is associated with new party
electoral success. But the magnitude of the effect of size on new party vote share is
conditioned by the permissibility of the electoral system. The results are robust to
multiple methods of estimation, different operationalisations of the dependent variable
and controls for outliers in the sample.
The next section provides a short summary of the literature on new party entry and
a theoretical argument as to why a policy space is created when a party collapses. This
is followed by a description of the empirical strategy. The final sections of the paper
include a discussion of the empirical results and conclusions.
4.2 Literature and theories on new party entry
A first line of research on new party entry studies the impact of institutions and how
they alter the costs and benefits for new parties (cf. Cox 1997). This research identi-
fies permissive electoral systems as a strong enabler of new party entry (Harmel and
Robertson 1985, Cox 1997, Tavits 2006). It also states that certain types of public
funding for political parties are associated with a higher number of new parties (Tavits
2008, Laroze 2016). On the other hand, high levels of party regulation are associated
99
Chapter 4. Party collapse and new party entry
with lower numbers of new parties (van Biezen and Rashkova 2014). There is further
empirical evidence that country characteristics, such as the time since democratization,
the level of ethnic heterogeneity and the population are associated with the number of
new parties (Hug 2001, Tavits 2006, 2008, van Biezen and Rashkova 2014).3
A complementary perspective, and the one used in this study, centres the analyses
on policy supply. Spatial literature on political parties states that parties will emerge
when there is open policy space (see Downs 1957, Kitschelt 1988, Rohrschneider 1993,
Hug 2001, Meguid 2008, among others). If acting rationally, parties will only enter
when and where they have opportunities to gain enough votes (benefits) to counteract
the costs of competing (Cox 1997, Osborne and Slivinski 1996). This situation occurs
when enough voters are located in a policy position that is not occupied by existing par-
ties. One example of this is the emergence of green/environmentalist parties (Kitschelt
1988, Meguid 2008, Spoon 2009a). Following this argument, Zons (2013) states that
new parties are more likely to enter when there is less diversity in programmatic of-
fers. In other words, when the voters are not represented (or satisfied) with the policies
offered by existing parties.
In a variation on this argument, Laver and Schilperoord (2007) and Lago and Martínez
(2011) have looked at changes in policy supply. Laver and Schilperoord (2007) use an
agent based approach to create an endogenous model of party birth and death. The
driving mechanism they use for change is dissatisfaction with the policies offered by
existing parties in the system. The dynamics of supply and demand allow them to
observe under what circumstances, within a given institutional structure, new parties
enter. As a result, the model identifies the threshold of survival as the key limitation to
party birth. Lago and Martínez (2011) measure the effect of electoral market failures
(measured as level of turnout), seat threshold and voter elasticity (i.e. volatility) on new
party entry. In their case study of Spanish sub-national or regional elections, they find
that higher volatility is associated with a higher probability of a successful entry. On
the other hand, the threshold for getting into the legislature conditions the likelihood
3For a broader description of these finding see Lago and Martínez (2011).
100

4.2. Literature and theories on new party entry
that a potential new party can take advantage of market failures (low turnout).
Lago and Martínez (2011, p.7) argue that “market failures occur when a significant
number of individuals are left dissatisfied by the partisan choices available to them” and
that this leads to successful new party entry if there are permissible electoral formulas.
As they explain, dissatisfaction can occur because a) voters don’t perceive that parties
represent their preferences, or b) parties don’t have the flexibility to quickly adapt to
changes in society. One could add that a mismatch between voter preferences and
party offers can occur for at least two reasons. The first is the appearance of relevant
new issues. Hug (2001, p.89-99) suggests parties emerge when there are new issues
that have not been adequately covered by existing parties. A well-known example of
this is the appearance of environmental parties in Europe (and abroad) in the 1970s
(cf. Meguid 2005, Adams et al. 2006, Spoon 2009b, among others). The second is
because of errors committed by existing parties that leave voters dissatisfied and open
to alternatives or choosing not to vote. A party can lose support for multiple reasons:
involvement in a political scandal, corruption, an economic crisis, among many others
(see for example Nadeau and Lewis-Beck 2001, Duch and Stevenson 2008, Anderson
2006, Maier 2011).
Lago and Martínez’s (2011) use of low turnout as a proxy for market failures con-
trols for circumstances that can reduce opportunities for new parties to successfully
enter. However, high turnout in previous elections does not imply a market failure has
occurred. Turnout can be altered for reasons which can also correlate with successful
new party entry, including canvassing efforts, institutional changes, and relevance of
elections, among many others (Gerber and Green 2000, John G. Matsusaka 1999, Blais
2006, Feddersen 2004). This paper argues that a better way of assessing the impact
of voter dissatisfaction is by identifying substantive reductions in votes for existing
parties. Of course, turnout levels need to be controlled for, but the collapse of a po-
litical party empirically expresses a change in voter preference. Furthermore, as will
de argued in the next section, vote collapse in one election can have knock-on effects,
generating opportunities for new parties to enter in the future.
101

Chapter 4. Party collapse and new party entry
4.2.1 Viability caused by a collapsed party
Other than changes in turnout, party collapses occur when a) a large share of a party’s
former voters switch to a different party; or b) the party decides to drop out of electoral
competition. For example, if it loses confidence in being able to obtain enough votes
to compensate for campaign costs. For which ever reason it occurs, the existence of a
party collapse identifies a change in voter behaviour. This does not imply that a new
party will gain those votes; both existing and new parties are in a position to compete
for them. Nevertheless, it is argued that the existence of a party collapse can generate
space for new parties to enter in future elections.
The decision of voters to switch parties (‘swing voters’) in one election does not
imply they will keep on voting for that alternative in the future. Political identity and
biases against other parties can limit a citizen’s willingness to vote for an opposing
party, even if they are dissatisfied with the party they usually vote for (see Green et al.
2004, Iyengar et al. 2012, Bartels 2002, Tajfel et al. 1971, among others). Biases against
existing opposition parties can make a new party attractive, by giving voters an alterna-
tive to their unsatisfactory party without generating social identity costs. Furthermore,
when a party loses more than 50% of its vote share, doubts can be created about its
future viability. Supporters of a collapsed party can be expected to question the likeli-
hood of the party achieving satisfactory results in the future. If so, any voters still loyal
to the party would have incentives to look around for a more viable alternative.
For a party crash to open viable opportunities for a new party to enter, the collapsed
party would need to have held a large vote share in the past, or at least been attractive
to many voters. Larger collapsed parties can inject higher shares of swing voters into
the system. For example, a party who used to control 30% of the votes would need to
have lost, at least, 15% of the total vote share to classify as a collapsed party, leaving a
large group of people with unsatisfactory representation. On the contrary, small parties
(e.g. 3% vote share) would not generate as many dissatisfied voters, even if it lost all
of its support.
The problem is that, even if the collapse of a party can open policy space, both new
102

4.2. Literature and theories on new party entry
and existing parties have incentives to compete for those voters. New parties can be
expected to appeal to swing voters in an attempt at a successful entry. But existing
parties have incentives to cater to the same group in order to increase their current vote
share and drive away new competition. However, a complete policy shift by existing
parties may or may not be feasible (cf. Robertson 1976, Zons 2013). Internal party
politics can limit the magnitude of the shift, especially if it affects party members’
probabilities of re-election. A move too far into the collapsed party’s location can
alienate voters on the other extreme of the party and threaten current legislators’ seats.
Active party members could become disaffected with the new policy pledges and stop
working for the campaign. Large party donors could also withdraw financial support if
the policy shifts go beyond their preferences. Furthermore, a large shift in the policy
position of a party with a long-standing policy tradition may not be credible to voters
(Tavits 2007). Take, for example the disaffection of some traditional Labour voters with
the more centrist New Labour policies, and the effect this had (among other factors) on
the collapse of the Labour vote in the 2015 General Election in Scotland where voters
turned to the more left–wing Scottish Nationalist Party (Volkens et al. 2015).4 A party
collapse can thus open space for new parties to enter. This space is between the mean
location of the collapsed party and the closest to that position that the existing party or
parties are able to relocate.
A party crash can also have an effect on new party entry through the collapsed
party’s location on the policy space. Assume any non-flat voter distribution over a
left–right scale. If a party collapses in a location where there are a large proportion of
voters this would leave them without adequate representation. As preference distribu-
tions do not necessarily match vote distributions, the inadequately represented voters
would include potential and effective former collapsed party supporters. A new party
can come in and attempt to capture all voters at that location, including those that did
not previously support the collapsed party.
4For public opinion data see the British Election Study http://www.britishelectionstudy.com/data,last accessed October, 26 2015. Information of the British General Election results can be found inhttp://researchbriefings.parliament.uk/ResearchBriefing/Summary/CBP-7186 last accessed October, 262015.
103
Chapter 4. Party collapse and new party entry
Identifying true preference distributions is a complex task. Past electoral results
only provide expressed voter preferences that are dependent on the parties in competi-
tion. Results from surveys can get closer, but it is unlikely that citizens can dissociate
their preferences on left–right policies from existing party supply. However, if one as-
sumes preferences to be loosely normally distributed, one can expect more space to
open when a party collapses towards the centre of the left–right ideological scale than
on the extremes.
An opening of a policy space may not be enough to convince potential supporters
of the viability of a new party. Electoral rules, such as the type of electoral system
can limit a new party’s possibilities of transforming votes into seats. For example in a
first-past-the-post (FPTP) system, a party collapse that generated a large open policy
space equivalent to 15% of the national votes may not be enough to get a party into
office. Unless those votes are territorially concentrated, even a new party that manages
to absorb the full extent of those votes may not have enough to win a seat (because of
the high entry thresholds), making the new party a risky/un-viable option (cf. Duverger
1959, Cox 1997). This would not be the case in countries with proportional electoral
rules where the seat threshold is substantially lower. If one assumes that voters under-
stand how elections work in their country to adjust their expectations accordingly, then
one could expect them to react less to the opening of a policy space under FPTP than
in PR.
Given the arguments stated above, one can predict:
H1 The share of votes obtained by the collapsed party (before it crashed) to be posi-
tively associated with the electoral results for new parties, ceteris paribus.
H2 The left–right location of the collapsed party to be negatively associated with the
vote shares for new parties, with parties at the extremes generating less space for
new party entry, ceteris paribus.
H3 The effect of a collapsed party to be moderated by the type of electoral system,
ceteris paribus. In elections with FPTP electoral rules one would expect the effect
104
4.3. Estimation strategy and data
of size and location to be lower than under PR.
4.3 Estimation strategy and data
The hypotheses are tested using panel estimations on a time-series cross-sectional dataset
including elections in 33 developed democracies between 1945 and 2011. Table 4.1
presents a list of the countries and years included in the sample. The dependent and
independent variables of interests are created and recoded from the Döring and Manow
(2012) dataset on political parties. The original data includes information on over 1400
parties in the European Union and most parliamentary OECD countries.
The dependent variable is the sum of vote shares obtained by new parties at each
election. Following the influential research by Hug (2001, p. 14), ‘new parties’ are
defined as “a genuinely new organization that appoints, for the first time, candidates
at a general election to the system’s representative assembly.” This definition excludes
electoral alliances and fusions (party mergers), but counts as new parties those that
result from fissions of existing parties or emerge independently (Tavits 2006, Zons
2013).
The independent variables of interest are: 1) The share of votes held by the col-
lapsed party the election before it crashed (t−2). Operationally defining a ‘collapsed
party’ as one that loses more than 50% of the vote share it held in the previous elec-
tion. For example if in election t−2 the party had obtained 30% of the valid votes and
in election t−1 it only won 14.5% of the votes, the party would count as collapsed.
This implies a party can collapse more than once in the dataset. The 50% threshold is
used as it represents a substantive proportion of a party’s vote share and losing such a
large amount of votes can cast doubts as to the future viability of that party. The un-
certainty generated around the collapsed party’s viability is what can open policy space
for new parties to enter. Robustness tests using a 70% threshold or only counting as
collapsed parties that completely exited the electoral arena produce equivalent results
(tables in Appendix). Parties that drop out of the electoral competition altogether are,
of course, counted as collapsed, but parties that merge with others or form alliances
105
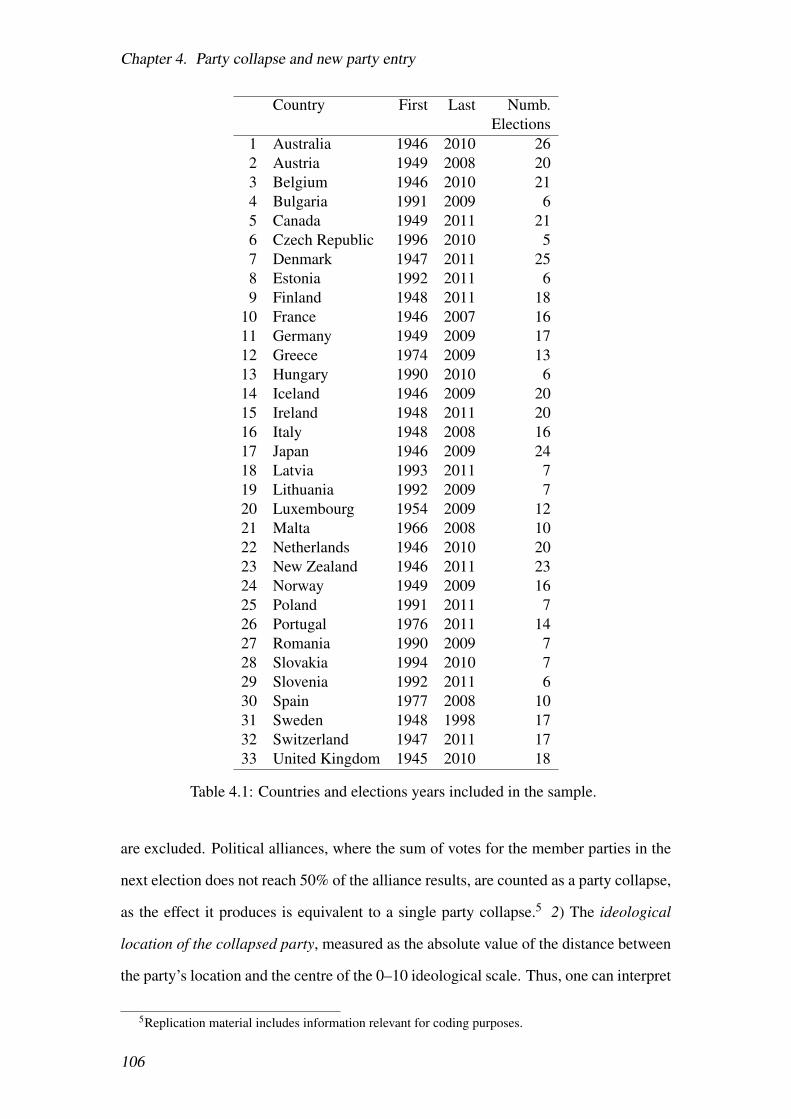
Chapter 4. Party collapse and new party entry
Country First Last Numb.Elections
1 Australia 1946 2010 262 Austria 1949 2008 203 Belgium 1946 2010 214 Bulgaria 1991 2009 65 Canada 1949 2011 216 Czech Republic 1996 2010 57 Denmark 1947 2011 258 Estonia 1992 2011 69 Finland 1948 2011 18
10 France 1946 2007 1611 Germany 1949 2009 1712 Greece 1974 2009 1313 Hungary 1990 2010 614 Iceland 1946 2009 2015 Ireland 1948 2011 2016 Italy 1948 2008 1617 Japan 1946 2009 2418 Latvia 1993 2011 719 Lithuania 1992 2009 720 Luxembourg 1954 2009 1221 Malta 1966 2008 1022 Netherlands 1946 2010 2023 New Zealand 1946 2011 2324 Norway 1949 2009 1625 Poland 1991 2011 726 Portugal 1976 2011 1427 Romania 1990 2009 728 Slovakia 1994 2010 729 Slovenia 1992 2011 630 Spain 1977 2008 1031 Sweden 1948 1998 1732 Switzerland 1947 2011 1733 United Kingdom 1945 2010 18
Table 4.1: Countries and elections years included in the sample.
are excluded. Political alliances, where the sum of votes for the member parties in the
next election does not reach 50% of the alliance results, are counted as a party collapse,
as the effect it produces is equivalent to a single party collapse.5 2) The ideological
location of the collapsed party, measured as the absolute value of the distance between
the party’s location and the centre of the 0–10 ideological scale. Thus, one can interpret
5Replication material includes information relevant for coding purposes.
106
4.3. Estimation strategy and data
higher values as being further away from the centre of the policy space. Party locations
are taken from expert surveys.6 As more than one party can collapse at one point in
time, the variable measures the mean location of the collapsed parties at each election.
3) Permissibility of the electoral formula, included as mean district magnitude and as a
dummy variable for FPTP electoral formulas.7
As indicated in the introduction, if one simply looks at the co-occurrence of new
party entry and parties collapsing it is very difficult to identify what causes what. New
parties can introduce a new policy agenda that causes existing parties to lose votes, or
they could enter because an existing party has lost support (cf. Levitsky and Cameron
2003, Roberts 1996). Both of these scenarios would look the same in terms of electoral
results. For this reason, the empirical analysis focuses on the lagged effect of party
collapse and its characteristics.
To control for potential confounding variables that can affect both the likelihood of
a party collapsing and new party entry, the empirical models are estimated including:8
1) the existence of compulsory voting (yes/no), 2) percentage of turnout,9 3) a control
for the effect of time, measured as the log of the number of elections since democratiza-
tion (+1). This is included because Tavits (2008) argues that the number of new parties
decreases as the democracies age and time can also have an effect on the stability of
the party system; 4) the number of parties in competition in the past election, to con-
trol for the amount of policy supply available in the party system before the new party
entered,10 5) controls for population (logged), 6) the state of the economy (percentage
change GDP per capita (with respect to the year before the election), and 7) inflation
(logged)).11 Robustness models were also estimated, including the legal threshold to
obtain a seat in parliament (Laver and Schilperoord 2007) (data from IDEA interna-
6The ideological locations are provided in the Döring and Manow (2012) dataset and correspond todata obtained from expert surveys published in Castles and Mair (1984), Huber and Inglehart (1995),Benoit and Laver (2006), and Chapel Hill expert survey series (CHESS) 2010.
7 Obtained from Bormann and Golder (2013).8Literature regarding the impact of these variables on new party entry include (Hug 2001, Tavits
2006, 2008, Zons 2013, Carreras 2012).9The data for compulsory voting and turnout were obtained from
http://www.idea.int/vt/viewdata.cfm, on October 10, 2015.10Measured as the absolute number of parties that competed.11Data collected from the World Bank using the “WDI” package in R.
107
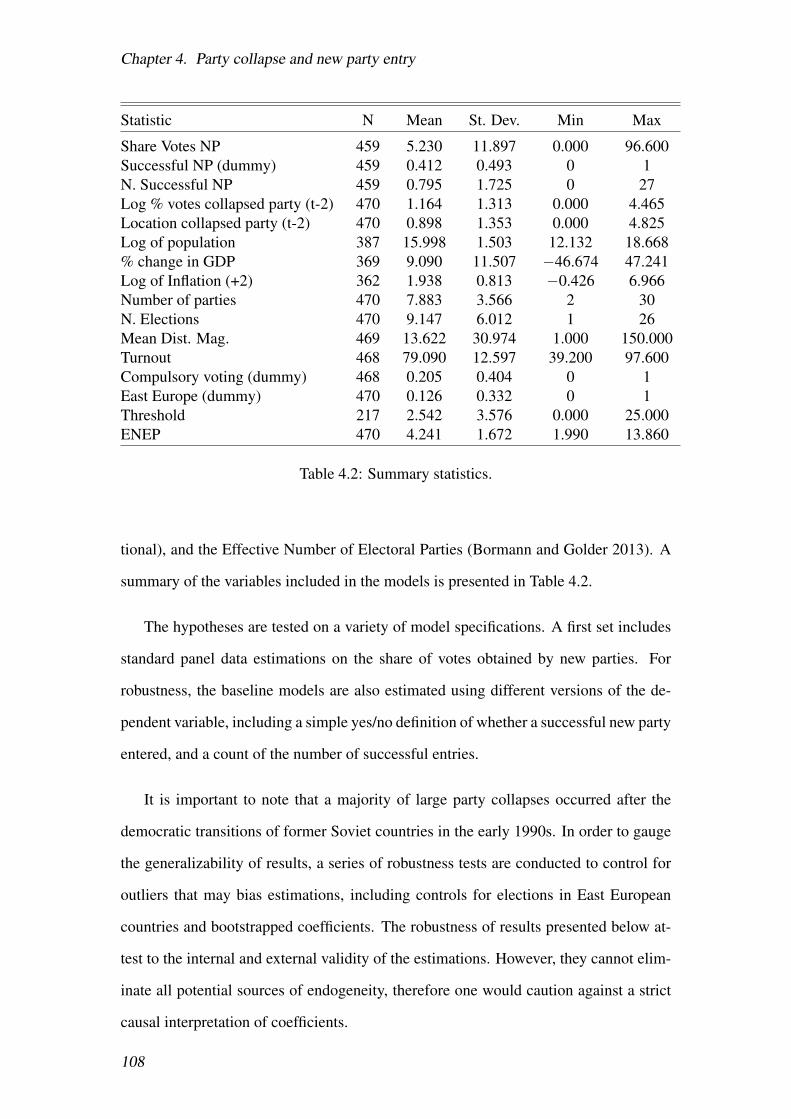
Chapter 4. Party collapse and new party entry
Statistic N Mean St. Dev. Min Max
Share Votes NP 459 5.230 11.897 0.000 96.600Successful NP (dummy) 459 0.412 0.493 0 1N. Successful NP 459 0.795 1.725 0 27Log % votes collapsed party (t-2) 470 1.164 1.313 0.000 4.465Location collapsed party (t-2) 470 0.898 1.353 0.000 4.825Log of population 387 15.998 1.503 12.132 18.668% change in GDP 369 9.090 11.507 −46.674 47.241Log of Inflation (+2) 362 1.938 0.813 −0.426 6.966Number of parties 470 7.883 3.566 2 30N. Elections 470 9.147 6.012 1 26Mean Dist. Mag. 469 13.622 30.974 1.000 150.000Turnout 468 79.090 12.597 39.200 97.600Compulsory voting (dummy) 468 0.205 0.404 0 1East Europe (dummy) 470 0.126 0.332 0 1Threshold 217 2.542 3.576 0.000 25.000ENEP 470 4.241 1.672 1.990 13.860
Table 4.2: Summary statistics.
tional), and the Effective Number of Electoral Parties (Bormann and Golder 2013). A
summary of the variables included in the models is presented in Table 4.2.
The hypotheses are tested on a variety of model specifications. A first set includes
standard panel data estimations on the share of votes obtained by new parties. For
robustness, the baseline models are also estimated using different versions of the de-
pendent variable, including a simple yes/no definition of whether a successful new party
entered, and a count of the number of successful entries.
It is important to note that a majority of large party collapses occurred after the
democratic transitions of former Soviet countries in the early 1990s. In order to gauge
the generalizability of results, a series of robustness tests are conducted to control for
outliers that may bias estimations, including controls for elections in East European
countries and bootstrapped coefficients. The robustness of results presented below at-
test to the internal and external validity of the estimations. However, they cannot elim-
inate all potential sources of endogeneity, therefore one would caution against a strict
causal interpretation of coefficients.
108

4.4. Data analyses
Figure 4.1: Share of votes obtained by new parties. The left panel displays the densityof the share of votes. The right panel provides the density of the logged share of votes.
4.4 Data analyses
The sum of vote shares obtained by new parties in a given election (dependent variable)
has a substantive level of variation. As can be observed in the left panel of Figure 4.1,
in a majority of elections new parties gain a very small amount of votes. In a 50% of
the elections, new parties obtain a negligible 0.16% of votes. However, at the 95th per-
centile new parties receive 28.82% of votes, illustrating how much impact new parties
can have on a party system.
Figure 4.1 also indicates that the values of the dependent variable are not normally
distributed. As with any voting model, the values can never be below zero (or above
100) and the distribution is considerably skewed to the right. The skewness in the
distribution can lead to problems of heteroskedasticity in linear model estimations. For
this reason, a log transformed version of the dependent variable (Figure 4.1 right panel)
is used for the statistical analyses.12
12Models on the share of votes for new parties (not transformed), produced the same substantiveresults. However, post estimation tests confirm the presence of heteroskedasticity. Data available inreplication material.
109

Chapter 4. Party collapse and new party entry
Figure 4.2: Scatter plot of the location of the collapsed party and the vote share it heldbefore the crash. Location is the absolute distance from the centre (i.e. 5 in the 0–10left–right ideological scale)
A potential source of concern with the empirical estimations is a correlation be-
tween the share of votes previously held by collapsed parties and their location on the
left–right scale. If this is the case, the variables could be measuring the same phe-
nomenon and including both in the model would lead to problems of multicollinearity.
However, in the sample, both variables are only correlated at 0.32. Figure 4.2 presents
a scatter plot of collapsed party size and location, with the black line representing the
correlation coefficient. As can be observed, there is some correlation, but not enough
to strongly influence the results.
Models M1-3 in Table 4.3 present the estimations for collapsed party size (log %
of vote share (t−2)) and location (t−2) with pooled and fixed effects (FE) estimations.13
Collapsed party size is log transformed to maintain scale equivalence with the depen-
dent variable. The variables of interest are lagged by two elections because they indi-
cate the location and size of the collapsed party before it crashed; and the crash occurs
(t−1) the election before new party entry (t0). For robustness, these models are also
13Models using a first difference estimation produce the same results (see replication material).
110

4.4. Data analyses
estimated using alternative control variables including the effective number of electoral
parties (t−1) (in exchange from number of parties in t−1), the legal threshold for obtain-
ing a seat and a FPTP dummy instead of the mean district magnitude. The results of
these robustness tests are in the Appendix and they do not alter the conclusions.
M1 M2 M3Pooled FE FE Interaction
Log % votes collapsed party (t-2) 0.26∗∗∗ 0.13∗ 0.12·
(0.05) (0.06) (0.07)Location collapsed party (t-2) −0.09∗ −0.10∗ −0.11∗
(0.04) (0.05) (0.05)FPTP (dummy - Yes) −1.08∗∗
(0.39)FPTP * log % collapsed party (t-2) 0.07
(0.13)Log of population −0.02 1.20 1.07
(0.04) (1.01) (1.01)% change in GDP −0.00 −0.00 −0.01
(0.01) (0.01) (0.01)Log inflation (+2) −0.09 −0.13 −0.11
(0.10) (0.10) (0.10)Number of parties (t-1) 0.00 −0.10∗ −0.11∗∗
(0.02) (0.04) (0.04)Log time (+ 1) −0.16
(0.11)Mean Dist. Mag. 0.00 −0.04·
(0.00) (0.02)Turnout −0.01· 0.01 0.02
(0.01) (0.01) (0.01)Compulsory voting (Yes) 0.26· −0.58 −0.87·
(0.15) (0.49) (0.50)Log vote share NP (t-1) 0.07 −0.05 −0.04
(0.05) (0.06) (0.06)Intercept 2.46∗
(1.08)R2 0.16 0.06 0.07Adj. R2 0.15 0.05 0.06Num. obs. 333 333 334∗∗∗p < 0.001, ∗∗p < 0.01, ∗p < 0.05, ·p < 0.1 M1 has Arellano-Bond s.e. in parenthesis,
M2-3 present s.e. with White’s correction AR1 and heteroskedasticity
Table 4.3: Empirical models on the association between size of party crash, its locationand interaction of size with electoral system. The dependent variable is the logged voteshare for new parties.
M1 presents a basic model which includes the two main variables of interest in a
111

Chapter 4. Party collapse and new party entry
pooled estimation.14 The model includes a control for the lagged dependent variable, to
deal with potential problems of autocorrelation in the data. More importantly, a control
for lagged new party success can account for possible confounding effects. The suc-
cess of new parties in the previous elections could have caused a party to collapse and
generate expectations for new party success in the future, leading to omitted variable
bias if it’s not included.
As predicted by hypothesis H1, M1 presents a statistically significant and positive
association between collapsed party size and new party entry. New parties appear to
be winning roughly one fourth of former collapsed party vote share, ceteris paribus.
The magnitude if this effect is large and consistent with the argument that the opening
of a policy space (produced by the collapse of a large political party) can generate
opportunities for new parties to successfully enter. Of course these are aggregate results
and it is not possible to know who the new party voters are, whether they were former
collapsed party supporters or not. They do, nevertheless, suggest that the collapse of a
medium to large party can have a substantive impact on the electoral outcomes of new
parties.
The effect of location is negative, as predicted by H2, suggesting the share of votes
for new parties are higher when party crashes occur closer to the centre of the policy
space. The magnitude of its effect is low, with a one point increase in extremeness
of party location associated with less than one percentage point increase in new party
vote share (e−0.09 = 0.91), ceteris paribus. This is a small effect considering location
is measured on a 0–5 scale, with parties at the centre allocated 0 and parties at either
extreme of the left–right scale 5. Therefore, differences in the location of the collapsed
parties do not produce substantive effects on new party vote shares, if one controls for
the size of the collapsed party.
Models M2-3 re-estimate M1 accounting for unit and time fixed effects in the data,
14To adjust for country level autocorrelation, the results in models M1 include Arellano-Bond cor-rected standard errors. This correction is not available for M2-3 model specifications so White’s correc-tion for first order autocorrelation and heteroskedasticity are used. M1 is also estimated with White’scorrection and present the same patterns as in Table 4.3. The results are available in the replicationmaterial.
112
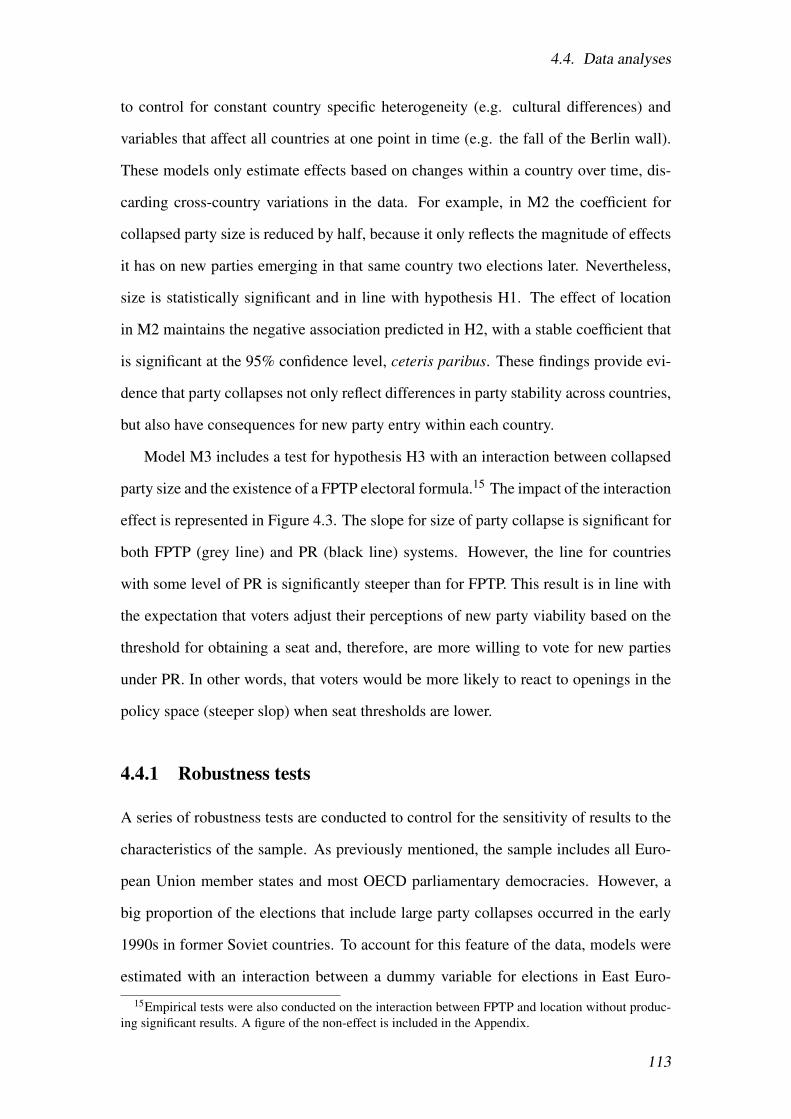
4.4. Data analyses
to control for constant country specific heterogeneity (e.g. cultural differences) and
variables that affect all countries at one point in time (e.g. the fall of the Berlin wall).
These models only estimate effects based on changes within a country over time, dis-
carding cross-country variations in the data. For example, in M2 the coefficient for
collapsed party size is reduced by half, because it only reflects the magnitude of effects
it has on new parties emerging in that same country two elections later. Nevertheless,
size is statistically significant and in line with hypothesis H1. The effect of location
in M2 maintains the negative association predicted in H2, with a stable coefficient that
is significant at the 95% confidence level, ceteris paribus. These findings provide evi-
dence that party collapses not only reflect differences in party stability across countries,
but also have consequences for new party entry within each country.
Model M3 includes a test for hypothesis H3 with an interaction between collapsed
party size and the existence of a FPTP electoral formula.15 The impact of the interaction
effect is represented in Figure 4.3. The slope for size of party collapse is significant for
both FPTP (grey line) and PR (black line) systems. However, the line for countries
with some level of PR is significantly steeper than for FPTP. This result is in line with
the expectation that voters adjust their perceptions of new party viability based on the
threshold for obtaining a seat and, therefore, are more willing to vote for new parties
under PR. In other words, that voters would be more likely to react to openings in the
policy space (steeper slop) when seat thresholds are lower.
4.4.1 Robustness tests
A series of robustness tests are conducted to control for the sensitivity of results to the
characteristics of the sample. As previously mentioned, the sample includes all Euro-
pean Union member states and most OECD parliamentary democracies. However, a
big proportion of the elections that include large party collapses occurred in the early
1990s in former Soviet countries. To account for this feature of the data, models were
estimated with an interaction between a dummy variable for elections in East Euro-
15Empirical tests were also conducted on the interaction between FPTP and location without produc-ing significant results. A figure of the non-effect is included in the Appendix.
113

Chapter 4. Party collapse and new party entry
Figure 4.3: Scatter plot of the interaction effect of collapsed party size and electoralformula. The graph presents the predicted new party vote shares based on the results ofmodel M7.
pean countries (that became democratic after 1990) and the variables of interest. The
coefficient tables for these results are in the Appendix.
The interaction effect of East European elections is evident in figures 4.4 and 4.5.
On the left panel (Figure 4.4) one can observe the interaction with the size of the col-
lapsed party. The grey line represents the predicted new party vote share in East Euro-
pean counties and the black line represents all the rest. As can be seen, the effect of size
is stronger in East European countries; nevertheless, the slope for other counties is still
significant. The interaction with location is on the right panel (Figure 4.5); again the
slope for East European elections is substantive and significant, but the straight black
line indicates location is not a relevant predictor for other countries. One reason for
this is could be that, given a shorter electoral history in newer democracies, location is
a stronger cue about the potential for obtaining votes than in established democracies.
In countries with longer electoral histories voters can rely on actual vote shares as a
guideline for the policy space once held by a party. However, in new democracies, vot-
ers have less trustworthy information about parties’ electoral trajectories and how many
people they represent, and can rely on location as an estimate for a longer term vote po-
114

4.4. Data analyses
Figure 4.4: Predicted log vote share fornew parties, interaction of East Europeancountry dummy with size.
Figure 4.5: Predicted log vote share fornew parties, interaction of East Europeancountry dummy with location (right).
tential.16 Nevertheless, more research including other developing countries would have
to be conducted in order to fully explain this difference.
A set of bootstrapped estimations are conducted to control for any other outliers
or characteristics of the sample that could bias results. Figures 4.6 and 4.7 present
histograms of bootstrapped coefficients for size and location, produced by 10,000 es-
timations of randomly selected countries from the sample. The vertical lines in the
graphs mark the 95% confidence level. The coefficients for size are systematically pos-
itive and significantly different from zero. However, that is not the case for location.
Equivalent results are produced in estimations that randomly select among elections in
the sample (results in Appendix). The results provide evidence of an effect for size of
the collapsed party, but not for its location. It is likely that the significant effects of
location in the first models are capturing its relevance in East European countries, but
this is not sustained for other countries in the sample.
Further robustness tests include sensibility of the results to the operationalisation of
the dependent variable. The literature on new party entry uses two other definitions, a
count of the successful number of new parties in competition (Hug 2001, Tavits 2006,
16For a similar argument on the importance of clear policy positions in new democracies see Ezrowet al. (2014)
115

Chapter 4. Party collapse and new party entry
Figure 4.6: Bootstrap coef. on collapsedparty size.
Figure 4.7: Bootstrap coef. on collapsedparty location.
2008) and a binary yes/no existence of successful new parties (Lago and Martínez 2011,
Zons 2013). Over all, the discrete versions of the dependent variable provide evidence
in favour of the effect of collapsed party size (hypothesis H1). However, the results
for location only reach standard levels of statistical significance for the number of new
parties, but not in their existence (yes/no dummy). The same goes for the interaction
effect of FPTP on collapse party size, which only reaches a 90% confidence level for the
number of new parties (joint hypothesis p-value 0.061) and is not present for new party
entry. These findings cast doubt as to the impact location (H2) and the moderating effect
of FPTP (H3), on the new party entry phenomenon as a whole (results in Appendix).
4.5 Conclusions
The emergence of relevant new political parties is an important phenomenon present
in most modern democracies. From ecological movements to protest parties, new po-
litical parties regularly enter electoral competition and attempt to establish themselves
as viable alternatives (Hug 2001, Tavits 2008, Meguid 2008, Spoon 2009a, Zons 2013,
among many others). There is strong evidence that structural factors such as electoral
institutions and party financing have an impact on successful entry. However, less is
116

4.5. Conclusions
known about how the dynamics of the party system play a role in the success of new
party entry. This paper sheds light on this aspect by testing the impact of changes in
the viability on new party entry caused by the collapse of an existing party.
The empirical analyses present robust evidence that new parties obtain higher elec-
toral outcomes the larger the vote share previously held by the collapsed party. The
result corresponds with the hypothesis that party crashes open policy space for new
parties to successfully enter an electoral competition. These effects are sustained in-
dependently of how successful new party entrance is defined, be it as the vote share
for new parties, the presence of a successful new party or a count of how many en-
tered a given election. The results are also robust to controls for outliers and specific
characteristics of the sample, such as elections in young East European democracies.
In line with previous research on the impact of electoral institutions, the evidence
here suggests that new party success is less likely in elections under plurality (FPTP)
electoral formulas (cf. Lago and Martínez 2011). The predicted moderating effect of
FPTP on the impact of the size of a party collapse is corroborated to a certain extent.
However, the results indicate that there is more likely to be impact on the share of votes
obtained by new parties than on new parties entering or gaining a seat in office.
The evidence in favour of an impact of the location of the collapsed party on the
left–right policy space is not strong. A first set of estimations hint at a negative as-
sociation, with collapsed parties at the extremes less likely to create opportunities for
new party entry. However, this result is only evident for East European countries and
cannot be generalized to other democracies. It is possible that the effect of location is
present in countries that are less institutionalized or with a shorter democratic history,
but more research would have to be conducted including new democracies from outside
the former Soviet sphere.
Research into how changes in the party system can affect new party entry is still
fairly scarce. Until recently most of the evidence has been based on cross-country vari-
ation that explains why some party systems are more stable while others have a regular
presence of new actors. Much less is known about what conditions can lead to the
117

Chapter 4. Party collapse and new party entry
emergence of a relevant new actor within an existing institutional setting. This paper
proposes one such situation occurring when an existing party losses a substantial num-
ber of votes, leaving a group of dissatisfied voters willing to give new alternatives an
opportunity. However, there is still much to study regarding what conditions can lead to
changes within a party system. One possibility is that new party success in a neighbour-
ing country can generate contagion effects on the new party entry (cf. Zachary Elkins
2005, Gilardi 2010, 2013, Ward and Cao 2012, among others). For example Böhmelt
et al. (2016) find evidence that parties adjust policy positions in reaction to foreign party
results. It is possible that external influences can inform potential new parties about the
viability of their policy proposals and condition their entry.
118

4.6. Appendix: Party collapse and new party entry
4.6 Appendix: Party collapse and new party entry
Country Election Date Party Name Vote Share (t-2)
1 Latvia 1990-04-29 Popular Front of Latvia 68.202 Romania 1990-05-20 National Salvation Front 66.303 Malta 1947-10-27 Malta Labour Party 59.904 Bulgaria 1997-04-19 United Democratic Forces 52.265 Czech Republic 1990-06-09 Civic Forum 49.506 Italy 2001-05-13 Freedom Pole 45.577 Lithuania 1992-11-25 Democratic Labour Party of Lithuania 43.988 Greece 2009-10-04 Panhellenic Socialist Movement 43.909 Bulgaria 1994-12-18 Bulgarian Socialist Party 43.50
10 Hungary 2006-04-09 Hungarian Socialist Party 43.2011 Canada 1988-11-21 Progressive Conservative Party of Canada 42.6712 Ireland 2007-05-24 Fianna Fail (Soldiers of Destiny) 41.6013 Spain 1979-03-01 Union of the Democratic Centre 35.1014 Belgium 1965-05-23 Francophone Christian Social Party 34.45
and Flemish Christian People’s Party15 Poland 1997-09-21 Solidarity Electoral Action 33.8316 Latvia 1993-06-06 Latvian Way 32.4117 Estonia 1995-03-05 Coalition Party and Rural Union 32.2318 Lithuania 1996-10-20 Homeland Union 31.3419 Italy 1948-04-18 Popular Democratic Front 31.0020 Slovenia 2008-09-21 United List – Social Democrats 30.4521 Romania 1996-11-03 Romanian Democratic Convention 30.1722 Italy 1992-04-05 Christian Democrats 29.7023 Slovakia 1990-06-09 Public against Violence 29.3024 Lithuania 2004-10-24 Labour Party 28.4025 Japan 1996-10-20 New Frontier Party 28.0426 Belgium 1977-04-17 Belgian Socialist Party 27.0027 Austria 1999-10-03 Freedom Party of Austria 26.9028 Italy 1987-06-14 Communist Party 26.6029 Slovakia 1998-09-26 Slovak Democratic Coalition 26.3030 France 1946-11-10 Popular Republican Movement 26.0031 France 1973-03-04 Gaullists 26.0032 Hungary 1990-04-08 Hungarian Democratic Forum 24.7033 Bulgaria 2005-06-25 National Movement Simeon II 22.9034 Slovenia 2004-10-03 Liberal Democracy of Slovenia 22.8035 United Kingdom 1987-06-11 SDP–Liberal Alliance 22.6036 Bulgaria 1997-04-19 Democratic Left 22.0737 Estonia 1992-09-20 National Coalition Party "Pro Patria" 22.0038 France 1951-06-17 Gaullists 22.0039 Latvia 1990-04-29 Communist Party of the Soviet Union 21.5040 Lithuania 1992-11-25 Sajudis coalition 21.1741 Belgium 1968-03-31 Liberal Party 20.9042 New Zealand 1981-11-28 Social Credit / Democratic Party 20.6543 Canada 1988-11-21 New Democratic Party 20.22
Table 4.4: Table listing the largest parties that crashed in the sample. The table includesall crashed parties that previously held > 20% of the votes. Some alliances such asFreedom Pole Italy 2001 are included, because the sum of alliance members lost atleast 50% of their votes in the next election.
119

Chapter 4. Party collapse and new party entry
A.M1 A.M2 A.M3 A.M4 A.M5 A.M6 A.M7Pooled pooled pooled RE FE Two-way Interaction
% votes collapsed party (t-2) 0.26∗∗∗
(0.04)Log % votes collapsed party (t-2) 0.29∗∗∗ 0.26∗∗∗ 0.28∗∗∗ 0.11∗ 0.13∗ 0.12·
(0.06) (0.06) (0.06) (0.05) (0.06) (0.07)Location collapsed party (t-2) −0.53· −0.09∗ −0.09· −0.09∗ −0.08· −0.10∗ −0.11∗
(0.31) (0.04) (0.05) (0.04) (0.04) (0.05) (0.05)FPTP (dummy - Yes) −1.08∗∗
(0.39)FPTP * log % collapsed party (t-2) 0.07
(0.13)Log of population −0.04 −0.03 −0.02 −0.03 2.26∗∗ 1.20 1.07
(0.36) (0.05) (0.04) (0.05) (0.72) (1.01) (1.01)% change in GDP −0.01 −0.00 −0.00 −0.00 −0.00 −0.00 −0.01
(0.05) (0.01) (0.01) (0.01) (0.01) (0.01) (0.01)Log inflation (+2) −1.27 −0.09 −0.09 −0.09 −0.16 −0.13 −0.11
(0.81) (0.09) (0.10) (0.09) (0.10) (0.10) (0.10)Number of parties (t-1) 0.15 0.01 0.00 0.01 −0.08∗∗ −0.10∗ −0.11∗∗
(0.17) (0.02) (0.02) (0.02) (0.03) (0.04) (0.04)Log time (+ 1) −1.78 −0.17 −0.16 −0.17 −0.27
(1.11) (0.11) (0.14) (0.11) (0.34)Mean Dist. Mag. 0.00 0.00 0.00 0.00 −0.04∗ −0.04·
(0.01) (0.00) (0.00) (0.00) (0.02) (0.02)Turnout −0.03 −0.01· −0.01∗ −0.01· 0.01 0.01 0.02
(0.07) (0.01) (0.01) (0.01) (0.02) (0.01) (0.01)Compulsory voting (Yes) 1.03 0.27· 0.26 0.27· −0.59∗ −0.58 −0.87·
(1.28) (0.16) (0.17) (0.16) (0.29) (0.49) (0.50)Log vote share NP (t-1) 0.07 −0.07 −0.05 −0.04
(0.06) (0.05) (0.06) (0.06)Intercept 11.38 2.57∗ 2.46∗ 2.67∗
(10.79) (1.13) (0.97) (1.16)R2 0.19 0.15 0.16 0.15 0.07 0.06 0.07Adj. R2 0.18 0.15 0.15 0.15 0.06 0.05 0.06Num. obs. 333 333 333 333 333 333 334∗∗∗p < 0.001, ∗∗p < 0.01, ∗p < 0.05, ·p < 0.1 Arellano-Bond s.e. in parenthesis M1-5. White s.e. M6-7
Table 4.5: Empirical models on the association between size of party crash, its locationand interaction of size with electoral system. The dependent in M1 is the sum of votesobtained by new parties in the first legislative election they participated. Model M2-7use a logged version of the dependent variable (+1).
120

4.6. Appendix: Party collapse and new party entry
A.M8 A.M9 A.M10Pooled FE FE Interaction
Log % votes collapsed party (t-2) 0.26∗∗∗ 0.19∗ 0.18∗
(0.07) (0.08) (0.08)Location collapsed party (t-2) −0.04 −0.07 −0.07
(0.06) (0.06) (0.06)FPTP (dummy - Yes) 0.12 −0.39 −0.71
(0.26) (0.67) (0.67)FPTP * log % collapsed party (t-2) 0.23
(0.22)Log of population 0.01 −2.33 −2.39
(0.07) (1.75) (1.76)% change in GDP −0.00 −0.01 −0.01
(0.01) (0.01) (0.01)Log inflation (+2) −0.19 −0.07 −0.07
(0.15) (0.17) (0.17)Log time (+ 1) −0.37∗
(0.18)Turnout −0.00 0.05∗∗ 0.05∗
(0.01) (0.02) (0.02)Compulsory voting (Yes) 0.24 −0.26 −0.28
(0.18) (0.88) (0.88)Threshold 0.07∗∗∗ 0.04 0.01
(0.01) (0.08) (0.07)ENEP 0.04 −0.13 −0.14
(0.07) (0.09) (0.09)Log vote share NP (t-1) 0.02 −0.10 −0.09
(0.07) (0.08) (0.08)Intercept 1.49
(1.29)R2 0.30 0.10 0.11Adj. R2 0.28 0.07 0.07Num. obs. 199 199 199∗∗∗p < 0.001, ∗∗p < 0.01, ∗p < 0.05, ·p < 0.1 M1 has Arellano-Bond s.e. in parenthesis,
M2-3 present s.e. with White’s correction AR1 and heteroskedasticity
Table 4.6: Alternative control variables for models M1-3 in the main text.
121
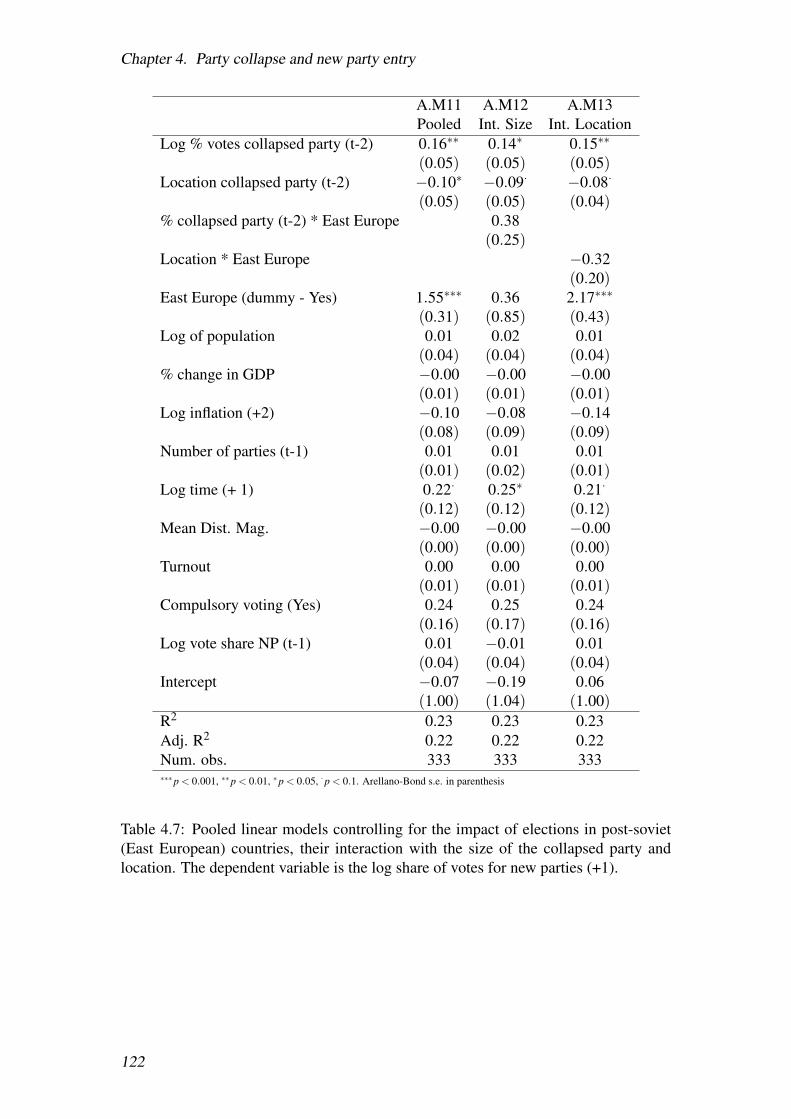
Chapter 4. Party collapse and new party entry
A.M11 A.M12 A.M13Pooled Int. Size Int. Location
Log % votes collapsed party (t-2) 0.16∗∗ 0.14∗ 0.15∗∗
(0.05) (0.05) (0.05)Location collapsed party (t-2) −0.10∗ −0.09· −0.08·
(0.05) (0.05) (0.04)% collapsed party (t-2) * East Europe 0.38
(0.25)Location * East Europe −0.32
(0.20)East Europe (dummy - Yes) 1.55∗∗∗ 0.36 2.17∗∗∗
(0.31) (0.85) (0.43)Log of population 0.01 0.02 0.01
(0.04) (0.04) (0.04)% change in GDP −0.00 −0.00 −0.00
(0.01) (0.01) (0.01)Log inflation (+2) −0.10 −0.08 −0.14
(0.08) (0.09) (0.09)Number of parties (t-1) 0.01 0.01 0.01
(0.01) (0.02) (0.01)Log time (+ 1) 0.22· 0.25∗ 0.21·
(0.12) (0.12) (0.12)Mean Dist. Mag. −0.00 −0.00 −0.00
(0.00) (0.00) (0.00)Turnout 0.00 0.00 0.00
(0.01) (0.01) (0.01)Compulsory voting (Yes) 0.24 0.25 0.24
(0.16) (0.17) (0.16)Log vote share NP (t-1) 0.01 −0.01 0.01
(0.04) (0.04) (0.04)Intercept −0.07 −0.19 0.06
(1.00) (1.04) (1.00)R2 0.23 0.23 0.23Adj. R2 0.22 0.22 0.22Num. obs. 333 333 333∗∗∗p < 0.001, ∗∗p < 0.01, ∗p < 0.05, ·p < 0.1. Arellano-Bond s.e. in parenthesis
Table 4.7: Pooled linear models controlling for the impact of elections in post-soviet(East European) countries, their interaction with the size of the collapsed party andlocation. The dependent variable is the log share of votes for new parties (+1).
122

4.6. Appendix: Party collapse and new party entry
Figure 4.8: Histogram of alternative definitions of the dependent variable. On the leftis a count of significant new parties (i.e. those that obtained enough votes win a seat).On the right is the dummy variable indicating the existence of a significant new partyentry.
123

Chapter 4. Party collapse and new party entry
A.M14 A.M15 A.M16 A.M17Logit Logit int. Neg. Bino. Neg. Bin. int.
Log % votes collapsed party (t-2) 0.25∗ 0.23· 0.20∗∗ 0.18∗
(0.11) (0.12) (0.07) (0.07)Location collapsed party (t-2) −0.04 −0.05 −0.14∗ −0.14∗
(0.10) (0.10) (0.07) (0.07)FPTP (dummy - Yes) −0.79∗ −0.93∗ −0.82∗∗ −0.97∗∗
(0.39) (0.46) (0.28) (0.34)FPTP * log % collapsed party (t-2) 0.14 0.13
(0.24) (0.17)Log of population 0.10 0.10 0.16∗ 0.16∗
(0.10) (0.10) (0.07) (0.07)% change in GDP −0.01 −0.01 0.00 0.00
(0.01) (0.01) (0.01) (0.01)Log inflation (+2) 0.15 0.14 0.02 0.01
(0.19) (0.19) (0.12) (0.12)Number of parties (t-1) 0.05 0.05 0.04· 0.04·
(0.04) (0.04) (0.03) (0.03)Log time (+ 1) −0.04 −0.06 0.04 0.02
(0.29) (0.29) (0.19) (0.19)Turnout −0.02∗ −0.02∗ −0.01 −0.01
(0.01) (0.01) (0.01) (0.01)Compulsory voting (Yes) 0.66∗ 0.68∗ 0.35 0.36
(0.33) (0.34) (0.22) (0.22)Existence NP (t-1) −0.03 −0.04 0.23 0.23
(0.26) (0.26) (0.17) (0.17)Intercept −0.73 −0.64 −3.18∗ −3.13∗
(2.00) (2.01) (1.25) (1.25)AIC 439.65 441.33 762.45 763.95BIC 485.38 490.87 811.99 817.30Log Likelihood -207.82 -207.66 -368.22 -367.97Deviance 415.65 415.33 312.50 312.06Num. obs. 334 334 334 334∗∗∗p < 0.001, ∗∗p < 0.01, ∗p < 0.05, ·p < 0.1
Table 4.8: Count models on the existence of successful new parties and the number ofsuccessful new parties that enter. A successful new party is defined as one that obtainsenough votes to gain a seat in the legislature.
124

4.6. Appendix: Party collapse and new party entry
A.M18 Pooled A.M19 FE A.M20 FE InteractionLog % votes collapsed party (t-2) 0.33∗∗∗ 0.21∗∗ 0.15·
(0.06) (0.07) (0.08)Location collapsed party (t-2) −0.06 −0.07 −0.08·
(0.05) (0.05) (0.05)FPTP (dummy - Yes) −1.09∗∗
(0.37)FPTP * log % collapsed party (t-2) 0.23
(0.16)Log of population −0.03 1.48 1.35
(0.04) (1.01) (1.01)% change in GDP 0.00 −0.00 −0.00
(0.01) (0.01) (0.00)Log inflation (+2) −0.08 −0.13 −0.11
(0.09) (0.10) (0.10)Number of parties (t-1) 0.01 −0.09∗ −0.10∗
(0.02) (0.04) (0.04)Log time (+ 1) −0.14
(0.13)Mean Dist. Mag. 0.00 −0.04·
(0.00) (0.02)Turnout −0.01· 0.01 0.02
(0.01) (0.01) (0.01)Compulsory voting (Yes) 0.21 −0.46 −0.80
(0.14) (0.48) (0.50)Log vote share NP (t-1) 0.06 −0.07 −0.05
(0.06) (0.06) (0.06)Intercept 2.44∗
(1.07)∗∗∗p < 0.001, ∗∗p < 0.01, ∗p < 0.05, ·p < 0.1
Table 4.9: Empirical models on the association between size of party crash, its locationand interaction of size with electoral system. With collapsed parties defined as thosethat completely exit electoral competition. That is, they do not compete in the nextelection. The dependent variable is the logged vote share for new parties
125
Chapter 4. Party collapse and new party entry
A.M21 Pooled A.M22 FE A.M23 FE InteractionLog % votes collapsed party (t-2) 0.33∗∗∗ 0.20∗∗ 0.17∗
(0.05) (0.07) (0.08)Location collapsed party (t-2) −0.08· −0.10∗ −0.11∗
(0.05) (0.05) (0.05)FPTP (dummy - Yes) −1.11∗∗
(0.37)FPTP * log % collapsed party (t-2) 0.17
(0.15)Log of population −0.03 1.28 1.12
(0.04) (1.01) (1.01)% change in GDP −0.00 −0.00 −0.00
(0.01) (0.01) (0.00)Log inflation (+2) −0.09 −0.13 −0.11
(0.09) (0.10) (0.10)Number of parties (t-1) 0.00 −0.09∗ −0.10∗∗
(0.02) (0.04) (0.04)Log time (+ 1) −0.12
(0.12)Mean Dist. Mag. 0.00 −0.04·
(0.00) (0.02)Turnout −0.01· 0.01 0.02
(0.01) (0.01) (0.01)Compulsory voting (Yes) 0.22 −0.47 −0.79
(0.14) (0.48) (0.50)Log vote share NP (t-1) 0.05 −0.06 −0.05
(0.05) (0.06) (0.06)Intercept 2.30∗
(1.06)∗∗∗p < 0.001, ∗∗p < 0.01, ∗p < 0.05, ·p < 0.1
Table 4.10: Empirical models on the association between size of party crash, its locationand interaction of size with electoral system. With party collapse defined as a partythat looses more than 70% of the vote share it held in the past election.The dependentvariable is the logged vote share for new parties
126

4.6. Appendix: Party collapse and new party entry
Figure 4.9: Bootstrap coefficients on the share of votes. Bootstrapped taking a randomsample of elections.
Figure 4.10: Bootstrap coefficients on collapsed party location. Bootstrapped taking arandom sample of elections.
127
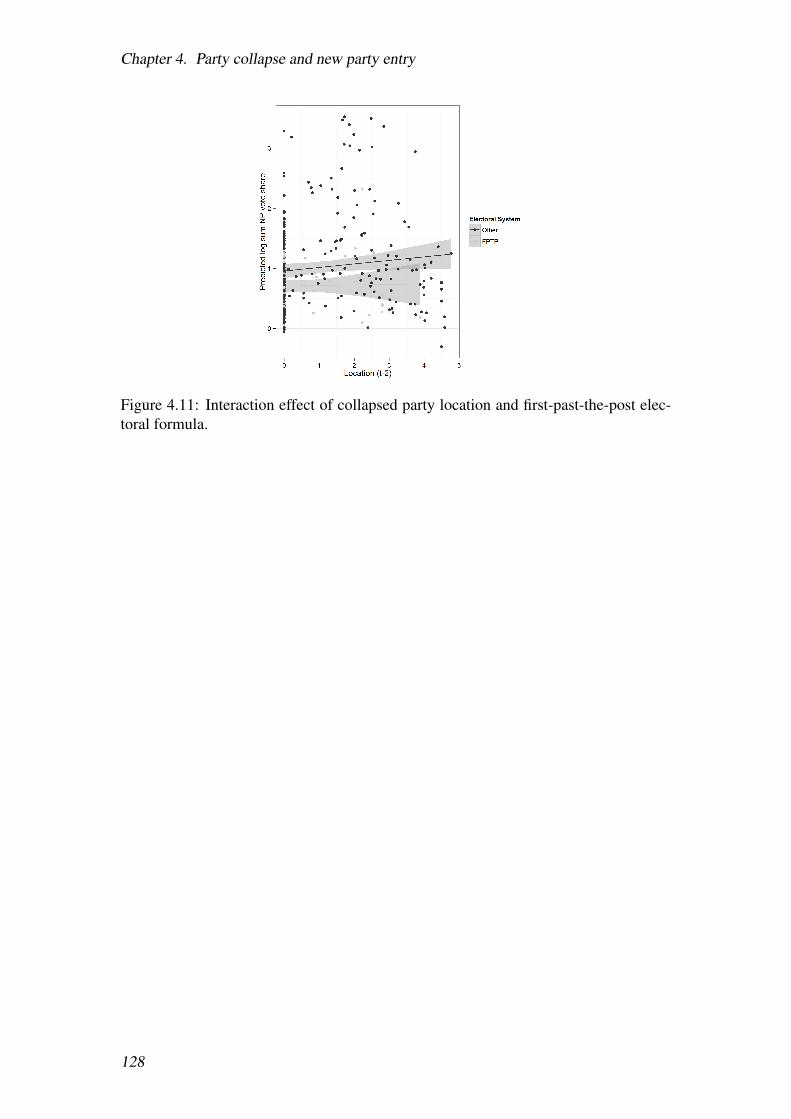
Chapter 4. Party collapse and new party entry
Figure 4.11: Interaction effect of collapsed party location and first-past-the-post elec-toral formula.
128

Chapter 5
Conclusions
The central conclusion of this research is that political parties react to the incentives
they face, but the decisions they make include non-monetary costs and benefits. The
chapters in this dissertation study different types of incentives and how these affect
party decisions. The paper in Chapter 2 uses a lab experiment to test the effect of social
identity on coalition building behaviour. Chapter 3 uses a novel dataset to determine
the impact of costs and benefits of entry, created by public funding, on the number of
presidential candidates sponsored by new parties in Latin America. The final study in
Chapter 4 estimates the effects of opportunities created by a party collapse on the suc-
cess of new party entry in parliamentary systems. Together these papers contribute to a
broader understanding of how political parties and their elites are influenced by the con-
text in which the decisions are taken. The papers add to the rational choice literature on
political parties, by presenting more nuanced explanations on party entry and coalition
building behaviour. However, in doing so, it emphasises the importance of including
insights from behavioural economics (e.g. personal biases) to these explanations.
Chapter 2 examines the impact of social identity and how it alters who people select
as coalition partners. As the results suggest, ideology has a strong and robust effect on
who people form alliances with. The laboratory experiment used in this paper consti-
tutes a unique opportunity to identifying this effect using a design that explicitly omits
any policy or office benefits from partner selection. That is to say, preferences for form-
ing coalitions with similar people do not produce any positive impact for the proposer,
129

Chapter 5. Conclusions
other than a personal benefit from favouring a like-minded person. On the contrary, the
experiment was designed in such a way that displaying social identity biases implied
sacrificing personal income, acting against a utility maximizing paradigm. The results
from the experiment contribute to the formal understanding of the factors that explain
coalition partner selection. The findings also suggest that the inclusion of social iden-
tity biases in formal models can help improve predictions, bringing them closer in line
with empirical regularities (cf. Martin & Stevenson 2001, Laver & Schofield 1990).
Of course students in a lab cannot be equated to professional politicians, yet parties
are not strictly outcome-oriented black boxes either. Parties are formed by individuals,
leaders, supporters, grass-roots campaigners, and donors, among others, all of whom
can have personal biases. The experiment shows that, even in a stylised environment
where choices don’t have policy consequences or affect future political results, peo-
ple express preferences for those that are ideologically closer to them. It is likely that
these concerns are also relevant for political leaders, given that forming alliances with
ideologically opposing parties can have important electoral consequences. An exam-
ple of this is the loss in support for the Liberal Democrats after the 2010-15 coalition
government with the Conservatives in Britain, or the Social Democratic Party of Ger-
many (SPD) after the first grand-coalition government with Angela Merkel’s Christian
Democrats (CDU). Even if party leaders are more outcome oriented than other people,
to win they need electoral support and to incorporate voters’ preferences in their actions
is a rational decision. The experimental results presented in Chapter 2 provide evidence
that social identity concerns have an impact on people’s preferences over coalition part-
ners. Consequently, incorporating these types of non-monetary considerations could
help improve the predictive power of the theoretical models.
The study in Chapter 3 looks into how different types of subsidies for political par-
ties affect the entry of presidential candidates running for new political parties in Latin
America. The chapter finds evidence that monetary and media subsidies, allocated
based on past electoral results, are associated with lower numbers of new-party candi-
dates competing in elections. On the contrary, subsidies for parties’ on-going activities,
130

distributed as a function of the results in the upcoming election, are associated with
higher numbers of new-party candidates. These findings provide evidence in favour of
the argument that campaign subsidies act as barriers to entry, increasing the costs for
new parties to compete in presidential elections and leaving them at a disadvantage with
respect to existing parties. While, on the contrary, post-election subsidies for on-going
party activities would tend to increase the potential benefits of competing and become
a good reason to field a presidential candidate. Furthermore, these results are robust to
various definitions of relevant new-party candidates and methods of estimation, attest-
ing to the generalizability of the outcomes.
The findings in Chapter 3 contribute to the understanding of how party finance reg-
ulations impact the representativeness and stability of the party system. By distinguish-
ing between the effects produced by different types of funding (and their allocation
mechanisms) the paper highlights the trade-offs faced by policy makers. On the one
hand, funding for on-going party activities can help improve representation by generat-
ing opportunities for new political forces to enter. However, this has the potential cost
creating high volatility and reducing governing capabilities (cf. Sartori 1976, Lijphart
1984, Powell 1982). On the other hand, campaign funding based on past electoral re-
sults can hinder new party entry, limiting the possibilities of party systems to adjust
to new political ideas, reducing representation. Both representation and reduction of
volatility are important objectives for Latin American policy makers, as many party
systems have low levels of institutionalization, which impacts the quality of democracy
(Mainwaring & Scully 1995). It is, therefore, of outermost importance to consider the
effects party financing regulations can generate.
This study also contributes to the literature on new party entry by expanding its
geographical reach. Until now analyses on new parties have concentrated on developed
countries and/or (West, Central and East) European parliamentary systems (Harmel &
Robertson 1985, Hug 2001, Tavits 2006, 2008a, among many thers). To the best of my
knowledge this is the first study to code and apply the concept of new parties to Latin
America. Given the prevalence of presidential systems in the region, the new party
131
Chapter 5. Conclusions
concept is adapted to account for the existence of parties that compete in elections for
the first time running a presidential candidate.
The final paper, Chapter 4, studies the impact of changes in party systems and
how they can generate opportunities for new legislative parties to enter. The statistical
analyses provide robust evidence that a party collapse generates opportunities for new
parties to successfully enter. The size of the space created by the collapsed party has
a systematically positive association with new parties’ electoral outcomes. This effect
is persistent independent of the operational definition used for a successful new party
—the presence/absence of new parties (dummy), the number of new parties or their
vote share. It is also present when one accounts for the characteristics of the sample,
such as a concentration of large party collapses in former Soviet countries. There is,
however, evidence that the effect of party collapse size is moderated by the presence of
plurality electoral formulas. In countries that use a first-past-the-post system the effect
of collapsed party size is significant, but smaller than for other electoral rules. This
result was expected given the higher thresholds for electoral success (i.e. obtaining a
seat in the legislature) in plurality systems.
The research in Chapter 4 makes a contribution to the spatial literature on new
party entry (cf. Downs 1957, Kitschelt 1988, Rohrschneider 1993, among others). By
analysing the party exit-entry dynamic, it provides evidence that an opening in previ-
ously occupied policy space can lead to new party success. To the best of my knowl-
edge, this is the first paper to test the argument empirically using a cross-national
study. Until now, the literature has concentrated on the impact of new policy issues
(e.g. the environment, local autonomy, anti-European Union sentiment, etc.) (Hug
2001, Meguid 2008, among others). However, the argument that an opportunity is cre-
ated when an existing party collapses had not been tested. Furthermore, by looking
at changes in the policy supply in a country (party crashes), this paper complements
explanations of new party entry by providing arguments regarding when they can suc-
cessfully emerge within a given institutional and cultural structure.
132

5.1. Implications for further research
5.1 Implications for further research
The research on social identity and its impact on coalition building highlights the im-
portance of including individual biases into formal explanations of party behaviour. For
example, identification with a position on the ideological spectrum could help explain
why niche parties ‘stick to their guns’ and cater to their electorate instead of the median
voter, despite moderate to low electoral results (see Spoon 2009b, Laver 2005, Ezrow
et al. 2011). If identification with a policy position is a key component of party support,
movement away from that position can jeopardize their electoral outcomes.
On the other hand, the strength of social identity concerns regarding ideological
positions may vary. In periods of high polarization social identity costs/benefits can
increase, while their impact could be lower in moments of internal peace and prosperity.
These differences could help explain why, parties that belong to the same ‘family’,
express more or less willingness to adopt new policies across countries and over time.
In terms of new parties, this dissertation opens the field to include Latin American
presidential systems. Research on new political actors in Latin America has so far con-
centrated on political outsiders (Kenney 1998, Mayoraga 2006, Corrales 2008, Mustillo
2012, Carreras 2012, among others). The adaptation of the definition of new parties to
presidential candidates in Latin America creates a bridge between he insiders/outsiders
approach and predominantly Euro-centric studies on new legislative parties. Connect-
ing these literatures and creating a comparable dataset has, created opportunities to test
the generalizability of these theories on a broader institutional, economic and cultural
setting.
Additionally, the implementation of the study contributes to a wider research agenda
by producing the first time series dataset of party finance regulations and subsidies
in Latin America. This dataset includes information on types of funding, allocation
mechanisms, and eligibility criteria, among other variables, and will be made publicly
available upon publication. This data can be used for multiple purposes, including
comparative studies on the impact of party finance laws on the electoral outcomes of
different types of political parties. The introduction of funding (with some measure of
133

Chapter 5. Conclusions
equal allocation) could reduce the impact of high income donors and level the oppor-
tunities for parties that cater to less wealthy voters, therefore affecting their electoral
results.
The research in Chapter 4 highlights the importance of within country variations
in explanations of new party entry. The paper encourages looking into changes in the
characteristics of the party system to explain when and how new parties emerge in
a country over time. The study also emphasises the difficulties in identifying causal
effects in this line of research due to endogeneity in the generation of opportunities for
viable party entries. The study proposes a simple temporal solution to this problem.
However, it is important for future research to take appropriate measures to deal with
the issue. An alternative approach would be to conduct experimental research or use
external shocks to the party system as instrumental variables.
Overall, this dissertation produces novel outcomes for various types of incentives
on party behaviour. It provides robust evidence on the impact of standard rational
choice assumptions. However, it also highlights importance of including non-monetary
valuations into cost–benefit assumptions of party behaviour.
134

Bibliography
Adams, J., Clark, M., Ezrow, L. & Glasgow, G. (2006), ‘Are niche parties fundamen-
tally different from mainstream parties? The causes and the electoral consequences
of Western European parties’ policy shifts, 1976-1998’, American Journal of Politi-
cal Science 50(3), 513–529.
URL: http://www.jstor.org/stable/3694232
Akerlof, G. A. & Kranton, R. E. (2000), ‘Economics and identity’, The Quarterly Jour-
nal of Economics 115(3), 715–753.
URL: http://qje.oxfordjournals.org/content/115/3/715.abstract
Akerlof, G. & Kranton, R. (2010), Identity Economics: How our identities affect our
work, wages, and well-being, Princeton University Press, USA.
Anderson, C. D. (2006), ‘Economic voting and multilevel governance: A comparative
individual-level analysis’, American Journal of Political Science 50(2), 449–463.
URL: http://dx.doi.org/10.1111/j.1540-5907.2006.00194.x
Austen-Smith, D. & Banks, J. (1988), ‘Elections, coalitions, and legislative outcomes’,
The American Political Science Review 82(2), 405.
Axelrod, R. (1970), Conflict of Interest, Markham, Chicago.
Bandyopadhyay, S. & Chatterjee, K. (2006), ‘Coalition theory and its applications: A
survey’, The Economic Journal 116(509), pp. F136–F155.
URL: http://www.jstor.org/stable/3590487
135
Bibliography
Baron, D. P. & Diermeier, D. (2001), ‘Elections, governments, and parliaments in pro-
portional representation systems’, The Quarterly Journal of Economics 116(3), pp.
933–967.
URL: http://www.jstor.org/stable/2696422
Baron, D. P. & Ferejohn, J. A. (1989), ‘Bargaining in legislatures’, The American Po-
litical Science Review 83(4), pp. 1181–1206.
URL: http://www.jstor.org/stable/1961664
Barr, R. R. (2009), ‘Populists, outsiders and anti-establishment politics’, Party Politics
15(1), 29–48.
URL: http://ppq.sagepub.com/content/15/1/29
Barrett, E. J. (1997), ‘Gender and race in the state house: The legislative experience’,
The Social Science Journal 34(2), 131–144.
URL: http://www.sciencedirect.com/science/article/pii/S036233199790046X
Bartels, L. M. (2002), ‘Beyond the running tally: Partisan bias in political perceptions’,
Political Behavior 24(2), pp. 117–150.
URL: http://www.jstor.org/stable/1558352
Benoit, K. & Laver, M. (2006), Party Policy in Modern Democracies, Routledge, Lon-
don.
Blais, A. (2006), ‘What affects voter turnout?’, Annual Review of Political Science
9(1), 111–125.
URL: http://dx.doi.org/10.1146/annurev.polisci.9.070204.105121
Boas, T. C. (2005), ‘Television and neopopulism in Latin America: Media effects in
Brazil and Peru’, Latin American Research Review 40(2), 27–49.
URL: http://muse.jhu.edu/
Böhmelt, T., Ezrow, L., Lehrer, R. & Ward, H. (Forthcoming, 2016), ‘Party policy
diffusion’, American Political Science Review .
136
Bibliography
Bormann, N.-C. & Golder, M. (2013), ‘Democratic electoral systems around the world,
1946-2011’, Electoral Studies 32(2), 360 – 369. Replication Data.
URL: https://files.nyu.edu/mrg217/public/elections.html
Bratton, K. A. (2006), ‘The behavior and success of latino legislators: Evidence from
the states’, Social Science Quarterly 87(5), 1136–1157.
URL: http://onlinelibrary.wiley.com/doi/10.1111/j.1540-
6237.2006.00420.x/abstract
Campbell, A., Converse, P., Miller, W. & Stokes, D. (1960), The American Voter, Wi-
ley, New York, NY.
Campbell, J. E. & Sumners, J. A. (1990), ‘Presidential coattails in senate elections’,
American Political Science Review 84, 513–524.
URL: http://journals.cambridge.org/article_S0003055400192627
Carreras, M. (2012), ‘The rise of outsiders in Latin America, 1980–2010 an institution-
alist perspective’, Comparative Political Studies 45(12), 1451–1482.
URL: http://cps.sagepub.com/content/45/12/1451
Castles, F. G. & Mair, P. (1984), ‘Left–right political scales: Some ‘expert’ judgments’,
European Journal of Political Research 12(1), 73–88.
URL: http://dx.doi.org/10.1111/j.1475-6765.1984.tb00080.x
Charness, G., Rigotti, L. & Rustichini, A. (2007), ‘Individual behavior and group mem-
bership’, American Economic Review 97(4), 1340–1352.
URL: https://www.aeaweb.org/articles.php?doi=10.1257/aer.97.4.1340
Chen, Y. & Li, S. X. (2009), ‘Group identity and social preferences’, The American
Economic Review 99(1), pp. 431–457.
URL: http://www.jstor.org/stable/29730190
Cohen, G. L. (2003), ‘Party over policy: The dominating impact of group influence on
political beliefs’, J Pers Soc Psychol 85(5), 808–822. PMID: 14599246.
137
Bibliography
Corrales, J. (2008), ‘Latin America’s neocaudillismo: Ex-presidents and newcomers
running for president... and winning’, Latin American Politics and Society 50(3), 1–
35.
URL: http://www.jstor.org/stable/30130874
Cox, G. W. (1997), Making Votes Count: Strategic Coordination in the World’s Elec-
toral Systems, Cambridge University Press, Cambridge.
de Swann, A. (1973), Coalition Theories and Cabinet Formation, Elsevier, Amsterdam.
Dickson, E. S. & Scheve, K. (2010), ‘Social identity, electoral institutions and the num-
ber of candidates’, British Journal of Political Science 40(2), 349–375.
URL: http://dx.doi.org/10.1017/S0007123409990354
Diermeier, D. & Morton, R. (2005), Proportionality versus perfectness: Experiments
in majoritarian bargaining, in D. Austen-Smith & J. Duggan, eds, ‘Social choice and
strategic decisions: Essays in the honor of Jeffrey S. Banks’, Springer, Berlin et al.,
pp. 2001–227.
Döring, H. & Manow, P. (2012), Parliament and government composition database
(ParlGov): An infrastructure for empirical information on parties, elections and gov-
ernments in modern democracies., Vol. 12/10 – 15 October 2012.
URL: http://www.parlgov.org/static/static-2014/stable/index.html
Downs, A. (1957), An Economic Theory of Democracy, Harper & Row, New York.
Drouvelis, M., Montero, M. & Sefton, M. (2010), ‘Gaining power through enlargement:
Strategic foundations and experimental evidence’, Games and Economic Behavior
69(2), 274–292.
URL: http://www.sciencedirect.com/science/article/pii/S0899825609002346
Duch, R. M. & Stevenson, R. T. (2008), The Economic Vote: How Political and Eco-
nomic Institutions Condition Election Results, Cambridge University Press, New
York.
138
Bibliography
Duverger, M. (1959), Political Parties: Their Organization and Activity in the Modern
State, 2nd edn, Methuen, London.
Ezrow, L., Homola, J. & Tavits, M. (2014), ‘When extremism pays: Policy positions,
voter certainty, and party support in postcommunist europe’, The Journal of Politics
76, 535–547.
URL: http://journals.cambridge.org/article_S0022381613001461
Ezrow, L., Vries, C. D., Steenbergen, M. & Edwards, E. (2011), ‘Mean voter represen-
tation and partisan constituency representation: Do parties respond to the mean voter
position or to their supporters?’, Party Politics 17(3), 275–301.
URL: http://ppq.sagepub.com/content/17/3/275
Fearon, J. D. & Leitin, D. (2003), ‘Ethnicity, insurgency and civil war’, American
political science review 97(01), 75–90. Replication Data.
URL: http://www.stanford.edu/group/ethnic/
Feddersen, T. J. (2004), ‘Rational choice theory and the paradox of not voting’, Journal
of Economic Perspectives 18(1), 99–112.
URL: http://www.aeaweb.org/articles.php?doi=10.1257/089533004773563458
Feddersen, T. J., Sened, I. & Wright, S. G. (1990), ‘Rational voting and candidate entry
under plurality rule’, American Journal of Political Science 34(4), 1005–1016.
URL: http://www.jstor.org/stable/2111469
Ferejohn, J. A. & Calvert, R. L. (1984), ‘Presidential coattails in historical perspective’,
American Journal of Political Science 28(1), 127–146.
URL: http://www.jstor.org/stable/2110790
Fershtman, C. & Gneezy, U. (2001), ‘Discrimination in a segmented society: An ex-
perimental approach’, The Quarterly Journal of Economics 116(1), 351–377.
URL: http://qje.oxfordjournals.org/content/116/1/351
Fréchette, G. R., Kagel, J. H. & Morelli, M. (2005), ‘Nominal bargaining power, se-
lection protocol, and discounting in legislative bargaining’, Journal of Public Eco-
139

Bibliography
nomics 89(8), 1497–1517.
URL: http://www.sciencedirect.com/science/article/pii/S0047272704001653
Fréchette, G. R., Kagel, J. H. & Lehrer, S. F. (2003), ‘Bargaining in legislatures: An ex-
perimental investigation of open versus closed amendment rules’, American Political
Science Review 97, 221–232.
Gamson, W. A. (1961), ‘A theory of coalition formation’, American Sociological Re-
view 26(3), pp. 373–382.
URL: http://www.jstor.org/stable/2090664
Gerber, A. (1998), ‘Estimating the effect of campaign spending on senate election
outcomes using instrumental variables’, The American Political Science Review
92(2), 401–411.
URL: http://www.jstor.org/stable/2585672
Gerber, A. S. & Green, D. P. (2000), ‘The effects of canvassing, telephone calls, and
direct mail on voter turnout: A field experiment’, The American Political Science
Review 94(3), 653–663.
URL: http://www.jstor.org/stable/2585837
Gilardi, F. (2010), ‘Who learns from what in policy diffusion processes?’, American
Journal of Political Science 54(3), 650–666.
URL: http://dx.doi.org/10.1111/j.1540-5907.2010.00452.x
Gilardi, F. (2013), Transnational diffusion: Norms, ideas and policies, in W. Carlsnaes,
T. Risse & B. A. Simmons, eds, ‘Handbook of international relations’, SAGE, Sec-
ond Edition, Thousand Oaks, pp. 453–477.
URL: http://www.zora.uzh.ch/66119/
Goette, L., Huffman, D. & Meier, S. (2006), ‘The impact of group membership on
cooperation and norm enforcement: Evidence using random assignment to real social
groups’, American Economic Review 96(2), 212–216.
URL: http://www.aeaweb.org/articles.php?doi=10.1257/000282806777211658
140
Bibliography
Golder, M. (2006a), ‘Presidential coattails and legislative fragmentation’, American
Journal of Political Science 50(1), 34–48.
URL: http://onlinelibrary.wiley.com/doi/10.1111/j.1540-
5907.2006.00168.x/abstract
Golder, S. N. (2006b), ‘Pre-electoral coalition formation in parliamentary democra-
cies’, British Journal of Political Science 36, 193–212.
Green, D. P., Palmquist, B. & Schickler, E. (2004), Partisan Hearts and Minds: Politi-
cal parties and the social identities of voters, Yale University Press.
Greene, W. (2003), Econometric Analysis, New Jersey, Prentice Hall.
Gschwend, T. & Hooghe, M. (2008), ‘Should I stay or should I go? An experimental
study on voter responses to pre-electoral coalitions’, European Journal of Political
Research 47(5), 556–577.
URL: http://dx.doi.org/10.1111/j.1475-6765.2008.00787.x
Gutiérrez, P. & Zovatto, D., eds (2011), Financiamiento de los partidos políticos en
América Latina, number 594 in ‘Serie Doctrina Jurídica’, primera edn, Instituto
Internacional para la Democracia y la Asistencia Electoral, Organización de los
Estados Americanos, Universidad Nacional Auónoma de México, México.
URL: http://aceproject.org/ero-en/misc/financiamiento-de-los-partidos-politicos-
en/view
Hargreaves Heap, S. P. & Zizzo, D. J. (2009), ‘The value of groups’, American Eco-
nomic Review 99(1), 295–323.
URL: http://www.aeaweb.org/articles.php?doi=10.1257/aer.99.1.295
Harmel, R. & Robertson, J. D. (1985), ‘Formation and success of new parties: A cross-
national analysis’, International Political Science Review / Revue internationale de
science politique 6(4), 501–523.
URL: http://www.jstor.org/stable/1601057
141

Bibliography
Hicken, A. & Stoll, H. (2008), ‘Electoral rules and the size of the prize: How political
institutions shape presidential party systems’, The Journal of Politics 70(4), 1109–
1127.
URL: http://dx.doi.org/10.1017/S0022381608081097
Hogan, R. E. (2001), ‘Campaign war chests and challenger emergence in state legisla-
tive elections’, Political Research Quarterly 54(4), 815–830.
URL: http://prq.sagepub.com/content/54/4/815.abstract
Hooghe, M., Maddens, B. & Noppe, J. (2006), ‘Why parties adapt: Electoral reform,
party finance and party strategy in Belgium’, Electoral Studies 25(2), 351 – 368.
URL: http://www.sciencedirect.com/science/article/pii/S0261379405000582
Horowitz, D. L. (1993), ‘Democracy in divided societies’, Journal of Democracy
4(4), 18–38.
Huber, J. & Inglehart, R. (1995), ‘Expert interpretations of party space and party loca-
tions in 42 societies’, Party Politics 1(1), 73–111.
URL: http://ppq.sagepub.com/content/1/1/73.abstract
Hug, S. (2001), Altering Party Systems: Strategic Behavior and the Emergence of New
Political Parties in Western Democracies, University of Michigan Press, Ann Arbor.
Huntington, S. P. (1991), The Third Wave: Democratization in the Late Twentieth Cen-
tury, University of Oklahoma Press, Norman.
Iyengar, S., Sood, G. & Lelkes, Y. (2012), ‘Affect, not ideology: A social identity
perspective on polarization’, Public Opinion Quarterly 76(3), 405–431.
URL: http://poq.oxfordjournals.org/content/76/3/405.abstract
Jacobson, G. C. (1990), ‘The effects of campaign spending in house elections: New
evidence for old arguments’, American Journal of Political Science 34(2), 334–362.
URL: http://www.jstor.org/stable/2111450
Jenkins, R. (1996), Social Identity, Routledge, London.
142

Bibliography
John G. Matsusaka, F. P. (1999), ‘Voter turnout: How much can we explain?’, Public
Choice 98(3/4), 431–446.
URL: http://www.jstor.org/stable/30024496
Jones, M. P. (1994), ‘Presidential election laws and multipartism in Latin America’,
Political Research Quaterly 47(1), 41–57.
Jones, M. P. (2004), ‘Electoral institutions, social cleavages, and candidate competition
in presidential elections’, Electoral Studies 23(1), 73–106.
URL: http://www.sciencedirect.com/science/article/pii/S0261379402000562
Kenney, C. D. (1998), ‘Outsider and anti-party politicians in power new conceptual
strategies and empirical evidence from Peru’, Party Politics 4(1), 57–75.
URL: http://ppq.sagepub.com/content/4/1/57
Kitschelt, H. P. (1988), ‘Left-libertarian parties: Explaining innovation in competitive
party systems’, World Politics 40(2), 194–234.
URL: http://www.jstor.org/stable/2010362
Kranton, R., Pease, M., Sanders, S. & Huettel, S. (Working Paper, 2012), ‘Identity,
group conflict, and social preferences’.
URL: http://www.dibs.duke.edu/research/profiles/168-rachel-kranton
Kroh, M. (2007), ‘Measuring left-right political orientation: The choice of response
format’, The Public Opinion Quarterly 71(2), pp. 204–220.
URL: http://www.jstor.org/stable/4500371
Lago, I. & Martínez, F. (2011), ‘Why new parties?’, Party Politics 17(1), 3–20.
URL: http://ppq.sagepub.com/content/17/1/3.abstract
Laroze, D. (Working Paper, 2016), ‘Party financing and the entrance of new-party can-
didates’, under review .
Laver, M. (1997), Private Desires, Political Action: An invitation to the politics of
143
Bibliography
rational choice, London: SAGE Publications Ltd., London.
URL: http://dx.doi.org/10.4135/9781446217047
Laver, M. (2005), ‘Policy and the dynamics of political competition’, American Politi-
cal Science Review 99, 263–281.
URL: http://journals.cambridge.org/article_S0003055405051646
Laver, M. & Budge, I., eds (1992), Party Policy and Government Coalitions, The
Macmillan Press, London, UK.
Laver, M. & Schilperoord, M. (2007), ‘Spatial models of political competition with
endogenous political parties’, Philosophical Transactions of the Royal Society of
London B: Biological Sciences 362(1485), 1711–1721.
Laver, M. & Schofield, N. (1990), Multiparty Government: The Politics of Coalition in
Europe, The University of Michigan Press, USA.
Lehrer, R. (2012), ‘Intra-party democracy and party responsiveness’, West European
Politics 35(6), 1295–1319.
URL: http://dx.doi.org/10.1080/01402382.2012.713747
Levitsky, S. & Cameron, M. A. (2003), ‘Democracy without parties? Political parties
and regime change in Fujimori’s Peru’, Latin American Politics and Society 45(3), 1–
33.
URL: http://www.jstor.org/stable/3177157
Levitt, S. D. (1994), ‘Using repeat challengers to estimate the effect of campaign
spending on election outcomes in the U.S. House’, Journal of Political Economy
102(4), 777–798.
URL: http://www.jstor.org/stable/2138764
Lijphart (1984), Democracies: Patterns of Majoritarian and Consensus Government in
Twenty-one Countries, Yale University Press, New Haven.
144
Bibliography
Lipset, S. M. & Rokkan, S. (1967), Cleavage structures, party systems, and voter align-
ments: An introduction, in S. M. Lipset & S. Rokkan, eds, ‘Party Systems and Voter
Alignments’, Free Press, New York.
Long, J. S. (1997), Regression Models for Categorical and Limited Dependent Vari-
ables, Sage Publications, London.
Madrid, R. (2008), ‘The rise of ethnopopulism in Latin America’, World Politics
60(3), 475–508.
URL: http://muse.jhu.edu/journals/wp/summary/v060/60.3.madrid.html
Maier, J. (2011), ‘The impact of political scandals on political support: An experimen-
tal test of two theories’, International Political Science Review 32(3), 283–302.
URL: http://ips.sagepub.com/content/32/3/283
Mainwaring, S. (2006), ‘The crisis of representation in the Andes’, Journal of Democ-
racy 17(3), 13–27.
URL: http://muse.jhu.edu/
Mainwaring, S. & Scully, T. R. (1995), Building Democratic Institutions: Party Systems
in Latin America, Stanford University Press., Stanford.
Marshall, M. G. & Cole, B. R. (2014), ‘Polity IV global reports 2014’.
URL: http://www.systemicpeace.org/vlibrary/GlobalReport2014.pdf
Marshall, M. G. & Jaggers, K. (2013), ‘Polity IV project: Political regime characteris-
tics and transitions, 1800-2011 – users manual’.
URL: http://www.systemicpeace.org/polity/polity4.htm
Martin, L. W. & Stevenson, R. T. (2001), ‘Government formation in parliamentary
democracies’, American Journal of Political Science 45(1), pp. 33–50.
URL: http://www.jstor.org/stable/2669358
Mayoraga, R. (2006), Outsiders and neopopulism: The road to plebiscitary democracy.,
in S. Mainwaring, A. M. Bejarano & E. Pizarro Leongómez, eds, ‘The Crisis of
145

Bibliography
Democratic Representation in the Andes’, Standford University Press, Standford CA,
pp. 132–170.
McKelvey, R. D. (1991), An experimental test of a stochastic game model of commit-
tee bargaining, in T. R. Palfrey, ed., ‘Laboratory Research in Political Economy’,
University of Michigan Press, Ann Arbor, pp. 139–168.
McKelvey, R. D. & Schofield, N. (1986), ‘Structural instability of the core’, Journal of
Mathematical Economics 15(3), 179 – 198.
URL: http://www.sciencedirect.com/science/article/pii/0304406886900091
Meguid, B. M. (2005), ‘Competition between unequals: The role of mainstream party
strategy in niche party success’, American Political Science Review 99, 347–359.
Meguid, B. M. (2008), Party Competition Between Unequals: Strategies and Electoral
Fortunes in Western Europe, Cambridge University Press.
Michelitch, K. (2015), ‘Does electoral competition exacerbate interethnic or interpar-
tisan economic discrimination? Evidence from a field experiment in market price
bargaining’, American Political Science Review 109, 43–61.
Mustillo, T. (2009), ‘Modeling new party performance: A conceptual and methodolog-
ical approach for volatile party systems’, Political Analysis 17(3), 311–332.
URL: http://www.jstor.org/stable/25791977
Mustillo, T. (2012), ‘Latin American political party fragmentation trees’.
URL: http://hdl.handle.net/2152/17852
Nadeau, R. & Lewis-Beck, M. S. (2001), ‘National economic voting in US presidential
elections’, Journal of Politics 63(1), 159–181.
Ordeshook, P. C. & Shvetsova, O. V. (1994), ‘Ethnic heterogeneity, district magnitude,
and the number of parties’, American Journal of Political Science 38(1), 100–123.
URL: http://www.jstor.org/stable/2111337
146
Bibliography
Osborne, M. J. & Slivinski, A. (1996), ‘A model of political competition with citizen-
candidates’, The Quarterly Journal of Economics 111(1), 65–96.
URL: http://www.jstor.org/stable/2946658
Posner, D. N. (2004), ‘The political salience of cultural difference: Why Chewas and
Tumbukas are allies in Zambia and adversaries in Malawi’, American Political Sci-
ence Review pp. 529–545.
URL: http://journals.cambridge.org/article_S0003055404041334
Potter, J. D. & Tavits, M. (2013), ‘The impact of campaign finance laws on party com-
petition’, British Journal of Political Science 45, 1–23.
URL: http://journals.cambridge.org/article_S0007123413000227
Powell, G. B. J. (1982), Contemporary Democracies: Participation, Stability, and Vio-
lence, new edition edition edn, Harvard University Press, Cambridge, Mass.
Remmer, K. L. (1991), ‘The political impact of economic crisis in Latin America in the
1980s’, The American Political Science Review 85(3), 777–800.
URL: http://www.jstor.org/stable/1963850
Riker, W. H. (1962), The Theory of Political Coalitions, Yale University Press, New
Haven, CN.
Riker, W. H. (1982), ‘The two-party system and Duverger’s law: An essay on the
history of political science’, The American Political Science Review 76(4), 753–766.
URL: http://www.jstor.org/stable/1962968
Roberts, K. M. (1996), ‘Economic crisis and the demise of the legal left in Peru’, Com-
parative Politics 29(1), 69–92.
URL: http://www.jstor.org/stable/422183
Roberts, K. M. (2006), ‘Populism, political conflict, and grass-roots organization in
Latin America’, Comparative Politics 38(2), 127–148.
URL: http://www.jstor.org/stable/20433986
147
Bibliography
Roberts, K. M. (2007), ‘Latin America’s populist revival’, SAIS Review 27(1), 3–15.
URL: http://muse.jhu.edu/
Robertson, D. B. (1976), A Theory of Party Competition, John Wiley & Sons.
Rohrschneider, R. (1993), ‘New party versus old left realignments: Environmental at-
titudes, party policies, and partisan affiliations in four west european countries’, The
Journal of Politics 55(3), 682–701.
URL: http://www.jstor.org/stable/2131994
Samuels, D. (2001), ‘Does money matter? Credible commitments and campaign fi-
nance in new democracies: Theory and evidence from Brazil’, Comparative Politics
34(1), 23–42.
URL: http://www.jstor.org/stable/422413
Sartori, G. (1976), Parties and party systems: A framework for analysis, Cambridge
University Press, New York.
Scarrow, S. E. (2006), ‘Party subsidies and the freezing of party competition: Do cartel
mechanisms work?’, West European Politics 29(4), 619–39.
URL: https://www.tcd.ie/Political_Science/undergraduate/module-
outlines/ss/political-parties/PolP/ScarrowWEP06.pdf
Scarrow, S. E. (2007), ‘Political finance in comparative perspective’, Annual Review of
Political Science 10(1), 193–210.
URL: http://dx.doi.org/10.1146/annurev.polisci.10.080505.100115
Seligson, M. A. (2007), ‘The rise of populism and the left in Latin America’, Journal
of Democracy 18(3), 81–95.
URL: http://muse.jhu.edu/
Sjöblom, G. (1968), Party Strategies in a Multiparty System, Studentlitteratur, Lund,
Sweden.
148
Bibliography
Spoon, J.-J. (2009a), ‘Holding their own: Explaining the persistence of green parties in
france and the uk’, Party Politics 15(5), 615–634.
URL: http://ppq.sagepub.com/content/15/5/615.abstract
Spoon, J.-J. (2009b), ‘Holding their own: Explaining the persistence of green parties in
France and the UK’, Party Politics 15(5), 615–634.
URL: http://ppq.sagepub.com/content/15/5/615.abstract
Spoon, J.-J. & Klüver, H. (2014), ‘Do parties respond? How electoral context influ-
ences party responsiveness’, Electoral Studies 35, 48–60.
Spoon, J.-J. & West, K. J. (2015), ‘Alone or together? How institutions affect party en-
try in presidential elections in Europe and South America’, Party Politics 21(3), 393–
403.
URL: http://ppq.sagepub.com/content/21/3/393.abstract
Tajfel, H., Billig, M. G., Bundy, R. P. & Flament, C. (1971), ‘Social categorization and
intergroup behaviour’, European Journal of Social Psychology 1(2), 149—-178.
URL: http://onlinelibrary.wiley.com/doi/10.1002/ejsp.2420010202/abstract
Tajfel, H. & Turner, J. C. (1986), The social identity theory of intergroup behaviour,
in Stephen Worchel & William G Austin, eds, ‘Psychology of Intergroup Relations’,
Nelson, Chicago, pp. 7–24.
Tavits, M. (2006), ‘Party system change: Testing a model of new party entry’, Party
Politics 12(1), 99–119.
URL: http://ppq.sagepub.com/content/12/1/99.abstract
Tavits, M. (2007), ‘Principle vs. pragmatism: Policy shifts and political competition’,
American Journal of Political Science 51(1), 151–165.
URL: http://dx.doi.org/10.1111/j.1540-5907.2007.00243.x
Tavits, M. (2008a), ‘Party systems in the making: The emergence and success of new
parties in new democracies’, British Journal of Political Science 38(1), 113–133.
149
Bibliography
Tavits, M. (2008b), ‘Policy positions, issue importance, and party competition in new
democracies’, Comparative Political Studies 41(1), 48–72.
URL: http://cps.sagepub.com/content/41/1/48.abstract
Tremewan, J. (Working-Paper, 2010), ‘Group identity and coalition formation: Exper-
iments in one-shot and repeated games’.
URL: http://homepage.univie.ac.at/james.tremewan/
Tsai, T.-S. (2009), ‘The evaluation of majority rules in a legislative bargaining model’,
Journal of Comparative Economics 37(4), 674–684.
URL: http://www.sciencedirect.com/science/article/pii/S0147596709000031
van Biezen, I. & Rashkova, E. R. (2014), ‘Deterring new party entry? The impact of
state regulation on the permeability of party systems’, Party Politics 20(6), 890–903.
URL: http://ppq.sagepub.com/content/20/6/890.abstract
Volkens, A., Lehmann, P., Matthieß, T., Merz, N., Regel, S. & Werner, A. (2015),
The Manifesto Data Collection. Manifesto Project (MRG/CMP/MARPOR). Version
2015a, Wissenschaftszentrum Berlin für Sozialforschung, Berlin.
URL: https://manifestoproject.wzb.eu/
von Neumann, J. & Morgenstern, O. (1953), Theory of Games and Economic Behavior,
Princeton University Press, Princeton.
Ward, H. & Cao, X. (2012), ‘Domestic and international influences on green taxation’,
Comparative Political Studies .
URL: http://cps.sagepub.com/content/early/2012/02/28/0010414011434007.abstract
West, K. J. & Spoon, J.-J. (2013), ‘Credibility versus competition the impact of party
size on decisions to enter presidential elections in South America and Europe’, Com-
parative Political Studies 46(4), 513–539.
URL: http://cps.sagepub.com/content/46/4/513
West, K. J. & Spoon, J.-J. (2015), ‘Coordination and presidential coattails: Do parties’
150
Bibliography
presidential entry strategies affect legislative vote share?’, Party Politics .
URL: http://ppq.sagepub.com/content/early/2015/10/16/1354068815610969.abstract
Weyland, K. (2001), ‘Clarifying a contested concept: Populism in the study of Latin
American politics’, Comparative Politics 34(1), 1–22.
URL: http://www.jstor.org/stable/422412
Weyland, K. (2003), ‘Neopopulism and neoliberalism in Latin America: How much
affinity?’, Third World Quarterly 24(6), 1095–1115.
URL: http://www.jstor.org/stable/3993445
Zachary Elkins, B. S. (2005), ‘On waves, clusters, and diffusion: A conceptual frame-
work’, The Annals of the American Academy of Political and Social Science 598, 33–
51.
URL: http://www.jstor.org/stable/25046078
Zons, G. (2013), ‘The influence of programmatic diversity on the formation of new
political parties’, Party Politics .
URL: http://ppq.sagepub.com/content/early/2013/11/20/1354068813509515.abstract
Zovatto, D. (2008), ‘Regulación jurídica de los partidos políticos en américa latina, 2a.
reimp.’.
URL: http://biblio.juridicas.unam.mx/libros/libro.htm?l=2144
Zovatto, D. & Orozco, J. J. (2008), Reforma Política y Electoral en América
Latina 1978–2007, number 418 in ‘Serie Doctrina Jurídica’, Universidad Nacional
Autónoma de México e Instituto Internacional para la Democracia y la Asistencia
Electoral, México.
151

Top Related