


Languages
Pages
Legal


HAL Id: hal-02923943https://hal.archives-ouvertes.fr/hal-02923943
Submitted on 27 Aug 2020
HAL is a multi-disciplinary open accessarchive for the deposit and dissemination of sci-entific research documents, whether they are pub-lished or not. The documents may come fromteaching and research institutions in France orabroad, or from public or private research centers.
L’archive ouverte pluridisciplinaire HAL, estdestinée au dépôt et à la diffusion de documentsscientifiques de niveau recherche, publiés ou non,émanant des établissements d’enseignement et derecherche français ou étrangers, des laboratoirespublics ou privés.
OLAP operators for social network analysisMaha Ben Kraiem, Mohamed Alqarni, Jamel Feki, Franck Ravat
To cite this version:Maha Ben Kraiem, Mohamed Alqarni, Jamel Feki, Franck Ravat. OLAP operators for social networkanalysis. Cluster Computing, Springer Verlag, 2020, 23 (1), pp.2347-2374. �10.1007/s10586-019-03006-z�. �hal-02923943�

OATAO is an open access repository that collects the work of Toulouse researchers and makes it freely available over the web where possible
Any correspondence concerning this service should be sent to the repository administrator: [email protected]
This is an author’s version published in: https://oatao.univ-toulouse.fr/26306
To cite this version:
Ben Kraiem, Maha and Alqarni, Mohamed and Feki, Jamel and Ravat, Franck OLAP operators for social network analysis. (2019) Cluster Computing. ISSN 1386-7857
Open Archive Toulouse Archive Ouverte
Official URL : https://doi.org/10.1007/s10586-019-03006-z
OLAP operators for social network analysis
Maha Ben Kraiem1• Mohamed Alqarni2 • Jamel Feki2 • Franck Ravat3
AbstractThe multidimensional data model and implementations of social networks come with a set of specific constraints, such as
missing data, reflexive relationship on fact instance. However, the conventional OLAP operators and existing models do
not provide solutions for handling those specificities. Therefore, we should invest further efforts to extend these operators
to take into consideration the specificities of multidimensional modeling of tweets as well as their manipulation. Face to
this issue, we propose, in this paper, new OLAP operators that enhance existing solutions for OLAP analyses involving a
reflexive relationship on the fact instances and dealing with missing values on dimension members. For each OLAP
operator, we suggest a user-oriented definition as an algebraic formalization, along with an implementation algorithmic.
Keywords Social network analysis � OLAP operators � Null-Drilldown � Null-Rollup � Null-Select � FDrilldown �FRollup
1 Introduction
In the last decade, the data warehouse (DW) has been the
backbone of decision support systems for more than 2
decades and widely accepted and used across the globe in a
variety of applications. Contributions of the research
community in the data-warehousing field, complimented
by advancement in the relevant hardware technology, have
matured these systems in managing huge volumes of data
and providing their access with matchless efficiency to
applications and decision-makers.
Data warehousing has proven its success on structured
data and pre-established relationships among this data,
thereby achieving less performance in dealing with huge
volumes of data. The OLAP technology in a data ware-
house performs aggregated-oriented analyses from multiple
dimensions of interest.
Social media is yet another interesting domain produc-
ing much more large data volumes that trap the attention of
research and business communities. There is growing
interests in gaining insights to the way social networks
operate, their users behave, engage in conversations,
express their opinions and influence others. This involves
performing aggregations across conventional and uncon-
ventional dimensions in social media data. Furthermore,
businesses can largely benefit from this new resource and
market of social media. Provided underlying technology
and systems of data warehousing can partially solve the
challenges of data extracted from social media as their
heterogeneity, semi-structured, and velocity.
In this paper, we have projected the use of conventional
data warehouse systems, used in many businesses, over the
data issued from social media by enabling them to store,
model, operate, and consume such data. In previous work,
we have proposed a multidimensional model dedicated to
the OLAP of data exchanged through tweets [1]. This
model takes into account the specificities of data issued
from tweets. Among these specificities, we can adduce
& Maha Ben Kraiem
Mohamed Alqarni
Jamel Feki
Franck Ravat
1 MIRACL Laboratory, University of Sfax, Airport Road Km
4, P.O. Box. 1088, 3018 Sfax, Tunisia
2 University of Jeddah, CCSE, Jeddah, Saudi Arabia
3 IRIT, University of Toulouse, 118, Route de Narbonne,
31069 Toulouse Cedex 9, France

The experiments show that the k-tree model is an effective
tool to study the effects of missing data in cascades [5]
‘‘proposed a data model that captures imprecise data by
using the concept of data granularity. Data imprecision is
handled by first testing whether the data is precise enough
to answer a query. If the data is sufficiently precise, the
query is evaluated and a correct, precise answer results.
The authors suggested new strategies for data that lacks
sufficient precision. The first strategy is to suggest an
alternative query that can be answered precisely. The
second strategy handles imprecision explicitly by present-
ing three different answers to the user. The first type of
answer discards the imprecise data and uses only the
known, precise data, which leads to a conservative answer.
The second type, the liberal answer, includes everything
that could possibly be true, which allows some imprecise
data to be included. The third type of answer is a weighted
answer that includes everything that might be true, but
assigns heavier weights to precise data than to imprecise
data. Along with the aggregate computation, a separate
computation of the precision of the result is carried out.
Multiple imputation [6, 7] is a technique from statistics,
where multiple values are imputed, i.e., substituted, for
missing values, allowing data with some missing values to
be used for analysis, while retaining the natural variance in
the data.
Another imputation procedures replace missing values
by plausible estimates [8]. This results in a completed
dataset and gives the researcher the opportunity to proceed
with the analysis using standard analysis methods and
software [9]. The authors performed a simulation study to
investigate the effect of non-response and missing data on
the structural properties of social networks, and the ability
of some simple imputation techniques to treat the missing
network data.
In Ref. [10] the authors argue that new methods of
gathering data issued from social networks with a large
number of missing data introduce a greater degree of
vagueness that require reviewing the social network anal-
ysis techniques. Hence, the authors proposed a new area in
data management called ‘‘probabilistic databases’’, whose
principal goal is to supply tools to handle and manage
missing data.
Furthermore, in Ref. [11], the authors consider the
problem of aggregation using an imprecise probability data
model that allows representing imprecision by partial
probabilities and uncertainty using probability
distributions.
Other approaches are proposed for the processing of
missing data. In Ref. [12], the authors have suggested
methods which aim to find approximations to missing data
in a dataset by using ‘‘optimization algorithms’’ to improve
the network parameters. The optimization methods
missing data and reflexive relationship between tweets and their answers’ tweets on fact instances. Facing to this issue, we set a twofold purpose, first increase the efficiency of analysis and, secondly, help data-analysts. For this reason, we propose a set of algebraic OLAP operators to support analyses over the proposed multidimensional model. We illustrate the execution process of each operator using an algorithm. At last, we implement the set of analysis oper-ators in an R-OLAP framework. This framework aims at proving the feasibility of the proposed concepts and eval-uating the efficiency of carrying out analyses.
We have organized this paper as follows. Section 2 studies representative works related to the OLAP operators. Section 3 introduces our motivation example and context. Section 4 describes our modeling solution for OLAP operators. For each operator, we formalize it as an alge-braic definition and develop an algorithm to implement it. Section 5 provides experimental results and assessments on the efficiency of our proposed OLAP operators and finally, Sect. 6 concludes the paper.
2 Related works
The multidimensional data model and implementations of social networks come with a set of specific constraints, such as missing data, reflexive relationship between fact instances. However, the conventional OLAP operators have been defined for a classical multidimensional context assuming that data are present all the time [2] and, there-fore, do not provide solutions for handling those speci-ficities. This section provides a literature survey of the works related to the problems of missing data and reflexive relationship between fact instances.
2.1 Overview of works dealing with missing data
Data analysis of social networks is often impeded by the difficulty of missing data. Recent proposals highlight the effects of this difficulty mainly regarding the querying process. The analysis of data extracted from social net-works would be severely distorted when it is limited to filled fields (i.e., not null valued fields) and ignoring missing data [3].
To solve the problems due to missing data, the literature suggests numerous ways. In [4], the authors address the problem of missing data in information cascades. A cas-cade is formed when information or actions spread from node to node through the social network.’’ Given a fraction C0 of the complete cascade C, they estimate the size or depth of the complete cascade C using k-tree model. The proposed model was evaluated using information propa-gation cascades in the Twitter network (70 million nodes).
considered are genetic algorithm, simulated annealing,
particle swarm optimization, random forest and negative
selection. These methods are individually used in combi-
nation with auto-associative neural networks for missing
data estimation.
The concept of null values has been generalized to
partial values, where one of a set of possible values is the
true value. Work has been done on aggregation over partial
values in relational databases [13].
According to this study, we may conclude that missing
data in social networks is a long standing but the suggested
solutions are relatively incomplete. Indeed, most of the
works do not offer tools for the decision-maker to manip-
ulate missing data over OLAP analyses. None of the pre-
vious work fully supports carrying out analysis when
missing data are involved.
2.2 Overview of works dealing with OLAPoperators on fact table
To the best of our knowledge, no solution for OLAP
analysis is proposed for Drilling Down and Up on the fact
in the multidimensional schema. Only few querying oper-
ators on fact (Drill-Across, FRotate) are formally proposed
in Refs. [2, 14].
The Drill-Across operator relates information contained
in two multidimensional facts having some common
dimensions. According to [16]. Other authors relax this
restriction, [14, 15] define the Drill-Across as replacing a
currently analyzed fact F1 with another fact F2 while
keeping the same analysis space (current dimensions). The
authors have identified semantic relationships between
dimensions and facts: Derivation, Generalization, Associ-
ation and Flow to extend possibilities to Drill-across. These
relationships between dimensions and facts improve the
conformity between attributes and could be used to navi-
gate or Drill-across between Star schemas, even when
dimensions are not shared. The authors in [17] define the
Drill-across as an extension to the natural join where the
intersection of the two dimensions is aggregated at the
finest grain of these dimensions. Furthermore, [18] propose
extending the navigation operation Drill-across to include
the non-conformed dimensions.
The FRotate operator defined in [2] consists in using a
new fact in the multidimensional table while preserving the
characteristics of the current analysis axes. The new fact
must share at least the two current (i.e., displayed)
dimensions with the current fact. Note that the fact rotation
operation FRotate, is equivalent to the Drill-Across oper-
ation [15].
According to this study, we may conclude that none of
these works offers tools for the decision-maker to navigate
(Drilling-down, and -up) through the fact. So far, the
OLAP frameworks lack the ability to cope with this
problem.
To alleviate this drawback, our proposed OLAP opera-
tors namely FDrilldown and FRollup go further according
to a new Reflexive relationship on the fact instances. These
new operators allow modifying the analysis level in a fact
while keeping the same analysis context (i.e., maintaining
the currently dimensions for the analyzed fact). Hence, data
analysts would benefit greatly from the ability to navigate
and view combined multidimensional data from multiple
levels of fact.
Facing to these issues, we aim at proposing a modeling
solution for OLAP analysis operators. In contrast with the
related work, our proposed analysis operators should
facilitate decision-makers’ tasks by not requiring the
involved missing data. Moreover, they allow navigating
down and up through the implicit hierarchical levels of the
fact; this represents the first step to detect strong connec-
tions between fact instances and, therefore discover inter-
esting or amazing topics and then conduct much more deep
analysis of such data sets.
3 Motivation example
3.1 Multidimensional model
Referring to our multidimensional model dedicated to the
OLAP of data exchanged through tweets, our motivation
example relies on the ‘Tweet Constellation’ proposed in
[18]. This model has two facts namely FACTIVITY-
TWITTOS and FACTIVITY-TWEET. The first fact corre-
sponds to an observation on user accounts and allows the
analysis of the user activity over time, whereas the FAC-
TIVITY-TWEET fact is a reflexive fact. It models links
between a tweet and the person concerned by the answer
(answered person) and then allows participants and other
readers to follow easily the exchange of tweets. Being
reflexive, FACTIVITY-TWEET allows interconnecting
instances of the same fact hierarchically. In practice, if a
tweet tr is a reply to tweet t, tr refers t (it contains the ID of
tweet t). This reflexive relationship between tweets will
guarantee that every tweet response inserted to the DW
corresponds to an existing tweet so that the analysis of a set
of linked tweets becomes possible. Our ‘Tweet Constella-
tion’ multidimensional model is composed of five dimen-
sions namely DTime, DSource, DTweet-Metadata, DPlace
and DUser. Figure 1 depicts the extended multidimen-
sional model for tweets. For further details on the Tweet
Constellation model, refer to [1].

Transformation
Rule 1
Each dimension D will be transformed
into a relational table which columns
are parameters and weak attributes of
all hierarchies of D. The primary key of
the table is the attribute of the finest
level of granularity of all hierarchies of
D. For the Empty Dimension, we create
one instance for which we generate a
surrogate key and keep Null all its other
attributes. Thus, instances of the fact
may be associated with this dimension
instance
Fig. 1 Multidimensional constellation model dedicated for the OLAP of tweets
3.2 Logical modeling: R-OLAP
Once the conceptual model is defined, the logical model can be derived by applying a set of transformation rules. In this section, we define the rules to transform a constellation into R-OLAP logical model.
Although the various types of R-OLAP models, we have opted for detailing the transformation rules for the denor-malized R-OLAP model. This model is the most used because it needs less join operations during queries exe-cution. We will suggest some extensions to the denor-malized R-OLAP model in order to reflect the specificities of the proposed multidimensional model (Reflexive Fact, Empty dimension, measure of the type List of elements).
We transform the proposed constellation model into R-OLAP logical model according to the following set of three rules:
Transformation
Rule 2
Each fact F will be transformed into a
relational table of the same name which
columns are all measures of F and
foreign keys referencing the dimensions
connected to F. For a reflexive fact, the
primary key contains an additional
attribute which corresponds to the tweet
identifier (Id-Twt) and a foreign key
(Id-Twt-Response) which can be either
null, or has a values referring an
existing tweet (Id-Twt). Note that the
reflexive relationship between tweets is
supported by the referential integrity
constraint. ‘‘It requires that a foreign
key value must reference a valid,
existing primary key value in the parent
table’’. The primary key of a non-
reflexive fact is the concatenation of its
foreign keys.
Transformation
Rule 3
Each measure of type List of elements
is transformed into a relational
table called T-MeasureName. The
primary key of the T-MeasureName
table is the concatenation of the primary
key of the fact with an additional
attribute (Position of a hashtag in our
case).
Example: The measure Hashtag-Name that has the type
List of element (in the FACTIVITY-TWEET Fact) becomes
a relational table named T-HashtagName, where Id-Twt
and Position of a Hasthag (in the tweet) are its primary key.
Figure 2 depicts the R-OLAP model resulted from the
transformation process of the multidimensional constella-
tion diagram of Fig. 1.
4 Extended OLAP operators for missing data
The multidimensional data model and implementations of
social networks come with a set of further constraints, such
as missing data. This is the case where there is simply no
value provided at all. Technically, the loading process
detects NULL values. Actually, the missing data problem
is omnipresent in OLAP applications. Some research
authors ignore null values as [3], others replace missing
data by plausible estimates in the data set as in [9], etc. All
the literature works related to this problem apply on the
data set.
Existing OLAP operators cannot be successfully applied
to handle the above-mentioned challenge. These operators
have been defined in a classical context assuming that data
are present all the time [2]. So, a remarkable effort should
be made to extend these operators to take into considera-
tion the specificity of multidimensional modeling of tweets
(missing data).
Facing to this issue, we propose to extend three OLAP
operators Drilldown, Rollup and Select. We call the
extended versions Null-Drilldown, Null-Rollup and Null-
Select, in order to support missing data by offering new
options. The user should choose between three options,
either All, AllNullLast, or Flexible option to ensure the proper
performance of analysis operators. Our extended OLAP
operators improved the analysis results either by reorga-
nizing the multidimensional table moving non-significant
rows to the bottom of the result table (AllNullLast), or by
displaying percentages of not-null data (Flexible option). In
fact, our approach keeps the original data set unchanged
and treat the problem at the manipulation level i.e., using
our proposed OLAP operators, without affecting the data
warehouse content; this is very important because for some
decisional-users data should not be altered and then kept as
initially extracted from the social network.
For each of these OLAP operators, we propose a user
oriented definition along with an algorithmic translation for
its implementation.
4.1 Changing analysis granularity
We extend two operators to allow changing the granularity
levels of analysis, namely Null-Drilldown and Null-Rollup,
both take several arguments as input: a currently displayed
multidimensional table, an analysis dimension, a parameter
and a Null-option argument. During execution, these
operators exploit the navigation paths defined by the cur-
rently displayed hierarchy and produce a new multidi-
mensional table containing information at a different
granularity levels.
4.1.1 Null-Drilldown OLAP operator
Classically, the Drilldown operator allows displaying
aggregated fact’s measures at a finer granularity level
according to dimensions. After Drilling-down on a
dimension, the decision-maker obtains a new multidimen-
sional table where the drilled dimension displays infor-
mation at a finer granularity level without changing the
granularity levels of the other dimension(s).
We extend the classical Drilldown operator by taking
into account the involved missing data during the analysis.
The user should choose between three options, either All,
AllNullLast, or Flexible option to ensure the proper perfor-
mance of analysis operator. Our extended OLAP operator
improved the analysis results either by reorganizing the
multidimensional table moving non-significant rows at the

bottom of the table (AllNullLast), or by displaying percent-
ages of not-null data (Flexible option).
4.1.1.1 Conceptual definition See Table 1.
Example 1. In order to introduce, test and assess our
proposed operator, we have extracted and loaded a dataset
containing 25,508 tweets belonging to different geo-
graphical places. Note that, in Fig. 1, the fields of the
PLACE dimension are not valued in all tweets.
For instance, assume that a decision-maker starts his
analysis by displaying the total number of tweets according
to the Country parameter of the DPLACE dimension and
the User-Activity of the DUSER dimension. This displays
the table MT0 (in Fig. 3).
After executing the previous query, the decision-maker
continues her/his analysis by displaying the number of
tweets at a finer granularity level (Region) on one current
displayed dimension (DPLACE in our running example)
and without changing the granularity level User-Activity of
the DUSER dimension. The analysis expression is:
MT1 Drilldown ðMT0; DPLACE; RegionÞ ð1Þ
Figure 4 shows the result.
Note that many missing data are involved in such
analysis (cf. Fig. 4). Based on the results shown in MT1,
the Null-Drilldown operator has to adapt itself in accor-
dance to the null-option. The decision-maker may receive
three different versions of multidimensional tables accord-
ing to the specified value for the Null-option in the Null-
Drilldown.
– If the option All is used, we keep the analysis
granularity to Region level. The corresponding OLAP
algebraic expression is the following:
MT1 Null
� Drilldown MT0; DPLACE; Region; Allð Þ:
– If the ALLNullLast option is used, the Drilldown returns
all rows including those containing null-values of
parameter Pinf. The rows containing null values are
pushed to the end of the resulted multidimensional
table. The corresponding algebraic expression is:
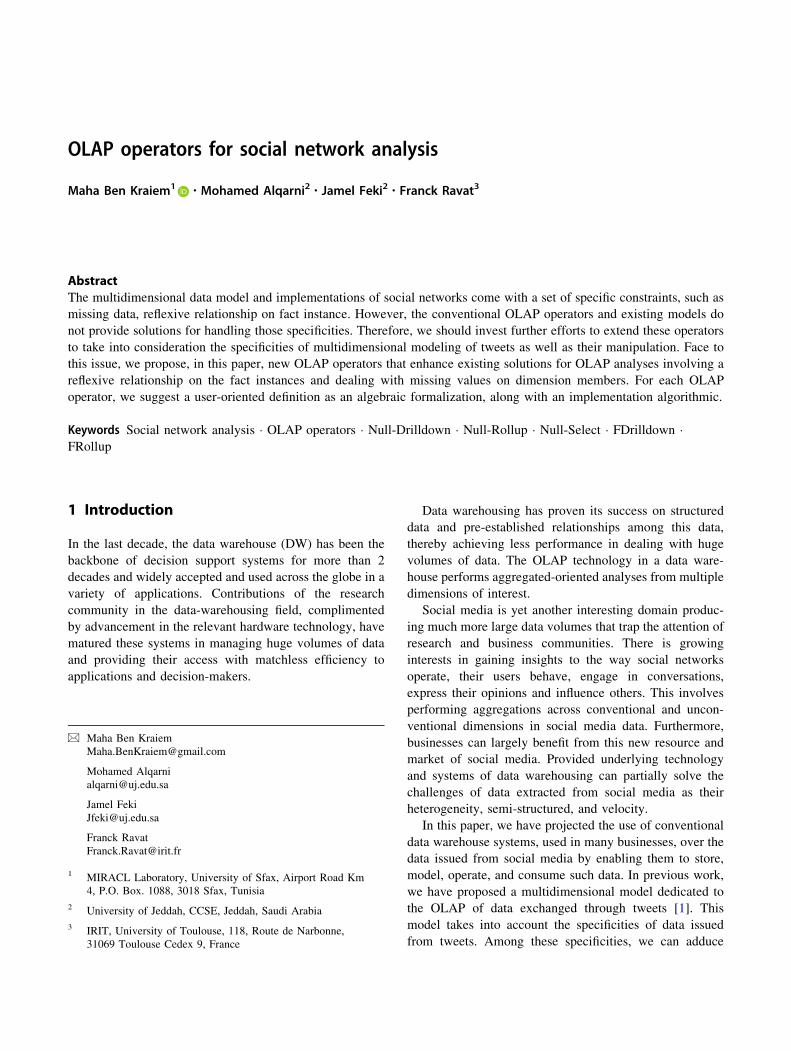
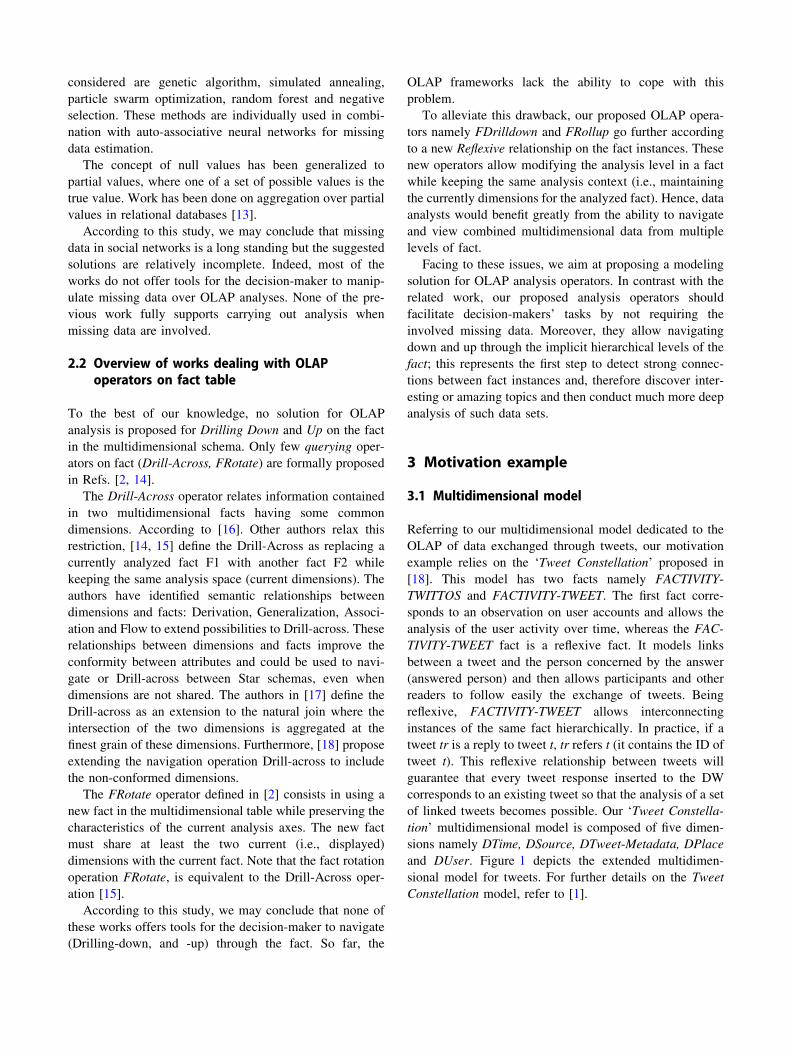
MT2 Null�Drilldown MT0;DPLACE;Region;AllNullLastð Þð2Þ
Fig. 2 R-OLAP logical model for constellation of Fig. 1

Figure 5 depicts the result of expression 2.
– Using the Flexible option, the Null-Drilldown augments
the granularity level of the selected parameter. Thus, an
additional result displays for each parameter of level
lower than Region the percentage of the missing values
as below:
Department Null %ð Þ : 99:16 %
City Null %ð Þ : 9744 %
The decision-maker chooses the parameter having a
percentage of missing values less than the threshold he has
defined, 20% for example. Thereafter, the parameter Re-
gion is replaced with City. The corresponding analysis
expression is:
Table 1 Algebraic formalization of the Null-Drilldown operator
MT Null-Drilldown (MTk , Di , Pinf , [Null-Option], [S]) Input - MTk: A multidimensional table currently displayed
- Di: One among the two dimensions displayed in MTk
- Pinf: A parameter of lower level than the lowest parameter displayed inthe current hierarchy of Di.
- Null-Option {All | AllNullLast | Flexible}: an optional parameter toindicate how null-values of parameter Pinf will be treated by the Null-Drilldown. If no option is specified, the default is All.- All: is the default option, it means that the Drilldown returns all
rows / columns including those containing null values of parameterPinf.
- AllNullLast: The Drilldown returns all rows including those containingnull-values of parameter Pinf. It displaces all rows / columnscontaining null values to the end of the result multidimensionaltable MT.
- Flexible: If the percentage of null values returned for Pinf exceedsthe threshold S, the operator changes the granularity level of Pinf inorder to find a parameter p of lower level than Pinf having apercentage of null values less than S. A message will be posted tothe user; it contains the percentage of null values for each parameterp. So, the user will be guided to select the adequate parameter pinstead of Pinf.
- S: An optional threshold defined by the decision-maker, it indicatesthe highest acceptable percentage of null values(Percentage_Null_Values) in all rows or columns in the result.
Percentage_Null_Values = Number of cells containing null values / Card (MT).
Output MT is the resulting multidimensional table.
Fig. 3 MT0: Result
multidimensional table for
Example 1
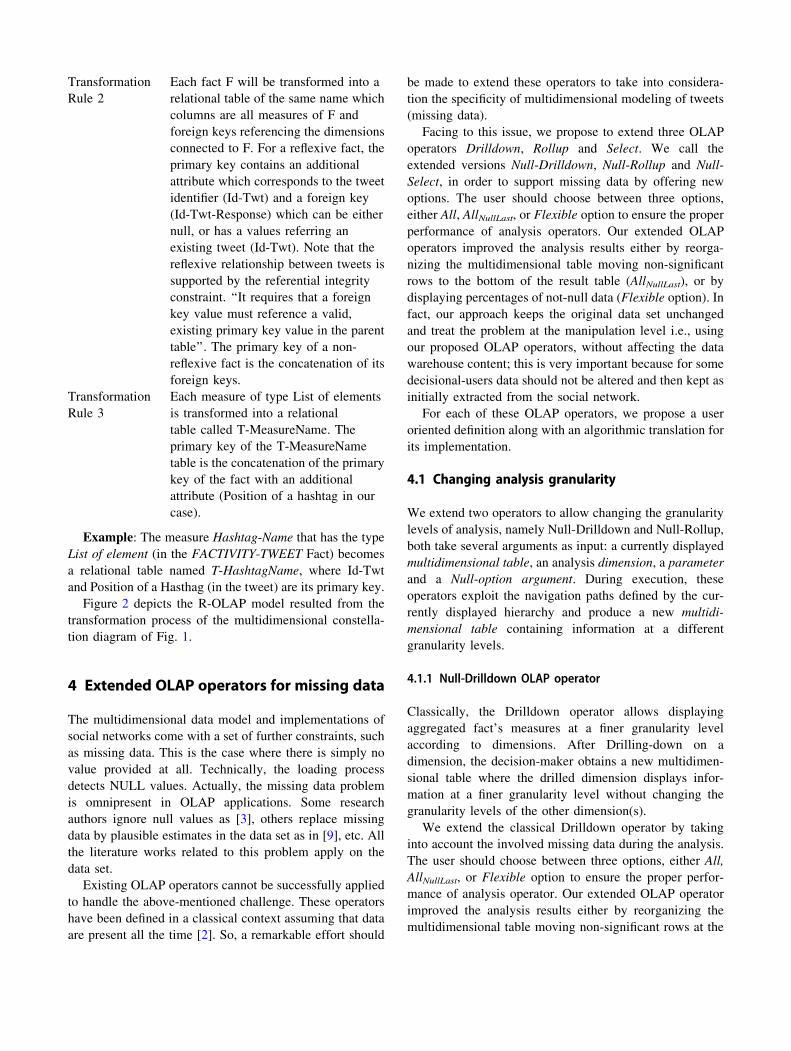
MT3 Null�Drilldown ðMT0; DPLACE;City; Flexible; 20 %Þð3Þ
Figure 6 is the result of expression 3. Note that the
analysis of data by the City parameter has improved the
results since most of the missing values due to two
parameters Department and Region are no longer included
in table MT3. We may conclude that the extended operator
has both increased the efficiency of analysis and facilitated
the analysts’ task by discarding more than 80% of missing
data.
4.1.1.2 Logical definition The algorithm Null-Drilldown
depicts the processing logic of the Null-Drilldown opera-
tor; it uses two functions defined as follows:
– Length (HD, D): returns the number of levels in
hierarchy HD of dimension D
– Level (p, HD, D): returns the level of parameter p, in
hierarchy HD of dimension D starting from 1 for the
finest parameter.
Fig. 4 MT1: Result of the
Drilldown in expression (2)
Fig. 5 MT2: Result of the Null-
Drilldown in expression (2)
Fig. 6 MT3: Result of the Null-
Drilldown in expression (3)

Algorithm Null-Drilldown: // MT Null-Drilldown (MTk , Di , Pinf , [Null-Option], [S])
InputMTk: Multidimensional Table D {D1, D2}: One of the two dimensions displayed in MTkPinf: a parameter of HD to reach by drillingNull-option: Indicates how null-values of parameters Pinf will be treated by the DrilldownS: Optional threshold to indicate the highest acceptable percentage of null values (Percentage_Null_Values) in the result.OutputMT: the result multidimensional table, with the same structure as MTk
Begin1. Let HD be the actually displayed hierarchy of D2. Let Par = {pn, pn-1,…,pc} be the set of displayed parameters of HD where c is
the level of the finest displayed parameter of HD, and n is the level of thefinest parameter of HD (i.e., n= Length(HD, D)), (c ≤ n)
3. If Level (pc, HD, D,) ≤ Level (Pinf, HD, D) then4. Impossible operation, Pinf has finer granularity than the displayed parameter pc.5. Else6. Translate Null-Drilldown (MTk; D; Pinf) into query Q such as
Q = ‘SELECT’ || pn, pn-1,…, Pinf || f1(m1), f2(m2),…|| ‘FROM’ || D1, D2, F ||‘WHERE’ || Join conditions || ‘AND’ || Pred || ‘GROUP BY’ || pn, pn-1,…, Pinf|| ‘ORDER BY’ || Pinf
7. MT = Execute (Q)8. Percentage_Null_Values = Number of cells containing null values of Pinf in
MT / Card(MT)9. If Percentage_Null_Values > S then 10. If Null-option = “Flexible” then11. For each parameter pj HD (1 ≤ j < Level (Pinf, HD, D))12. ContinueDrilling = True13. While ContinueDrilling14. Drop table MT15. Translate Null-Drilldown (MTk; D ; pj) into query Q such as
Q = ‘SELECT’ || pn, pn-1,…, pj || f1(m1), f2(m2),…|| ‘FROM’ ||D1, D2, F || ‘WHERE’ || Join conditions || ‘ AND ’ || Pred ||‘GROUP BY’ || pn, pn-1,…, pj || ‘ORDER BY’ || pj;
16. MT = Execute (Q)17. Percentage_Null_Values = Number of rows containing null
values of pj in MT / Card(MT)18. If Percentage_Null_Values < S then 19. Display table MT20. ContinueDrilling = False21. End If22. j = j+123. End While24. Else25. Drop table MT26. Translate Null-Drilldown (MTk; D; Pinf) into query Q such as
Q = ‘SELECT’ || pn, pn-1,…, Pinf || f1(m1), f2(m2),…|| ‘FROM’ || D1, D2, F ||‘WHERE’ || Join conditions || ‘AND’ || Pred || ‘GROUP BY’ || pn, pn-1,…, Pinf || ‘ORDER BY’ || Pinf;
27. MT = Execute (Q)28. If null-option = “AllNullLast” then29. Translate Null-Drilldown (MTk; D; Pinf, AllNullLast) into query Q such
asQ = ‘SELECT’ || pn, pn-1,…, Pinf || f1(m1), f2(m2),…|| ‘FROM’ || D1, D2,
F || ‘WHERE’ || Join conditions || ‘AND’ || Pred || ‘GROUP BY’ || pn, pn-1,…, Pinf ||‘ORDER BY’ || Pinf || ‘DESC NULLS LAST’;
30. MT = Execute (Q)31. End if32. Display MT33. End For34. End if35. End if36. End if37. End
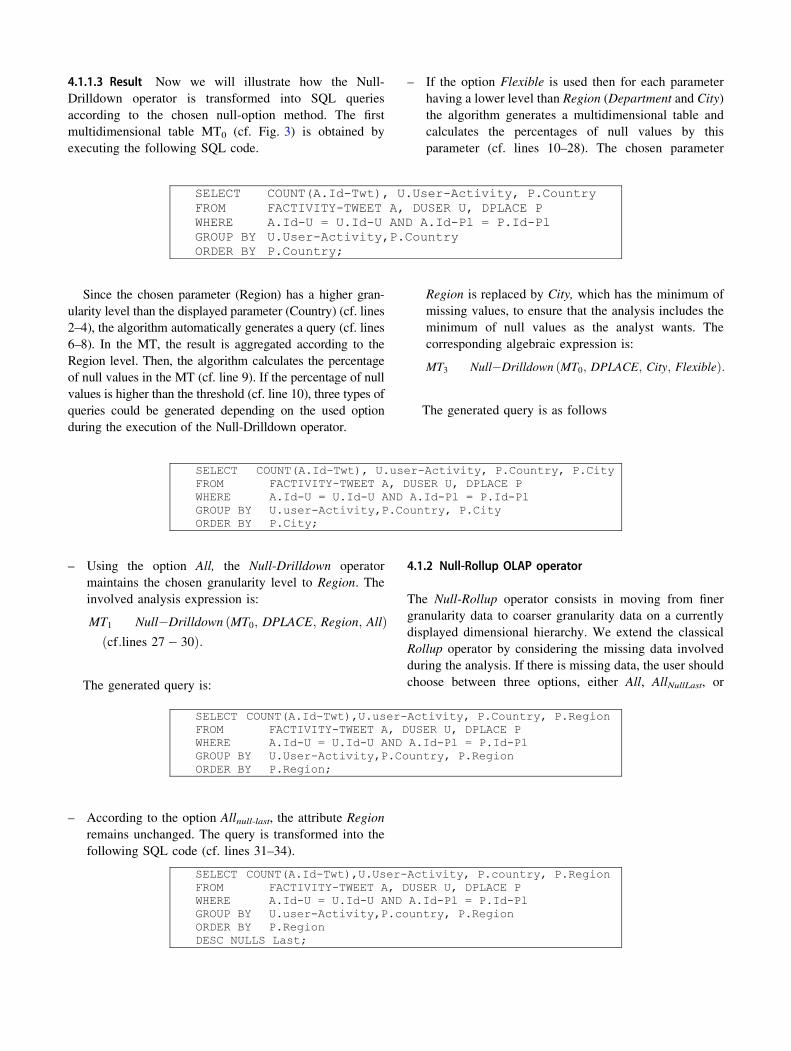
4.1.1.3 Result Now we will illustrate how the Null-
Drilldown operator is transformed into SQL queries
according to the chosen null-option method. The first
multidimensional table MT0 (cf. Fig. 3) is obtained by
executing the following SQL code.
Since the chosen parameter (Region) has a higher gran-
ularity level than the displayed parameter (Country) (cf. lines
2–4), the algorithm automatically generates a query (cf. lines
6–8). In the MT, the result is aggregated according to the
Region level. Then, the algorithm calculates the percentage
of null values in the MT (cf. line 9). If the percentage of null
values is higher than the threshold (cf. line 10), three types of
queries could be generated depending on the used option
during the execution of the Null-Drilldown operator.
– Using the option All, the Null-Drilldown operator
maintains the chosen granularity level to Region. The
involved analysis expression is:
MT1 Null�Drilldown MT0; DPLACE; Region; Allð Þcf:lines 27� 30ð Þ:
The generated query is:
– According to the option Allnull-last, the attribute Region
remains unchanged. The query is transformed into the
following SQL code (cf. lines 31–34).
– If the option Flexible is used then for each parameter
having a lower level than Region (Department and City)
the algorithm generates a multidimensional table and
calculates the percentages of null values by this
parameter (cf. lines 10–28). The chosen parameter
Region is replaced by City, which has the minimum of
missing values, to ensure that the analysis includes the
minimum of null values as the analyst wants. The
corresponding algebraic expression is:
MT3 Null�Drilldown MT0; DPLACE; City; Flexibleð Þ:
The generated query is as follows
4.1.2 Null-Rollup OLAP operator
The Null-Rollup operator consists in moving from finer
granularity data to coarser granularity data on a currently
displayed dimensional hierarchy. We extend the classical
Rollup operator by considering the missing data involved
during the analysis. If there is missing data, the user should
choose between three options, either All, AllNullLast, or
SELECT COUNT(A.Id-Twt),U.User-Activity, P.country, P.RegionFROM FACTIVITY-TWEET A, DUSER U, DPLACE PWHERE A.Id-U = U.Id-U AND A.Id-Pl = P.Id-PlGROUP BY U.user-Activity,P.country, P.RegionORDER BY P.RegionDESC NULLS Last;
SELECT COUNT(A.Id-Twt),U.user-Activity, P.Country, P.RegionFROM FACTIVITY-TWEET A, DUSER U, DPLACE PWHERE A.Id-U = U.Id-U AND A.Id-Pl = P.Id-PlGROUP BY U.User-Activity,P.Country, P.RegionORDER BY P.Region;
SELECT COUNT(A.Id-Twt), U.User-Activity, P.CountryFROM FACTIVITY-TWEET A, DUSER U, DPLACE PWHERE A.Id-U = U.Id-U AND A.Id-Pl = P.Id-PlGROUP BY U.User-Activity,P.CountryORDER BY P.Country;
SELECT COUNT(A.Id-Twt), U.user-Activity, P.Country, P.City FROM FACTIVITY-TWEET A, DUSER U, DPLACE P WHERE A.Id-U = U.Id-U AND A.Id-Pl = P.Id-PlGROUP BY U.user-Activity,P.Country, P.CityORDER BY P.City;

Flexible option. Table 2 shows the algebraic formalization
of this extended operator.
4.1.2.1 Conceptual definition Example 2. The decision-
maker continues her/his analysis rolling up analysis level.
Suppose he intends to get the total number of tweets by
City (DPLACE dimension) and User-Category (DUSER
dimension). The MT4 table in Fig. 7 shows this result.
For instance, if we continue the analysis and want to roll
up from the City level to the Country level, the analysis
expression is (4).
MT5 Null�Rollup ðMT4; DPLACE; CountryÞ ð4Þ
Figure 8 shows the obtained results. According to this
analysis, no missing values are involved by the chosen
parameter. Hence, no null-option method needs to be
specified for Null-Rollup operator (cf. Algorithm Null-
Rollup).
4.1.2.2 Logical definition The following algorithm
describes the processing logic of the Null-Rollup operator.
Table 2 Algebraic Formalization of the Null-Rollup operator
MT Null-Rollup (MTk; Di; Psup; [Null-Option], [S]))
Input - MTk: The multidimensional table currently displayed- Di: One among the dimensions currently displayed in MTk
- Psup: A parameter of higher level than the highest parameter displayedin the current hierarchy of Di.
- Null-Option: {All | AllNullLast | Flexible}: An optional parameter tospecify how the Null-Rollup will treat missing data of parameter Psup.If no option is specified the default ALL is assumed.- ALL: The Rollup operator returns all the values corresponding to
the parameter Psup including the null-values.- AllNullLast: Idem as ALL with pushing to the end of the
multidimensional table all rows / columns containing null values.- Flexible: If the percentage of null values returned for Psup exceeds
the threshold S, the Rollup operator changes the granularity levelin order to find a parameter p of higher level than Psup having apercentage of null values less than S. A message will be posted tothe user; it contains the percentage of null values for eachparameter p. this helps the user selecting the adequate (i.e., theminimum percentage of the null values) parameter p instead ofPsup.
- S: Optional threshold to indicate the highest acceptable percentage ofnull values (Percentage_Null_Values) in all rows or columns in theresult.Percentage_Null_Values = Number of cells containing null values /
Card (MT). Output MT is the resulting multidimensional table.
Fig. 7 MT4: Result
multidimensional table for
Example 2

Algorithm Null-Rollup: // MT Null-Rollup (MTk , Di , Psup , [Null-Option], [S])
Input MTk: Multidimensional table MT: New multidimensional table, with the same structure as MTk
D {D1, D2} one between the two dimensions of MTk Psup: Chosen parameter in the current HD of dimension D in the current MTk Null-option: Indicates how null-values of parameters Psup will be treated by the
Rollup S: Optional threshold to indicate the highest acceptable percentage of null values
(Percentage_Null_Values) in the result. Output MT: the result multidimensional table, with the same structure as MTk
Begin 1. Let HD be the current displayed hierarchy of D2. Let Par = {pn, pn-1,…, pc} be the set of displayed parameters of HD such as n
and c are respectively the levels of the lowest and highest displayed parameterof HD (i.e., c= Length(HD, D)), (c ≥ n)
3. If Level (pc, HD, D,) ≥ Level (Psup, HD, D) then4. Impossible operation, the parameter Psup is of higher granularity level than the
specified parameter pc displayed.5. Else6. Translate Null-Rollup (MTk; D ; Psup) into query Q such as
Q = ‘SELECT’ || pn, pn-1,…, Psup || f1(m1), f2(m2),…|| ‘FROM’ || D1, D2, F || ‘WHERE’ || Join conditions || ‘ AND ’ || Pred || ‘GROUP BY’ || pn, pn-1,…, Psup || ‘ORDER BY’ || Psup ;
7. MT = Execute (Q).8. Percentage_Null_Values = Number of cells containing null values of Psup in
MT / Card(MT)9. If Percentage_Null_Values > S then10. If Null-option = “Flexible” then11. For each parameter pj HD (Level (Psup, HD, D) < j ≤ Level (pc, HD, D))12. ContinueDrilling = True13. While ContinueDrilling14. Drop table MT15. Translate Null-Rollup (MTk; D ; pj) into query Q such as
Q = ‘SELECT’ || pn, pn-1,…, Psup || f1(m1), f2(m2),…|| ‘FROM’ || D1,D2, F || ‘WHERE’ || Join conditions || ‘ AND ’ || Pred || ‘GROUP BY’ || pn, pn-1,…, Psup || ‘ORDER BY’ || Pj;
16. MT = Execute (Q)17. Percentage_Null_Values = Number of rows containing null values
of pj in MT / Card(MT)18. If Percentage_Null_Values < S then19. Display table MT20. ContinueDrilling = False21. End If22. j = j+1 23. End While24. Else25. Drop table MT26. Translate Null-Rollup (MTk; D ; Psup) into query Q such as
Q = ‘SELECT’ || pn, pn-1,…, Psup || f1(m1), f2(m2),…|| ‘FROM’ || D1,D2, F || ‘WHERE’ || Join conditions || ‘ AND ’ || Pred || ‘GROUP BY’ || pn, pn-1,…, Psup || ‘ORDER BY’ || Psup ;
27. MT = Execute (Q)28. If null-option = “AllNullLast” then29. Translate Null-Rollup (MTk; D ; Psup, AllNullLast) into
query Q such as Q = ‘SELECT’ || pn, pn-1,…, Psup || f1(m1), f2(m2),…||
‘FROM’ || D1, D2, F || ‘WHERE’ || Join conditions || ‘AND’ || Pred || ‘GROUP BY’ || pn, pn-1,…, Psup || ‘ORDER BY’ || Psup || ‘DESC NULLS LAST’;
30. MT = Results of query Q 31. End if32. Display MT33. End For34. End if35. End if 36. End if37. End

4.2 Adding restriction predicates
During a decisional process, the Select operator allows
removing fact and dimension instances that do not satisfy
some specified selection criteria. Like other analysis
operators, the Select operator cannot avoid involving
missing data. For this reason, we define a new version of
the classical Select operator. In case of missing data are
involved by the selection criteria, the user should choose
between three options, either All, AllNullLast, or Flexible
option to ensure good performance of the analysis.
4.2.1 Null-Select OLAP operator
Facing a large volume of missing data, we propose an
extension for the conventional Select operator called Null-
Select, which allows removing dimension instances con-
taining null values from the result multidimensional table.
Table 3 shows the algebraic formalization of the extended
operator.
4.2.1.1 Conceptual definition Example 3. The formerly
obtained MT1 (cf. Fig. 4) shows the total number of tweets
Fig. 8 MT5: Result of the Null-
Rollup in expression (4)
Table 3 Algebraic Formalization of the Null-Select operator
MT Null-Select (MTk; Pred; [Null-Option], [S])
Input - MTk: A multidimensional table currently displayed- Pred : A set of restriction predicates to apply on the dimensions or
the fact in MTk
- Null-Option: {All | AllNullLast | Flexible}: an elective parameter tospecify how missing data involved by the restriction predicates willbe treated by the Null-Select, the default is ALL.- ALL: The Select will return all the values corresponding to the
restriction predicates including the null-values.- AllNullLast: Idem as ALL with pushing to the end of the
multidimensional table all rows / columns containing nullvalues.
- Flexible: If the percentage of null values involved by eachrestriction predicate exceeds the threshold S, the operator willreturn only the non-null values corresponding to this predicate.A message posted to the user displays the percentage of nullvalues for each restriction predicate. However, if there is toomany missing values we remove certain restriction predicates.As an extreme example, the set of restriction predicates in MTremains unchanged (the same as MTk).
- S: Optional threshold to indicate the highest acceptable percentageof null values (Percentage_Null_Values) in all rows or columns inthe result.
Percentage_Null_Values = Number of cells containing null values /Card (MT).
Output MT is the resulting multidimensional table.

by the parameters Region (DPLACE dimension) and User-
Activity (DUSER dimension). If we want to explore the
number of tweets where Region is different from ‘Ile-De-
France’ (Pred1) and the total number of tweets by region
exceeds 500 tweets (Pred2), thus this analysis can be per-
formed with a Null-Select operator including two restric-
tion predicates. The OLAP analysis is calculated according
to the algebraic expression (5):
MT6 Null�Select ðMT1;DPLACE: Region!¼ ‘Ile�De�France’ ^ count ðId�TwtÞ[ 500; All
ð5Þ
Figure 9 shows the result of expression (5).
The result table contains only null values, they are due
to the selection condition Pred2 (‘count (Id-Twt)[ 500’).
Note that using the Flexible option, this analysis becomes
as in expression (6).
MT7 Null�Select ðMT1; PLACE: Region!¼ ‘Ile�De�France’; FlexibleÞ ð6Þ
Therefore, even the null values returned by Pred1 are
removed and a message is posted to the decision-maker,
the message will contain the percentage of the null values
removed (cf. Fig. 10).
4.2.1.2 Logical definition The algorithm Null-Select
describes the processing logic of the Null-Select operator.
Fig. 9 MT6: Result of the Null-
Select in expression (5)
Fig. 10 MT7: Result of the Null-
Select in expression (6)

5 OLAP operator for reflexive relationshipon the fact
Previously, in ref. [1], we have proposed an extension for
the classic concept of fact by adding a reflexive relation-
ship between fact instances. This fact-to-fact reflexive
relationship allows connecting an instance of the fact to
one or several instances of the same fact. Based on this
relationship, the fact instances are linked at many succes-
sive levels. In practice, if a tweet is a reply tweet, it con-
tains the ID of a previous tweet. This reflexive relationship
will guarantee that every tweet response inserted to the data
warehouse corresponds to an existing tweet so that the
analysis of linked tweets becomes possible.
Table 4 shows a set of seven reflexive tweets from the
fact FACTIVITY-TWEET.
Algorithm Null-Select: // MT Null-Select (MTk, Pred, [Null-Option], [S])
Let Predk be the set of restriction predicates on MTk
InputMTk: A multidimensional table Pred: a set of restriction predicates to apply on dimensions.Null-option: Indicates how null-values will be treated by the SelectS: Optional threshold to indicate the highest acceptable percentage of null values (Percentage_Null_Values) in the result.OutputNew multidimensional table MT, with the same structure as MTkDeclare function Generate_ Query_Select (MT; Pred, [Null-option])Q = ‘SELECT’ || pn, pn-1,…, p1 || f1(m1), f2(m2),…|| ‘From’ || D1, D2, F || ‘
WHERE’ || Join condition || ‘AND’ || Pred || ‘GROUP BY’ || pn, pn-1,…, p1;Return QBegin1. For each predj Pred2. Q = Generate_ Query_Select (MTk; Predj)3. MT = Execute(Q)4. Percentage_Null_Values = Number of cells containing null values in MT /
Card(MT)5. If Percentage_Null_Values = 100 then6. Pred = Pred \ [predj]7. Display a warning message about the deletion of Predj8. Else9. If Percentage_Null_Values > S then10. If Null-option = “Flexible” then11. Drop table MT12. Q = Generate_ Query_Select (MTk; Pred, Flexible)13. MT = Execute (Q) Null_Values14. Display table MT15. Else16. Drop table MT17. Q = Generate_Query_Select (MTk; Pred)18. MT = Execute (Q)19. If null-option = “AllNullLast” then20. Q = Generate_Query_Select (MTk; Pred,
AllNullLast)21. MT = Execute (Q)22. End if23. Display MT24. End if25. End if26. End if27. End For28. End

In the example in Table 4, we distinguish six hierar-
chical levels. The first level corresponds to the tweet at line
1. The second level corresponds to tweets at lines 2 and 3,
which are responses to the same tweet in line 1. Finally,
tweets from lines 4–7 correspond, respectively, to levels 3,
4, 5 and 6 (cf. Fig. 11). Hence, we may notice that due to
the reflexive relationship on fact instances, the fact is
composed of hierarchical data at multiple levels and allows
a decision-maker to navigate between levels. Using levels
in OLAP offers further alternatives analyses since it pro-
vides users with the flexibility to view data from different
perspectives.
Tweets responses can be understood both as a form of
information broadcasting and as a structure where people
can be part of a conversation. One interpretation of Twit-
ter’s value derives from the real-time nature of its con-
versations which necessarily form trending topics.
However, classical OLAP algebra does not provide
solutions for handling an intuitive navigation between
levels of the fact’s instances based on the reflexive rela-
tionship. Hence, we define in this section two new OLAP
operators called FDrilldown and FRollup. They allow
navigating through the hierarchical levels of the fact, in
order to analyze a measure with more or less precision.
Drilling upwards (FRollup) consists in displaying the data
Table 4 Sample of seven interconnected instances of tweets from FACTIVITY-TWEET
N ID-Twt Content Id-Twt-Response LEVEL
1 946077853262778373
Tu sais que tu n’as rien foutus de ta journée quand ton AppleTV te demande si tu es encore là. #BingeWatching #NoLife
- 1
2 946078190027661312 "@lolfr C’est bien aussi :) T’as vu quoi ?" 946077853262778373 2
3 946084024375750657 @cegron On my list. J’ai jusqu’au 31 pour rattraper mon retard.
946078190027661312 2
4 946078475923935232 @cegron The Punisher. J’étais en retard. ¿ 946078190027661312 3
5 946078699283206145 "@lolfr Moins que moi, alors. Je n’en suis qu’au 8" . 946078475923935232 4
6 946079260711768064 @cegron Ah mais j’ai pas fini. Épisode 6 seulement. ¿ 946078699283206145 5
7 946080193910853633
"@lolfr I.N.E.X.C.U.S.A.B.L.E ¿Tu as le spécial noël de DoctorWho aussi"
946079260711768064 6
Fig. 11 Hierarchy of levels of
tweets listed in Table 4

with a coarser level of detail. Drilling downwards
(FDrilldown) consists in displaying the data with a finer
level.
The proposed operators are well suited to decision
making applications since they can produce an output that
leads to many different kinds of analyses. They allow
identifying topics that have elicited a significant number of
responses; these topics can be more investigated/explored
using sophisticated tools based on ‘‘Text Mining’’ tech-
niques. Thus, we can extract knowledge from tweets and
strengthen more semantics.
5.1 FDrilldown operator
The FDrilldown operator applies to a reflexive fact; it
consists in moving from coarser-level data to finer level
data within the same analyzed fact. This drilling is possible
due to the presence of the reflexive relationship on fact
instances. Next, we give the FDrilldown algebraic
formalization.
5.1.1 Conceptual definition
See Table 5
5.1.2 Logical definition
The FDrilldown algorithm develops the logic of the
FDrilldown operator. Note that ‘‘For each row r in the
result set, the keyword LEVEL returns the depth in the
hierarchy (hierarchical level) of the node represented by
row r. The LEVEL of the root node is 1, the LEVEL of an
immediate child of the root node is 2, and so on’’.1
Table 5 Algebraic
formalization of the FDrilldown
operator
MT / FDrilldown (MTk, F, Lvlinf)
Input – MTk: A multidimensional table currently displayed
– F: Reflexive fact analyzed in MTk and on which the drilling operation will be applied
– Lvlinf : A level lower than the displayed level in the current fact F
Output MT is the result multidimensional table
Algorithm FDrilldown:// MT FDrilldown (MTk , F, Lvlinf)
InputMTk: Multidimensional table F: Reflexive fact analyzed in MTk, on which the drilling down operation is applied. Lvlinf : A level of F, to be reached by the FDrilldown
OutputNew multidimensional table MT, with the same structure as MTk
Begin1. Let Levels = {Lvln, Lvln-1,…,Lvlc} be the set of displayed levels of F with Lvlc is the
finest level, and Lvln is the highest level (c ≤ n)2. Let NB be the number of levels in the reflexive fact F in MTk3. Query-Level = ‘SELECT MAX (LEVEL) FROM’ || F || ‘CONNECT BY PRIOR’
|| child_expr = parent_expr (i.e., Id-Twt = Id-Twt-Response);4. NB = Result of Query-Level5. If Lvlc ≤ Lvlinf OR Lvlinf ≥ NB then6. // Impossible Drilling operation7. Else8. Translate FDrilldown (MTk; F, Lvlinf) into query Q such as
Q = ‘SELECT LEVEL’ || pn, pn-1,…, p1 || f1(m1), f2(m2), …. || ‘FROM’ || D1, D2, F || ‘ WHERE’ || Pred || ‘AND’ || D1.primary key = F.foreign key-D1 || ‘AND’ || D2.primary key = F.foreign key-D2 || ‘ AND LEVEL = ’ || Lvlinf || ‘CONNECT BY PRIOR’ || child_expr = parent_expr (i.e., Id-Twt = Id-Twt-Response) || ‘GROUP BY’ || LEVEL, pn, pn-1,…, p1;9. MT = Execute (Q).10. Display MT11. End ifEnd
1 https://www.enterprisedb.com/docs/en/9.5/eeguide/EDB_Postgres_
Enterprise_Guide.1.036.html.

MT9 FDrilldownðMT8; FACTIVITY � TWEET ; 6Þð7Þ
This result will allow the analyst to get interesting val-
ues from topics that have elicited more responses, per-
forming specialization if more details are needed and,
finally gleaning valuable insights about the way of propa-
gation of data within each level. It also allows identifying
where relevant tweets originate from.
5.2 FRollup operator
The FRollup operator is the reverse of FDrilldown, it
consists in moving from a finer level to a coarser level on a
currently displayed fact based on fact instances linked
through the reflexive relationship (Tweet Response–
Tweet). Each tweet may be connected to n (n C 0) tweets
responses within the same fact.
5.2.1 Conceptual definition
See Table 6
Fig. 12 MT8: Result
multidimensional table for
Example 4
Fig. 13 MT9: Result of the
expression 7
Table 6 Algebraic
formalization of the FRollup
operator
MT / FRollup (MTk, F, Lvlsup)
Input – MTk: A multidimensional table currently displayed
– F: is a reflexive fact, on which the FRollup operation is applied
– Lvlsup is a coarser-graduation level on the current fact
Output MT is the resulting multidimensional table
Example 4. We illustrate how the FDrilldown executes on an example of analysis. Suppose that we wish to count the number of tweets (Count (Id-Twt)) by Tweet-Sentiment (of the DTWEET-METADATA dimension) and by Country (of the PLACE dimension). As a result for this requirement, we obtain the multidimensional table MT8 shown in Fig. 12. Each cell in MT1 gives the number of tweets for each combination of Country and Tweet-Sentiment.
To the extent that this sample is representative, most conversations that occur in Twitter appear to be dyadic exchanges of three to six messages. For this reason, based on the results depicted in MT8 the decision-maker intends to restrict the analysis to tweets that tie in level 6. In fact, his aim is to move deeper into a chain of data, from high-level information to more detailed information. Hence, data pertaining to fact can then be pre-summarized and then be available for more analyses (number of intense conversa-tion…). This OLAP analysis is calculated using the alge-braic expression (7) that produces the multidimensional table in Fig. 13.

5.2.2 Logical definition
The algorithm FRollup develops the logic of the FRollup
operator.
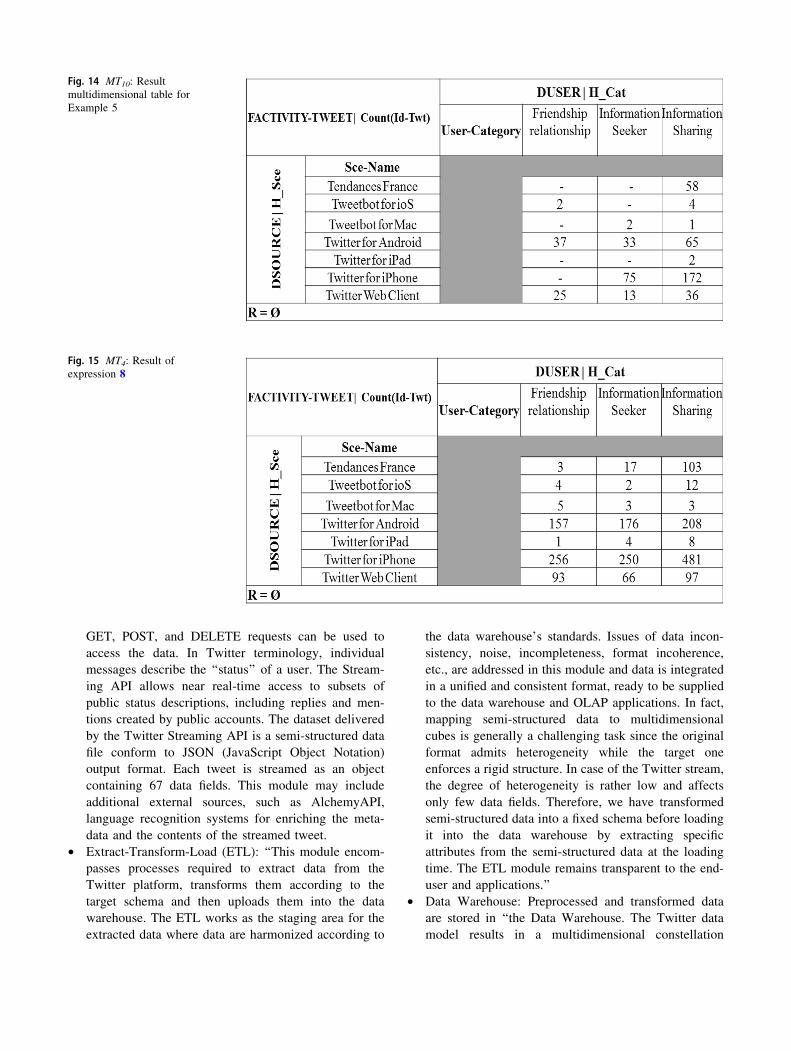
Example 5: Assume the decision-maker starts his
analysis by displaying the number of tweets at level 3 by
Sce-Name (source Name on the DSource dimension) and
by User-Category (on DUSER dimension). He obtains a
multidimensional table as in Fig. 14. Each cell represents
the number of tweets of level 3 for a given Source Name
and a given User Category.
Suppose the decision-maker carries out the same anal-
ysis described in the example 5, but he puts less emphasis
on the depth of involved level (Level 3) (cf. Fig. 14), the
decision-maker continues by rolling up analysis level. This
time he expects to get the number of tweets at level 2. The
corresponding analysis expression is (8):
MT11 FRollupðMT10; FACTIVITY � TWEET ; 2Þ ð8Þ
Figure 15 shows the obtained result within level 2.
According to this result, we may conclude that the
number of tweets for Information-Sharing category and
Twitter for iPhone as well as Twitter for Android is
important. In fact, Information-sharing users post news and
tend to have a large base of ‘‘followers’’ and answers about
that news.
6 Experimental results
In order to evaluate our proposals, we have developed a
software prototype called OLAP4Tweet [1], developed
using Java and ORACLE 10 g.
The architecture of OLAP4Tweet is composed of four
modules namely: Data source, ETL, Data warehouse, and
Analysis. Figure 16 depicts the architecture of the pro-
posed prototype.
• Data source: ‘‘The data source is represented by the
available Twitter APIs [19] for data streaming. In fact,
the Streaming API provides real-time access to tweets
in sampled and filtered form. This API is HTTP based
Algorithm FRollup: // MT FRollup ((MTk , F, Lvlsup)
InputMTk: A multidimensional table F: The fact actually analyzed in MTk, on which the rolling up operation will
apply. The relationship between the instances of the analyzed fact must be reflexive.
Lvlsup: A level of F to reach by the FRollup.Output
MT: Result multidimensional table having the same structure as MTkBegin1. Let Levels = {Lvln, Lvln-1,…,Lvlc} be the set of levels displayed for F; n and c
are respectively the lowest and highest levels (c ≥ n)2. Let NB be the number of levels in the fact F analyzed in MTk3. Query-Level = ‘SELECT’ MAX (LEVEL) FROM’ || F || ‘CONNECT
BYPRIOR ’ || child_expr = parent_expr (i.e., Id-Twt = Id-Twt-Response;4. NB = Result of Query-Level5. If Lvlc ≥ Lvlsup OR Lvlsup ≥ NB then6. // Impossible FRollup operation7. Else8. Translate FRollup (MTk; F, Lvlsup) into query Q such as
Q = ‘SELECT LEVEL,’ || pn, pn-1,…, p1 || f1(m1), f2(m2), …. || ‘ FROM ’ || D1, D2, F || ‘WHERE’ || Pred || ‘AND’ || D1.primary key = F.foreign key-D1 || ‘AND’ || D2.primary key = F.foreign key-D2 || ‘AND LEVEL =’ || Lvlsup || ‘ CONNECT BY PRIOR’ || child_expr = parent_expr (i.e., Id-Twt = Id-Twt-Response || ‘GROUP BY’ || LEVEL, pn, pn-1,…, p1; 9. MT = Execute (Q).10. Display MT11. End ifEnd
GET, POST, and DELETE requests can be used to
access the data. In Twitter terminology, individual
messages describe the ‘‘status’’ of a user. The Stream-
ing API allows near real-time access to subsets of
public status descriptions, including replies and men-
tions created by public accounts. The dataset delivered
by the Twitter Streaming API is a semi-structured data
file conform to JSON (JavaScript Object Notation)
output format. Each tweet is streamed as an object
containing 67 data fields. This module may include
additional external sources, such as AlchemyAPI,
language recognition systems for enriching the meta-
data and the contents of the streamed tweet.
• Extract-Transform-Load (ETL): ‘‘This module encom-
passes processes required to extract data from the
Twitter platform, transforms them according to the
target schema and then uploads them into the data
warehouse. The ETL works as the staging area for the
extracted data where data are harmonized according to
the data warehouse’s standards. Issues of data incon-
sistency, noise, incompleteness, format incoherence,
etc., are addressed in this module and data is integrated
in a unified and consistent format, ready to be supplied
to the data warehouse and OLAP applications. In fact,
mapping semi-structured data to multidimensional
cubes is generally a challenging task since the original
format admits heterogeneity while the target one
enforces a rigid structure. In case of the Twitter stream,
the degree of heterogeneity is rather low and affects
only few data fields. Therefore, we have transformed
semi-structured data into a fixed schema before loading
it into the data warehouse by extracting specific
attributes from the semi-structured data at the loading
time. The ETL module remains transparent to the end-
user and applications.’’
• Data Warehouse: Preprocessed and transformed data
are stored in ‘‘the Data Warehouse. The Twitter data
model results in a multidimensional constellation
Fig. 14 MT10: Result
multidimensional table for
Example 5
Fig. 15 MT4: Result of
expression 8

schema ‘‘Tweet Constellation’’ having two facts and
four dimensions.’’
• Analysis: ‘‘This module enables frontend users to
query, analyze the data and present the analyses in an
adequate form for better interpretation and decision
making. In fact, once the multidimensional model is
generated and loaded with data, the decision-maker can
generate reports and perform OLAP analyses on tweets
using our proposed OLAP operators. We have devel-
oped a user friendly graphical interface to facilitate the
interactions between a decision-maker and the analysis
framework. It allows expressing an analytical query and
visualize its result in tabular and graphical forms.’’
We have loaded a dataset containing 71,739 tweets
collected by crawling 2 h of public tweets (from Fri Dec 22
10:48:50 UTC 2017 to Fri Dec 22 12:48:50 UTC 2017).
These tweets are written in different languages. Once we
load the ‘‘Tweet Constellation’’ multidimensional model
with data, we can express and execute OLAP queries. For
this purpose, we include a user-friendly decisional process
in our analysis framework. A decision-maker starts his/her
analysis by exploring the proposed model through an
interface. (S)he selects measures and attributes related to
their analysis needs by clicking and then an SQL code is
generated. Queries involved in the experimental assess-
ments aggregate the measure through the COUNT aggre-
gation function. Finally, the interface provides the
decision-maker with a dashboard interface representing the
analysis result in tabular and graphical forms (cf. Fig. 17).
In order to illustrate how our OLAP operators perform,
we carry out a set of analyses on our previous example
through the graphical interface of the framework.
First analysis: Number of tweets by User-Activity and
Country.
The user starts an analysis by displaying the Number of
tweets per User-Activity and Country. (S)he chooses the
fact that contains a measure standing for the Number of
tweets as well as the attributes User-Activity and Country
via the interface. At the end of the analysis, the prototype
produces the interface shown in Fig. 18.
Based on this analysis, the decision-maker continues to
analyze the number of tweets at a finer granularity level
(Region) on one currently displayed dimension (PLACE
dimension in our case) to get more detailed information
and with keeping the granularity level User-Activity of the
USER tweet dimension. A list of radio buttons allow the
decision-maker to choose one or several OLAP operators.
(S)he firstly selects the corresponding operator, Drilldown
in our case. However, the analysis framework detects many
missing data. To deal with the missing data, it displays a
warning message and proposes to the decision-maker to
choose a null-option method (cf. Fig. 19).
Once the analyst click on ‘‘OK’’, a new interface is
displayed and containing three null-option methods (All,
Fig. 16 Architecture of the
OLAP4Tweet prototype

Region level. The result is directly displayed as table and
graphics (cf. Fig. 20).
Fig. 17 Graphical interface of OLAP4Tweet
Fig. 18 Number of tweets by user-activity and by country
AllNullLast and Flexible). Selecting the option All, the framework continues the analysis with the chosen attribute
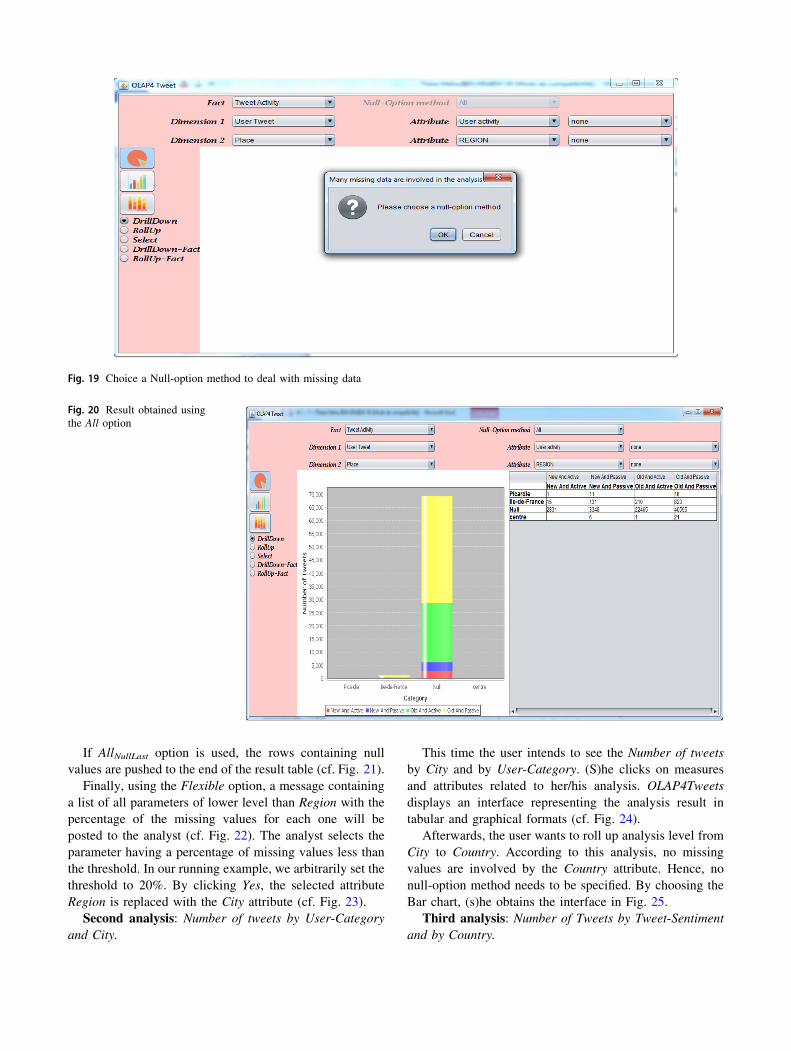
If AllNullLast option is used, the rows containing null
values are pushed to the end of the result table (cf. Fig. 21).
Finally, using the Flexible option, a message containing
a list of all parameters of lower level than Region with the
percentage of the missing values for each one will be
posted to the analyst (cf. Fig. 22). The analyst selects the
parameter having a percentage of missing values less than
the threshold. In our running example, we arbitrarily set the
threshold to 20%. By clicking Yes, the selected attribute
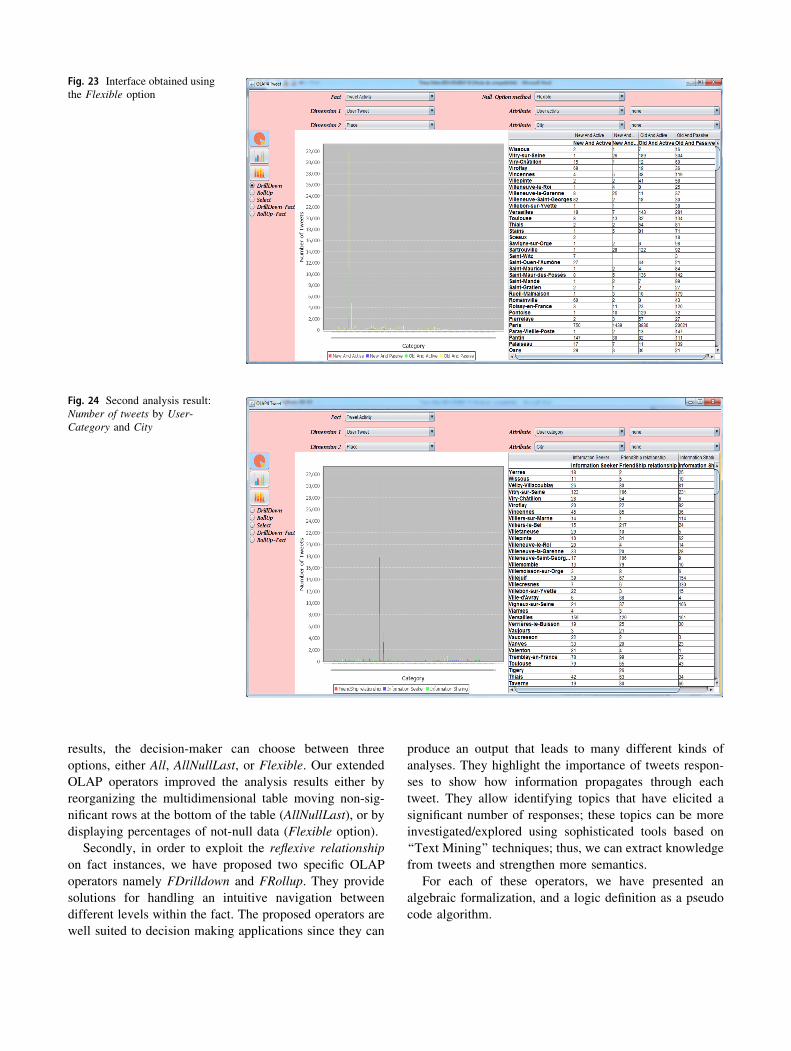
Region is replaced with the City attribute (cf. Fig. 23).
Second analysis: Number of tweets by User-Category
and City.
This time the user intends to see the Number of tweets
by City and by User-Category. (S)he clicks on measures
and attributes related to her/his analysis. OLAP4Tweets
displays an interface representing the analysis result in
tabular and graphical formats (cf. Fig. 24).
Afterwards, the user wants to roll up analysis level from
City to Country. According to this analysis, no missing
values are involved by the Country attribute. Hence, no
null-option method needs to be specified. By choosing the
Bar chart, (s)he obtains the interface in Fig. 25.
Third analysis: Number of Tweets by Tweet-Sentiment
and by Country.
Fig. 19 Choice a Null-option method to deal with missing data
Fig. 20 Result obtained using
the All option
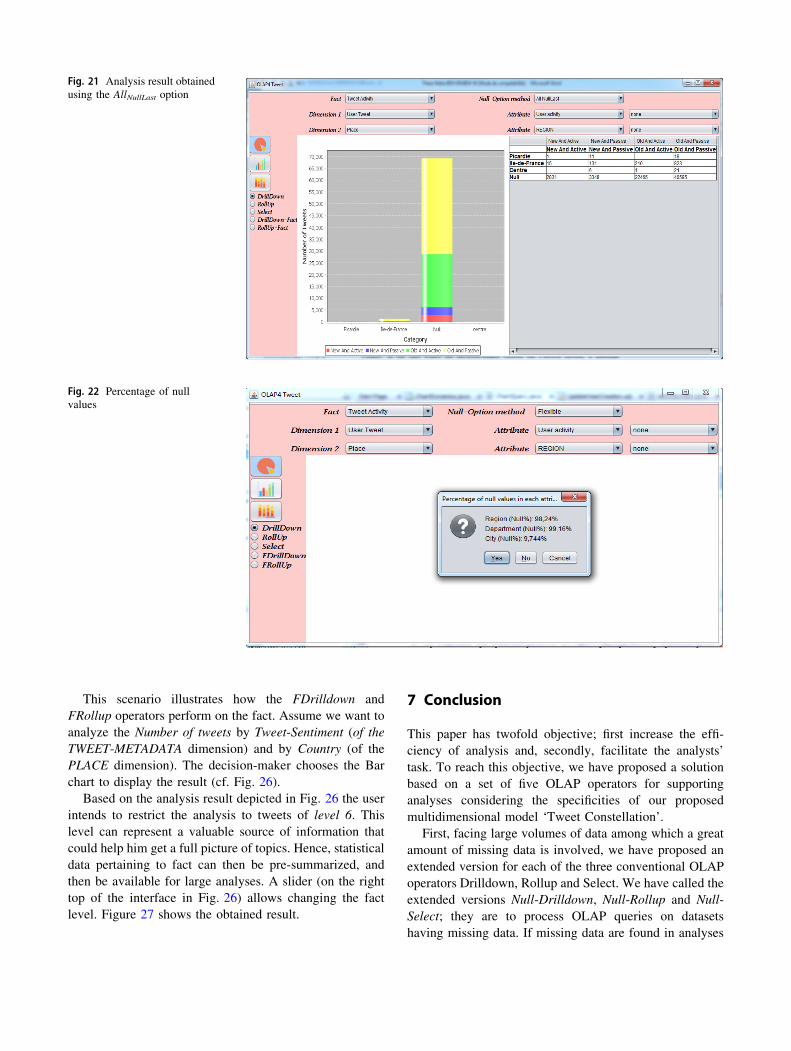
7 Conclusion
This paper has twofold objective; first increase the effi-
ciency of analysis and, secondly, facilitate the analysts’
task. To reach this objective, we have proposed a solution
based on a set of five OLAP operators for supporting
analyses considering the specificities of our proposed
multidimensional model ‘Tweet Constellation’.
First, facing large volumes of data among which a great
amount of missing data is involved, we have proposed an
extended version for each of the three conventional OLAP
operators Drilldown, Rollup and Select. We have called the
extended versions Null-Drilldown, Null-Rollup and Null-
Select; they are to process OLAP queries on datasets
having missing data. If missing data are found in analyses
Fig. 21 Analysis result obtained
using the AllNullLast option
Fig. 22 Percentage of null
values
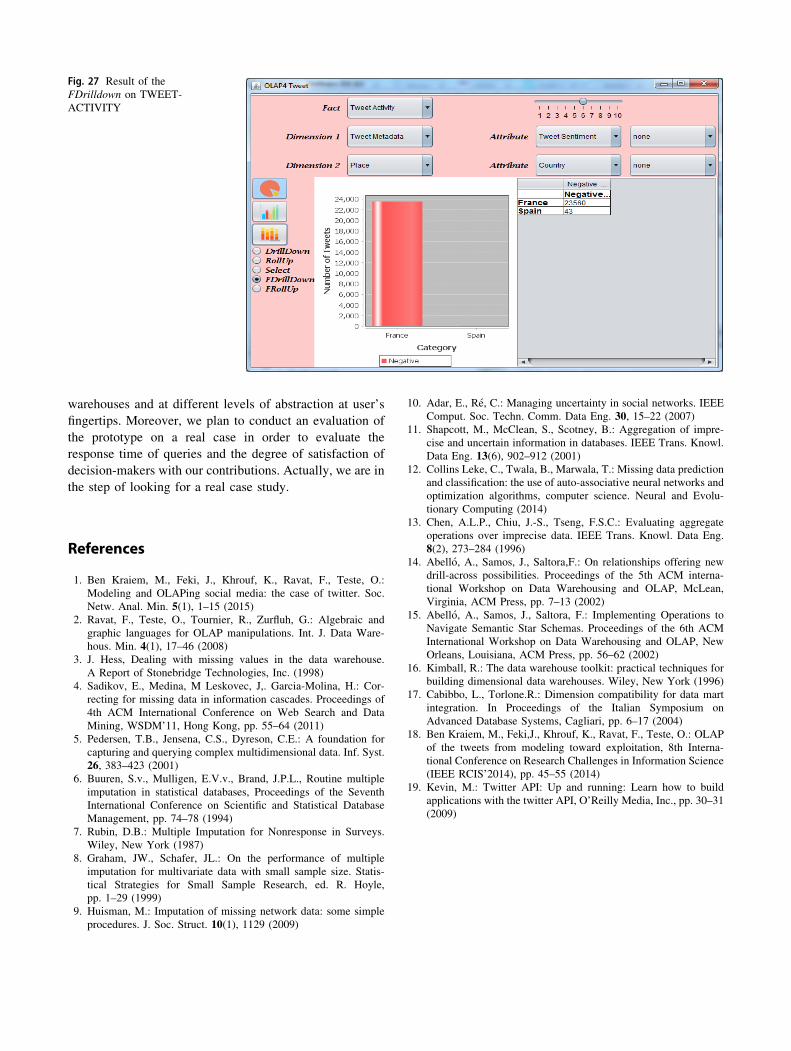
This scenario illustrates how the FDrilldown and FRollup operators perform on the fact. Assume we want to analyze the Number of tweets by Tweet-Sentiment (of the TWEET-METADATA dimension) and by Country (of the PLACE dimension). The decision-maker chooses the Bar chart to display the result (cf. Fig. 26).
Based on the analysis result depicted in Fig. 26 the user intends to restrict the analysis to tweets of level 6. This level can represent a valuable source of information that could help him get a full picture of topics. Hence, statistical data pertaining to fact can then be pre-summarized, and then be available for large analyses. A slider (on the right top of the interface in Fig. 26) allows changing the fact level. Figure 27 shows the obtained result.
results, the decision-maker can choose between three
options, either All, AllNullLast, or Flexible. Our extended
OLAP operators improved the analysis results either by
reorganizing the multidimensional table moving non-sig-
nificant rows at the bottom of the table (AllNullLast), or by
displaying percentages of not-null data (Flexible option).
Secondly, in order to exploit the reflexive relationship
on fact instances, we have proposed two specific OLAP
operators namely FDrilldown and FRollup. They provide
solutions for handling an intuitive navigation between
different levels within the fact. The proposed operators are
well suited to decision making applications since they can
produce an output that leads to many different kinds of
analyses. They highlight the importance of tweets respon-
ses to show how information propagates through each
tweet. They allow identifying topics that have elicited a
significant number of responses; these topics can be more
investigated/explored using sophisticated tools based on
‘‘Text Mining’’ techniques; thus, we can extract knowledge
from tweets and strengthen more semantics.
For each of these operators, we have presented an
algebraic formalization, and a logic definition as a pseudo
code algorithm.
Fig. 24 Second analysis result:
Number of tweets by User-
Category and City
Fig. 23 Interface obtained using
the Flexible option

decision making process, and is enough reliable to handle
analyses using the proposed operators.
As perspective work, we intend to integrate more anal-
ysis operators that take into consideration the specificities
of our multidimensional model, as dynamic Data. These
operators will help the interpretation of the results of
multidimensional analyses on tweets and their metadata. It
is also important to use OLAP mining, which integrates on-
line analytical processing (OLAP) with data mining so that
mining can be performed in different portions of data
Fig. 25 Interface obtained using
the Null-Rollup operator
Fig. 26 Third analysis result:
Number of tweets by Tweet-
Sentiment and by Country
To the best of our knowledge, this is the first contribu-tion that has proposed an extension of classical operatorsfor handling missing data during OLAP analysis and fordrilling down and up within a fact by exploiting thereflexive relationship.
To show the feasibility of our extended OLAP operators,we have carried out some sample analyses using our pro-totype OLAP4Tweet. The results show that the framework
is enough efficient to detect and propose Null-optionmethods when missing data are involved during the
warehouses and at different levels of abstraction at user’s
fingertips. Moreover, we plan to conduct an evaluation of
the prototype on a real case in order to evaluate the
response time of queries and the degree of satisfaction of
decision-makers with our contributions. Actually, we are in
the step of looking for a real case study.
References
1. Ben Kraiem, M., Feki, J., Khrouf, K., Ravat, F., Teste, O.:
Modeling and OLAPing social media: the case of twitter. Soc.
Netw. Anal. Min. 5(1), 1–15 (2015)
2. Ravat, F., Teste, O., Tournier, R., Zurfluh, G.: Algebraic and
graphic languages for OLAP manipulations. Int. J. Data Ware-
hous. Min. 4(1), 17–46 (2008)
3. J. Hess, Dealing with missing values in the data warehouse.
A Report of Stonebridge Technologies, Inc. (1998)
4. Sadikov, E., Medina, M Leskovec, J,. Garcia-Molina, H.: Cor-
recting for missing data in information cascades. Proceedings of
4th ACM International Conference on Web Search and Data
Mining, WSDM’11, Hong Kong, pp. 55–64 (2011)
5. Pedersen, T.B., Jensena, C.S., Dyreson, C.E.: A foundation for
capturing and querying complex multidimensional data. Inf. Syst.
26, 383–423 (2001)
6. Buuren, S.v., Mulligen, E.V.v., Brand, J.P.L., Routine multiple
imputation in statistical databases, Proceedings of the Seventh
International Conference on Scientific and Statistical Database
Management, pp. 74–78 (1994)
7. Rubin, D.B.: Multiple Imputation for Nonresponse in Surveys.
Wiley, New York (1987)
8. Graham, JW., Schafer, JL.: On the performance of multiple
imputation for multivariate data with small sample size. Statis-
tical Strategies for Small Sample Research, ed. R. Hoyle,
pp. 1–29 (1999)
9. Huisman, M.: Imputation of missing network data: some simple
procedures. J. Soc. Struct. 10(1), 1129 (2009)
10. Adar, E., Re, C.: Managing uncertainty in social networks. IEEE
Comput. Soc. Techn. Comm. Data Eng. 30, 15–22 (2007)
11. Shapcott, M., McClean, S., Scotney, B.: Aggregation of impre-
cise and uncertain information in databases. IEEE Trans. Knowl.
Data Eng. 13(6), 902–912 (2001)
12. Collins Leke, C., Twala, B., Marwala, T.: Missing data prediction
and classification: the use of auto-associative neural networks and
optimization algorithms, computer science. Neural and Evolu-
tionary Computing (2014)
13. Chen, A.L.P., Chiu, J.-S., Tseng, F.S.C.: Evaluating aggregate
operations over imprecise data. IEEE Trans. Knowl. Data Eng.
8(2), 273–284 (1996)
14. Abello, A., Samos, J., Saltora,F.: On relationships offering new
drill-across possibilities. Proceedings of the 5th ACM interna-
tional Workshop on Data Warehousing and OLAP, McLean,
Virginia, ACM Press, pp. 7–13 (2002)
15. Abello, A., Samos, J., Saltora, F.: Implementing Operations to
Navigate Semantic Star Schemas. Proceedings of the 6th ACM
International Workshop on Data Warehousing and OLAP, New
Orleans, Louisiana, ACM Press, pp. 56–62 (2002)
16. Kimball, R.: The data warehouse toolkit: practical techniques for
building dimensional data warehouses. Wiley, New York (1996)
17. Cabibbo, L., Torlone.R.: Dimension compatibility for data mart
integration. In Proceedings of the Italian Symposium on
Advanced Database Systems, Cagliari, pp. 6–17 (2004)
18. Ben Kraiem, M., Feki,J., Khrouf, K., Ravat, F., Teste, O.: OLAP
of the tweets from modeling toward exploitation, 8th Interna-
tional Conference on Research Challenges in Information Science
(IEEE RCIS’2014), pp. 45–55 (2014)
19. Kevin, M.: Twitter API: Up and running: Learn how to build
applications with the twitter API, O’Reilly Media, Inc., pp. 30–31
(2009)
Fig. 27 Result of the
FDrilldown on TWEET-
ACTIVITY

Maha Ben Kraiem I received my
Bachelor’s degree in computer
science applied to management.
(2009) from the Faculty of
Economics and Management,
University of Sfax (Tunisia), a
Master degree (2012) and a
Ph.D. from the university of
Sfax. I am a research member at
the IRIT research center at the
University of Toulouse, France
and a member at the Mir@cl
research Laboratory, University
of Sfax (Tunisia). My research
interests span many aspects of
data management and the business intelligence. My publications
appear in major national and international journals and conference
proceeding.
Dr. Mohammed Alqarni obtaineda bachelor’s degree in computer
science from King Khalid
University, Saudi Arabia in
2008, and received an MSc in
Computational Sciences from
Laurentian University, Sudbury,
Canada in 2012. He was then
awarded a Ph.D. in Computer
Science from McMaster
University, Hamilton, Canada in
2016. He is currently an assis-
tant professor at, and the dean
of, the College of Computer
Science and Engineering at the
book chapters. His research interests include Decision Support Sys-
tems and Business intelligence: analytical requirements specification,
Data Warehouse design methods, DW Integration, Knowledge
Warehouses and Big Data. He is steering committee member in
conferences and workshops; he is PC member in international con-
ferences and reviewer in journals.
Franck Ravat is currently a full
professor of computer science at
the University of Toulouse,
France. He also is a research
staff member at the IRIT
research centre (CNRS UMR
5505). His research interests
span many aspects of data
management and the business
intelligence. In the field of data
management, he focusses on
data integration of various data
types (structured, semi-struc-
tured and unstructured data) and
modelling data to be imple-
mented and analyzed in different frameworks (distributed data files,
relational DBMS, NOSQL or NewSQL systems…) In the field of
Business Intelligence, he focusses on data warehousing based on
OLAP (On-Line Analytical Processing) analyses and data lakes. His
publications appear in major national and international journals and
conference proceedings, for which he also serves as reviewer.
University of Jeddah, Saudi Arabia. He enjoys research in a wide variety of topics.
Jamel Feki received his BS inCS (1980) from the Universityof Sfax (Tunisia), a Master
degree (1981) and a Ph.D.
(1984) in CS from the Univer-sity Paul SABATIER (France).He joined the University of Sfax(Tunisia) in 1986 where he is afull professor and member ofthe Mir@cl research laboratory.Now, he is a full professor at theUniversity of Jeddah (Saudi
Arabia) since 2015. He has
supervised several Ph.D. thesesand has published research
papers in refereed journals and conferences; he is a co-author of three
Top Related