


Languages
Pages
Legal

Oil Spillsin Washington State:A Historical Analysis
April 1997 (rev. March 2007) Publication No. 97-252

Department of Ecology Spill Management Program
Oil Spills in Washington State: A Historical AnalysisApril 1997, Publication #97-252
Tom Fitzsimmons, Director, Department of Ecology
Greg Sorlie, Program Manger, Central Programs
Dave Lundstrom and Steve Hunter, Section Supervisors, Spill Management Program
Prepared by: Jon Neel, Curt Hart, Donna Lynch, Steve Chan and Jeanette Harris Central Programs — Spill Prevention and Policy Section
Cover Photo: The tank vessel Mobil Oil grounded on Warrior Rock in the Columbia River on March 20, 1984. Rudder failure from improper maintenance was the cause of the accident. After losing 200,000 gallons of heavy oil, this photo shows how other vessels were used in an attempt to lighten and refloat the tanker. Photo by Jon Neel
For additional copies of this document, contact:
Department of Ecology Distribution CenterPO Box 47600
Olympia, WA 98504-7600Telephone: (360) 407-7472 (Voice) or (360) 407-6006 (TDD)
The Department of Ecology is an equal opportunity agency and does not discriminate on the basis of age, color, creed, disability, disabled veteran’s status, marital status, national origin, race, religion, sex, sexual orientation, or Vietnam Era veteran’s status. If you have special accommodation needs or require this document in an alternate format, please contact Ecology’s Jon Neel at (360) 407-6905 (Voice) or (360) 407-6006 (TDD).
Oil Spills in Washington State: A Historical Analysis Page 1

Page 2 Oil Spills in Washington State: A Historical Analysis
Table of Contents
Introduction ............................................................................................................. 5
Chapter 1: Washington State Energy Policy and Oil Spill Initiatives ............. 7State Oil Spill Policy: A Historical Overview............................................................................ 8Current Regulatory Framework................................................................................................. 10Current Oil Transportation Patterns and Related Spill Risks.................................................... 11
Chapter 2: Oil Spill Data Sources ...................................................................... 15
Chapter 3: Major Oil Spills in Washington ...................................................... 17Distribution of Major Spills ...................................................................................................... 17Source of Major Spills............................................................................................................... 19Types of Oil Spilled ................................................................................................................. 21Geographical Distribution ......................................................................................................... 22
Chapter 4: Recent Trends in Oil Spills .............................................................. 25Distribution of Recent Spills ..................................................................................................... 25Source of Recent Spills ............................................................................................................. 26Types of Oil Spilled .................................................................................................................. 27Geographical Distribution ......................................................................................................... 28Comparison with Coast Guard Data.......................................................................................... 31Cause of Recent Spills............................................................................................................... 31
Chapter 5: Near Miss Incidents.......................................................................... 35
Chapter 6: Lessons Learned From Recent Pipeline Spills .............................. 37
Conclusions ............................................................................................................ 39Data Collection and Analysis .................................................................................................... 39Important Trends in Spills......................................................................................................... 39Effectiveness of Existing Spill Prevention Measures ............................................................... 40State Spill Policy ....................................................................................................................... 40
Appendices ............................................................................................................. 43Appendix 1 — Significant Vessel Casualties and Near Misses................................................ 44Appendix 2 — Major Oil Spills and Related Legislative Action.............................................. 46Appendix 3 — Selected Spills in Washington State................................................................. 48Appendix 4 — Legend for Map: Spills Over 10,000 Gallons.................................................. 50Appendix 5 — Ecology’s Regional Offices.............................................................................. 51
Oil Spills in Washington State: A Historical Analysis Page 3

Page 4 Oil Spills in Washington State: A Historical Analysis
Introduction
Twenty-two years have elapsed since the Department of Ecology first proposed establishing a comprehensive oil spill prevention and response program in Washington State. The 1975
legislative proposal was prompted after the state suffered major oil spills. Another concern at that time was that the brand new Alyeska pipeline would dramatically increase oil tanker traffic in the Puget Sound. Although the Alaskan pipeline spurred major refining activity in Washington, the proposed environmental protection program never materialized due to lack of funding. Even though no one wanted spills to occur, the full public cost of oil spills was not placed completely on the shoulders of those responsible for transporting oil. The oil spills kept occurring.
It took a series of major oil spills in Washington and Alaska in the late 1980s and early 1990s before Washington’s innovative spill prevention and response program was finally put into place by the Legislature. These major spills include:
� The 1985 ARCO Anchorage tanker spill in which 239,000 gallons of crude oil was released into marine waters at Port Angeles;
� The 1988 Nestucca barge spill which released 231,000 gallons of fuel oil into waters along the coast of Grays Harbor ;
� The disastrous 1989 Exxon Valdez spill in Alaska which unleashed 11 million gallons of crude oil into Prince William Sound;
� The 1991 Texaco refinery spill at Anacortes which released 130,000 gallons of crude oil, of which 40,000 gallons went into Fidalgo Bay; and
� The 1991 spill at the U.S. Oil refinery in Tacoma which involved 600,000 gallons of crude oil, most of which was stopped from entering state waters.
How these and other major oil spills accelerated state and federal oil spill prevention, preparedness and response legislation is outlined in Appendix 2. This outline shows how the major preventable spills between 1985 and 1992 resulted in innovative legislation which holds potential spillers accountable for preventing and cleaning up spills.
Washington’s oil spill prevention and response program has been in place for six years. This report is an examination of the history of oil transportation and the resulting trends in oil spills. This analysis is the first step toward measuring the level of success that industry, government and the public are having on preventing oil spills. This report is also intended to help Washington determine how to best provide the “best achievable protection” from the effects of oil spills while assuring that federal and state programs complement each other.
Oil Spills in Washington State: A Historical Analysis Page 5
This report provides partial answers to the following fundamental questions:
� What fundamental forces have shaped state policy regarding oil transportation and spills?
� Has Washington’s additional attention to oil spill prevention and response paid off?
� Given Washington’s recent increased refinery production, increased pipeline traffic and expanded Pacific Rim trade: How does our state’s record of recent spills compare with national and international trends?
� Should the state make any adjustments in its program as a result of these trends?
Page 6 Oil Spills in Washington State: A Historical Analysis
Chapter 1: Washington State Energy Policy and Oil Spill Initiatives
Washington’s unique physical geography coupled with its abundance and diversity of natural resources has been the driving force behind how the state has provided for its energy needs
and how much importance the state has placed on preventing and responding to environmental threats, especially oil spills.
Located at the northwest corner of the continental United States, Washington’s rugged mountain terrain and distance from traditional energy sources prompted the state to develop its own energy reservoirs. Since the 1930s, Washington has exploited its hydroelectric resources and these dams have, in many ways, become the region’s energy backbone.
The Puget Sound is also the closest national port in the lower 48 states for vessels carrying crude oil out of Valdez, Alaska. For more than 25 years, tankers laden with Alaskan crude oil have brought their precious cargo into Washington. Even though the state produces none of its own oil, Washington has the fifth highest refining capacity of any state in the nation. The waters of Washington State are also one of North America’s primary water-borne transportation avenues for Pacific Rim commerce. A visitor to one of Washington’s busy ports will see many ships flying flags from Russia, China, Japan, Korea, Malaysia and a variety of other nations.
At the same time, Washington’s waters and shorelines contain highly sensitive and valuable natural resources. State marine waters contain critical commercial resources including fishing, crabbing, shrimping and shellfish industries. Washington is also blessed with abundant and diverse fish and wildlife resources which are a driving force in state tourism and provide recreational opportunities for residents. The seabird colonies along Washington’s outer coast are among the largest in the United States. In addition, 29 species of marine mammals — including whales, dolphins, seals, seal lions and sea otters — breed in or migrate through the state. The Olympic Coast is the least disturbed major section of coastline in the continental lower 48 states and, according to the Office of Marine Safety and U.S. Coast Guard, it is also the area in Washington that is at greatest risk of experiencing a major vessel oil spill.
Given the importance of preventing spills, this report explores the important connection between historical oil spill information and spill trends, and identifies general areas where non-regulatory approaches for spill prevention might be viable. Effective spill prevention can best be attained through the right mix of regulatory and voluntary compliance initiatives. As state regulatory programs have matured, Ecology has been shifting its focus to educational initiatives. The information on spill trends in this report is part of this effort.
Oil Spills in Washington State: A Historical Analysis Page 7
Measuring the effectiveness of state spill prevention endeavors is very complex. Most experts agree that while human factors of one type or another underlie most incidents, spills occur from a wide variety of specific sources and causes. Specific technological or procedural changes must be developed and implemented to eliminate or minimize the occurrence of these incidents. If we are to continue making good progress in preventing spills, it is imperative that we gather better information on actual spills to understand these incidents. This report is also an effort to obtain and disseminate this information.
State Oil Spill Policy: A Historical Overview Prior to the mid-1940s, most Washington communities discharged raw sewage into state water bodies, most industrial wastes went untreated and small oil spills were accepted as part of doing business. As a result of continued population growth, state harbors, rivers, lakes and streams quickly became polluted. In March 1945, the Legislature established the Pollution Control Commission. In order to give the commission real authority, lawmakers also passed legislation prohibiting the pollution of any waters of the state and established specific penalties for violations.
In 1955, the Legislature passed a new law which required that any "commercial or industrial operation of any type which results in the disposal of solid or liquid waste material into the waters of the state shall procure a permit" from the Pollution Control Commission. This state act preceded the federal Water Pollution Control Act by 10 years. In several instances, Washington State environmental laws have been models for federal pollution laws.
Growth of Washington Oil Industry Prior to 1950, there were no refineries and very little crude oil was transported into Puget Sound. In 1953, the Trans-Mountain Pipeline Company and Mobil Oil announced their plan to construct an oil pipeline from British Columbia into Washington. A year later, the state received its first delivery of Canadian crude oil. Most of Washington’s refineries were constructed in the 1950s, including:
� 1954 — Mobil Oil refinery, Ferndale (now owned by Tosco);
� 1955 — Shell Oil refinery, Anacortes;
� 1957 — US Oil refinery, Tacoma; and
� 1958 — Texaco refinery, Anacortes.
In 1958, a high tariff imposed by Canada on the Trans-Mountain Pipeline resulted in a 12-18 month embargo on oil imports from British Columbia. This and other events led to concerns about the long-term stability of the Canadian supplies. In order to improve the oil transportation system, the Olympic Pipe Line Company built its pipeline in 1966 and began delivering petroleum products from the refineries in the north part of the state to consumers in Seattle, Tacoma and Olympia in Washington, and to Portland and Eugene in Oregon.
Page 8 Oil Spills in Washington State: A Historical Analysis
Developments Related to Alaskan Oil In 1968 and 1969, the Alaska North Slope oil fields were discovered at Prudhoe Bay. In anticipation of the movement of Alaskan oil into Washington and other pressing environmental concerns, the Legislature passed a series of environmental and spill-related laws.
In 1970, the Washington State Legislature established the Department of Ecology, followed quickly by the passage of the 1971 Washington Oil Pollution Act which:
� Established unlimited liability for oil spills; � Provided for state cleanup capability; and � Specifically clarified that the discharge of any oil into state waters was illegal.
That same year, Governor Dan Evans requested an oil risk analysis report concerning the transportation of oil into Puget Sound. Also in 1971, ARCO built its Cherry Point refinery near Ferndale. This move put state production of petroleum products well ahead of in-state consumption. It also greatly increased tanker traffic into Puget Sound.
Construction of the Trans Alaska Pipeline System (TAPS) began in 1973 after the U.S. Congress passed the Trans Alaska Pipeline Act. However, in October 1973 the Organizations of Petroleum Exporting Countries (OPEC) placed an embargo on oil exports to the United States. The resulting shortage placed additional national attention and reliance on Alaskan North Slope oil.
In Washington, one of the results of the embargo was that in 1975 the Northern Tier Pipeline Company proposed constructing a major oil pipeline originating in Cherry Point near Ferndale and terminating in Minnesota. In January 1976, Northern Tier changed its proposed point of origin from Cherry Point to Port Angeles.
Also in 1975, the Legislature passed the Washington Tanker Safety Act which prohibited tankers exceeding 125,000 dead weight tons from entering Puget Sound, and required tug escorts and pilots for certain other tankers. In 1978, the U.S. Supreme Court invalidated this “supertanker” ban in the case of ARCO vs. Governor Ray. The court found that federal law pre-empted Washington from banning large tankers, but affirmed the right of the state to establish tug escort and other requirements. U.S. Senator Warren Magnison later re-established supertanker limits through federal legislation.
In the 1970s, the Department of Ecology completed a number of shoreline sensitivity studies focused on the San Juan Islands in anticipation of the influx of Alaskan oil. The studies were undertaken in order to establish a “baseline” so that any environmental changes precipitated by a major oil spill could be more readily quantified. In both 1972 and 1975, Ecology proposed creating a state spill prevention and response program but could not secure funding from the Legislature for the effort. It took a series of major spills in the late 1980s and early 1990s to provide the impetus to establish and fund a state comprehensive spill prevention, preparedness and response program (see Appendix 2).
Oil Spills in Washington State: A Historical Analysis Page 9
In June 1976, a federal Coastal Zone Management law placed a partial prohibition on the expansion of existing oil terminals. However, this provision may be superseded by other federal laws. That same year, Washington also established the Energy Facility Site Evaluation Council (EFSEC) whose mission was to oversee the siting and permitting of energy facilities such as pipelines, refineries and nuclear power plants. The council held extensive hearings on the Northern Tier Pipeline proposal. The pipeline project was not approved.
Recent Developments During the late 1970s, EFSEC certified the siting and construction of five Washington Public Power Supply System (WPPSS) nuclear power plants. Three developments — the subsequent demise of four of these five plants, the WPPSS bond default and the shut down of the federal “N” reactor at the Hanford Nuclear Reservation — assured the state’s continued reliance on hydropower and fossil fuel resources, including oil and coal for use in the Centralia power plant.
In 1990, the Trans Mountain Pipeline Company proposed constructing an oil terminal at Low Point east of Port Angeles on the Olympic Peninsula. The proposal included two single-point mooring buoys, a tank farm at Low Point, and a pipeline which would be located under Puget Sound and connect the Low Point facility with refineries located at Anacortes and Ferndale. The project would have eliminated most tanker traffic coming into Puget Sound beyond Port Angeles, but was eventually withdrawn as a result of public environmental concerns and lack of support from the oil industry.
Even with the state’s relative isolation from continental U.S. energy supplies, its oil markets are not immune to the market effects of Mideast oil supply volatility as seen during the 1973 OPEC embargo. On Dec. 11, 1996, the United Nations again allowed the sale of Iraqi oil on the international market as a result of humanitarian pressures. This action is expected to lower the consumer price of refined petroleum products throughout the United States.
Current Regulatory Framework Ecology has been involved in preventing and responding to spills since the agency was formed in 1971. The agency’s spill response capability prior to 1989 consisted of a team of employee volunteers in each of the four regional offices whose main area of expertise lay in other program areas. There was little centralized management of spill activities. As a result of the drawbacks associated with this decentralized response system and the identification of additional funding, Ecology centralized the spill organization in 1990.
These changes and the legislation which passed from 1989 to 1992, resulted in the state spill program which continues to evolve to this day with centralized management systems and regional service delivery. Ecology is now responsible for:
� Preventing spills at oil handling facilities; � Managing the state’s preparedness efforts; � Responding to oil and hazardous material spills statewide; and � Coordinating state natural resource damage assessment activities.
Page 10 Oil Spills in Washington State: A Historical Analysis
The U.S. Congress passed the Oil Pollution Act in 1990 (OPA 90). This statute created new national standards for oil spill prevention and response in the wake of the Exxon Valdez spill. Congress delegated responsibility for implementing most of OPA 90’s provisions to the Coast Guard, Environmental Protection Agency, Department of Transportation’s Office of Pipeline Safety, National Oceanic and Atmospheric Administration and the Minerals Management Service.
The Washington State Office of Marine Safety (OMS) was created in 1991 by the Legislature to provide further assurance that frequency of oil spills would be reduced. OMS is responsible for preventing vessel oil spills through vessel inspections, investigation of marine casualties, enforcement of state maritime standards and by approving vessel spill contingency plans.
State and Federal Relationships Washington’s role in the current state-federal framework for regulating the oil industry is complicated because each major federal regulatory agency views the role of the state differently. Some independent legal analysts believe that the U.S. Coast Guard attempts to promote uniformity by establishing “ceilings” for regulatory requirements, while the U.S. Environmental Protection Agency uses federal environmental laws to set “floors” which allow states to set more stringent requirements if they are necessary for regional considerations. Major oil pipelines are regulated by the U.S. Department of Transportation’s Office of Pipeline Safety. This agency generally sets ceilings. However, unlike the EPA and Coast Guard, the Office of Pipeline Safety delegates some of their spill prevention authority to states that have established effective regulatory programs.
Some of these federal agency policy differences concerning state program consistency can be traced to concerns for interstate uniformity regarding transportation systems such as vessels, trucks and airlines. However, these interstate concerns may not be valid when states establish regional standards for fixed facilities and do not impede interstate commerce. Questions remain regarding EPA and the Coast Guard delegation of programs to states and why fixed interstate pipelines should not be subject to state spill prevention standards if interstate commerce is not impeded. These issues are particularly relevant when the current congressional view of states rights’ seems to be reducing federal regulatory programs in favor of state control. However, at this time federal law does not provide a mechanism for state delegation.
These differences in regulatory approach do not apply to spill preparedness and response. EPA and the Coast Guard have established strong and effective cooperative mechanisms with respect to state co-management of spill responses while minimizing duplication.
Current Oil Transportation Patterns and Related Spill Risks As one of North America’s major gateways to Pacific Rim trade, Puget Sound is one of the busiest waterways in the world with vessel traffic going to several busy ports in Washington State and to major facilities in Vancouver, British Columbia. More vessel tonnage moves through the Strait of Juan de Fuca than through the combined ports of Los Angeles and Long Beach, California.
Oil Spills in Washington State: A Historical Analysis Page 11
Woodinville
Ellensburg
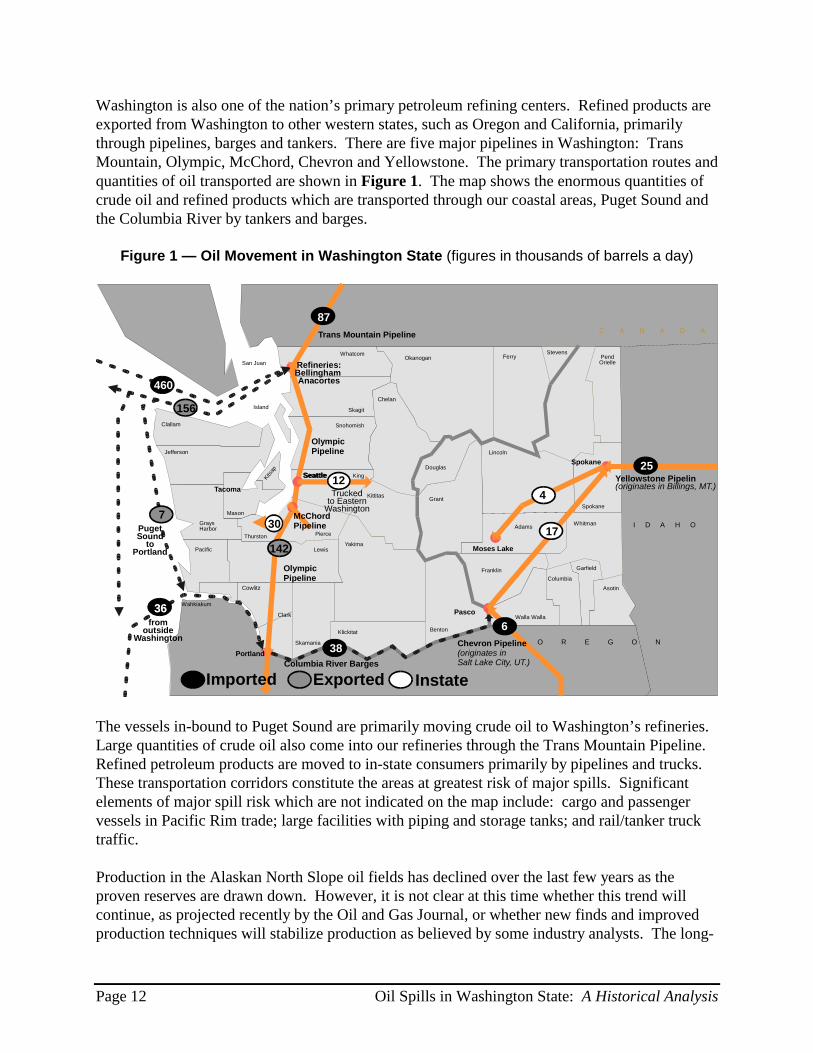
Washington is also one of the nation’s primary petroleum refining centers. Refined products are exported from Washington to other western states, such as Oregon and California, primarily through pipelines, barges and tankers. There are five major pipelines in Washington: Trans Mountain, Olympic, McChord, Chevron and Yellowstone. The primary transportation routes and quantities of oil transported are shown in Figure 1. The map shows the enormous quantities of crude oil and refined products which are transported through our coastal areas, Puget Sound and the Columbia River by tankers and barges.
Figure 1 — Oil Movement in Washington State (figures in thousands of barrels a day)
Clallam
Adams
Yakima
Cowlitz
Clark
Okanogan
Chelan Island
Pierce
King
Spokane
Snohomish
Whatcom
Thurston
GraysHarbor
Jefferson
Pacific
Mason
Skagit
San Juan
Wahkiakum
Skamania
Lewis
Douglas
Kittitas
Klickitat Benton
Ferry Stevens
Lincoln
Grant
Whitman
Franklin
Walla Walla
Columbia
Garfield
Asotin
Pend Orielle
Kitsap
Spokane
SeattleSeattle
Pasco
Moses Lake
Refineries: BellinghamAnacortes
PugetSound
to Portland
from outside
Washington
Columbia River Barges
Yellowstone Pipelin(originates in Billings, MT.)
Trucked to Eastern
Washington
I D A H O
O R E G O N
C A N A D A
460
156
142
30
87
25
7
3636
38
6
17
Exported Instate
Trans Mountain Pipeline
Chevron Pipeline(originates inSalt Lake City, UT.)
OlympicPipeline
Imported
OlympicPipeline
Portland
Tacoma 12
McChord Pipeline
4
The vessels in-bound to Puget Sound are primarily moving crude oil to Washington’s refineries. Large quantities of crude oil also come into our refineries through the Trans Mountain Pipeline. Refined petroleum products are moved to in-state consumers primarily by pipelines and trucks. These transportation corridors constitute the areas at greatest risk of major spills. Significant elements of major spill risk which are not indicated on the map include: cargo and passenger vessels in Pacific Rim trade; large facilities with piping and storage tanks; and rail/tanker truck traffic.
Production in the Alaskan North Slope oil fields has declined over the last few years as the proven reserves are drawn down. However, it is not clear at this time whether this trend will continue, as projected recently by the Oil and Gas Journal, or whether new finds and improved production techniques will stabilize production as believed by some industry analysts. The long-
Page 12 Oil Spills in Washington State: A Historical Analysis
term effect of changes in Alaskan oil production on Washington refineries remains to be seen. One of the current effects of the reduced North Slope oil supply is that oil importation from Canada through the Trans Mountain Pipeline has dramatically increased in recent years. The Office of Marine Safety data indicates that the number of individual tankers moving oil into Washington waters was:
� 907 in 1993;
� 908 in 1994;
� 723 in 1995; and
� 804 in 1996.
This data includes tank ships bound through Washington waters to Puget Sound ports, the Columbia River, Canadian ports and Grays Harbor.
Oil Spills in Washington State: A Historical Analysis Page 13

Page 14 Oil Spills in Washington State: A Historical Analysis
Chapter 2: Oil Spill Data Sources
he spill related information in this report is divided into two sections for the purpose of Tpresenting a clear analysis. Chapter 3: Major Oil Spills in Washington deals with well documented facility, pipeline, vessel and surface transportation spills greater than 10,000 gallons that have occurred since 1970. Chapter 4: Recent Trends in Oil Spills takes a closer look at all oil spills between 25 and 10,000 gallons that have occurred in the last four years — with the exception of surface transportation (railroad and truck) spills.
Ecology began consistently keeping records of oil spills only after the Legislature provided dedicated funding for the program in 1991. Prior to this time, readily accessible records are incomplete. Fortunately, the agency has institutional memory and information relating to larger spills, particularly those exceeding 10,000 gallons. In preparing this report, a range of sources were reviewed to fill in data gaps. With respect to recent spills (discussed in Chapter 4), the information should be accurate given the careful data collection efforts of Ecology’s spill and damage assessment team for spills of over 25 gallons reaching surface waters. Spill information is stored in the agency’s Environmental Report Tracking System (ERTS) database and a small “stand alone” database for major spills.
Information on specific spills in this report could contain inaccuracies. For example, there is often a tendency by those responsible for a spill to under report the amount of product spilled. No potential systematic errors in the data have been identified other than the possible under reporting of spill volume. Accurate information on the root cause of past spills was also difficult to obtain. Therefore, a smaller data set was used to evaluate spill causes.
Data for land transportation (truck and rail) spills has not been included in the analyses of recent spills because of a lack of complete information about this industry segment. However, land transportation spills do represent a serious threat. Staff from Ecology’s regional office located in Yakima have reported that tanker truck accidents have resulted in multi-thousand gallon spills with some regularity over the years. These tanker truck spills pose a significant threat to public health and safety in addition to environmental damage. These inland fuel spills can contaminate drinking water, create dangerous fumes, pose a fire threat and result in fresh water fish kills.
Unless otherwise noted, the figures in this report do not include information on leaking underground storage tanks (LUST) or from spills of animal or vegetable oil.
Ecology intends to use the information contained in this report as environmental quality indicators to help measure the state’s success in preventing spills. The information will also help the agency target its facility spill prevention efforts. The agency will continue tracking and reporting spill information and appreciates receiving additional information regarding spill history and trends from all sources.
Oil Spills in Washington State: A Historical Analysis Page 15
Page 16 Oil Spills in Washington State: A Historical Analysis
Chapter 3: Major Oil Spills in Washington
This section evaluates information on major spills of 10,000 gallons or more which have occurred in Washington since 1970.
Distribution of Major Spills The historical trends in the annual volume of oil spilled each year from major incidents are a key indicator of the state’s success in preventing major spills. According to the Oil Spill Intelligence Report, the annual average volume of oil spilled worldwide from oil spills greater than 10,000 gallons during the five year period 1987-91 was 53 million gallons (excluding the 1991 Persian Gulf war related causalities). However, the annual average volume of oil spilled at major oil spills during the four year period 1992-95 was 75 million gallons worldwide — a 41 percent increase.
The “1995 International Oil Spill Statistics” compiled by the Oil Spill Intelligence Report concluded that despite the considerable efforts to reduce spills, a downward trend in the number of large spill incidents worldwide “is probably not occurring.”
The data in Figure 2 displays the annual amount of oil spilled in Washington State from spills larger than 10,000 gallons. As seen in this figure, the amount of oil spilled per year as a result of major incidents appears to be declining in Washington during the last five years. Although there is not enough data to evaluate the trends statistically, it does appear that the volume and incidence of major spills in Washington State may be declining more abruptly than that indicated by national and international trends.
The year Washington passed its major oil legislation (1991), we experienced 3 major spills over 10,000 gallons. During this apparently anomalous year, incidents resulted in the loss of 100,000 gallons from the Tenyo Maru; 600,000 gallons from US Oil and Refining; and 210,000 gallons from Texaco refining.
The annual average volume of oil spilled in Washington State from petroleum oil spills greater than 10,000 gallons during 1987-91 was 327,000 gallons. The volume of oil spilled during the five-year period from January 1992 through June 1996 was 72,000 gallons — a 78 percent reduction. Both Ecology and the state Office of Marine Safety’s spill prevention and response efforts were fully funded and staffed by June 1992. However, one should be cautious when interpreting the significance of these trends in relation to the effectiveness of the state’s program given:
Oil Spills in Washington State: A Historical Analysis Page 17
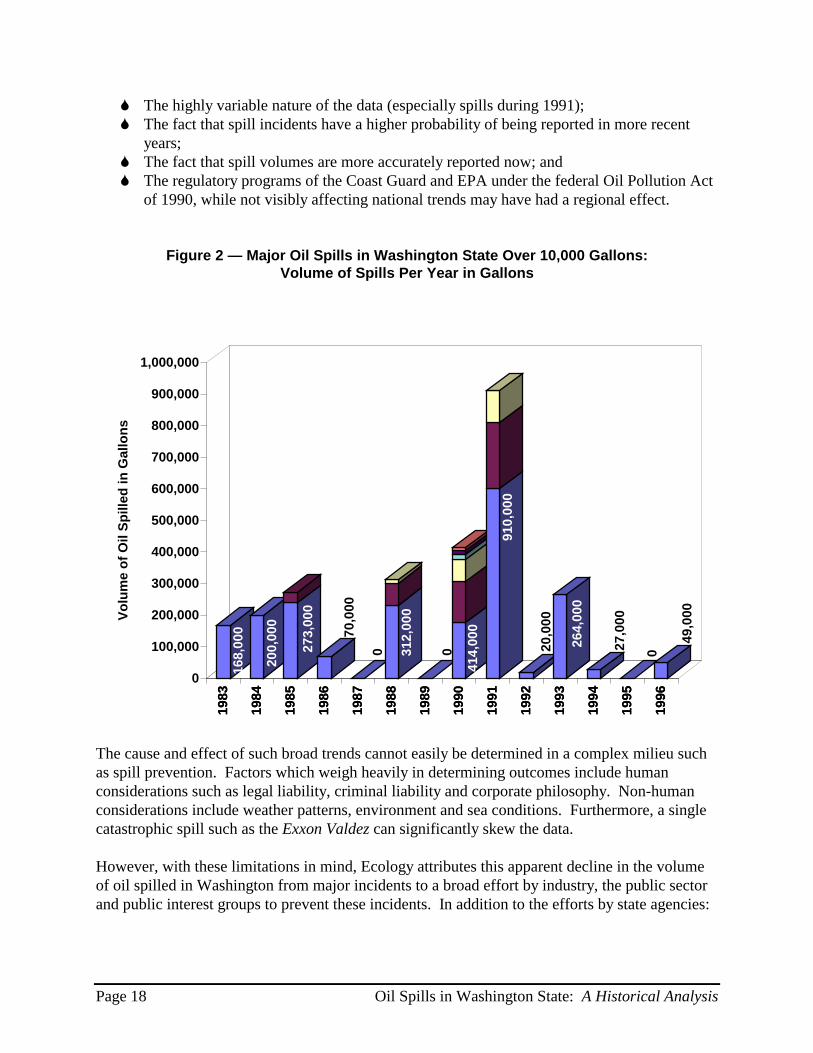
� The highly variable nature of the data (especially spills during 1991); � The fact that spill incidents have a higher probability of being reported in more recent
years; � The fact that spill volumes are more accurately reported now; and � The regulatory programs of the Coast Guard and EPA under the federal Oil Pollution Act
of 1990, while not visibly affecting national trends may have had a regional effect.
Figure 2 — Major Oil Spills in Washington State Over 10,000 Gallons: Volume of Spills Per Year in Gallons
168,
000
200,
000
273,
000
70,0
00
0 312,
000
0
414,
000
910,
000
20,0
00
264,
000
27,0
00
0
49,0
000
100,000
200,000
300,000
400,000
500,000
600,000
700,000
800,000
900,000
1,000,000
Volu
me
of O
il Sp
illed
in G
allo
ns
1983
1983
1984
1984
1985
1985
1986
1986
1987
1987
1988
1988
1989
1989
1990
1990
1991
1991
1992
1992
1993
1993
1994
1994
1995
1995
1996
1996
The cause and effect of such broad trends cannot easily be determined in a complex milieu such as spill prevention. Factors which weigh heavily in determining outcomes include human considerations such as legal liability, criminal liability and corporate philosophy. Non-human considerations include weather patterns, environment and sea conditions. Furthermore, a single catastrophic spill such as the Exxon Valdez can significantly skew the data.
However, with these limitations in mind, Ecology attributes this apparent decline in the volume of oil spilled in Washington from major incidents to a broad effort by industry, the public sector and public interest groups to prevent these incidents. In addition to the efforts by state agencies:
Page 18 Oil Spills in Washington State: A Historical Analysis
� The major oil refineries and marine terminals have enhanced corporate policies, developed more effective spill prevention and response plans, improved personnel training and dedicated more resources to equipment maintenance among other initiatives;
� Oil tanker and regional tank barge operators have invested heavily in clean-up equipment and personnel improvements — including procedures, training, crew rotation and spill response equipment;
� The domestic cargo vessel industry has placed a much higher priority on spill prevention than in the past;
� The Coast Guard has enhanced the vessel traffic system; � In the Northwest, the Coast Guard and EPA have been very active in implementing the
federal Oil Pollution Act of 1990; and � The efforts by local government, tribes and environmental groups have been particularly
important in keeping private and public sector stakeholders focused on effective prevention measures.
While this data relates to volume, it does appear to be consistent with trends identified in national spill statistics by American Petroleum Institute (API). API concluded that during the decade ending in 1994, the frequency of large spills declined by 57 percent.
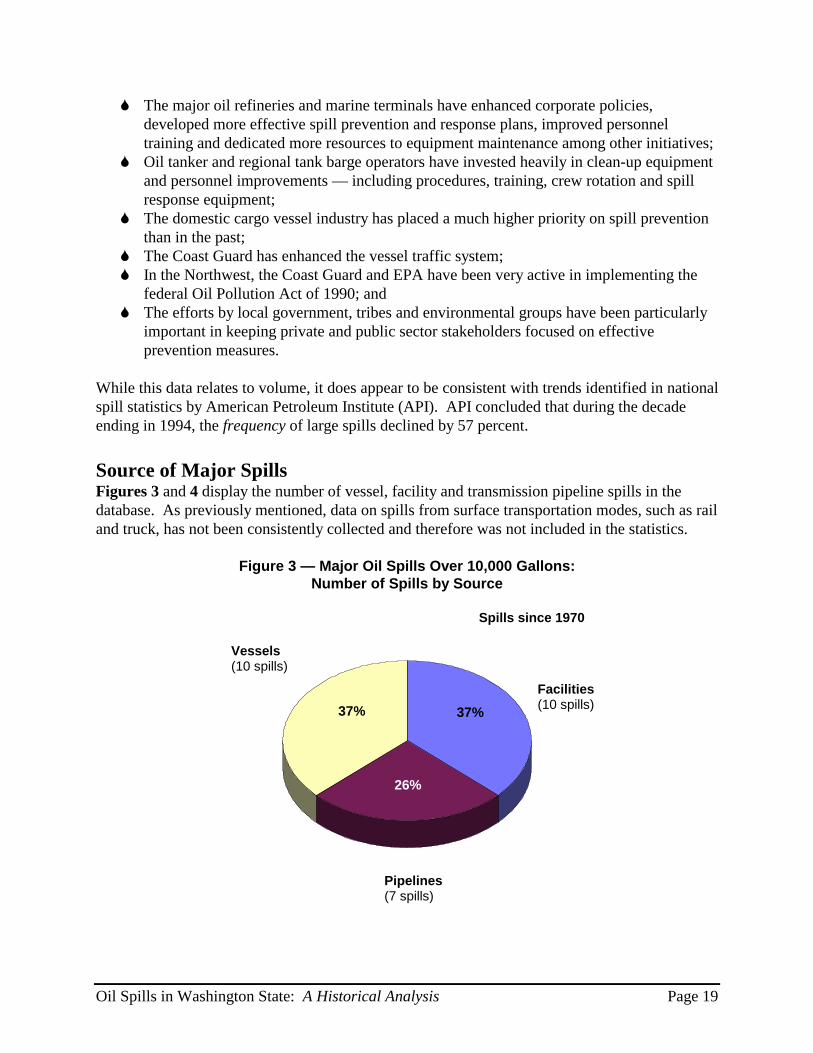
Source of Major Spills Figures 3 and 4 display the number of vessel, facility and transmission pipeline spills in the database. As previously mentioned, data on spills from surface transportation modes, such as rail and truck, has not been consistently collected and therefore was not included in the statistics.
Figure 3 — Major Oil Spills Over 10,000 Gallons:Number of Spills by Source
Spills since 1970
Vessels (10 spills)
37% 37%
26%
Pipelines(7 spills)
Facilities (10 spills)
Oil Spills in Washington State: A Historical Analysis Page 19
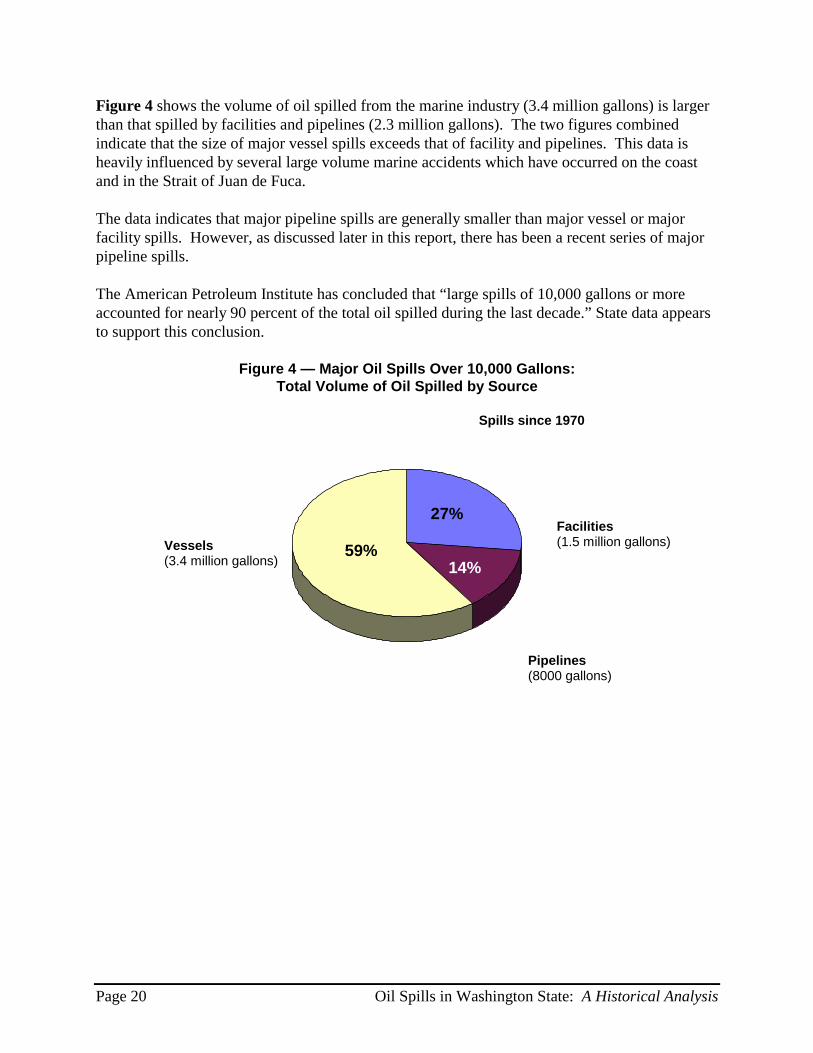
Figure 4 shows the volume of oil spilled from the marine industry (3.4 million gallons) is larger than that spilled by facilities and pipelines (2.3 million gallons). The two figures combined indicate that the size of major vessel spills exceeds that of facility and pipelines. This data is heavily influenced by several large volume marine accidents which have occurred on the coast and in the Strait of Juan de Fuca.
The data indicates that major pipeline spills are generally smaller than major vessel or major facility spills. However, as discussed later in this report, there has been a recent series of major pipeline spills.
The American Petroleum Institute has concluded that “large spills of 10,000 gallons or more accounted for nearly 90 percent of the total oil spilled during the last decade.” State data appears to support this conclusion.
Figure 4 — Major Oil Spills Over 10,000 Gallons:Total Volume of Oil Spilled by Source
Spills since 1970
14%
27%
59% Facilities (1.5 million gallons) Vessels
(3.4 million gallons)
Pipelines(8000 gallons)
Page 20 Oil Spills in Washington State: A Historical Analysis
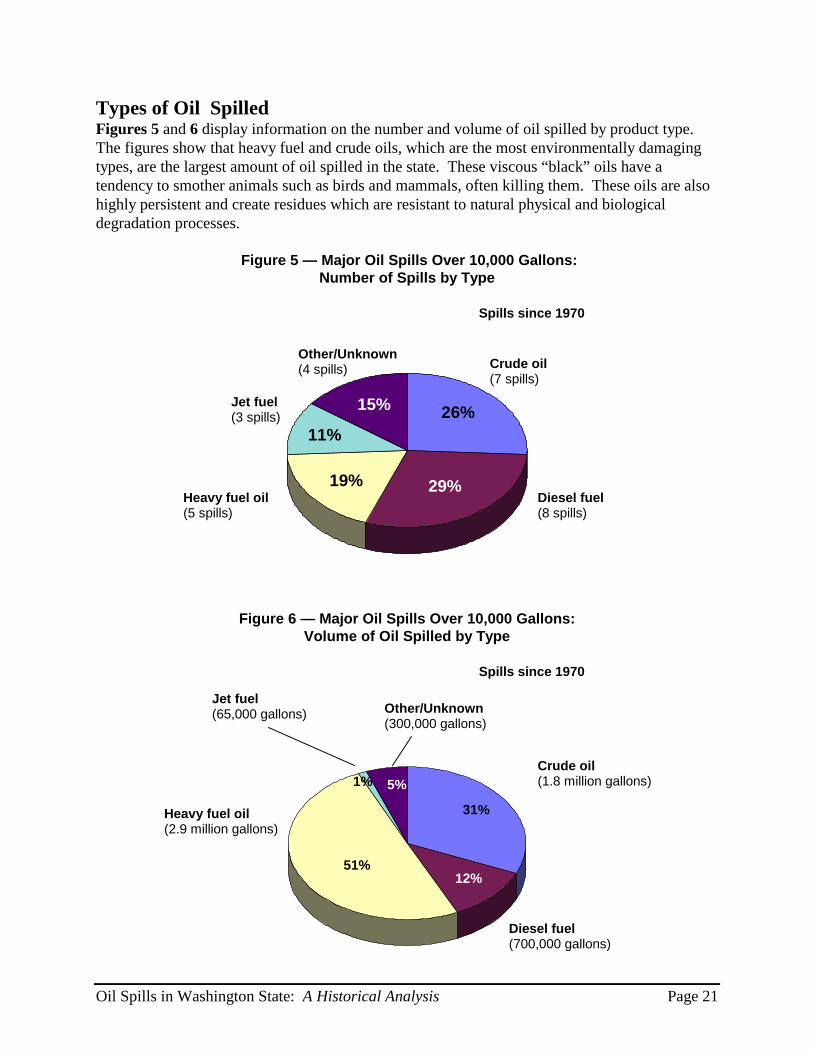
Types of Oil Spilled Figures 5 and 6 display information on the number and volume of oil spilled by product type. The figures show that heavy fuel and crude oils, which are the most environmentally damaging types, are the largest amount of oil spilled in the state. These viscous “black” oils have a tendency to smother animals such as birds and mammals, often killing them. These oils are also highly persistent and create residues which are resistant to natural physical and biological degradation processes.
Figure 5 — Major Oil Spills Over 10,000 Gallons:Number of Spills by Type
Spills since 1970
Other/Unknown(4 spills) Crude oil
15%
11%
19% 29%
26%
Diesel fuel (8 spills)
(7 spills)
Heavy fuel oil(5 spills)
Jet fuel (3 spills)
Figure 6 — Major Oil Spills Over 10,000 Gallons: Volume of Oil Spilled by Type
Spills since 1970
Jet fuel Other/Unknown(65,000 gallons) (300,000 gallons)
1% 5%
51% 12%
31%
Crude oil (1.8 million gallons)
Diesel fuel (700,000 gallons)
Heavy fuel oil(2.9 million gallons)
Oil Spills in Washington State: A Historical Analysis Page 21
Woodinv e
Ellensburg
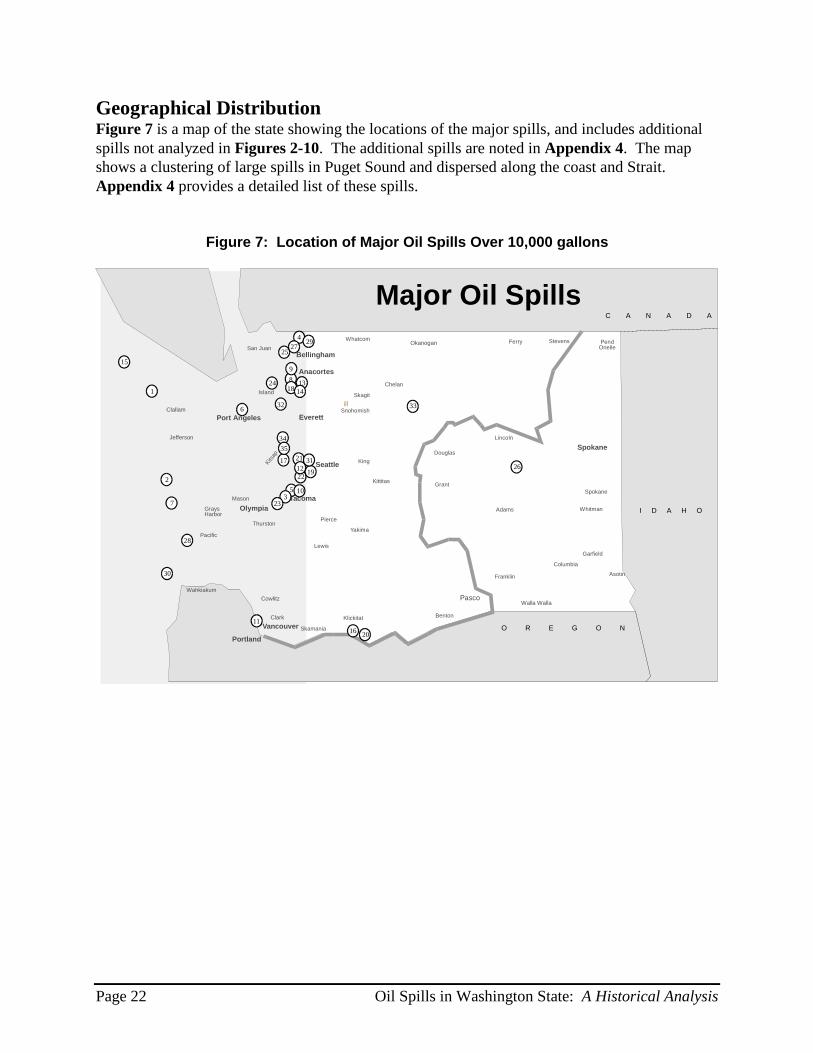
Geographical Distribution Figure 7 is a map of the state showing the locations of the major spills, and includes additional spills not analyzed in Figures 2-10. The additional spills are noted in Appendix 4. The map shows a clustering of large spills in Puget Sound and dispersed along the coast and Strait. Appendix 4 provides a detailed list of these spills.
Figure 7: Location of Major Oil Spills Over 10,000 gallons
illClallam
Adams
Yakima
Cowlitz
Clark
Okanogan
Chelan Island
Pierce
King
Spokane
Snohomish
Whatcom
Thurston
GraysHarbor
Jefferson
Pacific
Mason
Skagit
San Juan
Wahkiakum
Skamania
Lewis
Douglas
Kittitas
Klickitat Benton
Ferry Stevens
Lincoln
Grant
Whitman
Franklin
Walla Walla
Columbia
Garfield
Asotin
Pend Orielle
Kitsap
Seattle
Olympia
Pasco
Portland
I D A H O
O R E G O N
C A N A D A
Major Oil Spills
Tacoma
Vancouver
Port Angeles
Bellingham
Anacortes
Everett
17
22
21
19
13
12
5 3
10
23
25
4 2927
32
24 8 18 14
9
6
15
1
7
2
28
30
11 16 20
31
34
33
26
Spokane 35
Page 22 Oil Spills in Washington State: A Historical Analysis
0%
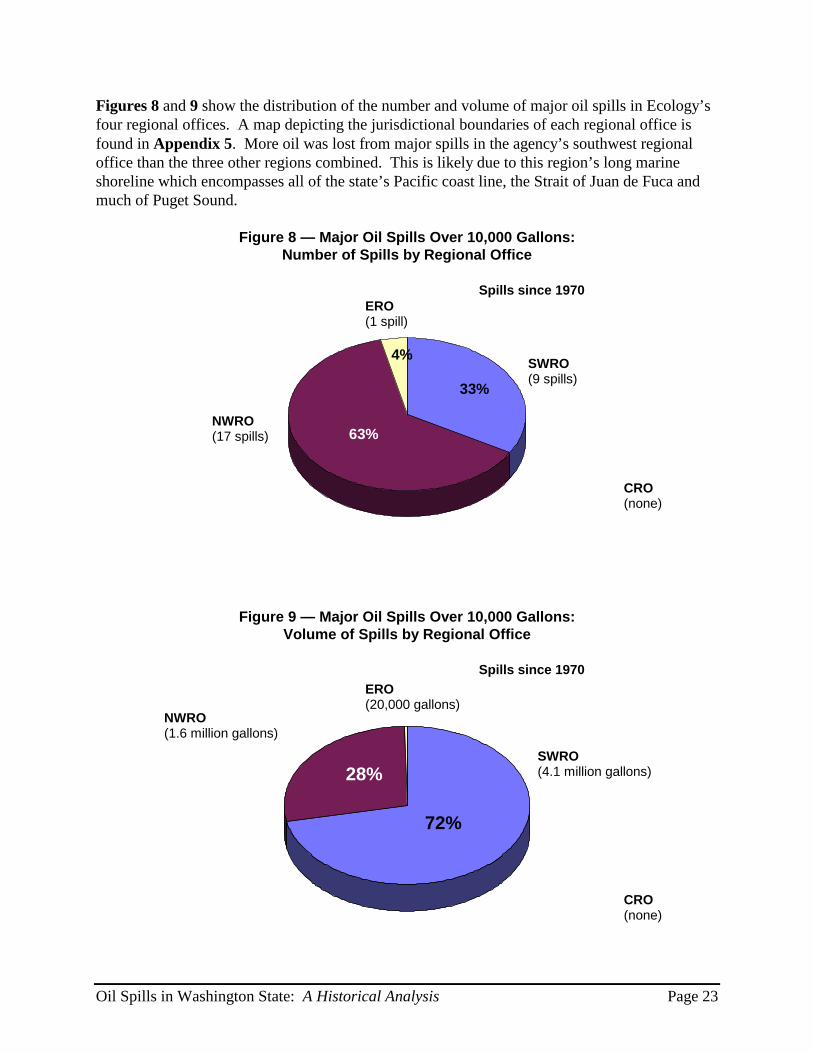
Figures 8 and 9 show the distribution of the number and volume of major oil spills in Ecology’s four regional offices. A map depicting the jurisdictional boundaries of each regional office is found in Appendix 5. More oil was lost from major spills in the agency’s southwest regional office than the three other regions combined. This is likely due to this region’s long marine shoreline which encompasses all of the state’s Pacific coast line, the Strait of Juan de Fuca and much of Puget Sound.
Figure 8 — Major Oil Spills Over 10,000 Gallons:Number of Spills by Regional Office
Spills since 1970 ERO (1 spill)
SWRO (9 spills)
CRO (none)
4%
63%
33%
NWRO (17 spills)
Figure 9 — Major Oil Spills Over 10,000 Gallons: Volume of Spills by Regional Office
Spills since 1970 ERO (20,000 gallons)
NWRO
SWRO (4.1 million gallons)
CRO (none)
28%
72%
(1.6 million gallons)
Oil Spills in Washington State: A Historical Analysis Page 23
While the largest spills occurred in the SWRO, the northwest regional office (NWRO) actually received more spills greater than 10,000 gallons. This is due to the large population and activity levels centered in Seattle, Bremerton and, to a lesser extent, the northern refineries.
The data probably under represents the volume and number of spills in the Central (CRO) and Eastern (ERO) regions because surface transportation incidents were not included in the analysis. CRO has reported the greatest number of multi-thousand gallon petroleum product spills from tanker truck rollovers. Winter mountain pass conditions undoubtedly contribute to the number of truck accidents.
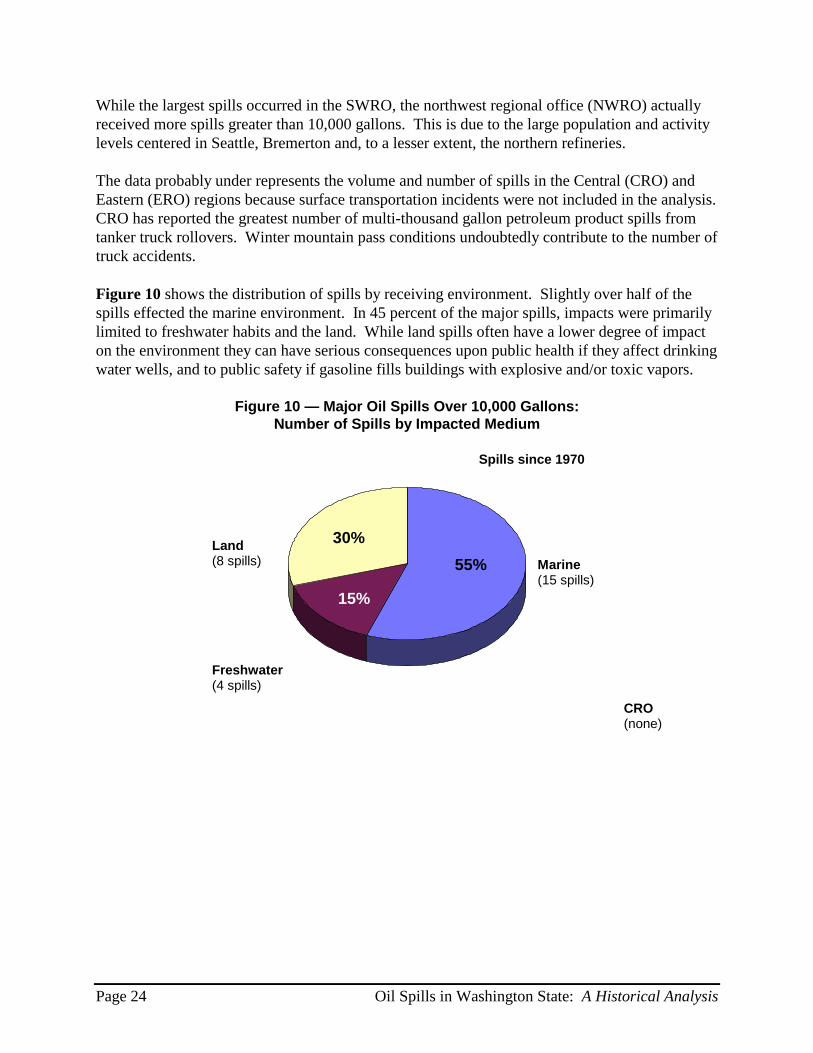
Figure 10 shows the distribution of spills by receiving environment. Slightly over half of the spills effected the marine environment. In 45 percent of the major spills, impacts were primarily limited to freshwater habits and the land. While land spills often have a lower degree of impact on the environment they can have serious consequences upon public health if they affect drinking water wells, and to public safety if gasoline fills buildings with explosive and/or toxic vapors.
Figure 10 — Major Oil Spills Over 10,000 Gallons:Number of Spills by Impacted Medium
Spills since 1970
15%
55% 30%
Marine (15 spills)
Land (8 spills)
Freshwater (4 spills)
CRO (none)
Page 24 Oil Spills in Washington State: A Historical Analysis
Chapter 4: Recent Trends in Oil Spills
This section evaluates information on spills between 25 and 10,000 gallons which have occurred between June 30, 1992, and July 1, 1996. The spills included in this data set
include 86 vessel and facility spills and six pipeline spills where at least 25 gallons of oil reached water or at least 250 gallons was spilled on land. Truck and train transportation incidents are not included in this data.
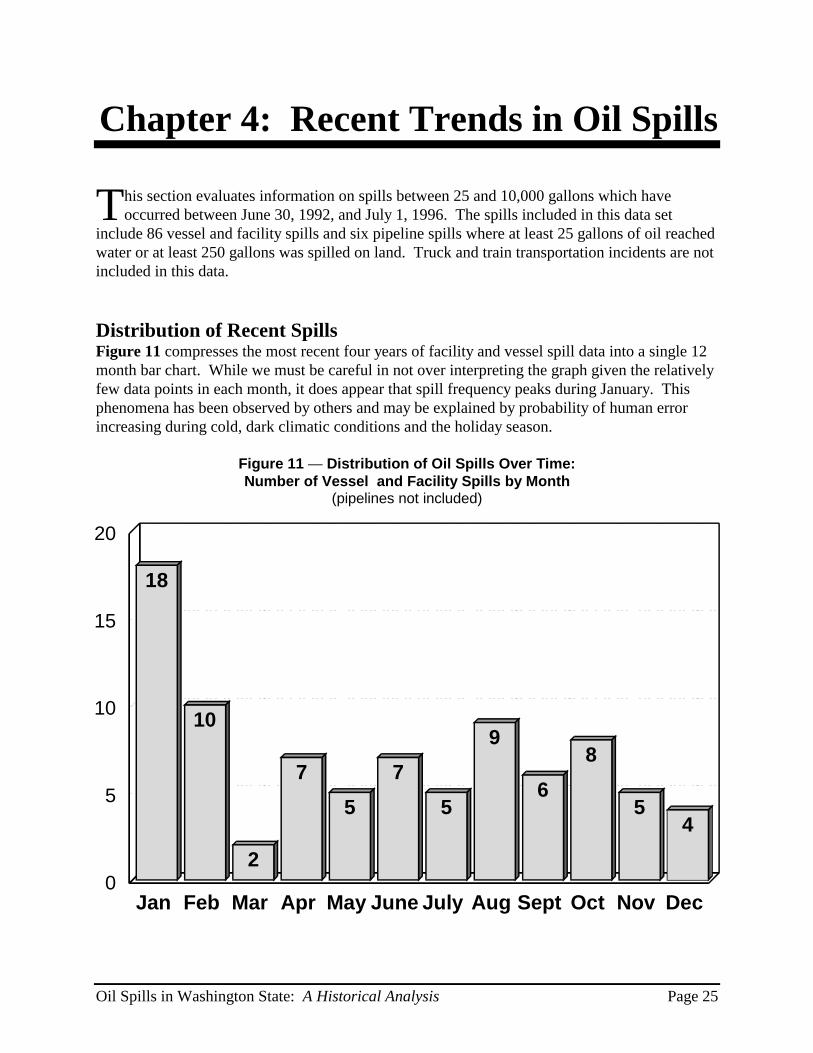
Distribution of Recent Spills Figure 11 compresses the most recent four years of facility and vessel spill data into a single 12 month bar chart. While we must be careful in not over interpreting the graph given the relatively few data points in each month, it does appear that spill frequency peaks during January. This phenomena has been observed by others and may be explained by probability of human error increasing during cold, dark climatic conditions and the holiday season.
Figure 11 — Distribution of Oil Spills Over Time:Number of Vessel and Facility Spills by Month
(pipelines not included)
20
18
10
2
7 5
7 5
9
6 8
5 4
15
10
5
0 Jan Feb Mar Apr May June July Aug Sept Oct Nov Dec
Oil Spills in Washington State: A Historical Analysis Page 25
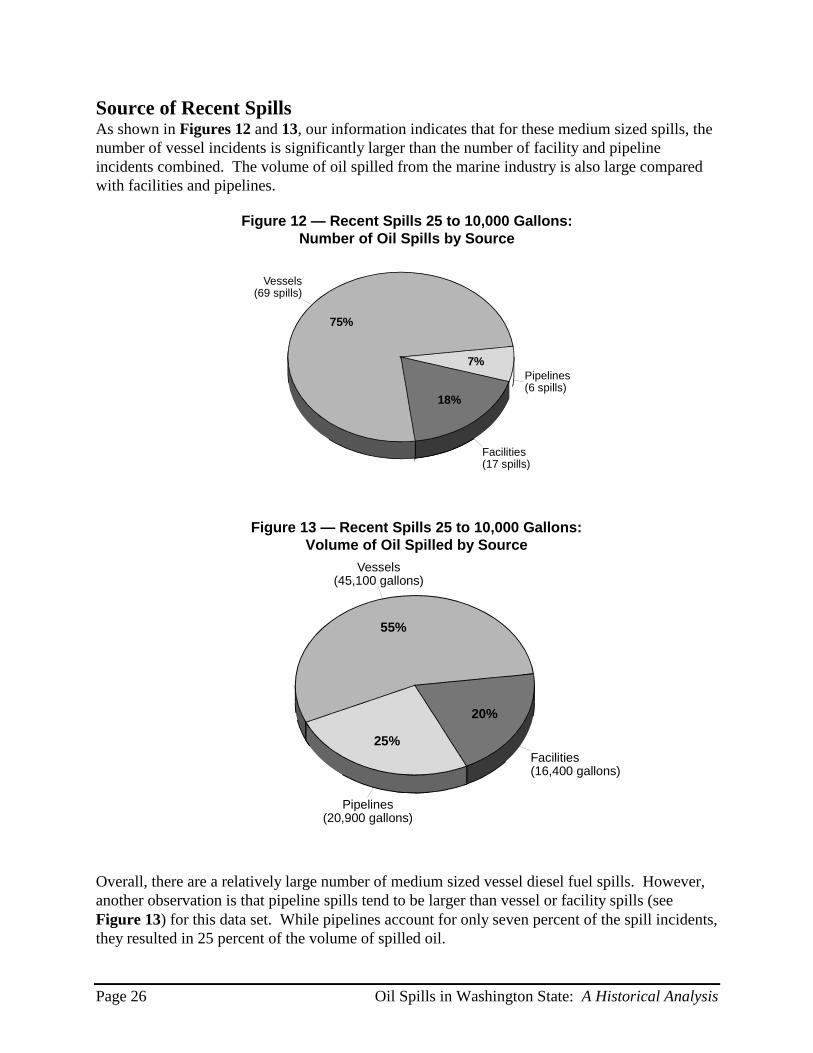
Source of Recent Spills As shown in Figures 12 and 13, our information indicates that for these medium sized spills, the number of vessel incidents is significantly larger than the number of facility and pipeline incidents combined. The volume of oil spilled from the marine industry is also large compared with facilities and pipelines.
Figure 12 — Recent Spills 25 to 10,000 Gallons:Number of Oil Spills by Source
Figure 13 — Recent Spills 25 to 10,000 Gallons: Volume of Oil Spilled by Source
Vessels
Vessels (69 spills)
Facilities (17 spills)
Pipelines(6 spills)
75%
18%
7%
(45,100 gallons)
Facilities (16,400 gallons)
55%
25%
20%
Pipelines(20,900 gallons)
Overall, there are a relatively large number of medium sized vessel diesel fuel spills. However, another observation is that pipeline spills tend to be larger than vessel or facility spills (see Figure 13) for this data set. While pipelines account for only seven percent of the spill incidents, they resulted in 25 percent of the volume of spilled oil.
Page 26 Oil Spills in Washington State: A Historical Analysis
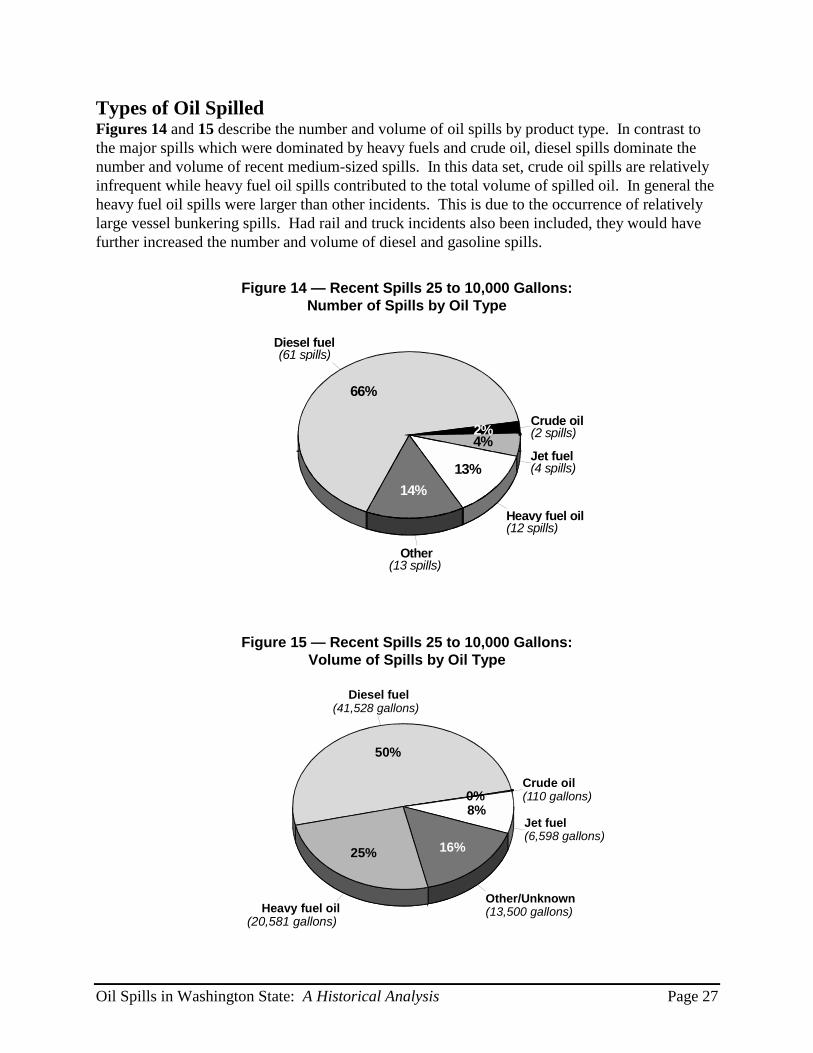
Types of Oil Spilled Figures 14 and 15 describe the number and volume of oil spills by product type. In contrast to the major spills which were dominated by heavy fuels and crude oil, diesel spills dominate the number and volume of recent medium-sized spills. In this data set, crude oil spills are relatively infrequent while heavy fuel oil spills contributed to the total volume of spilled oil. In general the heavy fuel oil spills were larger than other incidents. This is due to the occurrence of relatively large vessel bunkering spills. Had rail and truck incidents also been included, they would have further increased the number and volume of diesel and gasoline spills.
Figure 14 — Recent Spills 25 to 10,000 Gallons: Number of Spills by Oil Type
Diesel fuel (61 spills)
66%
4% 2% Crude oil
(2 spills)
Jet fuel 13% (4 spills)
14% Heavy fuel oil (12 spills)
Other (13 spills)
Figure 15 — Recent Spills 25 to 10,000 Gallons:Volume of Spills by Oil Type
Diesel fuel (41,528 gallons)
50%
Crude oil 0% (110 gallons)8%
Jet fuel (6,598 gallons)
16% 25%
Other/UnknownHeavy fuel oil (13,500 gallons)
(20,581 gallons)
Oil Spills in Washington State: A Historical Analysis Page 27
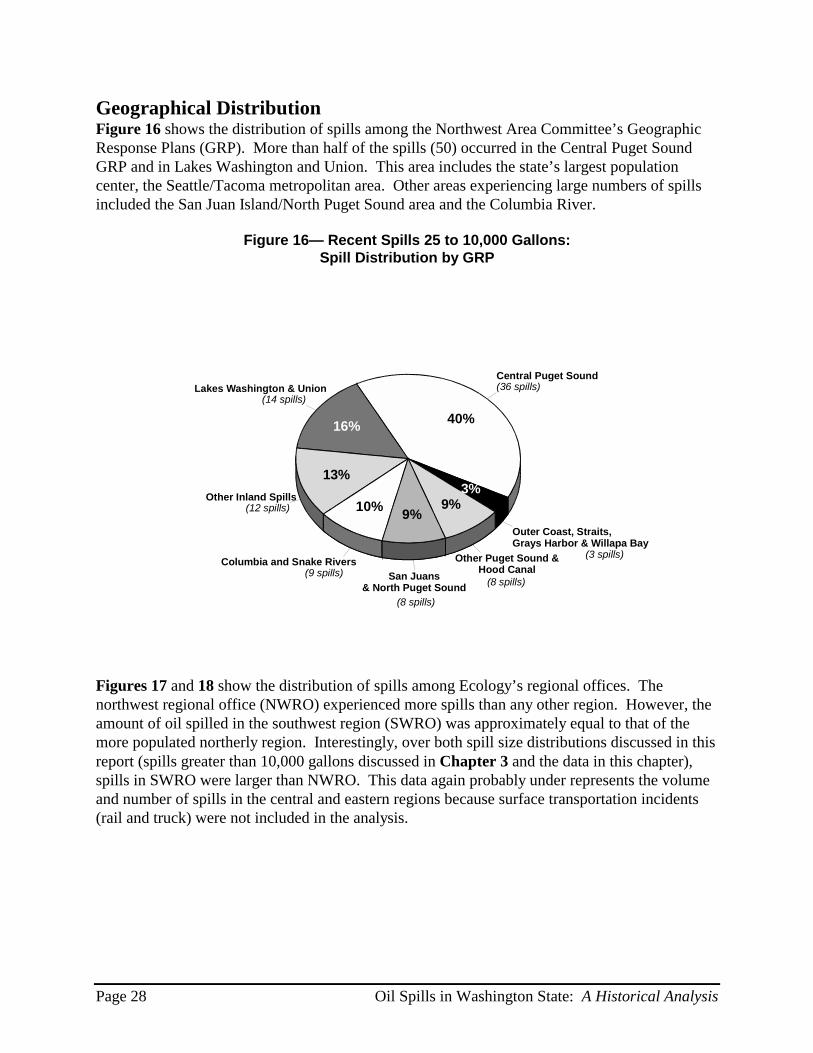
Geographical Distribution Figure 16 shows the distribution of spills among the Northwest Area Committee’s Geographic Response Plans (GRP). More than half of the spills (50) occurred in the Central Puget Sound GRP and in Lakes Washington and Union. This area includes the state’s largest population center, the Seattle/Tacoma metropolitan area. Other areas experiencing large numbers of spills included the San Juan Island/North Puget Sound area and the Columbia River.
Figure 16— Recent Spills 25 to 10,000 Gallons:Spill Distribution by GRP
Other Inland Spills(12 spills)
Lakes Washington & Union(14 spills)
Central Puget Sound(36 spills)
Columbia and Snake Rivers (9 spills) Hood Canal
13%
16% 40%
10% 9% 9%
3%
Outer Coast, Straits, Grays Harbor & Willapa Bay
Other Puget Sound & (3 spills)
San Juans & North Puget Sound (8 spills)
(8 spills)
Figures 17 and 18 show the distribution of spills among Ecology’s regional offices. The northwest regional office (NWRO) experienced more spills than any other region. However, the amount of oil spilled in the southwest region (SWRO) was approximately equal to that of the more populated northerly region. Interestingly, over both spill size distributions discussed in this report (spills greater than 10,000 gallons discussed in Chapter 3 and the data in this chapter), spills in SWRO were larger than NWRO. This data again probably under represents the volume and number of spills in the central and eastern regions because surface transportation incidents (rail and truck) were not included in the analysis.
Page 28 Oil Spills in Washington State: A Historical Analysis
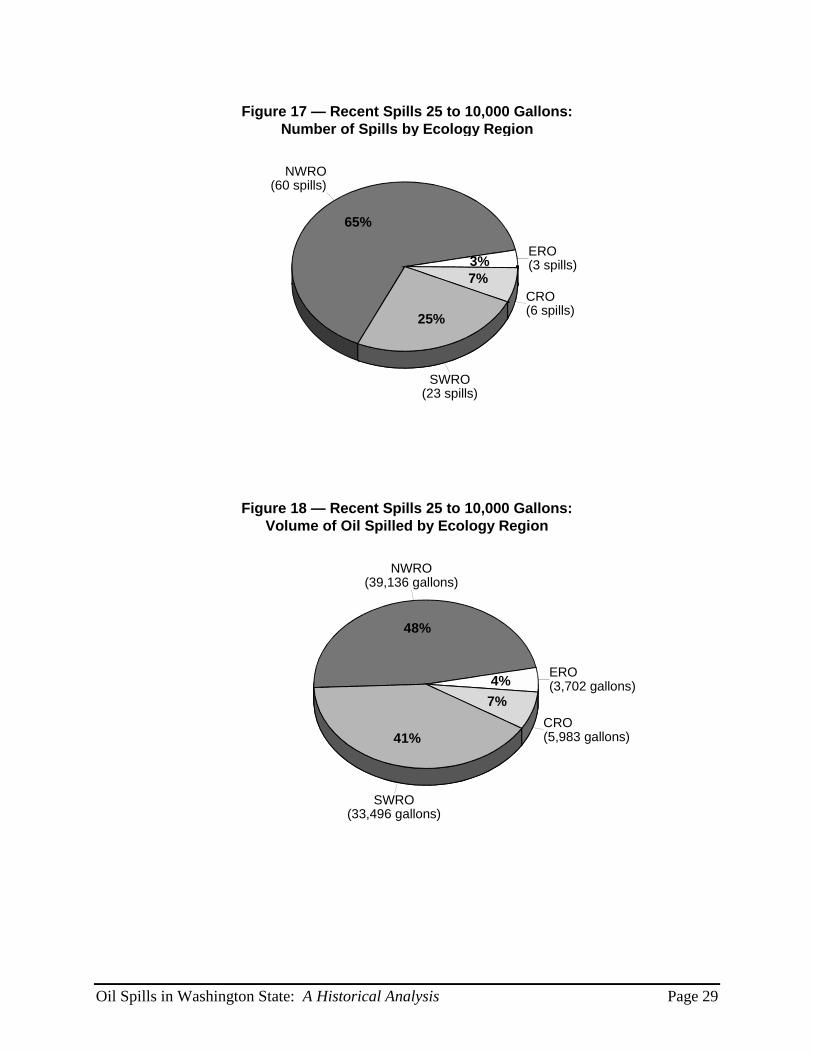
Figure 17 — Recent Spills 25 to 10,000 Gallons:Number of Spills by Ecology Region
NWRO (60 spills)
SWRO
CRO (6 spills)
ERO (3 spills)
65%
25%
7% 3%
(23 spills)
Figure 18 — Recent Spills 25 to 10,000 Gallons: Volume of Oil Spilled by Ecology Region
NWRO (39,136 gallons)
SWRO
CRO (5,983 gallons)
ERO (3,702 gallons)
48%
41%
7% 4%
(33,496 gallons)
Oil Spills in Washington State: A Historical Analysis Page 29
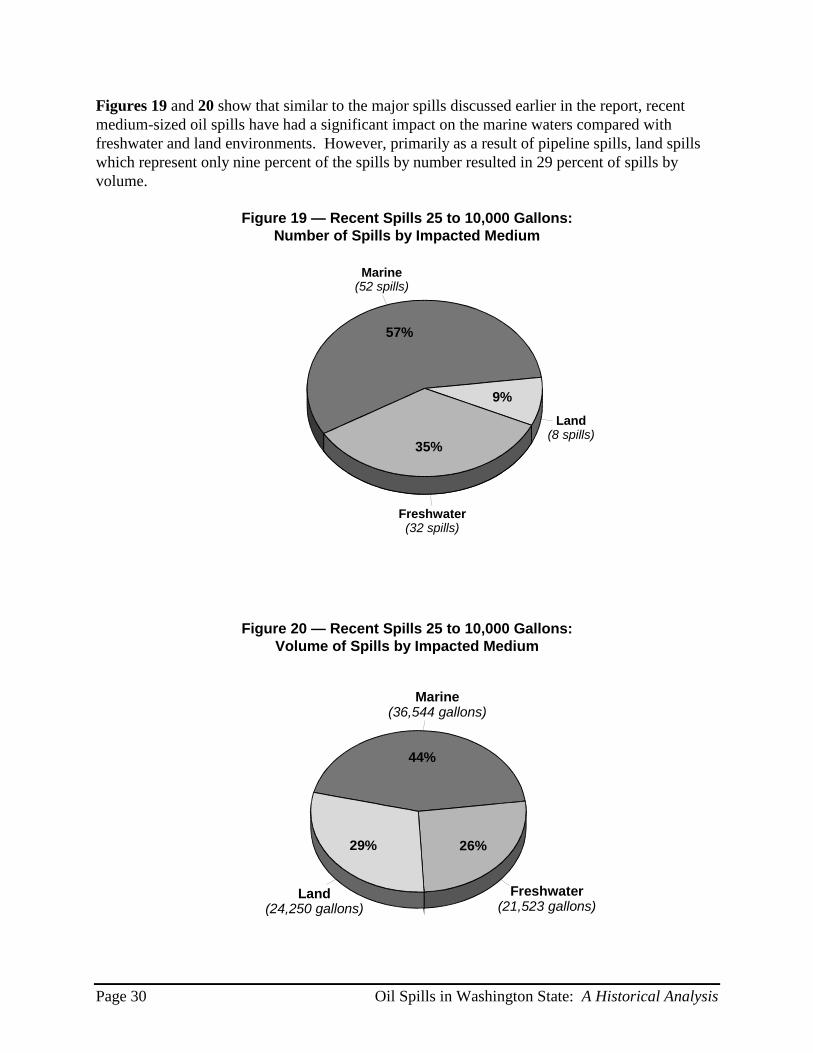
Figures 19 and 20 show that similar to the major spills discussed earlier in the report, recent medium-sized oil spills have had a significant impact on the marine waters compared with freshwater and land environments. However, primarily as a result of pipeline spills, land spills which represent only nine percent of the spills by number resulted in 29 percent of spills by volume.
Figure 19 — Recent Spills 25 to 10,000 Gallons:Number of Spills by Impacted Medium
Marine
57%
35%
9%
Freshwater (32 spills)
(52 spills)
Land (8 spills)
Figure 20 — Recent Spills 25 to 10,000 Gallons:Volume of Spills by Impacted Medium
Marine
44%
29% 26%
(36,544 gallons)
Freshwater (21,523 gallons)
Land (24,250 gallons)
Page 30 Oil Spills in Washington State: A Historical Analysis
Comparison with Coast Guard Data The U.S. Coast Guard maintains a national data base which can be used to evaluate both national and regional trends in oil spills. Spill data from 1991-1995 currently under review by the Coast Guard’s District XIII staff in Seattle, seems to confirm the general trends shown in Figure 13. This data for the Puget Sound Marine Safety office indicates that 62 percent of the volume of oil spilled came from vessels, 34 percent came from facilities and four percent from another source.
National trends identified by the Coast Guard’s “Marine Environmental Protection Performance Indicators” indicates that major and medium sized oil spills may be trending downward. This potential trend appears to be consistent with Figure 2 of this report. Ecology will continue to work closely with our federal partners to track and report on trends as they emerge.
Cause of Recent Spills The analysis and understanding of the causes of major spills is not as simple. There are a myriad of reasons for this, including:
� Most major spills are difficult to analyze given that they are often the result of a series of complex factors and conditions coming together at a particular moment in time. The factors may include both failures which are preventable, and conditions which are not within human control. Often a major incident would not have occurred if any one of the factors or conditions had been absent. Therefore, it is often difficult to boil an incident down to a single primary/root cause with identified contributing factors.
� There is a lack of a consistent framework for systematically analyzing and categorizing incidents. This is a problem both nationally and in Washington State.
� There is lack of consistently collected reliable information on spill causes. This is partially due to the scarcity of highly trained staff resources in the investigating agencies, the reluctance of industry to fully disclose information for liability reasons and the lack of agency funding to hire independent experts to conduct professional investigations.
� There is also a reluctance on the part of many investigators to directly place blame because of liability concerns, sympathy for an individual or organization who has already been affected by an incident, and concern that an employee who may have contributed to an incident may lose their livelihood. The result is that some investigations identify the cause of an incident as equipment failure or a natural event, even when an easily preventable human error (individual or organizational) occurred.
However, there is a consensus that most major spills are caused by some form of human error and are therefore preventable. In order to provide additional insight into the types of human error, this report further distinguishes between individual human factors and management/organizational factors. The terms used in this report are defined as follows:
Oil Spills in Washington State: A Historical Analysis Page 31
� Management/Organization — The failure of an organization to provide the necessary policies, procedures, equipment, personnel, supervision, training or time to safely design and operate a system which could potentially cause a spill. In order to prevent spills, an organization may be expected to go beyond currently accepted industry practices.
� Human Factor — The diminished ability (over which the organization has relatively little control) of an individual to safely complete a task. Examples include poor communication, drugs/alcohol, improper equipment use, inaccurate computation, inattention, procedural error, complacency, not following training procedures, fatigue, illness or sabotage/intentional.
� Equipment — A mechanical, structural or electrical failure not attributable to a human error-related design, material specification, manufacture/construction, installation, operation or maintenance deficiency. An example which would not qualify for this category as an “equipment failure” would be a failure from normal wear and tear as a result of lack of maintenance. This would be either a management/organization or human factor caused spill.
� External — Natural phenomenon such as earthquakes, floods, storms, tsunami, fog, ice, lightning, tidal conditions, sea state and landslides which occur with a magnitude outside of reasonably anticipated design or operating limits. An example of an external cause could be any act caused by Mother Nature.
For the reasons stated earlier, Ecology’s data on spill cause is somewhat limited. Ecology is working to improve the systems for collecting, analyzing and maintaining spill cause data. Current initiatives include the development of an investigator training curriculum, hiring independent experts on major spills and the States/BC Oil Spill Task Force’s project to provide a consistent methodology for collecting and sharing spill data on the entire West Coast.
Figures 21 and 22 show the distribution of spill causes for 41 recent spills in Washington (Note: incident cause was not identified in 51 of the other spills analyzed in this section). Based on the limited information available to Ecology, it appears that "human error" at the levels of the organization and individual predominate. Of the four cause definitions, organizational failure is the primary cause of recent spills in terms of both number of incidents and total volume of oil spilled. Human factors are the second most predominant cause of these spills.
The conclusion that human error is the primary cause of most spills is supported by findings by the Washington State Office of Marine Safety, the California Lands Commission, the U.S. Coast Guard, the Alaska Department of Environmental Conservation and most industry analysts. The definitions used in this report are identical with those being developed by the States/British Columbia Task Force for the purpose of consistently collecting cause data in the future on the West Coast.
Page 32 Oil Spills in Washington State: A Historical Analysis
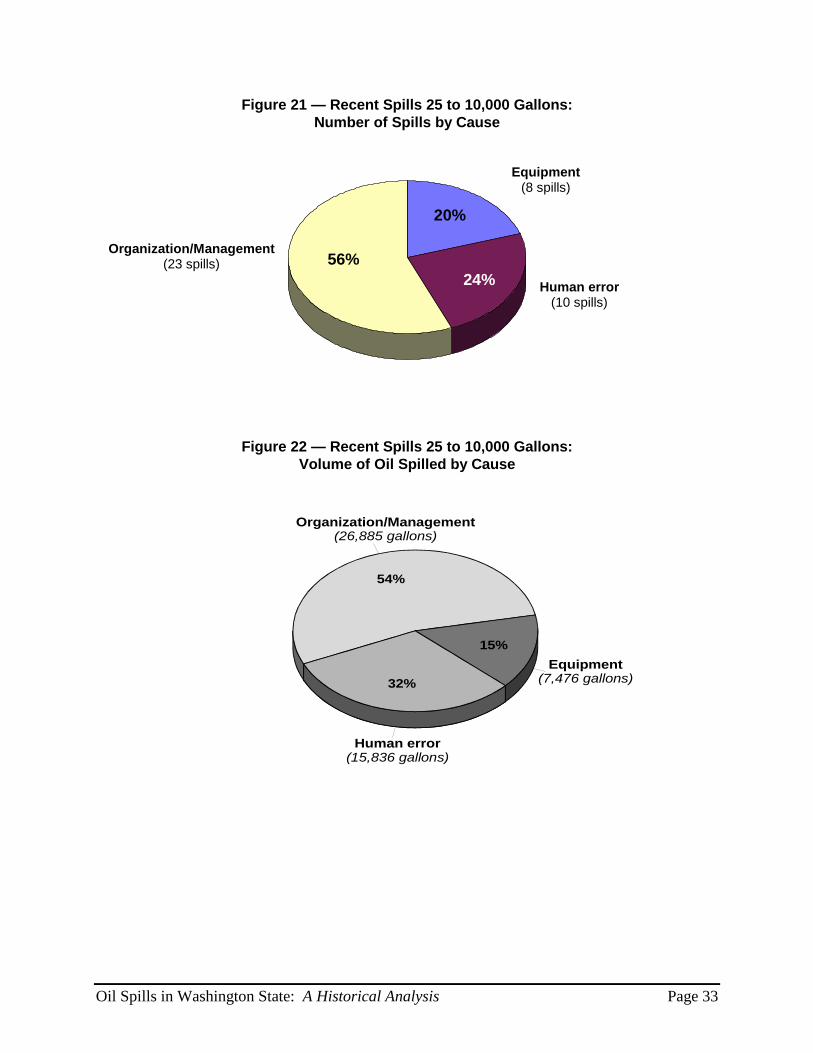
Figure 21 — Recent Spills 25 to 10,000 Gallons: Number of Spills by Cause
Equipment(8 spills)
Organization/Management(23 spills)
24%
20%
56% Human error
(10 spills)
Figure 22 — Recent Spills 25 to 10,000 Gallons: Volume of Oil Spilled by Cause
Organization/Management(26,885 gallons)
54%
32%
15%
Human error (15,836 gallons)
Equipment(7,476 gallons)
Oil Spills in Washington State: A Historical Analysis Page 33

Page 34 Oil Spills in Washington State: A Historical Analysis
Chapter 5: Near Miss Incidents
his report’s Appendix 1: Significant Vessel Casualties and Near Miss Incidents is a list Tof important vessel-related incidents where there was either a major system failure or actual external damage to a vessel that occurred between 1984-96. Those incidents which did not result in the release of oil are considered to be close calls. When they are properly investigated, as much can be learned about spill prevention from these incidents as from actual spills. The state Office of Marine Safety (OMS) is currently working with other stakeholders to put a system in place which would collect information on more of these vessel incidents.
If these collisions, groundings, allisions (collision with a fixed object) and losses of power were plotted on the map outlining Washington’s major oil spills (Figure 7), they would largely parallel the locations where major spills have actually occurred.
Given the difficulty in agreeing on what constitutes a "near miss," the lack of incentives for reporting these incidents and the liability concerns of facility owners, it would be difficult to establish a reporting system for major non-spill incidents at marine facilities and transmission pipelines. However, Ecology will continue to follow progress by OMS and the marine industry to determine if similar discussions should be initiated with the industry segments which Ecology regulates.
Oil Spills in Washington State: A Historical Analysis Page 35

Page 36 Oil Spills in Washington State: A Historical Analysis
Chapter 6: Lessons Learned From Recent Pipeline Spills
ver the last few years pipeline spills have occurred nationally with a frequency and Oenvironmental consequence that have raised significant concerns from the National Transportation Safety Board and others. The potential for similar major oil spills exists in Washington State. For example, two past pipeline spills involved the release of 460,000 and 168,000 gallons. These incidents show how much oil can be spilled by pipelines before the leak is detected, the system is shut down and residual drain out is controlled.
In Washington State, the major oil transportation pipelines spill only a very small portion of the products they transport. However, because of the large amount of oil which can be spilled before a spill incident is identified and controlled, they have the potential to cause serious environmental damage. Spill events during 1996 have demonstrated the need for Ecology to review current spill prevention measures for the state’s major oil transportation pipelines. During 1996, the following incidents occurred:
� On March 23, 1996, an estimated 1,560 gallons of diesel fuel spilled from the Olympic Pipe Line into a tributary to Spencer Creek in Cowlitz County. The spill was caused by damage to the pipeline as a result of ground slumping in unstable soil in the area surrounding the pipeline.
� On June 16, 1996, at least 1,000 gallons of gasoline and diesel fuel spilled from a small crack in the Olympic Pipe Line into an unnamed slough near Everett. The cause of the spill may have been due to construction damage during original installation in 1972.
� On Dec. 6, 1996, approximately 49,000 gallons of unleaded gasoline spilled at the GATX oil storage facility on Harbor Island in Seattle. The spill resulted from a pipeline coupling failure at the plant during a product transfer from the Olympic Pipe Line. The specific cause of the spill is still under investigation and has not been determined.
It is often difficult to determine the quantity of oil lost during pipeline spills. For instance, the two Olympic Pipe Line spills went undetected for a significant period of time while oil entered soils and state waters. Ecology will continue to review the cause of these and other similar events with industry to gain a better understanding of how these spills can be prevented. This review is particularly important at this time, given the proposal for a major cross-Cascades petroleum pipeline. The state has a responsibility to assure that any new or repaired pipeline sections are constructed and operated in an optimal manner to minimize the opportunity for spills.
Oil Spills in Washington State: A Historical Analysis Page 37
As a result of recent pipeline spills, Ecology is evaluating the need for industry to put in place additional protection measures. However, at this time Ecology does not have resources to institute a transmission pipeline spill prevention effort.
Page 38 Oil Spills in Washington State: A Historical Analysis
Conclusions
e have reached a number of conclusions after reviewing the information presented in this Wreport. These conclusions were not based on a statistical analysis but were developed by inference after evaluating the data. The conclusions presented below are arranged by category, not priority.
Data Collection and Analysis � Resources needed for data collection: Readily accessible historical data on major spills
prior to the mid-1980s is incomplete. Ecology will continue to improve the collection of this information in order to better analyze the cause of significant oil spills and help the agency target its prevention efforts. This needed improvement will require Ecology to continue current efforts to improve investigator training and commit additional resources to information management. There is also a need to improve truck and rail data in particular, given the gap in this report.
Important Trends in Spills � Human error causes most spills: Ecology’s spill cause data indicates that most recent
spills (about 80 percent) were the result of some type of human factor and were, therefore, preventable. It also appears that organization/management is responsible for significantly more incidents than the failure of an individual. These conclusions are consistent with the findings of other researchers at the national level and have important implications for spill prevention.
� Spills occur most frequently in January: During the last four years, the annual incidence of significant oil spills was highest during January. While we need to better understand the reasons for this seasonal influx, one factor suggests the importance of addressing the human factors component in oil spills.
� Spills over 10,000 gallons are source of most oil: The overall quantity of oil spilled is dominated over time by large spills greater than 10,000 gallons. The state should continue to target prevention activities for potential major spill sources. However, this report did not evaluate non-point source oil inputs to the environment, which are seldom reported to environmental agencies and can add up to large volumes. Non-point sources include leaking motor vehicle crank cases, parking lot run-off, improper disposal of used motor oil and other similar sources.
� “Black” oil is a serious threat: Crude and heavy fuel oils have constituted about 82 percent of the total oil released from spills over 10,000 gallons. These forms of “black” oil are among the most persistent and environmentally damaging types of oil and are very difficult to clean up. Future spill prevention efforts should continue to address vessel
Oil Spills in Washington State: A Historical Analysis Page 39
spills which were responsible for about 59 percent of the total volume of oil lost from major spills and many of the incidents involving black oil.
� Biggest risk is associated with marine transportation corridors: The outer coast, the Strait of Juan de Fuca and the vicinity surrounding the state’s major refineries are the areas at greatest risk of major spills.
� Transmission pipelines present significant risk: During the last four years, the volume of oil released per spill from pipeline incidents was relatively large compared with routine vessel and facility spills. With the continued occurrence of these spills, industry and Ecology should place additional emphasis on prevention of spills from major transmission pipelines.
Effectiveness of Existing Spill Prevention Measures � Big spill incidents may be dropping: While it is difficult to clearly attribute the long-
term trend in spills over 10,000 gallons to any specific measure, it does appear that since 1983 the number and volume of major spills in Washington has gone down (see Figure 2). Furthermore, this apparent decline may be occurring more rapidly than national rates. If this is true, it has good implications for the effectiveness of the state/federal and industry spill prevention partnerships which have been developed in Washington since the passage of the state’s spill prevention legislation in 1991. However, the state must guard against complacency and losing focus on spill prevention.
� Land-based spills continue to pose risk: Washington has information on 15 petroleum oil spills of over 100,000 gallons since 1964. These major spills have included tanker and barge accidents, refinery accidents and major transmission pipeline releases. While vessel spills may present the greatest risk for catastrophic spills, refinery and transmission pipeline operations have resulted in four of the last five spills over 10,000 gallons. These facilities should continue to be the primary focus of Ecology’s spill prevention efforts.
State Spill Policy � Effect of spills on state legislation: As indicated in Appendix 2, there is a strong
connection between the incidence of oil spills and subsequent legislative expansion of state responsibilities for spill prevention and response. We can expect that the future occurrence of major spills will trigger additional public expectations for improved spill prevention measures.
� Washington has a unique energy policy setting: Washington State has not depended solely on federal rules for the protection of its natural resources, but has established its own stringent oil spill prevention and response program. The primary factors which have influenced state policy in this area (other than actual spill events) include: the high sensitivity and value of Washington’s aquatic resources; the large volume of Pacific rim trade; and the state’s reliance on external crude oil resources.
Page 40 Oil Spills in Washington State: A Historical Analysis
� Petroleum products exported from Washington are subject to a tax credit: Washington State refines large volumes of petroleum products. A significant portion of the refined products are exported to Oregon and California. While our state is exposed to the spill risks associated with the importation, processing, storage and export of those products, Washington’s spill prevention and response programs do not receive tax revenue from petroleum which is exported.
Oil Spills in Washington State: A Historical Analysis Page 41

Page 42 Oil Spills in Washington State: A Historical Analysis
Appendices
Appendix 1 — Significant Vessel Casualties and Near Misses
Appendix 2 — Major Oil Spills and Related Legislative Action
Appendix 3 — Selected Spills in Washington State
Appendix 4 — Legend for Map: Spills Over 10,000 Gallons
Appendix 5 — Ecology’s Regional Offices Map
Oil Spills in Washington State: A Historical Analysis Page 43

Appendix 1 — Significant Vessel Casualties and Near Misses
� August 12, 1996, Grounding — A loaded grain ship, the Ossolineum grounded along the banks of the Columbia river. The vessel, which was outbound, was carrying 350,000 gallons of fuel in its tanks when it ran aground upstream from three wildlife refuges and estuaries. Luckily no oil was spilled.
� July 11, 1996, Loss of Power — The oil tanker Kenai lost power off Port Angeles. The tanker was headed toward Valdez when it stopped at Port Angeles to have its radar fixed and to refuel for the voyage. Fortunately, an escort tug was near by when the vessel lost power and was able to bring the vessel back to Port Angeles without incident.
� July 6 1996, Shipboard Fire — The cruise ship Golden Princess was headed to Vancouver, British Columbia, when a fire in the engine room caused the engines to shut down. The vessel also lost electrical power. A tug boat arrived on scene in three hours to tow the vessel to Vancouver for repairs. The vessel was carrying over 600,000 gallons of fuel when it lost power.
� October 1994, Grounding — The empty tanker Keystone Canyon broke all of her mooring lines in high winds while moored in Astoria, Oregon. The ship drifted across the Columbia River and struck the Astoria-Megler Highway Bridge. Fortunately, damage to the ship and the bridge was minimal. No oil was spilled although an empty tank was breached. A combination of weather conditions and lack of procedures lead to the grounding.
� July 1994, Loss of power — The 32,671 bulk carrier Verbier was outbound from Vancouver, British Columbia, when it lost power 2.5 miles from shore in the Strait of Juan de Fuca. After an unsuccessful attempt to be towed to port by a small tug, a second larger tug was dispatched. After several hours of towing, the tow line parted. The tug made-up again, and successfully towed the vessel to Port Angeles with the final assistance of tow other tugs. Lack of proper owner and operator oversight and support contributed to the accident.
� July 1994, Collision — The Chinese bulk freighter Tian Tan Hai collided with the fully laden tank barge Cascades approximately 30 miles west of the Columbia River entrance. The Cascades was being towed by the tug Fairwind and was carrying 2.4 million gallons of oil. Fortunately no oil was spilled because the collision did not rupture any cargo tanks on the barge or fuel tanks on the freighter. The barge was double-hulled. Lack of communication and adherence to regulations and policy contributed to this collision.
� November 1993, Explosion — The tanker Sea River Philadelphia suffered an explosion in her Inert Gas compartment while moored in Anacortes. Fortunately no one was injured and no oil was spilled. Inadequate maintenance procedures and possible inadequate design contributed to the explosion.
Page 44 Oil Spills in Washington State: A Historical Analysis
� July 1993, Poor Vessel Condition — The tanker Altair was boarded and briefly detained in Victoria, British Columbia, by the Canadian Coast Guard. The ship was in poor condition. Two months later, the Altair blew up and sank in the South China Sea.
� June 1991, Grounding — The laden tanker ARCO Texas ran aground at Ediz Hook in Port Angeles, Washington. No release of oil occurred.
� September 1989, Loss of power — The tanker Exxon San Francisco lost power while outbound in the Strait of Juan de Fuca. The vessel returned to Port Angeles without further problems.
� April 1989, Loss of power — The tanker Exxon Philadelphia lost power and was adrift off the mouth of the Strait of Juan de Fuca with a load of 23 million gallons of Alaska crude oil. Approximately five hours later, a tug reached the tanker and towed the ship to Port Angeles.
� April 1988, Grounding — The tanker Matsukaze grounded at Crescent Bay west of Port Angeles causing extensive damage to the vessel but no loss of product.
Oil Spills in Washington State: A Historical Analysis Page 45
1964
1969
Appendix 2 — Major Oil Spills and Related Legislative Action
� United Transportation Barge, Grays Harbor Co. (3/64) — 1,200,000 gallons diesel fuel
� Extensive oil spill legislation was passed in 1969-1972
1971� United Transportation Barge, Skagit Co. (4/71) — 230,000 gallons of diesel/gasoline
1972� General M.C. Meiggs (U.S. Navy), Clallam Co. (1/72) — 2,300,000 gallons of fuel oil
1973� Trans Mountain Pipeline, Whatcom Co. (1/73) — 460,000 gallons of crude oil
1983� Olympic Pipe Line Co., Allen Pump Station (9/83) — 168,000 gallons of diesel fuel
1984� Tanker SS Mobil Oil, Columbia River (3/84) — 200,000 gallons of fuel oil
1985� Olympic Pipe Line, King Co. (11/85) — 34,000 gallons of jet fuel � ARCO Anchorage, Port Angeles (12/85) — 239,000 gallons of crude oil
1986� Concurrent Legislative Resolution 19 established an oil spill advisory committee � Olympic Pipe Line, King Co. (5/86) — 70,000 gallons of oil
1988� Barge MCN#5 (Olympic Tug & Barge), Skagit Co. (1/88) — 70,000 gallons of heavy oil. � Nestucca Barge (Sause Towing), Grays Harbor Co. (12/88) — 231,000 gallons of fuel oil.
1989� HB 2242 — Established financial responsibility requirements for vessels. � SB 6701 — Washington State Maritime Commission (WSMC) established. � HB 1853 & 1854 — Natural Resource Damage Assessment methodology. � Exxon Valdez grounding, AK (3/89) — 11,000,000 gallons of crude oil. This spill resulted in
significant legislative changes in Washington, as well as other U.S. states and Canada.
Page 46 Oil Spills in Washington State: A Historical Analysis
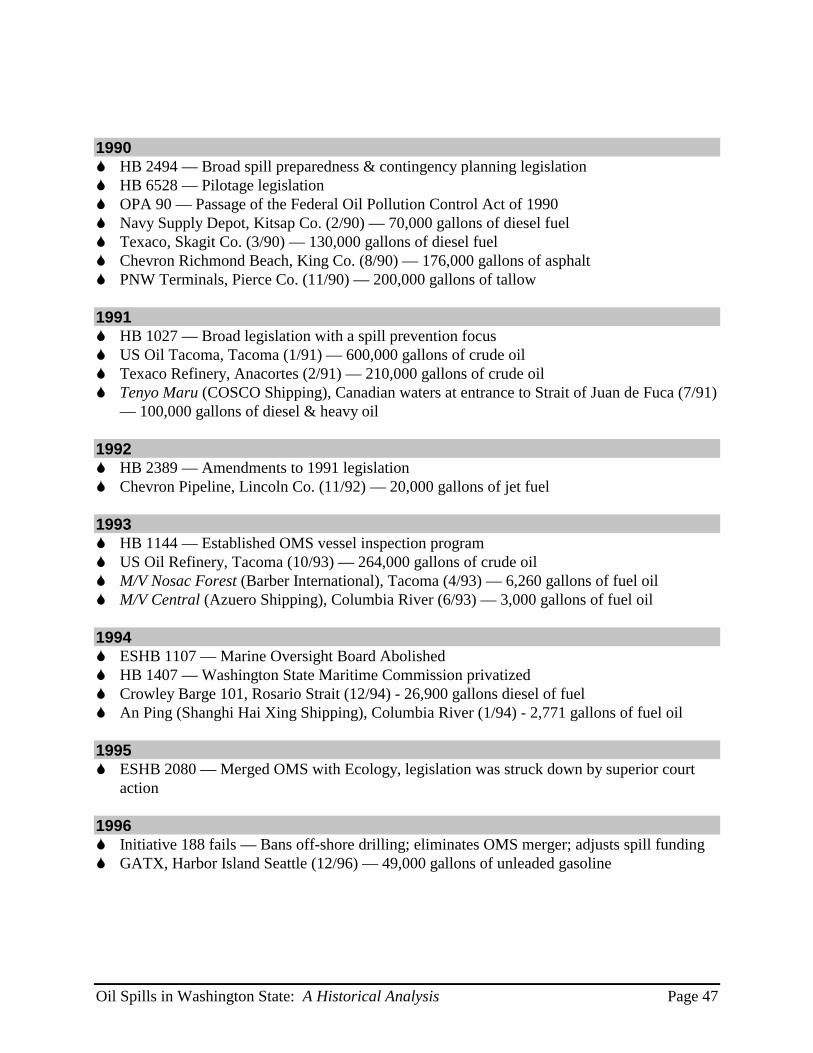
1990 � HB 2494 — Broad spill preparedness & contingency planning legislation � HB 6528 — Pilotage legislation � OPA 90 — Passage of the Federal Oil Pollution Control Act of 1990 � Navy Supply Depot, Kitsap Co. (2/90) — 70,000 gallons of diesel fuel � Texaco, Skagit Co. (3/90) — 130,000 gallons of diesel fuel � Chevron Richmond Beach, King Co. (8/90) — 176,000 gallons of asphalt � PNW Terminals, Pierce Co. (11/90) — 200,000 gallons of tallow
1991� HB 1027 — Broad legislation with a spill prevention focus � US Oil Tacoma, Tacoma (1/91) — 600,000 gallons of crude oil � Texaco Refinery, Anacortes (2/91) — 210,000 gallons of crude oil � Tenyo Maru (COSCO Shipping), Canadian waters at entrance to Strait of Juan de Fuca (7/91)
— 100,000 gallons of diesel & heavy oil
1992� HB 2389 — Amendments to 1991 legislation � Chevron Pipeline, Lincoln Co. (11/92) — 20,000 gallons of jet fuel
1993� HB 1144 — Established OMS vessel inspection program � US Oil Refinery, Tacoma (10/93) — 264,000 gallons of crude oil � M/V Nosac Forest (Barber International), Tacoma (4/93) — 6,260 gallons of fuel oil � M/V Central (Azuero Shipping), Columbia River (6/93) — 3,000 gallons of fuel oil
1994� ESHB 1107 — Marine Oversight Board Abolished � HB 1407 — Washington State Maritime Commission privatized � Crowley Barge 101, Rosario Strait (12/94) - 26,900 gallons diesel of fuel � An Ping (Shanghi Hai Xing Shipping), Columbia River (1/94) - 2,771 gallons of fuel oil
1995� ESHB 2080 — Merged OMS with Ecology, legislation was struck down by superior court
action
� Initiative 188 fails — Bans off-shore drilling; eliminates OMS merger; adjusts spill funding � GATX, Harbor Island Seattle (12/96) — 49,000 gallons of unleaded gasoline
Oil Spills in Washington State: A Historical Analysis Page 47
1996
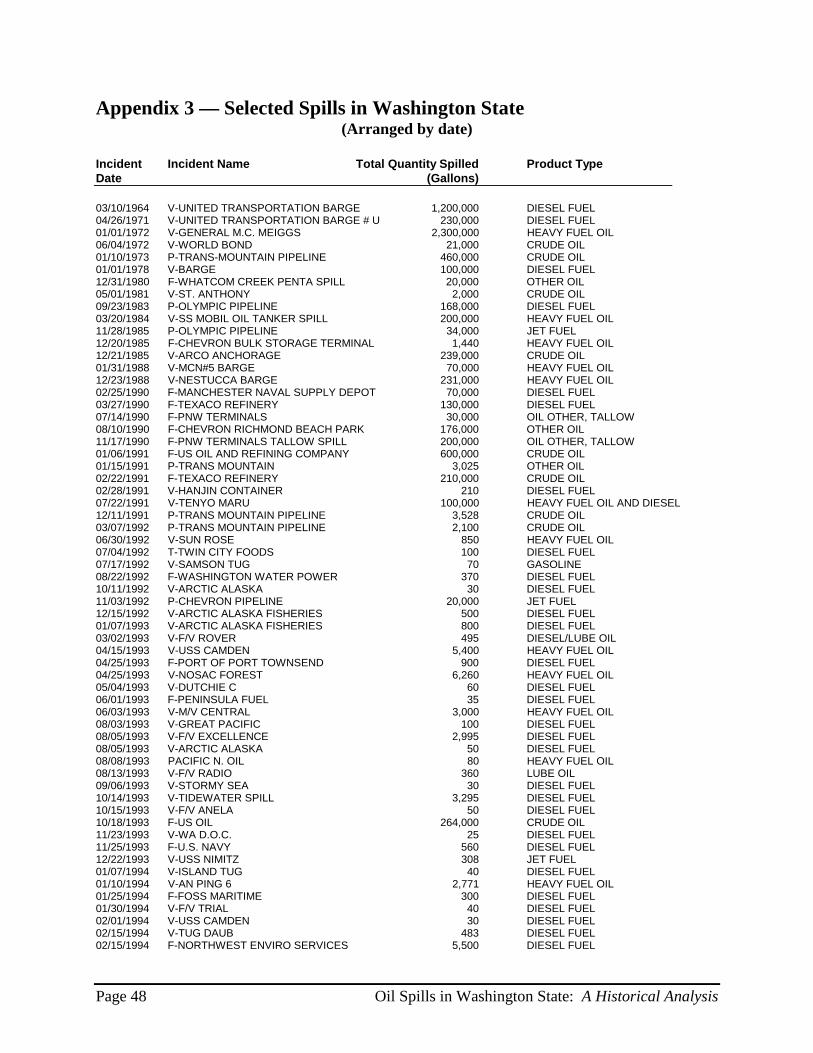
Appendix 3 — Selected Spills in Washington State (Arranged by date)
Incident Incident Name Total Quantity Spilled Product Type Date (Gallons)
03/10/1964 V-UNITED TRANSPORTATION BARGE 1,200,000 DIESEL FUEL 04/26/1971 V-UNITED TRANSPORTATION BARGE # U 230,000 DIESEL FUEL 01/01/1972 V-GENERAL M.C. MEIGGS 2,300,000 HEAVY FUEL OIL 06/04/1972 V-WORLD BOND 21,000 CRUDE OIL 01/10/1973 P-TRANS-MOUNTAIN PIPELINE 460,000 CRUDE OIL 01/01/1978 V-BARGE 100,000 DIESEL FUEL 12/31/1980 F-WHATCOM CREEK PENTA SPILL 20,000 OTHER OIL 05/01/1981 V-ST. ANTHONY 2,000 CRUDE OIL 09/23/1983 P-OLYMPIC PIPELINE 168,000 DIESEL FUEL 03/20/1984 V-SS MOBIL OIL TANKER SPILL 200,000 HEAVY FUEL OIL 11/28/1985 P-OLYMPIC PIPELINE 34,000 JET FUEL 12/20/1985 F-CHEVRON BULK STORAGE TERMINAL 1,440 HEAVY FUEL OIL 12/21/1985 V-ARCO ANCHORAGE 239,000 CRUDE OIL 01/31/1988 V-MCN#5 BARGE 70,000 HEAVY FUEL OIL 12/23/1988 V-NESTUCCA BARGE 231,000 HEAVY FUEL OIL 02/25/1990 F-MANCHESTER NAVAL SUPPLY DEPOT 70,000 DIESEL FUEL 03/27/1990 F-TEXACO REFINERY 130,000 DIESEL FUEL 07/14/1990 F-PNW TERMINALS 30,000 OIL OTHER, TALLOW 08/10/1990 F-CHEVRON RICHMOND BEACH PARK 176,000 OTHER OIL 11/17/1990 F-PNW TERMINALS TALLOW SPILL 200,000 OIL OTHER, TALLOW 01/06/1991 F-US OIL AND REFINING COMPANY 600,000 CRUDE OIL 01/15/1991 P-TRANS MOUNTAIN 3,025 OTHER OIL 02/22/1991 F-TEXACO REFINERY 210,000 CRUDE OIL 02/28/1991 V-HANJIN CONTAINER 210 DIESEL FUEL 07/22/1991 V-TENYO MARU 100,000 HEAVY FUEL OIL AND DIESEL 12/11/1991 P-TRANS MOUNTAIN PIPELINE 3,528 CRUDE OIL 03/07/1992 P-TRANS MOUNTAIN PIPELINE 2,100 CRUDE OIL 06/30/1992 V-SUN ROSE 850 HEAVY FUEL OIL 07/04/1992 T-TWIN CITY FOODS 100 DIESEL FUEL 07/17/1992 V-SAMSON TUG 70 GASOLINE 08/22/1992 F-WASHINGTON WATER POWER 370 DIESEL FUEL 10/11/1992 V-ARCTIC ALASKA 30 DIESEL FUEL 11/03/1992 P-CHEVRON PIPELINE 20,000 JET FUEL 12/15/1992 V-ARCTIC ALASKA FISHERIES 500 DIESEL FUEL 01/07/1993 V-ARCTIC ALASKA FISHERIES 800 DIESEL FUEL 03/02/1993 V-F/V ROVER 495 DIESEL/LUBE OIL 04/15/1993 V-USS CAMDEN 5,400 HEAVY FUEL OIL 04/25/1993 F-PORT OF PORT TOWNSEND 900 DIESEL FUEL 04/25/1993 V-NOSAC FOREST 6,260 HEAVY FUEL OIL 05/04/1993 V-DUTCHIE C 60 DIESEL FUEL 06/01/1993 F-PENINSULA FUEL 35 DIESEL FUEL 06/03/1993 V-M/V CENTRAL 3,000 HEAVY FUEL OIL 08/03/1993 V-GREAT PACIFIC 100 DIESEL FUEL 08/05/1993 V-F/V EXCELLENCE 2,995 DIESEL FUEL 08/05/1993 V-ARCTIC ALASKA 50 DIESEL FUEL 08/08/1993 PACIFIC N. OIL 80 HEAVY FUEL OIL 08/13/1993 V-F/V RADIO 360 LUBE OIL 09/06/1993 V-STORMY SEA 30 DIESEL FUEL 10/14/1993 V-TIDEWATER SPILL 3,295 DIESEL FUEL 10/15/1993 V-F/V ANELA 50 DIESEL FUEL 10/18/1993 F-US OIL 264,000 CRUDE OIL 11/23/1993 V-WA D.O.C. 25 DIESEL FUEL 11/25/1993 F-U.S. NAVY 560 DIESEL FUEL 12/22/1993 V-USS NIMITZ 308 JET FUEL 01/07/1994 V-ISLAND TUG 40 DIESEL FUEL 01/10/1994 V-AN PING 6 2,771 HEAVY FUEL OIL 01/25/1994 F-FOSS MARITIME 300 DIESEL FUEL 01/30/1994 V-F/V TRIAL 40 DIESEL FUEL 02/01/1994 V-USS CAMDEN 30 DIESEL FUEL 02/15/1994 V-TUG DAUB 483 DIESEL FUEL 02/15/1994 F-NORTHWEST ENVIRO SERVICES 5,500 DIESEL FUEL
Page 48 Oil Spills in Washington State: A Historical Analysis
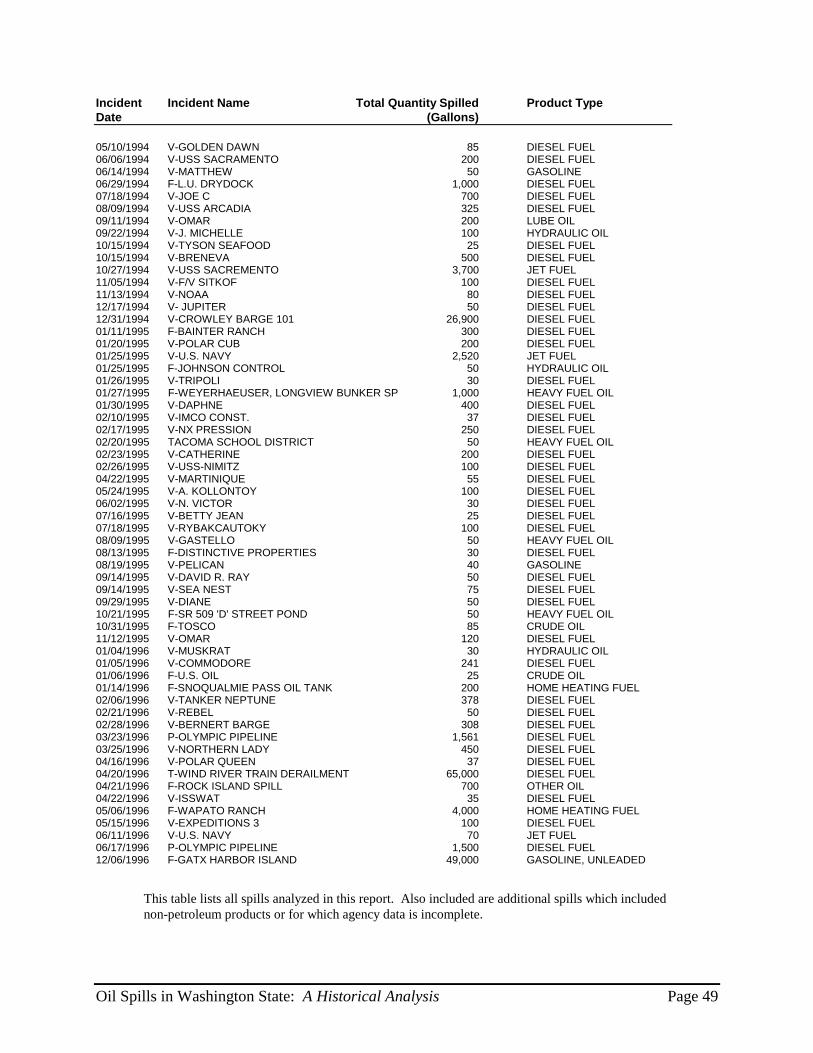
Incident Incident Name Total Quantity Spilled Product Type Date (Gallons)
05/10/1994 V-GOLDEN DAWN 85 DIESEL FUEL 06/06/1994 V-USS SACRAMENTO 200 DIESEL FUEL 06/14/1994 V-MATTHEW 50 GASOLINE 06/29/1994 F-L.U. DRYDOCK 1,000 DIESEL FUEL 07/18/1994 V-JOE C 700 DIESEL FUEL 08/09/1994 V-USS ARCADIA 325 DIESEL FUEL 09/11/1994 V-OMAR 200 LUBE OIL 09/22/1994 V-J. MICHELLE 100 HYDRAULIC OIL 10/15/1994 V-TYSON SEAFOOD 25 DIESEL FUEL 10/15/1994 V-BRENEVA 500 DIESEL FUEL 10/27/1994 V-USS SACREMENTO 3,700 JET FUEL 11/05/1994 V-F/V SITKOF 100 DIESEL FUEL 11/13/1994 V-NOAA 80 DIESEL FUEL 12/17/1994 V- JUPITER 50 DIESEL FUEL 12/31/1994 V-CROWLEY BARGE 101 26,900 DIESEL FUEL 01/11/1995 F-BAINTER RANCH 300 DIESEL FUEL 01/20/1995 V-POLAR CUB 200 DIESEL FUEL 01/25/1995 V-U.S. NAVY 2,520 JET FUEL 01/25/1995 F-JOHNSON CONTROL 50 HYDRAULIC OIL 01/26/1995 V-TRIPOLI 30 DIESEL FUEL 01/27/1995 F-WEYERHAEUSER, LONGVIEW BUNKER SP 1,000 HEAVY FUEL OIL 01/30/1995 V-DAPHNE 400 DIESEL FUEL 02/10/1995 V-IMCO CONST. 37 DIESEL FUEL 02/17/1995 V-NX PRESSION 250 DIESEL FUEL 02/20/1995 TACOMA SCHOOL DISTRICT 50 HEAVY FUEL OIL 02/23/1995 V-CATHERINE 200 DIESEL FUEL 02/26/1995 V-USS-NIMITZ 100 DIESEL FUEL 04/22/1995 V-MARTINIQUE 55 DIESEL FUEL 05/24/1995 V-A. KOLLONTOY 100 DIESEL FUEL 06/02/1995 V-N. VICTOR 30 DIESEL FUEL 07/16/1995 V-BETTY JEAN 25 DIESEL FUEL 07/18/1995 V-RYBAKCAUTOKY 100 DIESEL FUEL 08/09/1995 V-GASTELLO 50 HEAVY FUEL OIL 08/13/1995 F-DISTINCTIVE PROPERTIES 30 DIESEL FUEL 08/19/1995 V-PELICAN 40 GASOLINE 09/14/1995 V-DAVID R. RAY 50 DIESEL FUEL 09/14/1995 V-SEA NEST 75 DIESEL FUEL 09/29/1995 V-DIANE 50 DIESEL FUEL 10/21/1995 F-SR 509 'D' STREET POND 50 HEAVY FUEL OIL 10/31/1995 F-TOSCO 85 CRUDE OIL 11/12/1995 V-OMAR 120 DIESEL FUEL 01/04/1996 V-MUSKRAT 30 HYDRAULIC OIL 01/05/1996 V-COMMODORE 241 DIESEL FUEL 01/06/1996 F-U.S. OIL 25 CRUDE OIL 01/14/1996 F-SNOQUALMIE PASS OIL TANK 200 HOME HEATING FUEL 02/06/1996 V-TANKER NEPTUNE 378 DIESEL FUEL 02/21/1996 V-REBEL 50 DIESEL FUEL 02/28/1996 V-BERNERT BARGE 308 DIESEL FUEL 03/23/1996 P-OLYMPIC PIPELINE 1,561 DIESEL FUEL 03/25/1996 V-NORTHERN LADY 450 DIESEL FUEL 04/16/1996 V-POLAR QUEEN 37 DIESEL FUEL 04/20/1996 T-WIND RIVER TRAIN DERAILMENT 65,000 DIESEL FUEL 04/21/1996 F-ROCK ISLAND SPILL 700 OTHER OIL 04/22/1996 V-ISSWAT 35 DIESEL FUEL 05/06/1996 F-WAPATO RANCH 4,000 HOME HEATING FUEL 05/15/1996 V-EXPEDITIONS 3 100 DIESEL FUEL 06/11/1996 V-U.S. NAVY 70 JET FUEL 06/17/1996 P-OLYMPIC PIPELINE 1,500 DIESEL FUEL 12/06/1996 F-GATX HARBOR ISLAND 49,000 GASOLINE, UNLEADED
This table lists all spills analyzed in this report. Also included are additional spills which included non-petroleum products or for which agency data is incomplete.
Oil Spills in Washington State: A Historical Analysis Page 49
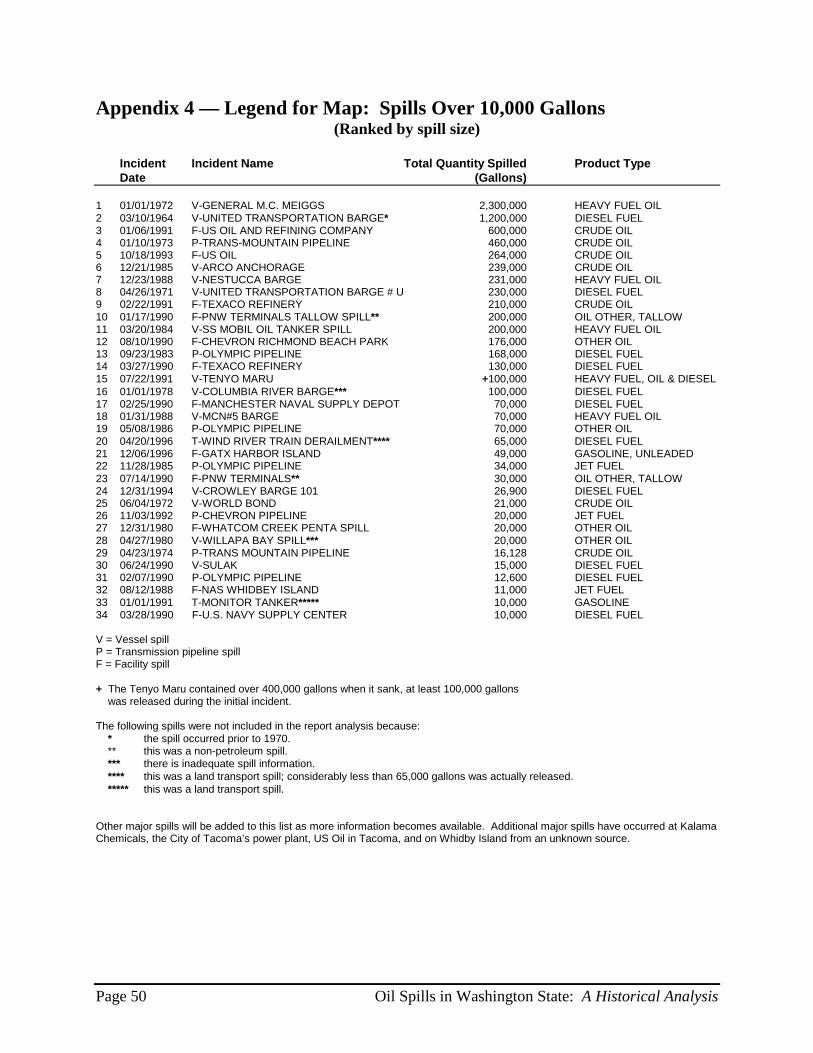
Appendix 4 — Legend for Map: Spills Over 10,000 Gallons (Ranked by spill size)
Incident Incident Name Total Quantity Spilled Product TypeDate (Gallons)
1 01/01/1972 V-GENERAL M.C. MEIGGS 2,300,000 HEAVY FUEL OIL 2 03/10/1964 V-UNITED TRANSPORTATION BARGE* 1,200,000 DIESEL FUEL 3 01/06/1991 F-US OIL AND REFINING COMPANY 600,000 CRUDE OIL 4 01/10/1973 P-TRANS-MOUNTAIN PIPELINE 460,000 CRUDE OIL 5 10/18/1993 F-US OIL 264,000 CRUDE OIL 6 12/21/1985 V-ARCO ANCHORAGE 239,000 CRUDE OIL 7 12/23/1988 V-NESTUCCA BARGE 231,000 HEAVY FUEL OIL 8 04/26/1971 V-UNITED TRANSPORTATION BARGE # U 230,000 DIESEL FUEL 9 02/22/1991 F-TEXACO REFINERY 210,000 CRUDE OIL 10 01/17/1990 F-PNW TERMINALS TALLOW SPILL** 200,000 OIL OTHER, TALLOW 11 03/20/1984 V-SS MOBIL OIL TANKER SPILL 200,000 HEAVY FUEL OIL 12 08/10/1990 F-CHEVRON RICHMOND BEACH PARK 176,000 OTHER OIL 13 09/23/1983 P-OLYMPIC PIPELINE 168,000 DIESEL FUEL 14 03/27/1990 F-TEXACO REFINERY 130,000 DIESEL FUEL 15 07/22/1991 V-TENYO MARU +100,000 HEAVY FUEL, OIL & DIESEL 16 01/01/1978 V-COLUMBIA RIVER BARGE*** 100,000 DIESEL FUEL 17 02/25/1990 F-MANCHESTER NAVAL SUPPLY DEPOT 70,000 DIESEL FUEL 18 01/31/1988 V-MCN#5 BARGE 70,000 HEAVY FUEL OIL 19 05/08/1986 P-OLYMPIC PIPELINE 70,000 OTHER OIL 20 04/20/1996 T-WIND RIVER TRAIN DERAILMENT**** 65,000 DIESEL FUEL 21 12/06/1996 F-GATX HARBOR ISLAND 49,000 GASOLINE, UNLEADED 22 11/28/1985 P-OLYMPIC PIPELINE 34,000 JET FUEL 23 07/14/1990 F-PNW TERMINALS** 30,000 OIL OTHER, TALLOW 24 12/31/1994 V-CROWLEY BARGE 101 26,900 DIESEL FUEL 25 06/04/1972 V-WORLD BOND 21,000 CRUDE OIL 26 11/03/1992 P-CHEVRON PIPELINE 20,000 JET FUEL 27 12/31/1980 F-WHATCOM CREEK PENTA SPILL 20,000 OTHER OIL 28 04/27/1980 V-WILLAPA BAY SPILL*** 20,000 OTHER OIL 29 04/23/1974 P-TRANS MOUNTAIN PIPELINE 16,128 CRUDE OIL 30 06/24/1990 V-SULAK 15,000 DIESEL FUEL 31 02/07/1990 P-OLYMPIC PIPELINE 12,600 DIESEL FUEL 32 08/12/1988 F-NAS WHIDBEY ISLAND 11,000 JET FUEL 33 01/01/1991 T-MONITOR TANKER***** 10,000 GASOLINE 34 03/28/1990 F-U.S. NAVY SUPPLY CENTER 10,000 DIESEL FUEL
V = Vessel spill P = Transmission pipeline spill F = Facility spill
+ The Tenyo Maru contained over 400,000 gallons when it sank, at least 100,000 gallons was released during the initial incident.
The following spills were not included in the report analysis because: * the spill occurred prior to 1970.** this was a non-petroleum spill.*** there is inadequate spill information.**** this was a land transport spill; considerably less than 65,000 gallons was actually released.***** this was a land transport spill.
Other major spills will be added to this list as more information becomes available. Additional major spills have occurred at Kalama Chemicals, the City of Tacoma’s power plant, US Oil in Tacoma, and on Whidby Island from an unknown source.
Page 50 Oil Spills in Washington State: A Historical Analysis
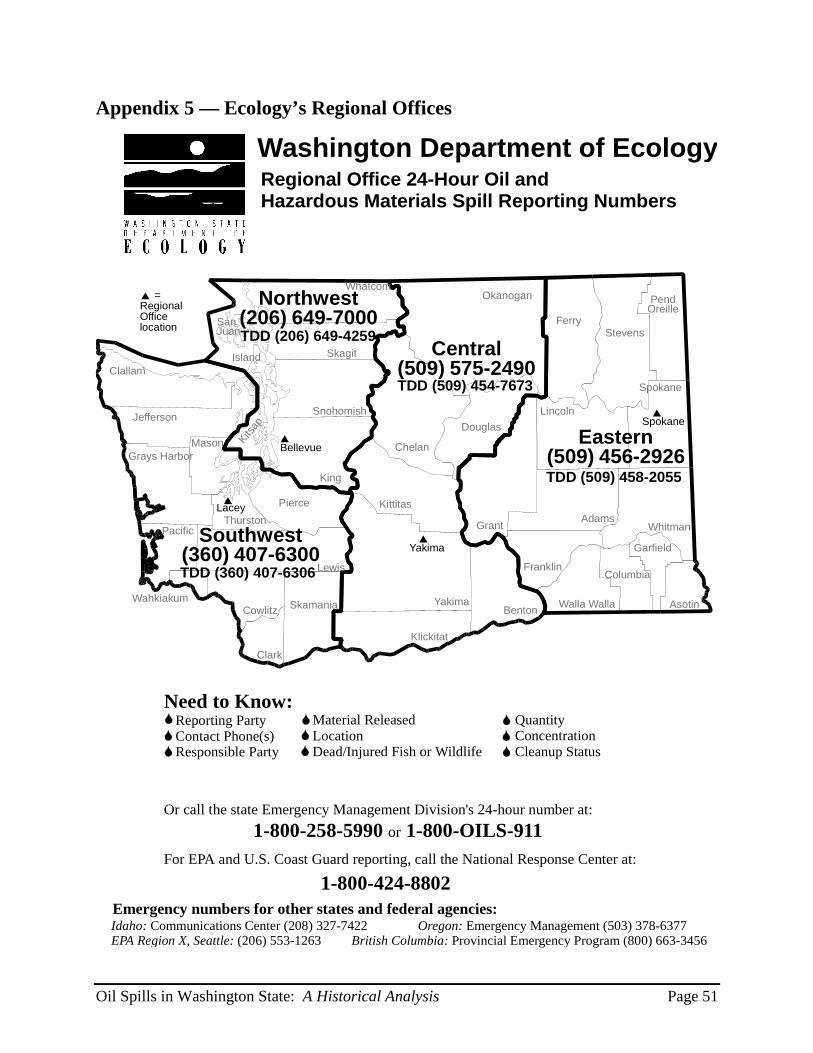
Appendix 5 — Ecology’s Regional Offices
Washington Department of Ecology Regional Office 24-Hour Oil andHazardous Materials Spill Reporting Numbers
San Juan
Clallam
Jefferson
Grays Harbor Mason
Thurston Pacific
Wahkiakum Cowlitz
Clark
Skamania
Lewis
Pierce
King
Skagit
Snohomish
Okanogan
Chelan
Douglas
Kittitas
Yakima
Klickitat
Franklin
Grant Adams Whitman
Lincoln
Spokane
Ferry Stevens
Pend Oreille
Island
Benton Walla Walla
Columbia
Garfield
Asotin
Kitsap
Spokane
Lacey
Yakima
Bellevue
= RegionalOffice location
WhatcomNorthwest
(206) 649-7000TDD (206) 649-4259 Central
(509) 575-2490TDD (509) 454-7673
Eastern (509) 456-2926TDD (509) 458-2055
Southwest (360) 407-6300TDD (360) 407-6306
Need to Know: Reporting Party Contact Phone(s) Responsible Party
Material Released Quantity Location Concentration Dead/Injured Fish or Wildlife Cleanup Status
Or call the state Emergency Management Division's 24-hour number at:1-800-258-5990 or 1-800-OILS-911
For EPA and U.S. Coast Guard reporting, call the National Response Center at:
1-800-424-8802 Emergency numbers for other states and federal agencies: Idaho: Communications Center (208) 327-7422 Oregon: Emergency Management (503) 378-6377 EPA Region X, Seattle: (206) 553-1263 British Columbia: Provincial Emergency Program (800) 663-3456
Oil Spills in Washington State: A Historical Analysis Page 51
Top Related