


Languages
Pages
Legal

Policy Research Working Paper 6063
Pharmaceutical Patents and Prices
A Preliminary Empirical Assessment Using Data from India
Mark Duggan Aparajita Goyal
The World BankDevelopment EconomicsResearch Support UnitMay 2012
WPS6063P
ublic
Dis
clos
ure
Aut
horiz
edP
ublic
Dis
clos
ure
Aut
horiz
edP
ublic
Dis
clos
ure
Aut
horiz
edP
ublic
Dis
clos
ure
Aut
horiz
edP
ublic
Dis
clos
ure
Aut
horiz
edP
ublic
Dis
clos
ure
Aut
horiz
edP
ublic
Dis
clos
ure
Aut
horiz
edP
ublic
Dis
clos
ure
Aut
horiz
ed
Produced by the Research Support Team
Abstract
The Policy Research Working Paper Series disseminates the findings of work in progress to encourage the exchange of ideas about development issues. An objective of the series is to get the findings out quickly, even if the presentations are less than fully polished. The papers carry the names of the authors and should be cited accordingly. The findings, interpretations, and conclusions expressed in this paper are entirely those of the authors. They do not necessarily represent the views of the International Bank for Reconstruction and Development/World Bank and its affiliated organizations, or those of the Executive Directors of the World Bank or the governments they represent.
Policy Research Working Paper 6063
The enforcement of stringent intellectual property rights in the pharmaceutical sector of developing countries generates considerable controversy, due to both the extensive research investment and the public policy importance of this sector. This paper explores the likely effects of enforcing product patents on prices and utilization of drugs in the Central Nervous System market in India. The Central Nervous System segment is the second largest therapeutic category in terms of retail sales in the world and is one of the fastest growing
This paper is a product of the Research Support Unit, Development Economics. It is part of a larger effort by the World Bank to provide open access to its research and make a contribution to development policy discussions around the world. Policy Research Working Papers are also posted on the Web at http://econ.worldbank.org. The author may be contacted at [email protected].
segments in India. Using information on product patents granted by the government and panel data on pharmaceutical prices and utilization from 2003–2008, the paper finds limited evidence of overall price increase following the introduction of product patents. However, there appear to be heterogeneous effects on prices by the type of product patent granted on drugs, implying the need for a careful examination of the product patent portfolio.
Pharmaceutical Patents and Prices:
A Preliminary Empirical Assessment Using Data from India
Mark Duggan and Aparajita Goyal
JEL: O31, 034, L24, L43, I18
Keywords: Intellectual Property Rights, Technological Innovation, Patents,
Pharmaceutical Industry
We are extremely grateful to Pete Lanjouw for bequeathing Jenny Lanjouw’s background material on
India’s pharmaceutical industry to us, and to Daniel Lederman for help in obtaining the proprietary data
from IMS Health. Thanks to a number of Intellectual property rights lawyers and industry experts, in
particular Tahir Amin, Ramesh Adige, Usha Rao, Manoj Kamra, Sudip Chaudhuri, Jayashree Watal for
explaining the institutional details of the pharmaceutical market and legal implications of TRIPs reform
in India. Funding from the World Bank Research Support Budget, and the World Bank executed Trust
Fund on Trade is gratefully acknowledged. The views expressed in this paper are those of the authors and
do not necessarily reflect those of the World Bank, its Board of Directors, or the countries they represent.
Contact: Aparajita Goyal at World Bank, 1818 H Street, NW, Washington, DC 20433, Email:
[email protected]; Mark Duggan at the Wharton School of the University of Pennsylvania, 3620
Locust Walk, Philadelphia, PA 19104, Email: [email protected]
2
I. Introduction
Government policy towards the pharmaceutical sector differs significantly both across
countries and within individual countries over time. Such policies potentially affect
innovation incentives as well as the utilization of available treatments. While there has
been considerable work on policies affecting the pharmaceutical sector in the U.S. and
other industrialized countries, relatively little empirical work has been done on
developing countries, which is surprising given the profound changes affecting the
pharmaceutical market in developing countries in recent years.
One type of policy that has recently been implemented in India, China, and Brazil, and
is currently being considered in many African countries, is an increase in patent
enforcement. Throughout the 1970s, 1980s, and 1990s in India, for example, patents
were issued on the process of manufacturing a product, rather than on the product itself.
This meant that a slight modification in the synthesis of a molecule yielded a new
patent and thus allowed several firms to produce essentially the same drug, implying
that generic firms could essentially reverse-engineer a product by slightly changing the
production process. Indeed, copies of global brands like Pfizer's top-selling cholesterol
drug Lipitor and Eli Lilly’s popular anti-depressant drug Prozac were manufactured and
sold in India by generic firms within two years of being introduced in the United States.
The policy controversy over the impact of stronger intellectual property rights (IPRs) in
developing countries is stark. A weak IPR regime might benefit developing countries
by allowing domestic firms to imitate foreign technologies to enhance access to
pharmaceuticals (Fink and Maskus 2004). On the other hand, it would reduce
incentives for R&D investments on drugs that could differentially benefit developing
countries (Arora, Branstetter and Chatterjee 2008). Perhaps partly because of this latter
point, the World Trade Organization (WTO) recently started to require member
countries to change their enforcement of patents. The implementation of the Uruguay
Round agreement in 1995 entailed the implementation of a system of product patents
and legal protection to all Trade-Related Intellectual Property Rights (TRIPs), including
pharmaceuticals. As a result, beginning in January of 2005, firms in India (and China
and Brazil from 2002 and 1997, respectively) could no longer reverse-engineer
patented products.
The debate about the merits of TRIPs implementation has been contentious in the
economics literature as well. On the one hand, patent enforcement is likely to lead to
higher prices of drugs, which might lower utilization and adversely affect health.
Several recent academic papers have echoed these concerns, using theory and empirics
to forecast the potential welfare losses affecting current and future consumers,
especially in countries like India, through higher drug prices (Dutta 2010, Chaudhuri,
Goldberg, and Jia 2006, McCalman 2001, Cockburn and Lanjouw 2001). On the other
hand, prices may not rise if most drugs affected by the patent reform have therapeutic
substitutes and thus face substantial competition from other products. In addition, the
innovator patent holder might be somewhat more efficient at production than generic
3
imitators, and thus their lower costs might to some extent offset the market power
effect.
In this paper, we explore the effects of introducing product patents for one particular
therapeutic segment of the Indian pharmaceutical market - the market for CNS (Central
Nervous System) drugs. The CNS market is the second largest therapeutic category in
terms of retail sales in the world and is one of the fastest growing segments in India
(Goldberg 2006). We use proprietary data on pharmaceutical sales in India1 from 2003
to 2008, and link these data on when product patents were granted. We differentiate
between two types of product patents. As described by Hemphill and Sampat (2010), a
product patent claiming the active ingredient is generally the strongest and is likely to
prevent any use of the same drug. In contrast, ancillary patents on chemical variants,
alternative formulations, delivery systems, and relatively minor aspects of the drug may
not exclude generic entry, since a local manufacturer may be able to employ a different,
non-infringing mechanism for accomplishing a similar incremental drug innovation.
Our identification strategy exploits the differential timing of product patents across
drugs during the 2003 to 2008 time period. Our key identifying assumption is that the
timing of the patents is not correlated with other unobserved factors that might affect
the price and utilization of the drug. Our findings suggest that the introduction of
product patents was associated with a significant increase in the share of total quantity
sold by the innovator, especially for patents granted to the drug compound. The share
did not increase to 100 percent in most cases because innovator firms could still grant
voluntary licenses to generic firms to manufacture and sell their products. We also find
an increase in average prices after the introduction of stronger product patents, although
there is no detectable significant effect on utilization. The analysis underscores the
importance of investigating the type of product patent granted by the government.
The findings contribute to the growing theoretical and empirical work on the effect of
patent policies on the pharmaceutical industry. For instance, price responses to generic
entry in the markets for generics and brand-name drugs that have lost patent protection
in the United States have been studied by Caves et al. (1991), Grabowski and Vernon
(1996), Frank and Salkever (1997), Berndt (2002), Wiggins and Maness (2004), Reifan
and Ward (2005), Ellison and Ellison (2007), who find that market entry by generics
resulted in heterogeneous responses in price based on the segmentation of the
pharmaceutical market.
Several studies have also used explicit models of consumer and firm behavior to
simulate the welfare losses implied by patent protection in developing countries (Challu
(1991), Fink (2000), Maskus and Konan (1994), Nogues (1993), Subramanian (1995),
Watal (2000)). The paper most relevant to our study is by Chaudhuri, Goldberg and Jia
(2006) who analyzed the effects of patent enforcement for a sub-segment of antibiotics
in India using a structural approach to compute own and cross-price elasticities of
demand as well as the marginal costs of production. While their findings (and the
findings in previous literature) are ultimately limited by the fact that the potential
1 This data is similar to the data used for the U.S. market in Duggan and Scott Morton (2010).
4
impact of patents is simulated using estimates of demand characteristics and market
structure from other settings, the model yields important welfare predictions that can be
tested using the data at hand. The fact that we now have access to data on actual
pharmaceutical product patents granted by the Government of India gives us the
opportunity to examine empirically the impact of product patents on pharmaceutical
prices and utilization. The purpose of this paper is to provoke discussion on some of the
preliminary findings from using these data. In forthcoming work we extend the analysis
to all therapeutic segments of the Indian pharmaceutical market, and explore in greater
detail heterogeneous effects by sub-therapeutic segments and welfare implications
using the demand and supply parameters estimated by Chaudhuri, Goldberg, Jia (2006)
for the Indian pharmaceutical market.
The rest of the paper is organized as follows. Section II provides background on the
evolution of India’s pharmaceutical industry and the details of the TRIPs reform. The
data and findings are discussed in Section III, and Section IV concludes.
II. Background
A. Evolution of India’s Pharmaceutical Industry
The development of the Indian pharmaceutical industry was shaped by the introduction
of the Patents Act of 1970. Before the enactment of the Patents Act, the Indian
pharmaceutical market was dominated by western multinational corporations that
controlled over 75 percent of the market, primarily through imported drugs.2 Almost all
of the pharmaceutical products under patent in India at the time were held by foreign
companies and domestic drug prices were among the highest in the world (Chaudhuri
2005).3 The situation changed substantially with the passage of the 1970 Patents Act.
An important feature of the Act was the special provision relating to drugs (as well as
agricultural chemicals and food products) that could be patented only for a new method
or process of manufacture and not the product itself.4 This meant that a slight
modification in the synthesis of a molecule was patentable and allowed several firms to
produce essentially the same product. Furthermore, the Act provided only seven years
of process patent protection for pharmaceuticals, about half of the average fifteen years
required to develop and test a new drug. The complete elimination of product patent
2 Many western multinational corporations like Merck, Pfizer, and Bayer entered the Indian market in
1950s not to initiate manufacturing but to distribute and sell imported products. See Chaudhuri (2005) for
a historical account of the Indian pharmaceutical industry. 3 The process of drug manufacturing has two interlinked components: bulk drug production that is
production of active ingredients present in the drugs and second, formulation production, that is
processing of bulk drugs into finished dosage forms such as tablets, capsules, ointments. India was
dependent on imports of a majority of the essential bulk drugs. Manufacturing by western multinational
corporations was primarily restricted to processing of imported bulk drugs into formulations and not
necessarily the production of bulk drugs itself. 4 The Indian Patents Act (1970), which replaced the inherited British colonial law regarding intellectual
property rights, specifically excluded pharmaceutical product patents and only admitted process patents
for a period of seven years.
5
protection, the provision that only one process could be patented by an applicant and
the shorter protection period of just seven years, all encouraged generic drug
development in India. The result was more than three decades of reverse engineering of
'on patent' products, and a flourishing domestic generics market.5 Most foreign
pharmaceutical manufacturers abandoned the Indian market altogether due to the
absence of legal mechanisms to protect their patented products and local firms were
quick to respond to the favorable provisions created by the 1970 Patents Act.
Over the last forty years the Indian pharmaceutical industry grew rapidly to the point
where its annual revenues are currently valued at $21.8 billion and is the third largest in
the world in terms of production volume (behind U.S. and Japan). The structure of the
industry also evolved. In 1970, the industry was dominated by multinational
subsidiaries; by 2001, Indian-owned firms were not just the leading players in the
industry, many had also become major exporters (Chaudhuri, Goldberg, and Jia 2006).6
India’s entry into the World Trade Organization (WTO) in 1994 necessitated significant
changes in its patent regime. Under the Agreement on Trade-Related Aspects of
Intellectual Property (TRIPS), member states of the WTO were required to implement
minimum levels of intellectual property protection. 7
These include providing for
product and process patents in all fields of technology, including pharmaceuticals, with
a minimum patent term of 20 years.8 Although TRIPS came into force on 1 January
1995, developing countries such as India were granted a transition period of five years
to implement the provisions of TRIPS. In addition, if a country did not provide product
patent protection in any field when TRIPS came into force (such as in the case of agro-
chemicals, food and drugs in India), then an additional five years were granted. The
provision was designed to give developing countries time to adapt their patent systems
and patent offices to the post-TRIPs world. During this 10 year transition period (from
1 January 1995 to 1 January 2005) to implement the new policy, India introduced a
5 The two stated objectives of the 1970 act were: the development of an indigenous pharmaceuticals
industry; and the provision of low-cost access to medicines for Indian consumers. Consistent with these
objectives, and with the broader leftward tilt in policy, a number of other measures were introduced–drug
price controls, restrictions on capacity expansion, limits on multinational equity shares that kept
pharmaceutical prices low, and encouraged the development of the Indian pharmaceutical industry
(Chaudhuri, Goldberg, and Jia 2006). 6 Moreover, Indian companies account for over 70 percent of drugs sold in the country, making India one
of the few countries in the world achieving self-sufficiency in drugs, and an important supplier of certain
product segments that treat diseases prevalent in less regulated markets of Africa, Asia and Latin
America, most notably vaccines and ARVs. 7 TRIPS aims at establishing strong minimum standards for intellectual property rights. Apart from
patents, intellectual property includes copyrights, trademarks, geographical indications, industrial
designs, integrated circuits, trade secrets. The protection of IPRs is binding and legally enforceable.
TRIPs has three broad components, the first (Parts I and II, Articles 1-40) set out the goals, objectives
and standards of IPRs. The second component (Parts III, IV, and V, Articles 41–61) deals with the
mechanisms of enforcement of IPRs. The third component (Parts VI and VII, Articles 65–73) focuses on
the specific needs of developing countries, such as transitional arrangements, technology transfers and
technical cooperation, and institutional arrangements for monitoring and review. The text of TRIPS is
available at: www.wto.org. 8 Least developed countries (LDCs) are not required to implement patents for pharmaceuticals
until 2016.
6
facility ('mailbox') to receive and hold patent applications in the field of
pharmaceuticals (and agricultural chemicals), which were examined beginning 1
January 2005. Thus, product patent protection in all fields, including pharmaceuticals,
began in India from January 1, 2005.9
B. Important Provisions Relating to TRIPS Compliance
Due to the absence of product patent protection in pharmaceuticals under the Patent Act
of 1970, the Indian generic companies could reverse engineer to produce and market in
India any new drug developed abroad. For example, copies of global brands like
Pfizer's top-selling cholesterol drug Lipitor (active ingredient-Atrovastatin) and Eli
Lilly’s popular anti-depressant drug Prozac (active ingredient-Fluoxetine) were
manufactured and sold in India by generic producers within two years of being
introduced in the United States. The absence of any restriction on the entry of firms
resulted in a competitive market structure with low prices. Policymakers anticipated
that with the introduction of full product patent protection in pharmaceuticals from 1
January, 2005, as the generic companies are prevented from introducing new drugs, the
decrease in competition would result in higher prices and thus lower utilization of
pharmaceutical treatments.
TRIPS, however, provides opportunities to developing countries to tackle such
consequences of product patent protection. For instance, countries are permitted some
flexibility in determining what an invention is and in deciding their own standards of
patentability.10
Indeed, the two important instruments available with the Indian
government to regulate prices are (i) to use the flexibilities provided under TRIPs and
(ii) price controls. For instance, the Patents Amendment Act of 2005 (the TRIPS
consistent Indian patent law) limits recourse to ancillary patents on chemical variants,
alternative formulations, delivery systems, and relatively minor aspects of the drug
unless these incremental innovations demonstrate an increased level of effectiveness (as
stated in section 3(d) of the Act).11
This type of provision finds no parallel in any other
9 It is important to note that exclusive marketing rights (EMRs) could be obtained during this transition
period for a particular application if a product patent had been granted in some other WTO member
country and the application has not been rejected in the country as not being an invention. The term EMR
means the exclusive marketing rights to sell or distribute the article or substance covered in a patent or
patent application in the country. Only four EMRs were ever granted by the Indian patent office. EMR
was granted to Novartis for blood anti-cancer medicine, Glivec/Gleevec (beta crystalline form of
imatinib mesylate); to Eli Lilly for erectile dysfunction medicine, Cialis (Tadalafil); to Wockhardt for
'Nadifloxacin' under the brand name Nadoxin, and to United Phosphorus for 'fungicide saaf, a
combination of carbendazim and mancozeb. Upon acquiring EMR, the applicant has the exclusive right
to sell or distribute the product of the invention for a period of five years or till the date of grant or
rejection of the patent application, whichever is earlier. No EMR was granted to any CNS drug. 10
Thus an invention that has been patented under the laws of one country may not be considered
patentable in another country. 11
It is made explicit in the 2005 Act (section 3(d)) that 'The mere discovery of new form of a known
substance which does not result in the enhancement of the known efficacy of that substance or the mere
discovery of any new property or new use for a known substance or the mere use of a known process,
machine or apparatus unless such known process results in a new product or employs at least one new
reactant.' will be prohibited to receive product patents.
7
patent legislation in the world, and was intended as a response to concerns over patents
that extend the total duration of protection for a drug beyond the protection offered by
the basic patent claiming the active ingredient. 12
Despite its official patent standards, the Indian Patent Office is in fact granting
numerous product patents on incremental innovation that do not meet the efficacy
requirement. 13
In recent work, Sampat (2010) argues based on aggregate data on
pharmaceutical patent applications and grants in India, that section 3(d) requirements of
India’s patent law, which limits patents on incremental pharmaceutical innovations, is
often ignored, and the standards of patentability, however high, are not implemented in
practice.
It is worth noting that some patents are more likely to exclude generic entry than others.
As described by Hemphill and Sampat (2010), a product patent claiming the active
ingredient – basic patents that cover the drug compound are generally the strongest and
will most likely prevent any use of the same drug. In comparison to patents on active
ingredient, patents for a particular formulation (or chemical variants) such as a
sustained release version of the drug may not exclude generic entry since a local
manufacturer may be able to employ a different, non-infringing mechanism for
accomplishing the sustained release of the drug.
Some of the other major flexibilities under TRIPS that are available in the Indian patent
law are provisions relating to Bolar Exemption14
and parallel imports15
. Compulsory
licensing and government use authorizations are also options that are permitted under
12
Developed countries, for example USA, follow very liberal patent standards. Patents are granted not
only for new chemical entities (NCEs) involved in the new drugs but secondary patents can also be taken
for new formulations, new combinations and new uses of existing NCEs even if these new products
provide no clinical benefits (Chaudhuri 2005). Moreover since the secondary patents can be taken later
and would be valid even after the expiry of the patents on NCEs, this could extend the patent life beyond
20 years thereby delaying the entry of generics. 13
The section 3(d) provision has been the most controversial clause of the Indian Patent Act of 2005 and
litigation has already ensued over this provision. India's new patent regime provides for both ex ante and
ex post opposition procedures that could be based on any patentability criteria that can be challenged,
including the lack of novelty, inventive step, utility, non-eligible subject matter, the failure to disclose the
source of biological material used for the invention, and inventions which are considered traditional
knowledge. On the one hand, this procedure is likely to lengthen the patent prosecution process and make
the outcome more unpredictable. On the other hand, Indian generic pharmaceutical manufacturers
favored retention of litigation mechanisms in the new Patents Act to prevent ever greening, and thus far
generics have strategically used the procedure frequently. Decisions on recent pharmaceutical pre and
post grant opposition cases can be found at http://www.i-mak.org/pharma-patent-decisions/. 14
Under section 107A(a) of the 2005 Patents Act, use of a patent for development and submission of
information for regulatory approval will not be considered as an infringement of the patent right. Thus in
the new patent regime, as innovator companies introduce new drugs in India and enjoy exclusive patent
rights, such Bolar provisions can be used to introduce generics immediately after the expiry of patents. 15
Under section 107A(b) 2005 Patents Act, importation of patented products by any person from a
person who is duly authorized by the patentee to sell or distribute the product, shall not be considered as
an infringement of patent rights. This clause effectively permits parallel imports.
8
the TRIPS Agreement and that are available in the Indian patent laws, but the
implementation of these provisions has not yet taken place.16
In addition, price controls administered by the Government of India are usually cited as
another channel that could dampen the effect of product patents on prices. The Indian
government currently controls the price of only 74 commonly used drugs, representing
approximately 8 percent of the pharmaceutical market (Government of India 2010).17
III. Data and Findings
To estimate the impact of product patent enforcement on our outcome variables of
interest, we begin by merging together data from two sources. The first main source of
data was obtained from IMS Health and contains proprietary data on total sales
(excluding those to hospitals and long-term care facilities) in India for all CNS products
in each quarter from 2003 to 2008. According to IMS, these data covered 85 percent of
all pharmaceutical sales in the country during this time period. The data also contains
the number of doses (standardized units) of the product that were sold in each quarter.
This allows us to calculate the average price per dose in each quarter for each product.18
Pharmaceutical products are available in multiple presentations, such as dosage forms
(capsule, tablet, syrup, etc.), and strength (10 milligrams, 50 milligrams, etc.). In
calculating prices, we aggregate sales and quantities for all versions of the same drug in
each quarter.19
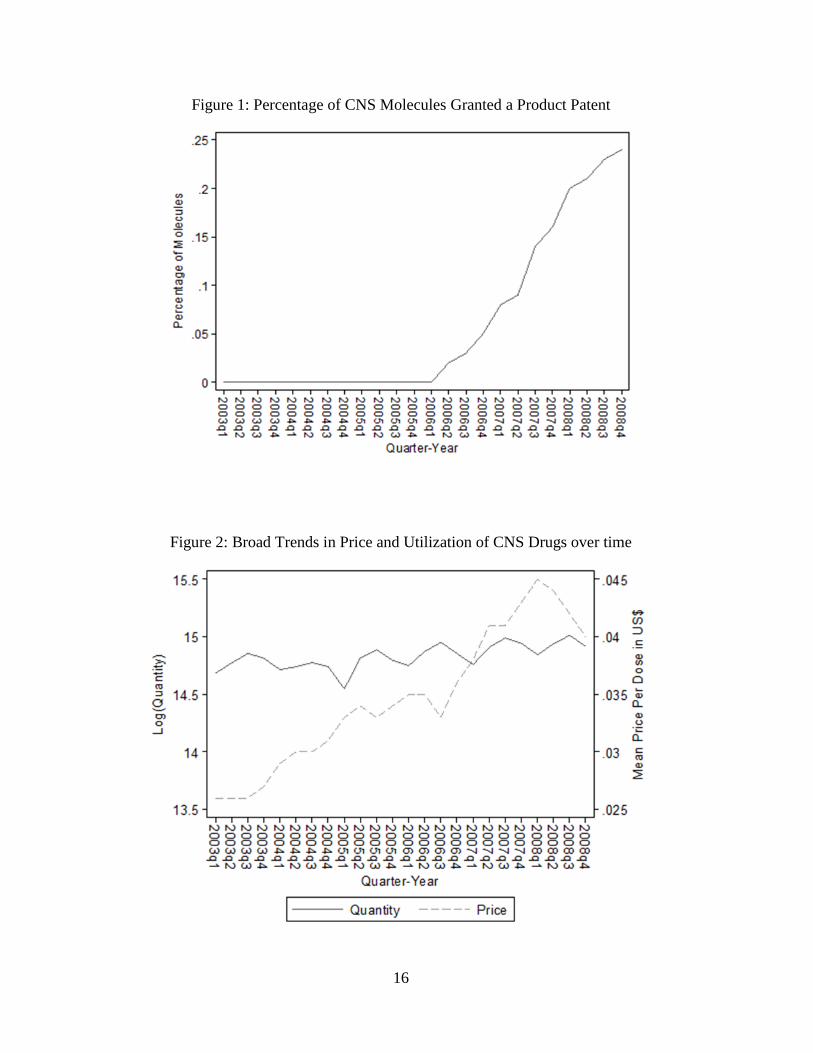
The CNS market is the second largest therapeutic category in the world in terms of
retail sales and is one of the fastest growing. Figure 2 shows the quarterly trend in mean
price and total quantity of all drugs within the CNS therapeutic category in our sample.
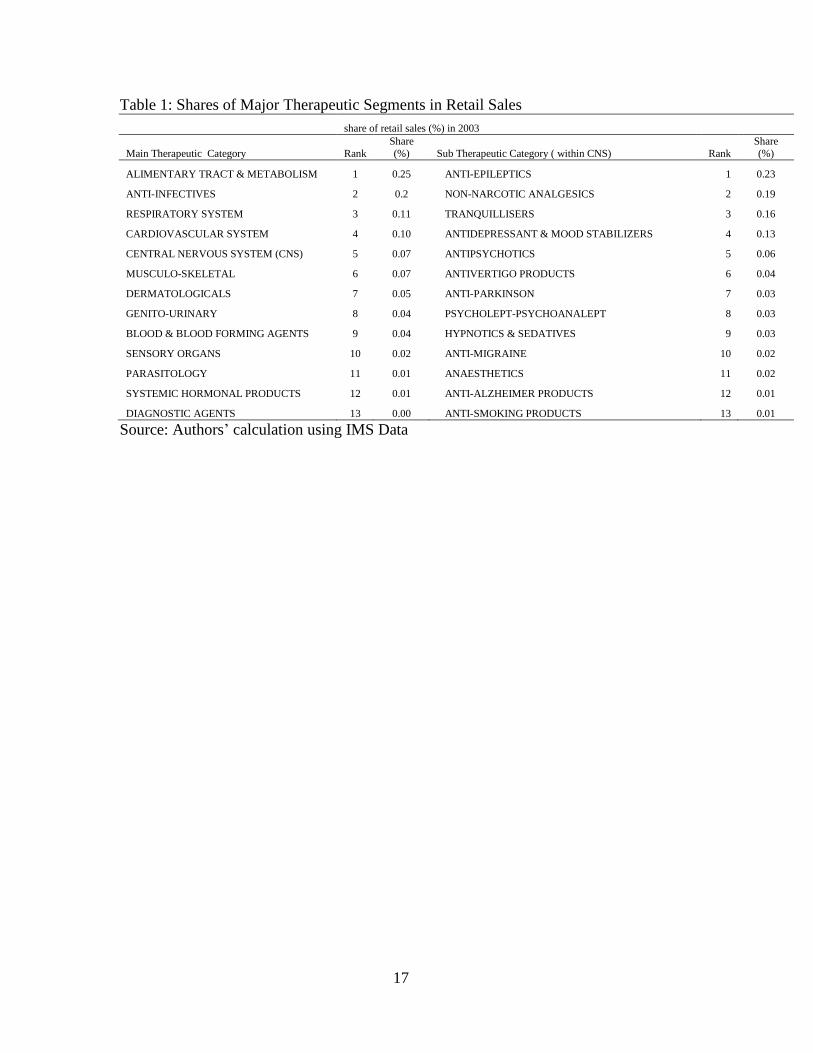
Within this market, the largest segment of sales are for anti-depressants, antipsychotics,
anti-epileptics, sleep disorders, attention deficit disorders, and Alzheimer’s disease (see
Table 1). Many of the new products developed by pharmaceutical companies these days
are life quality enhancing drugs such as anti-depressants and are likely to be affected by
product patents. Although, this segment accounted for about 7% of the total retail
16
Compulsory Licensing refers to ―use without authorization of the patent holder‖, and includes use by
third parties and use by the government in situations of national or extreme emergency, and public non-
commercial use. No compulsory licenses have yet been issued in India under the amended Patents Act
(personal communication with Patent officer in the Delhi Patent office). 17
The details of the procedures for price fixation can be found in the official government website:
http://www.nppaindia.nic.in/index1.html, under the link ―Drug Price Control Order 1995‖. 18
Note that the prices we use in our estimation are not the posted prices at the drugstore but the revenues
of each drug divided by units sold from invoice data. 19
These data are available from the retail pharmacy audits undertaken by IMS Health, the best known
market research firm for pharmaceuticals. The audit provides detailed product-level estimates of
quarterly sales, dozes, launch dates, brand name, active pharmaceutical ingredient, therapeutic
categorization on all pharmaceutical products sold in India. The coverage of the audit is extensive,
reaching a representative panel of thousands of retail chemists in across cities and towns in India. The
data collected, which provide the only real source of disaggregate information on the Indian
pharmaceutical market, are used by both the government of India in formulating pricing policy and other
decisions, and the Indian pharmaceutical industry in determining pricing and marketing strategies
(Goldberg 2008).
9
pharmaceutical sales in India and ranked # 5 in 2008, it is arguably less important than
anti-infectives from a public health perspective (Goldberg 2010). Nevertheless, it
represents a useful starting point to investigate the impact of the newly introduced
product patent regime on the pharmaceutical industry in India.
The data contains 2,425 CNS products across 21 sub-therapeutic categories in the
Indian CNS market. For simplicity, we focus on single ingredient products (products
containing one active molecule) where there is only one innovator, and this causes our
sample to go down by approximately 28 percent. We further drop 35 products that have
zero number of doses sold throughout our six-year study period. When duplicate
products appear (i.e. same product in different sub-therapeutic categories), we combine
all sales for a product and keep the observation with the highest sales value. As a result,
we are eventually left with 1,693 single ingredient products containing 160 molecules
with total sales, total number of doses and average price per dose for 24 quarters from
2003-2008.
The second main source of data was obtained from the Patent office of the Government
of India and contains data on CNS pharmaceutical product patents granted from
January 1, 2005 to December 31, 2008. We were able to obtain detailed data on the
application number, year the patent application was filed, date of patent grant, patent
number, molecule, disease, and the innovator company for this category of drugs.20
Unfortunately, the classification of granted product patent type was not provided to us
initially by the Government. However, we worked with an examiner of drug patent
applications in India to code each granted product patent according to whether it
contained an active ingredient claim. Surprisingly, 90 percent of the granted product
patents in the CNS therapeutic segment turned out to not claim the active ingredient,
lending support to observations by Chaudhuri (2005), and Sampat (2010) who note the
high rate of ―low quality‖ patents being filed and granted in India.
From a total of 150 product patents, 42 percent of the patents are for combination drugs
(drugs made of two or more active ingredients) that we exclude from the current
analysis. In instances where multiple secondary product patents are granted (such as
product patents for a new salt, a new formulation, or a new derivative of a drug), we
consider the earliest granted secondary product patent to a molecule, causing us to be
left with 39 unique single ingredient product patents, though we later explore the
sensitivity of the main results using the number of granted patents as an additional
explanatory variable.
Figure1 shows the percentage of molecules in the CNS category of drugs that were
granted product patents in each year. There were 0 product patents granted in 2005 (the
first year of the reform). By the end of 2006, 5 percent of the molecules (8 out of 160)
had received a product patent, rising to 16 percent in 2007 and 24 percent (39 out of
160) by the end of 2008.
20
We are in the process of collecting detailed data on product patents granted in other therapeutic
segments to extend the analysis to the entire pharmaceutical market in India.
10
The molecule information for each patent is necessary for matching the patent's
molecule with the corresponding commercial drug data from IMS. Interestingly, there
are four (out of 39) product patents, for which while the corresponding sales data exists
in IMS, the innovator is not present in IMS. For example, Eli Lilly was granted a
product patent for its schizophrenia drug Zyprexa (active ingredient Olanzapine) in
August 2007. While Olanzapine is manufactured in India by various generic firms (e.g.
Cipla, Lupin Labs, Torrent Pharma) as indicated in the IMS data, the innovator Eli
Lilly, is not one of the manufacturers in India. One possible explanation could be the
existence of an agreement between the innovator and a generic manufacturer such as
license deals, or joint ventures. Our interviews with industry executives reveal that
comprehensive information on these deals is not publicly available.
The basic model we estimate is as follows:
Yjt = α + β1Patentjt + β2Patentjt*Typejt + γj + θt + Zjt + ejt
where the outcome variable is the log price of molecule j at quarter t. Since prices are
likely to change proportionally rather than by a fixed dollar amount, it is sensible to
transform the variable using logs. Furthermore, pharmaceutical prices are highly
skewed to the right, and the log transformation produces a distribution that is much less
sensitive to outliers (Duggan and Scott Morton, 2006). The γj’s represent a full set of
molecule fixed effects that control for unobserved time invariant differences across
drugs. The θt’s represent a full set of quarter*year fixed effects to control for any time
varying aggregate factors affecting the price or utilization of pharmaceutical products.
The standard errors are clustered at the molecule level to account for serial correlation
in the error term. Patentjt is an indicator variable for whether molecule j received a
product patent in quarter t. Typejt is an indicator variable that takes the value 1 if the
product patent is on the active ingredient (the strongest type of product patent) and is
zero otherwise. The interaction Patentjt*Typejt allows us to investigate heterogeneous
effects of the patent on pharmaceutical prices. Zjt includes a vector of controls such as
whether the molecule is under price control or not.
To the extent that product patent enforcement results in the withdrawal of generics from
the market, we should expect to find a negative effect on the number of products sold
that contain the patented molecule. Similarly, the withdrawal of generics from the
market is likely to result in an increase in the fraction of total quantity sold to the
innovator. We are also interested in the effect on utilization. On the one hand as prices
rise we may expect to find lower utilization. On the other hand, the innovator may
spend more on advertising, which could serve to increase utilization. In addition, the
11
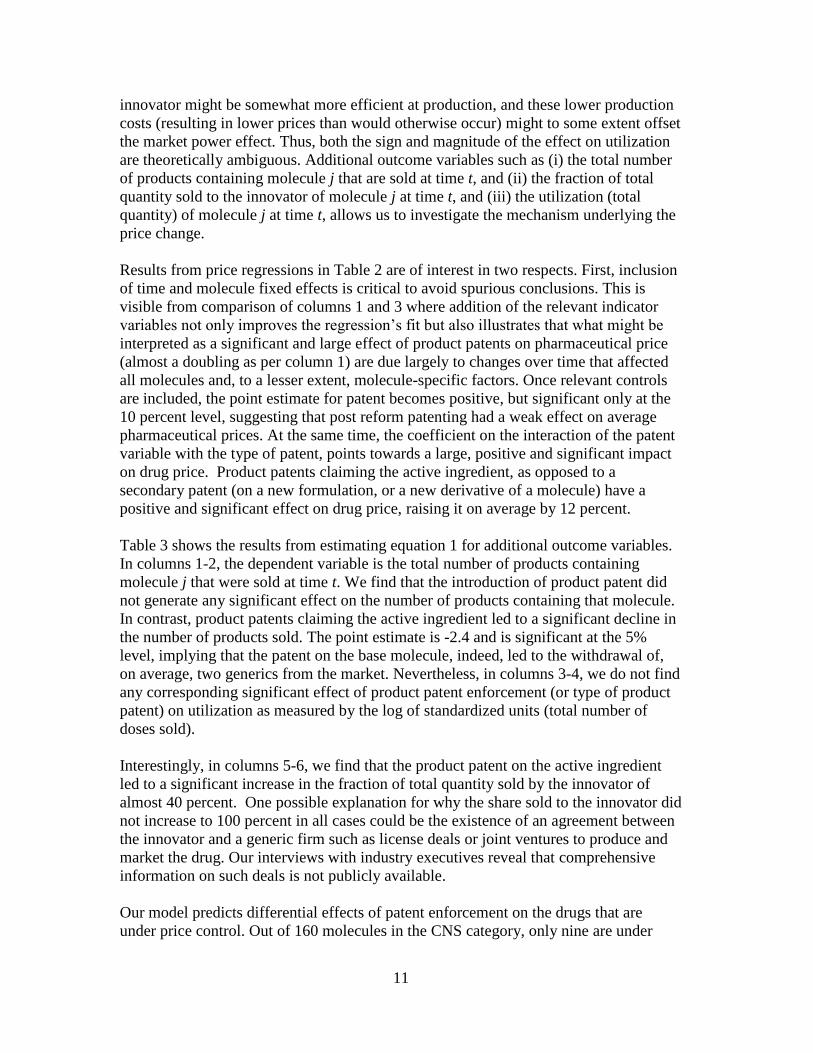
innovator might be somewhat more efficient at production, and these lower production
costs (resulting in lower prices than would otherwise occur) might to some extent offset
the market power effect. Thus, both the sign and magnitude of the effect on utilization
are theoretically ambiguous. Additional outcome variables such as (i) the total number
of products containing molecule j that are sold at time t, and (ii) the fraction of total
quantity sold to the innovator of molecule j at time t, and (iii) the utilization (total
quantity) of molecule j at time t, allows us to investigate the mechanism underlying the
price change.
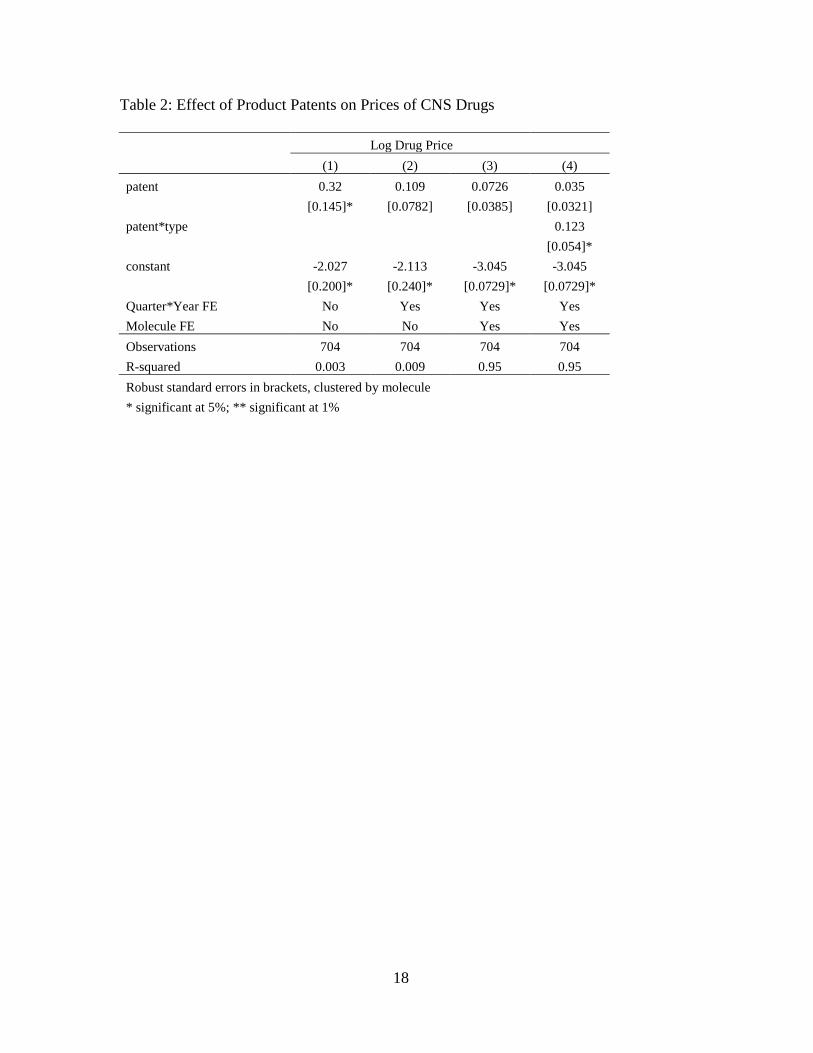
Results from price regressions in Table 2 are of interest in two respects. First, inclusion
of time and molecule fixed effects is critical to avoid spurious conclusions. This is
visible from comparison of columns 1 and 3 where addition of the relevant indicator
variables not only improves the regression’s fit but also illustrates that what might be
interpreted as a significant and large effect of product patents on pharmaceutical price
(almost a doubling as per column 1) are due largely to changes over time that affected
all molecules and, to a lesser extent, molecule-specific factors. Once relevant controls
are included, the point estimate for patent becomes positive, but significant only at the
10 percent level, suggesting that post reform patenting had a weak effect on average
pharmaceutical prices. At the same time, the coefficient on the interaction of the patent
variable with the type of patent, points towards a large, positive and significant impact
on drug price. Product patents claiming the active ingredient, as opposed to a
secondary patent (on a new formulation, or a new derivative of a molecule) have a
positive and significant effect on drug price, raising it on average by 12 percent.
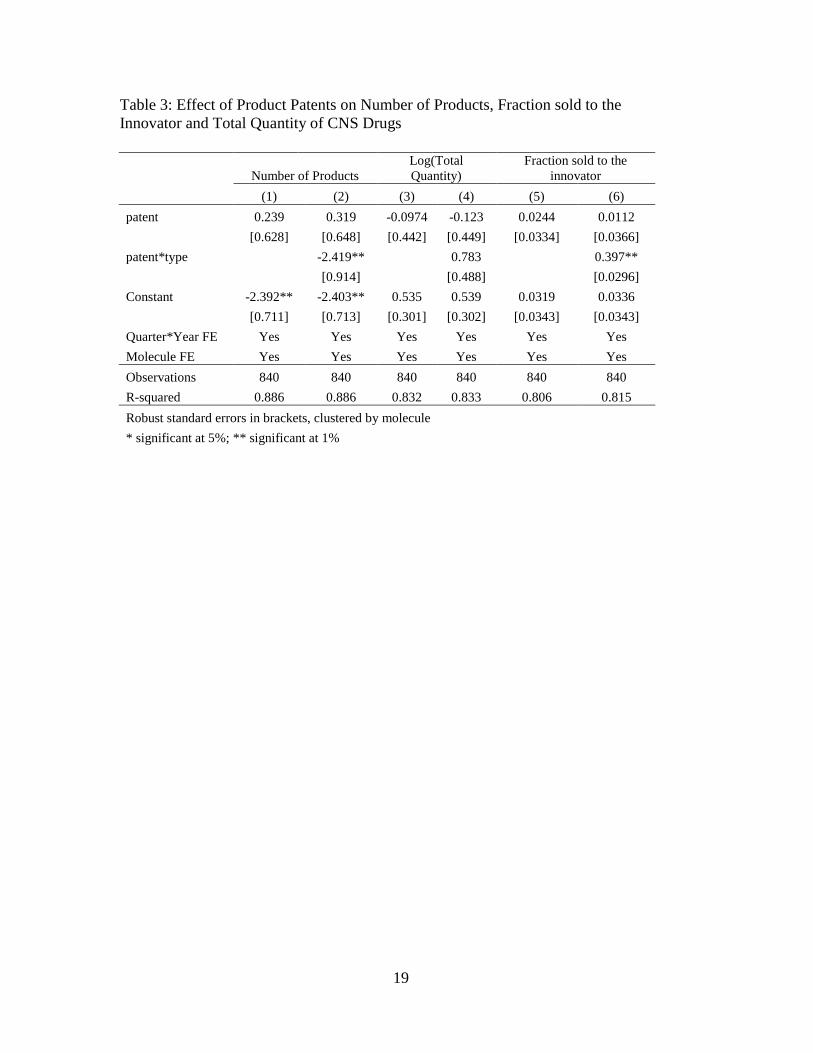
Table 3 shows the results from estimating equation 1 for additional outcome variables.
In columns 1-2, the dependent variable is the total number of products containing
molecule j that were sold at time t. We find that the introduction of product patent did
not generate any significant effect on the number of products containing that molecule.
In contrast, product patents claiming the active ingredient led to a significant decline in
the number of products sold. The point estimate is -2.4 and is significant at the 5%
level, implying that the patent on the base molecule, indeed, led to the withdrawal of,
on average, two generics from the market. Nevertheless, in columns 3-4, we do not find
any corresponding significant effect of product patent enforcement (or type of product
patent) on utilization as measured by the log of standardized units (total number of
doses sold).
Interestingly, in columns 5-6, we find that the product patent on the active ingredient
led to a significant increase in the fraction of total quantity sold by the innovator of
almost 40 percent. One possible explanation for why the share sold to the innovator did
not increase to 100 percent in all cases could be the existence of an agreement between
the innovator and a generic firm such as license deals or joint ventures to produce and
market the drug. Our interviews with industry executives reveal that comprehensive
information on such deals is not publicly available.
Our model predicts differential effects of patent enforcement on the drugs that are
under price control. Out of 160 molecules in the CNS category, only nine are under
12
government price controls. However, out of the nine that are under price control, only
one molecule was subjected to a product patent implying that, at least within this
therapeutic segment, the likely effect of price controls on curbing price increases is
negligible.
IV. Conclusion
This paper explores the effects of product patent protection on drug prices and
utilization using data on one particular therapeutic segment relating to central nervous
system treatments in the Indian pharmaceuticals market. The study highlights the
importance of the distinction between different types of product patents and their
differential impact on average prices and total utilization of drugs. The analysis finds a
statistically significant effect of a sub-class of product patents. In particular, product
patents that were granted on the active ingredient instead of incremental innovations of
a drug, led to a significant increase in drug prices, and an increase in the fraction of
total quantity sold to the innovator with a corresponding withdrawal of generics from
the pharmaceutical market in India. The purpose of this paper is to provoke discussion
on some of the early estimates emerging from preliminary analysis using this data. In
forthcoming work we plan to extend the analysis to all therapeutic segments of the
Indian pharmaceutical market, and explore in greater detail heterogeneous effects by
sub-therapeutic segments, welfare implications of stringent patent protection using
demand and supply parameters estimated earlier in the literature, and whether there are
any substitution effects between patents and price controls as alternative policy approaches.
13
References
Acemoglu, D. and Linn, J. 2004. ―Market Size in Innovation: Theory and Evidence
from the Pharmaceutical Industry,‖ 2004, Quarterly Journal of Economics, Vol. 119,
No 3, 1049-1090.
Arora, A., Branstetter, L. and Chatterjee, C. 2008. ―Strong Medicine: The Impact of
Patent Reform on the Indian Pharmaceutical Industry,‖ in Iain Cockburn and Matthew
Slaughter (eds.), The Location of Biopharmaceutical Activity, NBER and University of
Chicago Press.
Berndt, E.R., 2002. Pharmaceuticals in U.S. Health Care: determinants of quantity and
price. Journal of Economic Perspectives, 16, 45–66.
Caves, R.E., Whinston, M.D., Hurwitz, M.A., 1991. ―Patent Expiration, Entry, and
Competition in the U.S. Pharmaceutical Industry,‖ Brookings Papers: Microeconomics
1–23.
Chaudhuri, S. 2005.―The WTO and India’s Pharmaceuticals Industry: Patent Protection
TRIPS and Developing Countries‖, New Delhi, Oxford University Press, 2005.
Chaudhuri, S., Goldberg, P. and Jia, P. 2006. ―Estimating the Effects of Global Patent
Protection in Pharmaceuticals: A Case Study of Quinolones in India,‖American
Economic Review
Cockburn, I. and Lanjouw, J. 2001. ―New Pills for Poor People?: Empirical Evidence
after GATT,‖ World Development, 29, 265-289
Duggan, M. and Scott Morton, F. 2006. ―The Distortionary Effects of Government
Procurement: Evidence for Medicaid Prescription Drug Purchasing.‖ Quarterly Journal
of Economics, 1-31.
Duggan, M. and Scott Morton, F. 2010. ―The Impact of Medicare Part D on
Pharmaceutical Prices and Utilization.‖ American Economic Review, March.
Ellison, G., Ellison, S., 2007. ‖Strategic Entry Deterrence and the Behavior of
Pharmaceutical Incumbents Prior to Patent Expiration,‖ MIT Working Paper.
Ellison, S., Cockburn, I., Grilliches, Z. and Hausman, J. 1997. ―Characteristics of
Demand for Pharmaceutical Products: An Examination of Four Cephalosporins‖, The
RAND Journal of Economics, Vol. 28, No. 3, 426-446.
Evans, N.2007. ―India's New Patent Regime and its Impact on the Global
Pharmaceutical Industry,‖ Pharmaceutical Law Insight, September.
14
Frank, R.G., Salkever, D.S., 1997. ―Generic Entry and the Pricing of Pharmaceuticals,‖
Journal of Economics and Management Strategy, 6, 75–90.
Fink, C. 2001. ―Patent Protection, Transnational Corporations, and Market Structure: A
Simulation Study of the Indian Pharmaceutical industry,‖ Journal of Industry,
Competition and Trade, 1:1, 101-121.
Fink, C. and Maskus, K. 2000. Intellectual Property and Development: Lessons from
Recent Economic Research (eds.), Washington: the World Bank.
Government of India, 2005, ―Manual of Patent Practice and Procedure,‖ Patent Office
Government of India, 2005, ―Annual Report,‖ Controller General of Patents, Designs &
Trade Marks.
Government of India, 2010, ―Annual Report,‖ National Pharmaceutical Pricing
Authority, Department of Pharmaceuticals, Ministry of Chemicals and Fertilizers
Grabowski, H., Vernon, J., 1996. ―Longer Patents for Increased Generic Competition in
the U.S.—the Waxman–Hatch Act after One Decade,‖ PharmacoEconomics, 10, 1996,
110–123.
Grace, C. 2004. ―The Effect of Changing Intellectual Property on Pharmaceutical
Industry Prospects in India and China: Considerations for Access to Medicines,‖ DFID
Issue Paper.
Kremer, M. 2002. ―Pharmaceuticals and the Developing World,‖ Journal of Economic
Perspectives, 16: 4, 67-90.
Lanjouw, J. 1998. ―The Introduction of Pharmaceutical product Patents in India:
Heartless Exploitation of the Poor and Suffering?,‖NBER Working Paper 6366.
Reiffen, D., Ward, M.R., 2005. ―Generic Industry Dynamics,‖ Review of Economics
and Statistics, 87, 37–49.
Sampat, B. 2010 ―Institutional Innovation or Institutional Imitation: The Impact of
TRIPs on Indian Pharmaceutical Patenting,‖ Columbia University School of Public
Health, mimeo
Sampat, B. and Hemphill, C.S. 2010. ―When do Generics Challenge Drug Patents?,‖
Columba Law School Working paper No. 379
Scott Morton, F. 1999. ―Entry Decisions in the Generic Pharmaceutical Industry‖,
RAND Journal of Economics, 30, 421-440.
15
Watal, J. 2000. ―Pharmaceutical Patents, Prices and Welfare Losses: Policy Options for
India under the WTO TRIPs Agreement,‖ 23:5, 733-752.
Wiggins, S.N., Maness, R., 2004. ―Price Competition in Pharmaceuticals,‖ Economic
Inquiry, 42, 247–263.
16
Figure 1: Percentage of CNS Molecules Granted a Product Patent
Figure 2: Broad Trends in Price and Utilization of CNS Drugs over time
17
Table 1: Shares of Major Therapeutic Segments in Retail Sales
share of retail sales (%) in 2003
Main Therapeutic Category Rank
Share
(%) Sub Therapeutic Category ( within CNS) Rank
Share
(%)
ALIMENTARY TRACT & METABOLISM 1 0.25 ANTI-EPILEPTICS 1 0.23
ANTI-INFECTIVES 2 0.2 NON-NARCOTIC ANALGESICS 2 0.19
RESPIRATORY SYSTEM 3 0.11 TRANQUILLISERS 3 0.16
CARDIOVASCULAR SYSTEM 4 0.10 ANTIDEPRESSANT & MOOD STABILIZERS 4 0.13
CENTRAL NERVOUS SYSTEM (CNS) 5 0.07 ANTIPSYCHOTICS 5 0.06
MUSCULO-SKELETAL 6 0.07 ANTIVERTIGO PRODUCTS 6 0.04
DERMATOLOGICALS 7 0.05 ANTI-PARKINSON 7 0.03
GENITO-URINARY 8 0.04 PSYCHOLEPT-PSYCHOANALEPT 8 0.03
BLOOD & BLOOD FORMING AGENTS 9 0.04 HYPNOTICS & SEDATIVES 9 0.03
SENSORY ORGANS 10 0.02 ANTI-MIGRAINE 10 0.02
PARASITOLOGY 11 0.01 ANAESTHETICS 11 0.02
SYSTEMIC HORMONAL PRODUCTS 12 0.01 ANTI-ALZHEIMER PRODUCTS 12 0.01
DIAGNOSTIC AGENTS 13 0.00 ANTI-SMOKING PRODUCTS 13 0.01
Source: Authors’ calculation using IMS Data
18
Table 2: Effect of Product Patents on Prices of CNS Drugs
Log Drug Price
(1) (2) (3) (4)
patent 0.32 0.109 0.0726 0.035
[0.145]* [0.0782] [0.0385] [0.0321]
patent*type 0.123
[0.054]*
constant -2.027 -2.113 -3.045 -3.045
[0.200]* [0.240]* [0.0729]* [0.0729]*
Quarter*Year FE No Yes Yes Yes
Molecule FE No No Yes Yes
Observations 704 704 704 704
R-squared 0.003 0.009 0.95 0.95
Robust standard errors in brackets, clustered by molecule
* significant at 5%; ** significant at 1%
19
Table 3: Effect of Product Patents on Number of Products, Fraction sold to the
Innovator and Total Quantity of CNS Drugs
Number of Products
Log(Total
Quantity)
Fraction sold to the
innovator
(1) (2) (3) (4) (5) (6)
patent 0.239 0.319 -0.0974 -0.123 0.0244 0.0112
[0.628] [0.648] [0.442] [0.449] [0.0334] [0.0366]
patent*type -2.419** 0.783 0.397**
[0.914] [0.488] [0.0296]
Constant -2.392** -2.403** 0.535 0.539 0.0319 0.0336
[0.711] [0.713] [0.301] [0.302] [0.0343] [0.0343]
Quarter*Year FE Yes Yes Yes Yes Yes Yes
Molecule FE Yes Yes Yes Yes Yes Yes
Observations 840 840 840 840 840 840
R-squared 0.886 0.886 0.832 0.833 0.806 0.815
Robust standard errors in brackets, clustered by molecule
* significant at 5%; ** significant at 1%