


Languages
Pages
Legal


ADRC-Natural Disasters Data Book-2006 Chapter 3
Chapter 3: Regional Characteristics of Natural Disasters
3.1 Proportion of Natural Disasters by Region
As in the previous year, Asia accounted for most of the devastating disasters that occurred in
2006 (40%, increase from 37% in 2005), followed by Africa (28%; an increase from 19% in 2005), the
Americas (15%; a decrease from 20% in 2005), Europe (14%; a decrease from 21% in 2005), and Oceania
(4%; a marginal increase from 3% in 2005). Although the 2006 disaster trends look similar to those for
2004 and 2005, their impacts in terms of human and economic losses were different. Figure 30A
summarizes the 2006 data visually. Figure 30B summarizes the world data by type of disaster. The majority
of the disasters in 2006 were floods and wind storms followed by epidemics, extreme temperatures,
earthquakes, and slides.
Figure 30A: Proportion of Worldwide Disasters by Region, 2006
Number of Disasters (World/Region) 2006
Asia40.04%
Americas14.88%
Africa27.79%
Oceania3.72%Europe
13.57%
TOTAL = 457
Source: CRED-EMDAT, Université Catholique de Louvain, Brussels, Belgium, 2006
55

ADRC-Natural Disasters Data Book-2006 Chapter 3
Figure 30B: Proportion of Worldwide Disasters by Type, 2006
Number of Disasters (World/Disaster Type) 2006
Wave / Surge0.2%
Wild fire2.0%
Volcano2.2%
Slide4.2%
Flood49.5%
ExtremeTemperature
6.6%
Epidemic13.6%
Earthquake5.0%
Drought2.4%Wind storm
14.4%
TOTAL = 457
Source: CRED-EMDAT, Université Catholique de Louvain, Brussels, Belgium, 2006
As can be seen in Figure 31A, the majority of people killed by natural disasters in the year 2006
lived in Asia, which accounted for 59% of the total number of people killed by disasters worldwide
(considerable decrease from 91% in the previous year). (This decrease from 2005 to 2006 is mainly due to
the heavy death toll in 2005 caused by South Asian earthquake that struck India and Pakistan). In 2006
once again Asia accounted for the majority of the people killed due to the floods in China and India,
windstorms and slides in the Philippines and the earthquake and tsunami in Indonesia. Another significant
region is Africa, which accounted for 26% of the people killed in 2006 (considerable increase from 3% in
the previous year 2005 and this is due to the heavy dead toll in Africa caused by epidemic and flood in
2006). The number of people killed in Europe increased from 2% in 2005 to 12% in 2006. This is due to
the extreme temperature conditions that prevailed in Europe in 2006. The Americas also saw a decrease in
people killed, from 4% in 2005 to 2% in 2006. Oceania registered almost the same number of people killed
by natural disasters as in the previous year. The heavy death toll in Asia caused by the Asian disasters in
2006 makes other regions’ figures look smaller in 2006 as in the previous years’ trend. Earthquakes,
epidemics and floods were responsible for the majority of the death toll worldwide (61%), followed by
extreme temperature, wind storms and floods, as shown in Figure 31B.
56

ADRC-Natural Disasters Data Book-2006 Chapter 3
Figure 31A; Proportion of People Killed Worldwide by Region, 2006
Number of Killed (World/Region) 2006
Europe12.37%
Oceania0.08% Africa
26.07%
Americas2.29%Asia
59.18%
TOTAL = 27,292 People
Source: CRED-EMDAT, Université Catholique de Louvain, Brussels, Belgium, 2006
Figure 31B: Proportion of People Killed Worldwide by Disaster Type, 2006
Number of Killed (World/Disaster Type) 2006
Epidemic20.1%
Wild fire0.1%
Wave / Surge2.9%
Slide5.7%
ExtremeTemperature
14.3%
Flood19.4%
Wind storm15.3% Drought
0.5% Earthquake21.6%
TOTAL = 27,292 People
Source: CRED-EMDAT, Université Catholique de Louvain, Brussels, Belgium, 2006
57

ADRC-Natural Disasters Data Book-2006 Chapter 3
The number of total affected people deccreased from 158 million in 2005 to 135 million in 2006.
As shown in Figure 32A, the Asian region accounted for the highest percentage of total affected people,
with 89% in 2006. This is an increase from the previous year’s 83%. But the real number of total affected
people in Asia this year 2006 has decreased by 8.6%. This an interesting point to note this year. In addition
to the 2006 Asian disasters, which affected many people in Asia, other disasters in other parts of the world,
especially Africa, also had a significant impact. The number of total affected people in every region
worldwide decreased significantly over previous year. Nevertheless, the trend clearly reflects Asia's
continued vulnerability to natural hazards. Figure 32B shows the percentages of total affected people by
disaster type. Hydro-meteorological disasters, such as floods, wind storms, and droughts had a significant
impact on people worldwide.
Figure 32A: Proportion of Total Affected People Worldwide by Region, 2006
Number of Total Affected People(World/Region) 2006
Asia88.85%
Americas1.07%
Africa9.94%
Oceania0.02%Europe
0.12%
TOTAL = 135,068,229 People
Source: CRED-EMDAT, Université Catholique de Louvain, Brussels, Belgium, 2006
58

ADRC-Natural Disasters Data Book-2006 Chapter 3
Figure 32B: Proportion of Total Affected People Worldwide by Disaster Type, 2006
Number of Total Affected People (World/Disaster Type) 2006
Slide0.3%
Volcano0.3%
Wind storm49.6%
Drought22.7% Earthquake
2.8%
Epidemic0.4%
Flood23.8%
TOTAL = 135,068,229 People
Source: CRED-EMDAT, Université Catholique de Louvain, Brussels, Belgium, 2006
As in the previous years (except in 2005 in which Americas accounted for the highest damage),
Asia accounted for more than two-thirds of the economic damage caused by natural disasters in 2006
(Figure 33A). This is mainly due to the impact of the earthquake and tsunami in Indonesia, windstorms and
slides in the Philippines, floods in China and India in 2006. Asia accounted for more economic damage
than in the previous year (in 2005, it was 12%), a tremendous increase from 2005. The majority of damage
in Asia was due to windstorms, floods and earthquakes. The Americas (15%) accounted for the next highest
level of economic losses, in contrast to the pattern in 2005 in terms of damage (in 2005, it was the highest
at 86% due to hurricanes Katrina, Wilma and others). All other regions accounted for much less of the
economic damage sustained in 2006.
Figure 33B shows the amount of damage worldwide for 2006 by disaster type. Wind storms and
floods were the leading causes of damage worldwide, followed by earthquakes. The socio-economic
structure of these regions and the disaster occurrences and countermeasures could be attributed to these
trends. Overall damage decreased by about 87% from the previous year 2005, from US$159 billion to
US$20 billion.
59

ADRC-Natural Disasters Data Book-2006 Chapter 3
Figure 33A: Proportion of Worldwide Damage by Region, 2006
Number of Total Affected People(World/Region) 2006
Asia88.85%
Americas1.07%
Africa9.94%
Oceania0.02%Europe
0.12%
TOTAL = 19,801,519,000 US$
Source: CRED-EMDAT, Université Catholique de Louvain, Brussels, Belgium, 2006
Figure 33B: Proportion of Worldwide Damage by Disaster Type, 2006
Amount of Damage (World/Disaster Type) 2006
Slide0.1%
Volcano0.8%
Wind storm54.0%
Wild fire1.2%
Flood17.1%
ExtremeTemperature
5.1%
Earthquake16.7%Drought
5.3%
TOTAL = 19,801,519,000 US$
Source: CRED-EMDAT, Université Catholique de Louvain, Brussels, Belgium, 2006
These figures indisputably demonstrate that the disaster vulnerability of the Asian region cannot
be neglected in relation to global sustainable development and the need of stronger disaster
countermeasures.
60

ADRC-Natural Disasters Data Book-2006 Chapter 3
3.2 Natural Disasters around the World
3.2.1 Characteristics of Disasters in Africa
About 93% of the natural disasters that occurred in Africa in 2006 consisted of floods, epidemics
and droughts (Figure 34). Furthermore, the majority of the human losses (99.5%) in Africa were due to
epidemics, floods, and droughts (Figure 35). Meanwhile, the majority of people affected by disasters in
Africa were affected by droughts, which account for nearly 81% of the total affected people in Africa in
2006 (Figure 36). The same pattern was seen in the previous year 2005, when droughts accounted for
almost 94% of the people affected. Droughts, floods and epidemics accounted for nearly 99% of the total
affected population in Africa in 2006. Kenya, Malawi, Uganda and Burundi were severely hit by drought. It
is interesting to note, however, that all of the economic damage sustained in Africa was caused by flooding
in 2006 as it was in the previous year 2005 (Figure 37). These figures show Africa to be a disaster-prone
region with socio-economic vulnerabilities, where the majority of human suffering comes from droughts,
floods, and epidemics.
Figure 34: Proportion of Disasters in Africa by Type, 2006
Number of Disasters Occurred in Africa (Disaster Type) (2006)
Drought4.7% Earthquake
1.6%
Volcano0.8%
Wind Sorm3.9%
Slide0.8%
Flood45.7%
Epidemic42.5%
TOTAL = 127
Source: CRED-EMDAT, Université Catholique de Louvain, Brussels, Belgium, 2006
61

ADRC-Natural Disasters Data Book-2006 Chapter 3
Figure 35: Proportion of People Killed in Africa by Disaster Type, 2006
Number of People Killed in Africa(Disaster Type) (2006)
Epidemic76.5%
Drought2.1%
Wind Sorm0.1%
Volcano0.0%
Earthquake0.1%
Slide0.3%Flood
20.9%
TOTAL = 7,115 People
Source: CRED-EMDAT, Université Catholique de Louvain, Brussels, Belgium, 2006
Figure 36: Proportion of Total Affected People in Africa by Disaster Type, 2006
Number of Total Affected People in Africa(Disaster Type) (2006)
Epidemic2.5%
Earthquake0.0%
Flood16.3%
Drought80.5%
Volcano0.0%
Slide0.0% Wind Sorm
0.7%
TOTAL = 13,422,363 People
Source: CRED-EMDAT, Université Catholique de Louvain, Brussels, Belgium, 2006
62

ADRC-Natural Disasters Data Book-2006 Chapter 3
Figure 37: Proportion of Damage in Africa by Disaster Type, 2006
Amount of Damage in Africa (Disaster Type) (2006)
Flood100.0%
TOTAL = 157,761,000 US $
Source: CRED-EMDAT, Université Catholique de Louvain, Brussels, Belgium, 2006
63

ADRC-Natural Disasters Data Book-2006 Chapter 3
3.2.2 Characteristics of Disasters in the Americas
In the Americas, that includes the countries of North and South America, flood, and windstorms
accounted for the vast majority (almost 72%) of natural disasters that occurred in 2006 as it was in the
previous year 2005 which was a devastating year. Extreme temperatures, volcano eruptions and wildfire
also created devastation in the Americas in 2006. In terms of human loss and suffering, about 94% of
people killed were by floods, extreme temperatures and wind storms. Nearly 99% of the people affected
were affected by wind storms, floods and volcano activities. The majority of the economic damage
sustained was caused by floods in 2006. In 2005, severe damage was caused by the historic hurricanes that
rocked United States. Severe damage was inflicted by floods and tornados that hit the US and the
Caribbean, and the volcano activity in Ecuador. Figures 38 to 41 show that the Americas were visited by
significant hydro-meteorological disasters in 2006, as they had been in 2003, 2004 and 2005 as well.
Overall the human and economic losses have decreased in the Americas in 2006 in comparison to the
previous years.
Figure 38: Proportion of Disasters in the Americas by Type, 2006
Number of Disasters Occurred in Americas(Disaster Type) (2006)
Slide2.9%
Volcano7.4%
Wild fire5.9%
Wind storm17.6%
Flood54.4%
ExtremeTemperature
7.4%
Earthquake2.9%
Drought1.5%
TOTAL = 68
Source: CRED-EMDAT, Université Catholique de Louvain, Brussels, Belgium, 2006
64

ADRC-Natural Disasters Data Book-2006 Chapter 3
Figure 39: Proportion of People Killed in the Americas by Disaster Type, 2006
Number of People Killed in Americas(Disaster Types) (2006)
Flood48.7%
ExtremeTemperature
31.9%
Volcano0.8%
Slide3.4%
Wild fire1.6%
Wind storm13.6%
TOTAL = 626 People
Source: CRED-EMDAT, Université Catholique de Louvain, Brussels, Belgium, 2006
Figure 40: Proportion of Total Affected People in the Americas by Disaster Type, 2006
Number of Total Affected People in Americas(Disaster Type) (2006)
Volcano22.2%
Wild fire0.1%
Earthquake0.9%
Flood56.7%
Wind storm20.1%
TOTAL = 1,443,524 People
Source: CRED-EMDAT, Université Catholique de Louvain, Brussels, Belgium, 2006
65

ADRC-Natural Disasters Data Book-2006 Chapter 3
Figure 41: Proportion of Damage in the Americas by Disaster Type, 2006
Amount of Damage in Americas (Disaster Type) (2006)
Flood85.1%
Wild fire5.1%Volcano
6.6%
Earthquake3.2%
TOTAL = 2,916,060,000 US$
Source: CRED-EMDAT, Université Catholique de Louvain, Brussels, Belgium, 2006
66

ADRC-Natural Disasters Data Book-2006 Chapter 3
3.2.3 Characteristics of Disasters in Asia
An earlier chapter demonstrated the high vulnerability of the Asian region to natural disasters.
The same trend will be observed here. Floods, wind storms, earthquakes, landslides, and epidemics
occurred at a greater rate than other disasters in 2005 (Figure 42). About 73% of the disasters in Asia
consisted of floods and wind storms, followed by earthquakes (9%), landslides (8%) and epidemics (4%). It
is worth noting that earthquakes and tsunami in Indonesia caused considerable human losses (about 41%)
in Asia, followed by floods, wind storms and slides (Figure 43). Floods in China, India and Bangladesh
also contributed to the high death toll in Asia. Figure 44 shows that wind storms, floods, droughts, and
earthquakes caused severe human suffering in Asia, as these accounted for almost all the people affected by
natural disasters in the region in 2006. Although the Indonesia earthquake caused heavy human losses, this
earthquake and tsunami did not account for a large percentage of the total affected people in Asia in 2006.
Furthermore, about 86% of the economic damage sustained was due to windstorms and earthquakes. The
remainder was due to floods and droughts (Figure 45). Clearly, the Asian region is severely disaster-prone
and vulnerable to both hydro-meteorological and geophysical disasters. The following figures highlight
these trends.
Figure 42: Proportion of Disasters in Asia by Type, 2006
Number of Disasters Occurred in Asia(Disaster Type) 2006
ExtremeTemperature
2.2%
Earthquake9.3%
Epidemic4.4%
Drought1.1%Wind storm
19.7%Wild fire
0.5%
Slide7.7%
Volcano1.1%
Wave / Surge0.5%
Flood53.6%
TOTAL = 183
Source: CRED-EMDAT, Université Catholique de Louvain, Brussels, Belgium, 2006
67

ADRC-Natural Disasters Data Book-2006 Chapter 3
Figure 43: Proportion of People Killed in Asia by Disaster Type, 2006
Number of People Killed in Asia(Disaster Type) 2006
Wind storm25.2%
Wave / Surge5.0%
Flood21.3%
ExtremeTemperature
2.5%
Epidemic0.3%
Earthquake36.4%
Slide9.2%
TOTAL = 16,151 People
Source: CRED-EMDAT, Université Catholique de Louvain, Brussels, Belgium, 2006
Figure 44: Proportion of Total Affected People in Asia by Disaster Type, 2006
Number of Total Affected People in Asia(Disaster Type) 2006
Wind storm55.5%
Slide0.3%
Epidemic0.1%
Earthquake3.2%
Flood24.2%
Drought16.6%
TOTAL = 120,011,231 People
Source: CRED-EMDAT, Université Catholique de Louvain, Brussels, Belgium, 2006
68

ADRC-Natural Disasters Data Book-2006 Chapter 3
Figure 45: Proportion of Damage in Asia by Disaster Type, 2006
Amount of Damage in Asia (Disaster Type) 2006
Flood8.0%
Slide0.1%Wild fire
0.1%
Wind storm63.5%
Earthquake22.5%
Drought5.8%
TOTAL = 14,069,346,000 US$
Source: CRED-EMDAT, Université Catholique de Louvain, Brussels, Belgium, 2006
69

ADRC-Natural Disasters Data Book-2006 Chapter 3
3.2.4 Characteristics of Disasters in Europe
The year 2005 was not a difficult year for Europe in comparison with the devastating floods of
2002 and the extreme temperatures of 2003. But once again, 2006 saw some events of extreme
temperatures causing devastation and human loss in the region. Figures 46 to 49 show that mainly extreme
temperatures and floods caused severe human losses in the region. The majority of disasters in 2006 were
floods and extreme temperatures, accounting for 77% of all disasters (Figure 46). The majority of human
losses were due to extreme temperatures (98%), followed floods (Figure 47). All of these disasters caused
about 99% of the total human losses in the region in 2006. Furthermore, 91% of the total affected people
were affected by floods and extreme temperatures (Figure 48), in contrast to 2005 which saw winstorms
affecting majority of the people in the region. In 2004 many people were affected by floods (88%). In 2002,
as many as 84% were affected by floods, whereas in 2003, many people were killed by extreme
temperatures (99%). Floods in Romania, Serbia, Czech Republic, and Switzerland, and cold wave in
Belarus, Ukraine and Russia contributed significantly to the human losses and economic damage in this
region in 2006. In 2004, droughts created heavy economic losses in the region, but in 2005 floods caused
severe economic damage in the region (much as they had in 2003). The year 2006 was a rather tumultuous
one for Europe, which once again sustained significant damage caused by hydro-meteorological disasters.
Figure 46: Proportion of Disasters in Europe by Type, 2006
Number of Disasters Occurred in Europe(Disaster Type) (2006)
ExtremeTemperature
33.9%
Earthquake3.2%
Drought1.6%Wind storm
14.5%Wild fire1.6%
Slide1.6%
Flood43.5%
TOTAL = 62
Source: CRED-EMDAT, Université Catholique de Louvain, Brussels, Belgium, 2006
70

ADRC-Natural Disasters Data Book-2006 Chapter 3
Figure 47: Proportion of People Killed in Europe by Disaster Type, 2006
Number of People Killed in Europe (Disaster Type) (2006)
ExtremeTemperature
97.5%
Flood1.5%
Slide0.1%
Wild fire0.1% Wind storm
0.8%
TOTAL = 3,377 People
Source: CRED-EMDAT, Université Catholique de Louvain, Brussels, Belgium, 2006
Figure 48: Proportion of Total Affected People in Europe by Disaster Type, 2006
Number of Total Affected People in Europe(Disaster Type) (2006)
ExtremeTemperature
37.3%
Slide0.1%
Wind storm1.1% Earthquake
7.6%
Flood53.9%
TOTAL = 165,327 People
Source: CRED-EMDAT, Université Catholique de Louvain, Brussels, Belgium, 2006
71
ADRC-Natural Disasters Data Book-2006 Chapter 3
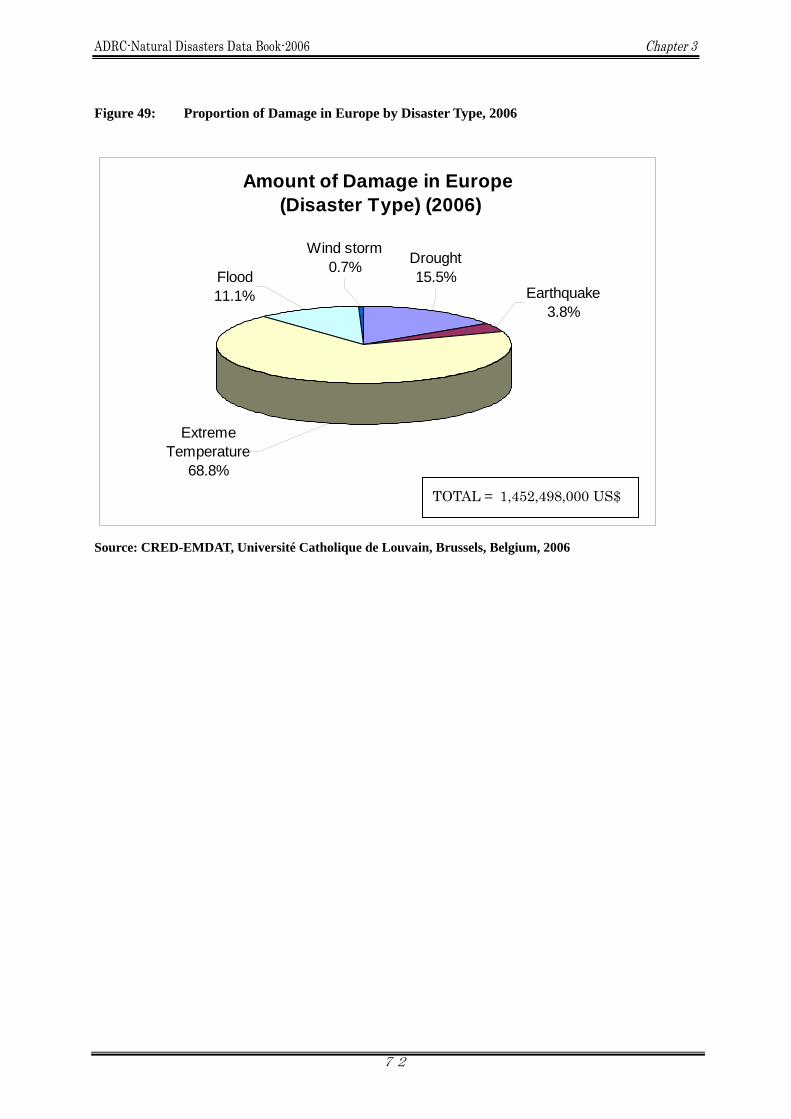
Figure 49: Proportion of Damage in Europe by Disaster Type, 2006
Amount of Damage in Europe (Disaster Type) (2006)
Earthquake3.8%
Drought15.5%
ExtremeTemperature
68.8%
Wind storm0.7%
Flood11.1%
TOTAL = 1,452,498,000 US$
Source: CRED-EMDAT, Université Catholique de Louvain, Brussels, Belgium, 2006
72

ADRC-Natural Disasters Data Book-2006 Chapter 3
3.2.5 Characteristics of Disasters in Oceania
Disaster trends in Oceania were a bit different from those of other regions in previous years as well
as in the year 2006, as the natural disasters strayed from the average regional pattern. Not all types of
natural disasters occurred here, but the majority that did occur were floods, wind storms, and wildfire,
accounting for 76% of the total. The remainder consisted of volcanic eruptions, slides, and drought (Figure
50). The majority of human losses were due to landslides (57%), followed by wildfire and floods (Figure
51). This was due to the slides in Papua New Guinea, floods in Australia and Papua New Guniea, wild fires
in Australia and storms in the Pacific island country Fiji and Australia. The total affected people in Oceania
in 2006 were largely affected by floods in Papua New Guinea and Australia, and windstorms in Australia
(95%), while the remainder was subject to volcanic activity in Vanuatu (Figure 52). The Papua New Guinea
floods and windstorms in Australia accounted for the majority of those affected in Oceania in 2006. This is
due to severe wind storms that hit Australia and the nearby small Pacific island countries, and wild fires in
Australia. The majority of the economic damage was caused by wind storms (91%) and wild fires (8%),
mainly from Australia, as shown in Figure 53.
Though Oceania is vulnerable to both hydro-meteorological and geo-physical disasters due its
geographical location, in 2006 Oceania experienced mainly hydro-meteorological disasters that created
severe economic losses and human sufferings.
Figure 50: Proportion of Disasters in Oceania by Type, 2006
Number of Disasters Occurred in Oceania(Disaster Type) (2006)
Wild fire17.6%
Volcano11.8%
Slide5.9%
Flood35.3%
Drought5.9%
Wind storm23.5%
TOTAL = 17
Source: CRED-EMDAT, Université Catholique de Louvain, Brussels, Belgium, 2006
73

ADRC-Natural Disasters Data Book-2006 Chapter 3
Figure 51: Proportion of People Killed in Oceania by Disaster Type, 2006
Number of People Killed in Oceania (Disaster Type) (2006)
Slide56.5%
Flood26.1%
Wild fire17.4%
TOTAL = 23 People
Source: CRED-EMDAT, Université Catholique de Louvain, Brussels, Belgium, 2006
Figure 52: Proportion of Total Affected People in Oceania by Disaster Type, 2006
Number of Total Affected People in Oceania(Disaster Type) (2006)
Flood59.0%
Volcano4.7%
Wild fire0.5%
Wind storm35.7%
TOTAL = 25,784 People
Source: CRED-EMDAT, Université Catholique de Louvain, Brussels, Belgium, 2006
74

ADRC-Natural Disasters Data Book-2006 Chapter 3
Figure 53: Proportion of Damage in Oceania by Disaster Type, 2006
Amount of Damage in Oceania (Disaster Type)(2006)
Flood0.3%
Wild fire8.3%
Wind storm91.4%
TOTAL = 1,205,854,000 US$
Source: CRED-EMDAT, Université Catholique de Louvain, Brussels, Belgium, 2006
This section summarizes worldwide natural disaster patterns by region. Tables 2B and 3B in
Chapter 1 also provide these figures in a tabulated form. Regions all over the world, including Oceania,
experienced both hydro-meteorological and geo-physical disasters in 2006. The most significant human and
economic losses resulted from the earthquakes, floods, winstorms and slides that occurred in Indonesia,
China, the Philippines, India, and the windstom and flood that hit Australia and the US, respectively. The
data shown here clearly demonstrates that Asia is a disaster-prone region of the world that sustains
considerable levels of human losses and suffering. The most severe disasters of 2006, such as earthquake
and tsunami in Indonesia; floods in China; windstorms and slides in the Philippines, occurred in the Asian
region. Natural disasters deprive the affected populations of the benefits of socio-economic development,
and hinder progress toward sustainable economic development - in disaster-prone regions and all over the
globe.
75
Top Related