


Languages
Pages
Legal

authorClaire O’Connor
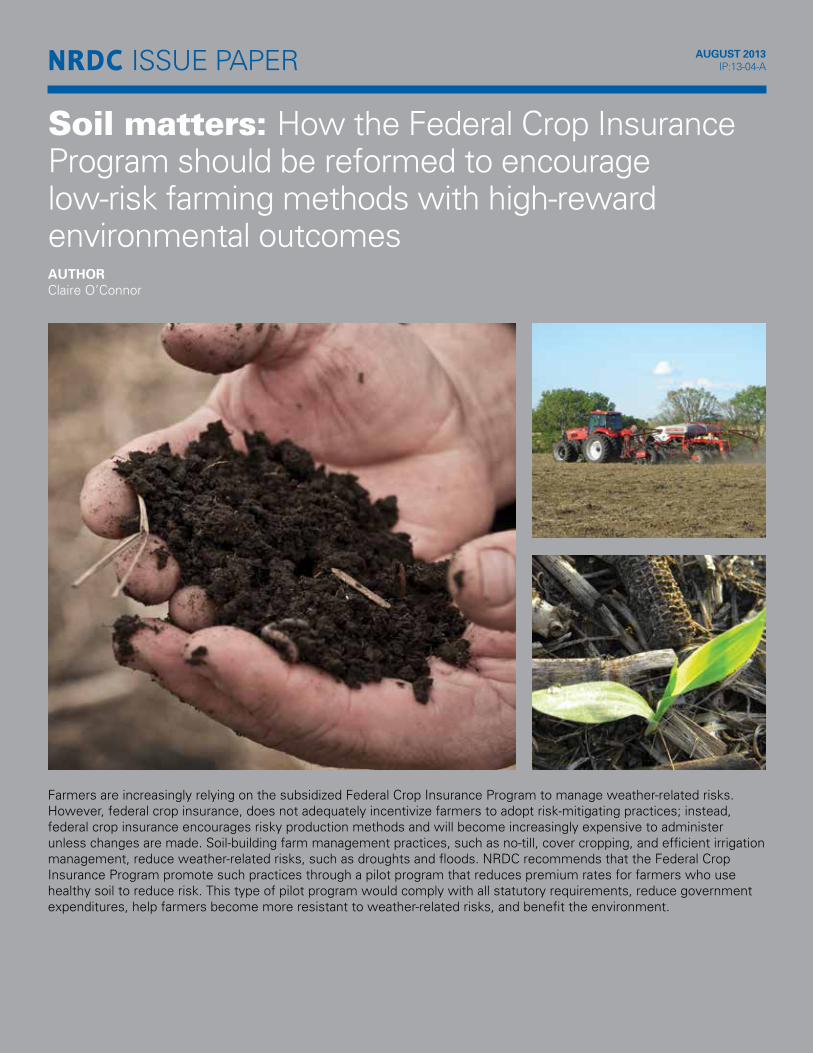
Soil matters: How the Federal Crop Insurance Program should be reformed to encourage low-risk farming methods with high-reward environmental outcomes
NRDC Issue PaPer august 2013 IP:13-04-a
Farmers are increasingly relying on the subsidized Federal Crop Insurance Program to manage weather-related risks. However, federal crop insurance, does not adequately incentivize farmers to adopt risk-mitigating practices; instead, federal crop insurance encourages risky production methods and will become increasingly expensive to administer unless changes are made. soil-building farm management practices, such as no-till, cover cropping, and efficient irrigation management, reduce weather-related risks, such as droughts and floods. NrDC recommends that the Federal Crop Insurance Program promote such practices through a pilot program that reduces premium rates for farmers who use healthy soil to reduce risk. This type of pilot program would comply with all statutory requirements, reduce government expenditures, help farmers become more resistant to weather-related risks, and benefit the environment.
about the author Claire O’Connor Agricultural Water Policy Analyst, Water Program
Claire Althouse O’Connor is the Agricultural Water Policy Analyst in the NRDC Santa Monica Office. She focuses on designing and implementing solutions that are good for both farmers and people who eat the food that farmers grow to water challenges. Claire grew up as the fifth generation of family farmers in rural Nebraska. Her family taught her the importance of protecting natural resources so that future generations can carry on the family business. Today, her work focuses on using those same principles to promote food that is safe, healthy, and sustainable. She is a graduate of Georgetown University Law Center and the University of Nebraska-Lincoln.http://switchboard.nrdc.org/blogs/coconnor
about NrDCThe Natural Resources Defense Council (NRDC) is an international nonprofit environmental organization with more than 1.4 million members and online activists. Since 1970, our lawyers, scientists, and other environmental specialists have worked to protect the world's natural resources, public health, and the environment. NRDC has offices in New York City, Washington, D.C., Los Angeles, San Francisco, Chicago, Bozeman, and Beijing. Visit us at www.nrdc.org.
NRDC’s policy publications aim to inform and influence solutions to the world’s most pressing environmental and public health issues. For additional policy content, visit our online policy portal at www.nrdc.org/policy.
NRDC Director of Communications: Edwin ChenNRDC Deputy Director of Communications: Lisa GoffrediNRDC Policy Communications Director: Alex KennaughLead Editor: Elise MartonDesign and Production: www.suerossi.com
© Natural Resources Defense Council 2013
PagE 3 | soil matters
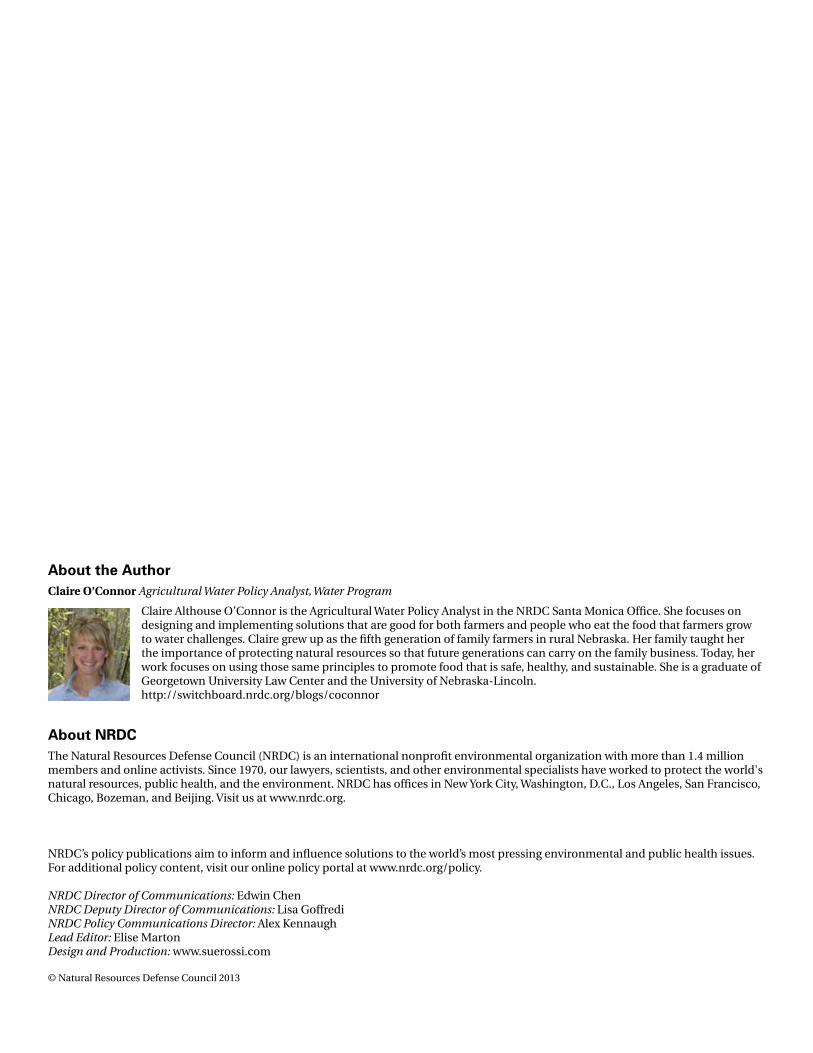
American farmers are increasingly turning to the Federal Crop Insurance
Program (FCIP) to manage weather-related risks, including crop loss. However,
the formula used to set FCIP premiums rewards production methods
with negative environmental consequences and misses an important opportunity
to encourage farmers to invest in soil health as a risk management strategy. The
soil-building management practices discussed in this paper have been shown to
simultaneously counteract negative environmental consequences and reduce the risk
of crop losses, in both the near term and the long term. NRDC encourages the FCIP
to offer a pilot program that reduces premiums for farmers who adopt soil-building
management practices. A pilot program for these management practices would benefit
producers and make the FCIP more financially sound, particularly because it would
equip farmers to become more resilient to climate change.
The weather has been tough on American farmers over the last few years. The 2012 growing season was the hottest, driest in decades, with more than 80 percent of agricultural lands nationwide experiencing drought.1 During the 2013 planting season drenching rains had delayed or prevented farmers from planting their crops in many regions, and had drowned newly planted seeds in others.2 Despite an inconveniently wet spring, by late summer, some regions were yet again nearing drought conditions.3
Unfortunately, the FCIP is creating destructive incentives for farmers, even as it is intended to help farmers manage their existing risks. As described in this paper, FCIP premiums are set using a formula that ignores how important healthy soil is to farmers’ risk management portfolios, while simultaneously encouraging farmers to make risky production decisions. Partially as a result of this flawed formula, the FCIP has created brittle farming operations that lack resilience and a spiral of ever-increasing taxpayer-subsidized indemnities.
PagE 4 | soil matters
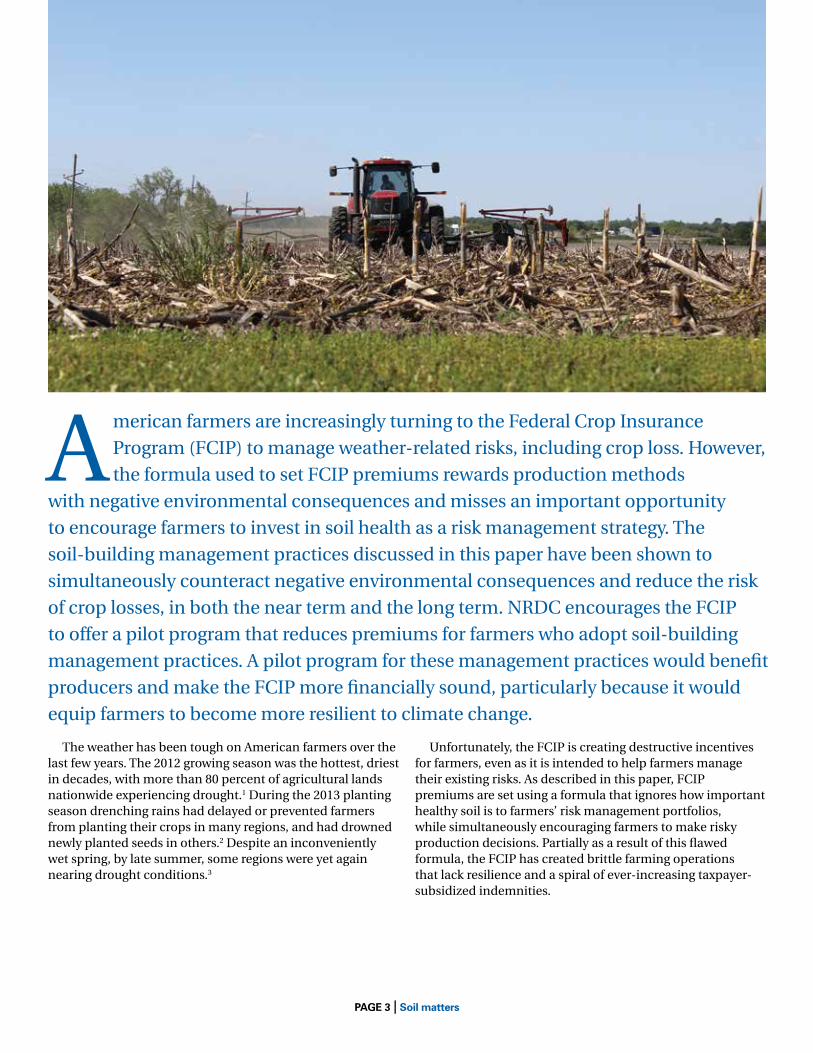
In 2011, the FCIP paid out a record-breaking $10.8 billion in crop insurance indemnities to farmers.4 That record lasted less than a year. Indemnities for the 2012 crop year topped $17.3 billion,5 with drought alone accounting for nearly $13 billion in losses.6 From 2001 to 2010, indemnities averaged just $4.1 billion a year, making the recent numbers even more striking.7 By ignoring how on-farm management affects farmers’ ability to withstand weather events like the recent droughts and floods, the FCIP has become a crutch on which farmers will increasingly be forced to lean while taxpayers pick up the ever-growing bill.
To avoid this scenario, the FCIP could empower farmers to use their farm management skills to become more resilient to extreme weather conditions. The FCIP could offer lower premiums to farmers who lessen their risk of crop loss by investing in technically sound management practices that both reduce the risk of loss in the near term and build soil health and increase productive capacity in the long term.8 In the short term, encouraging soil-building practices that increase soil moisture, improve water infiltration, and combat pest pressures will help decrease yield fluctuation due to unfavorable weather in a given year. In the long term, farmers who invest in soil health will increase their fields’ yield potential and be better prepared to face the challenge of a changing climate, in which extreme weather events are predicted to be more frequent and intense. Because these practices reduce the risk of crop loss, the FCIP can and should encourage them through an actuarially sound premium reduction.
WA
OR
CA
AK
HI
AZNM
TX LA
MS AL GA
SC
NCTN
KYVA
WV MD
VTNH
NJ
CT RI
DE
ME
MA
FL
MT
ID
NVUT
CO
WY
ND
SD
NE
KS
OKAR
MO
IA
MNWI
IL IN
MI
OH
PA
NY
TOTAL INDEMNITIES ($ in millions)
>1,000100-99910-991-9<1
% from drought, State heat, hot windIL 98%IA 97%IN 97%KY 96%MO 95%WI 94%KS 93%SD 93%NE 92%TX 75%
0
2.5
5.0
7.5
10.0
12.5
15.0
17.5
20.0
Crop
Insu
ranc
e In
dem
nitie
s ($
Bill
ions
)
2012201120102009200820072006200520042003200220012000
the rising Cost of Crop Insurance
Crop Insurance Claims for Drought-related Losses* in 2012
From 2001-2010, federal crop insurance indemnities averaged just $4.1 billion a year. However in 2011 and 2012, the FCIP paid out record-breaking amounts of $10.8 billion and $17.3 billion, respectively, with drought accounting for nearly $13 billion in 2012.
*Causes of loss = drought, heat, hot wind
PagE 5 | soil matters
hIstory aND struCturE of thE fEDEraL CroP INsuraNCE Program
The FCIP is the primary policy tool that farmers use to manage agricultural risk today. Congress created the program in 1938 in response to the devastation farmers faced from the Dust Bowl, though it was not widely used until increased subsidies were implemented in the 1990s.9 The FCIP is a public-private partnership between the U.S. Department of Agriculture’s Risk Management Agency (RMA) and 18 private insurance companies. The federal government subsidizes farmer-insured, as well as the private companies that sell and service the policies. Both the government and the private companies share in the underwriting risk, and policy rates are noncompetitively set by the RMA. In 2012, the FCIP covered more than 282 million acres, representing roughly 70 percent of the nation’s total cropland.10
Impacts of agriculture
agriculture is a significant part of the united states’ landscape. More than one-third of the country, over 900 million acres of land, is devoted to agriculture;a about half of those acres (around 400 million acres) are used to grow major commodity crops, like corn, soybeans, and wheat.b Because of its vast size, the u.s. agricultural industry has a significant impact on both the quality and the quantity of the country’s water resources. agriculture is the leading source of impairment of rivers and lakes in the united states.c One infamously impaired body of water is the Gulf of Mexico, where each summer a “dead zone” the size of New Jersey overtakes the fish, crustaceans, and other species that typically thrive in these warm waters.d The principal cause of this dead zone is agricultural pollution in the Mississippi river basin;e more than half of that pollution can be attributed to just two crops—corn and soybeans.f approximately 57 million acres of u.s. cropland are irrigated,g accounting for the withdrawal of about 91.2 million acre-feet of water annually.h Over the past three decades, the amount of irrigated farmland has grown at an average rate of half a million acres per year.i although irrigation has increased agricultural production, it has also contributed to the overdraft of some of the nation’s most valuable water resources. The Ogallala aquifer, for example, is a 174,000-square-mile “lake” that lies beneath eight states—south Dakota, Nebraska, Wyoming, Colorado, Kansas, Oklahoma, Texas, and New Mexico.j These eight states withdraw about 20.5 billion gallons of groundwater for irrigation each year.k as a result, groundwater levels in the Ogallala aquifer have significantly declined in much of the region,l and it may take centuries to recharge the Ogallala to its original levels.m
a usDa, National agricultural statistics service, Quick stats, Farm Operations—Area Operated 2012, http://quickstats.nass.usda.gov/data/printable/19B3e5aB-aeB3-31D3-Be7C-CB6D2e508eC7.
b Craig Osteen, et. al., “agricultural resources and environmental Indicators, 2012 edition,” economic research service, economic Information Bulletin No. 98 (2012).
c Marc ribaudo and robert Johansson, “Water Quality: Impacts of agriculture,” in agricultural resources and environmental Indicators, usDa economic research service (2006).
d Committee on environment and Natural resources, “scientific assessment of Hypoxia in u.s. Coastal Waters 26 2010”.
e Ibid.
f Christine Costello et al., “Impact of Biofuel Crop Production on the Formation of Hypoxia in the Gulf of Mexico,” Environmental Science and Technology 43:7895 (2009).
g Osteen, supra note b.
h Ibid.
i Ibid.
j William M. alley, “sustainability of Ground-Water resources” 26, u.s. Geological survey (1999).
k u.s. Geological survey, “estimated use of Water in the united states in 2005,” Circular 1344, 5.
l C.L. Walthall, et al., "Climate Change and agriculture in the united states: effects and adaptation," usDa Technical Bulletin 1935 (2012).
m Joseph sax, et al., Legal Control of Water Resources (2007). 4th edition, West.
The FCIP offers a triple layer of subsidies to farmers: subsidies of the premiums paid by farmers, subsidies for the administrative and operating expenses of the private insurance companies that sell and service the policies, and subsidies of a portion of the private insurance companies’ losses.
On average, approximately 60 percent of each FCIP premium is subsidized by the federal government.11 The subsidized crop insurance premiums are tiered according to how much insurance an individual farmer buys. “Catastrophic coverage” only indemnifies losses of 50 percent or more of a farmer’s productive value (the equivalent of a 50 percent deductible) and is fully subsidized by the federal government.12 Farmers may “buy up” beyond catastrophic coverage, indemnifying up to 85 percent of their typical production value (the equivalent of a 15 percent deductible).13 Depending on what level of coverage a farmer buys, the FCIP subsidizes between 67 percent and 38 percent of the market value of the additional “buy up” coverage.14
PagE 6 | soil matters
The Standard Reinsurance Agreement (SRA) between the RMA and the private companies sets the subsidies paid to the private companies that manage the FCIP for “administrative and operating expenses.”15 The SRA provides different levels of administrative and operating expenses for different types of policies, but the typical subsidy is 18.5 percent of the farmer-paid portion of the premium.16
The SRA also governs the risk-sharing agreement between the private companies and the RMA.17 In general, the higher the loss, the less risk retained by the private company.18 Once the private insurance providers have written their entire “book of business”19 for the year, they determine which individual policies they wish to retain the premium and liability for, and which policies they intend to cede completely to the federal government.20 The private companies are required to keep 20 percent of the policies they consider to be high risk, and at least 35 percent of their entire book of business in each state.21 The underwriting gains and losses from the retained policies are further shared with the federal government at different rates that depend on the loss ratio in each state.22 Companies whose indemnities are slightly below the amount of premiums they have brought in can keep up to 97.5 percent of the underwriting gain in certain states.23 Once all gains and losses from the year have been calculated, the private companies transfer 6.5 percent of their total underwriting gains or losses to the federal government through a settlement payment.24
FCIP premiums are set by the RMA using a formula designed to match premiums to the amount of losses.25 When setting premiums to achieve this target loss ratio of 1, the RMA uses a historical “loss cost” method.26 The loss cost method requires RMA to average individual loss rates across individual exposure experiences to create county-level aggregate base rates.27 RMA then uses county base rates to calculate how premiums should be set for varying degrees of coverage. RMA therefore looks at the past to set premiums in the present—a process known as “loss cost ratemaking”.
thE fEDEraL CroP INsuraNCE Program NEEDs rEform
There are two major problems with the current structure of the FCIP: The formula the RMA uses to set premium rates attracts high-risk producers, and the structure of the program incentivizes production choices that damage natural resources and increase the risk of crop loss.28 In light of the fact that the FCIP costs taxpayers29 more than $14 billion a year,30 its current structure should be reformed to more efficiently use taxpayer dollars, to encourage risk-mitigating practices, and to better protect our nation’s natural resources.
approved Insurance Providers
eighteen crop insurance companies are approved to write FCIP policies in the 2014 crop year. Many of these companies have corporate parents that are well known in the insurance world. The following companies (and their parents) are approved insurance providers for 2013:a
n rain and Hail LLC (aCe american Insurance Company)
n aDM Crop risk services (agrinational Insurance Company, Inc.)
n arMtech Insurance services, Inc. (american agri-Business Insurance Company)
n american Farm Bureau Insurance services, Inc. (american agricultural Insurance Company)
n Country Mutual Insurance Company
n Heartland Crop Insurance, Inc. (everest reinsurance Company)
n Farmers Mutual Hail Insurance Company of Iowa
n Great american Insurance Company
n CGB Diversified Crop Insurance services (GuideOne Mutual Insurance Company)
n The Climate Corporation
n Hudson Insurance Company
n John Deere risk Protection, Inc. (John Deere Insurance Company)
n Nau Country Insurance Company
n agriLogic Insurance services LLC (Occidental Fire & Casualty Company of North Carolina)
n Pro ag Management, Inc. (Producers agriculture Insurance Company)
n rural Community Insurance services (rural Community Insurance Company)
n International agricultural Insurance solutions, LLC (starr Indemnity and Liability Company)
n Global ag Insurance services, LLP (XL reinsurance america, Inc.)
a risk Management agency, “Crop Insurance Providers List for 2013,” http://www3.rma.usda.gov/tools/agents/companies/indexCI.cfm.
PagE 7 | soil matters
Loss Cost ratEmakINg attraCts rIsky ProDuCErs aND DIsCouragEs Low-rIsk farmErsBecause loss cost ratemaking relies only on historical data, it depends on a constant relationship between yield and indemnities in order to remain actuarially fair; if either insured value or risk of loss (the two variables in the loss cost ratio) changes more quickly than the other, loss cost ratemaking will set inaccurate premiums. This means that if farm yields trend upward but the risk of loss remains unchanged, loss cost ratemaking would cause farmers to overpay for insurance.31 Conversely, if farming practices increase the risk of loss over time, loss cost ratemaking would set premiums too low.32 Indeed, studies have shown that loss cost ratemaking overcharges low-risk producers and undercharges high-risk producers.33,34 As a result, this underwriting technique attracts high-risk farmers and discourages low-risk farmers,35 and will continue to lead to increased levels of taxpayer-subsidized indemnities36 and program costs over time.37,38
Loss Cost ratEmakINg INCENtIvIzEs rIsky PraCtICEs that DamagEs NaturaL rEsourCEsBecause rates are noncompetitively set by the RMA, there are very few market signals that private insurance companies can send to farmers to make risk-reducing choices. This stands in contrast to, for example, private home insurance companies that may offer discounts to policyholders whose houses are equipped with alarm systems to encourage more homeowners to invest in alarms.39 In fact, the FCIP actually tends to encourage farmers to make riskier choices,40 such as planting crops on fields that are not well suited to agricultural production,41 because farmers who do so pay disproportionately low premium rates compared with farmers who make risk-reducing management decisions, as described above.42 When land that is not well suited for major commodity crops is shifted into production, it can increase erosion, chemical inputs, and other negative environmental impacts.43
ImProvED soIL hEaLth CaN CouNtEraCt aCtuarIaL aND ENvIroNmENtaL ProbLEms
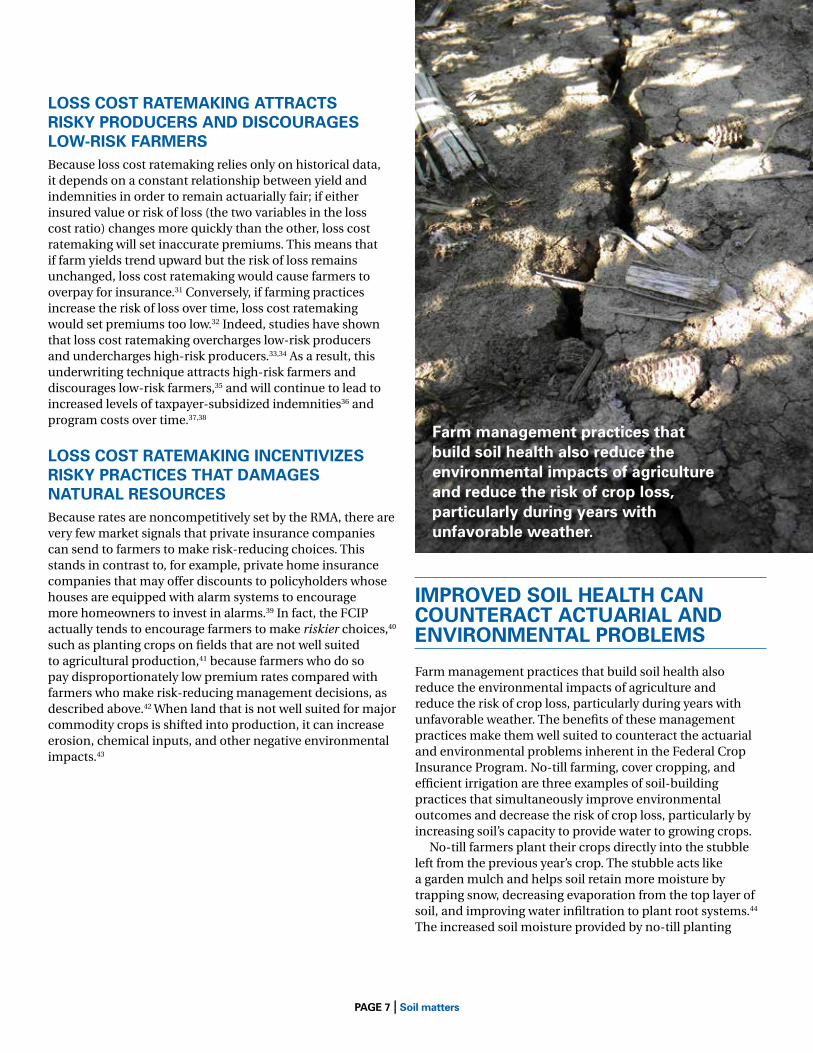
Farm management practices that build soil health also reduce the environmental impacts of agriculture and reduce the risk of crop loss, particularly during years with unfavorable weather. The benefits of these management practices make them well suited to counteract the actuarial and environmental problems inherent in the Federal Crop Insurance Program. No-till farming, cover cropping, and efficient irrigation are three examples of soil-building practices that simultaneously improve environmental outcomes and decrease the risk of crop loss, particularly by increasing soil’s capacity to provide water to growing crops.
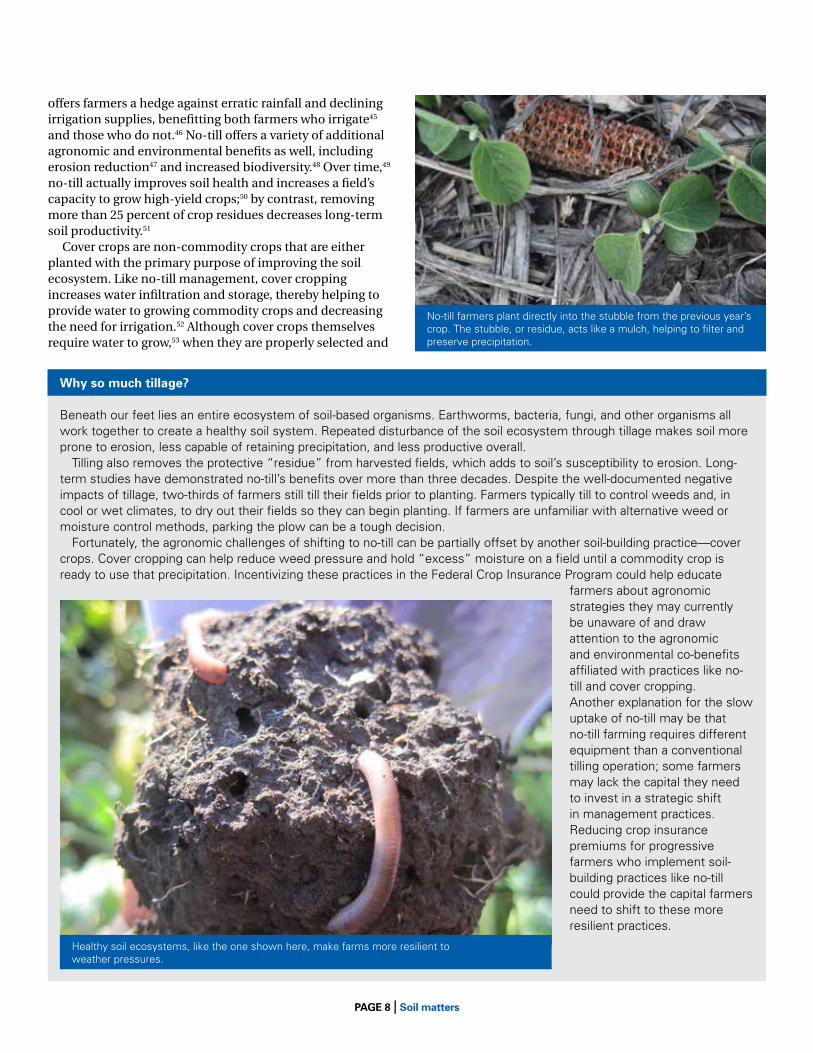
No-till farmers plant their crops directly into the stubble left from the previous year’s crop. The stubble acts like a garden mulch and helps soil retain more moisture by trapping snow, decreasing evaporation from the top layer of soil, and improving water infiltration to plant root systems.44 The increased soil moisture provided by no-till planting
farm management practices that build soil health also reduce the environmental impacts of agriculture and reduce the risk of crop loss, particularly during years with unfavorable weather.
PagE 8 | soil matters
offers farmers a hedge against erratic rainfall and declining irrigation supplies, benefitting both farmers who irrigate45 and those who do not.46 No-till offers a variety of additional agronomic and environmental benefits as well, including erosion reduction47 and increased biodiversity.48 Over time,49 no-till actually improves soil health and increases a field’s capacity to grow high-yield crops;50 by contrast, removing more than 25 percent of crop residues decreases long-term soil productivity.51
Cover crops are non-commodity crops that are either planted with the primary purpose of improving the soil ecosystem. Like no-till management, cover cropping increases water infiltration and storage, thereby helping to provide water to growing commodity crops and decreasing the need for irrigation.52 Although cover crops themselves require water to grow,53 when they are properly selected and
why so much tillage?
Beneath our feet lies an entire ecosystem of soil-based organisms. earthworms, bacteria, fungi, and other organisms all work together to create a healthy soil system. repeated disturbance of the soil ecosystem through tillage makes soil more prone to erosion, less capable of retaining precipitation, and less productive overall. Tilling also removes the protective “residue” from harvested fields, which adds to soil’s susceptibility to erosion. Long-term studies have demonstrated no-till’s benefits over more than three decades. Despite the well-documented negative impacts of tillage, two-thirds of farmers still till their fields prior to planting. Farmers typically till to control weeds and, in cool or wet climates, to dry out their fields so they can begin planting. If farmers are unfamiliar with alternative weed or moisture control methods, parking the plow can be a tough decision. Fortunately, the agronomic challenges of shifting to no-till can be partially offset by another soil-building practice—cover crops. Cover cropping can help reduce weed pressure and hold “excess” moisture on a field until a commodity crop is ready to use that precipitation. Incentivizing these practices in the Federal Crop Insurance Program could help educate
farmers about agronomic strategies they may currently be unaware of and draw attention to the agronomic and environmental co-benefits affiliated with practices like no-till and cover cropping.
another explanation for the slow uptake of no-till may be that no-till farming requires different equipment than a conventional tilling operation; some farmers may lack the capital they need to invest in a strategic shift in management practices. reducing crop insurance premiums for progressive farmers who implement soil-building practices like no-till could provide the capital farmers need to shift to these more resilient practices.
Healthy soil ecosystems, like the one shown here, make farms more resilient to weather pressures.
No-till farmers plant directly into the stubble from the previous year’s crop. The stubble, or residue, acts like a mulch, helping to filter and preserve precipitation.
PagE 9 | soil matters
Farmers who irrigate often apply water using a fixed schedule or make adjustments based on the “look and feel” of their soil.65 Irrigators who actively assess soil moisture and time their applications accordingly tend to be more efficient in their water use than their peers.66 Farmers who schedule irrigation according to readings from soil moisture monitors and the evapotranspiration67 rate of crops can improve their yields while using less water.68 Not only does this reduce farmers’ costs in the short term,69 but conserved water is potentially banked for future, drier years.
These soil-building management practices—no-till, cover cropping, and efficient irrigation management—are three key techniques that farmers can use, alone or in combination, to protect both natural resources and their bottom lines. Unfortunately, even though these practices reduce financial risk and improve environmental outcomes, the loss cost formula used to set premiums under the FCIP prevents farmers who employ these methods from receiving the actuarial benefits of their actions.
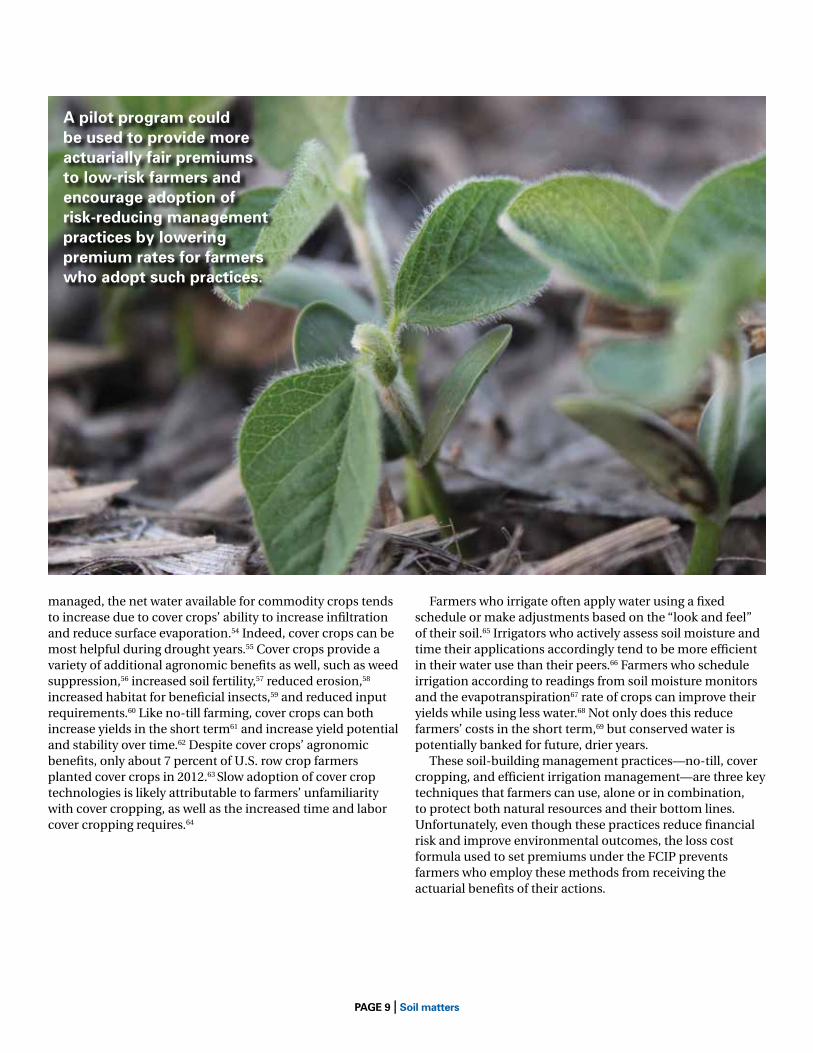
managed, the net water available for commodity crops tends to increase due to cover crops’ ability to increase infiltration and reduce surface evaporation.54 Indeed, cover crops can be most helpful during drought years.55 Cover crops provide a variety of additional agronomic benefits as well, such as weed suppression,56 increased soil fertility,57 reduced erosion,58 increased habitat for beneficial insects,59 and reduced input requirements.60 Like no-till farming, cover crops can both increase yields in the short term61 and increase yield potential and stability over time.62 Despite cover crops’ agronomic benefits, only about 7 percent of U.S. row crop farmers planted cover crops in 2012.63 Slow adoption of cover crop technologies is likely attributable to farmers’ unfamiliarity with cover cropping, as well as the increased time and labor cover cropping requires.64
a pilot program could be used to provide more actuarially fair premiums to low-risk farmers and encourage adoption of risk-reducing management practices by lowering premium rates for farmers who adopt such practices.
PagE 10 | soil matters
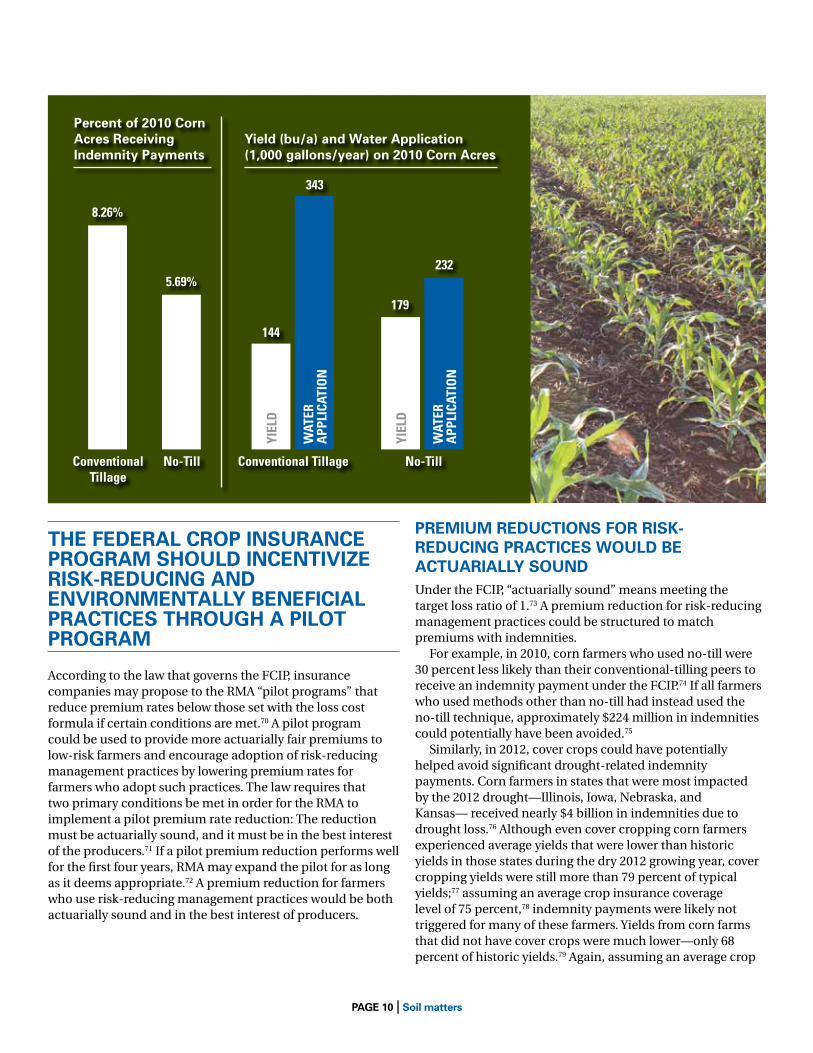
Percent of 2010 Corn acres receiving Indemnity Payments
yield (bu/a) and water application (1,000 gallons/year) on 2010 Corn acres
Conventional Tillage
8.26%
144
179
232
343
5.69%
Conventional Tillage
YIEL
D
WaT
Er
app
LICa
TIo
n
YIEL
D
WaT
Er
app
LICa
TIo
nno-Till no-Till
PrEmIum rEDuCtIoNs for rIsk-rEDuCINg PraCtICEs wouLD bE aCtuarIaLLy souND Under the FCIP, “actuarially sound” means meeting the target loss ratio of 1.73 A premium reduction for risk-reducing management practices could be structured to match premiums with indemnities.
For example, in 2010, corn farmers who used no-till were 30 percent less likely than their conventional-tilling peers to receive an indemnity payment under the FCIP.74 If all farmers who used methods other than no-till had instead used the no-till technique, approximately $224 million in indemnities could potentially have been avoided.75
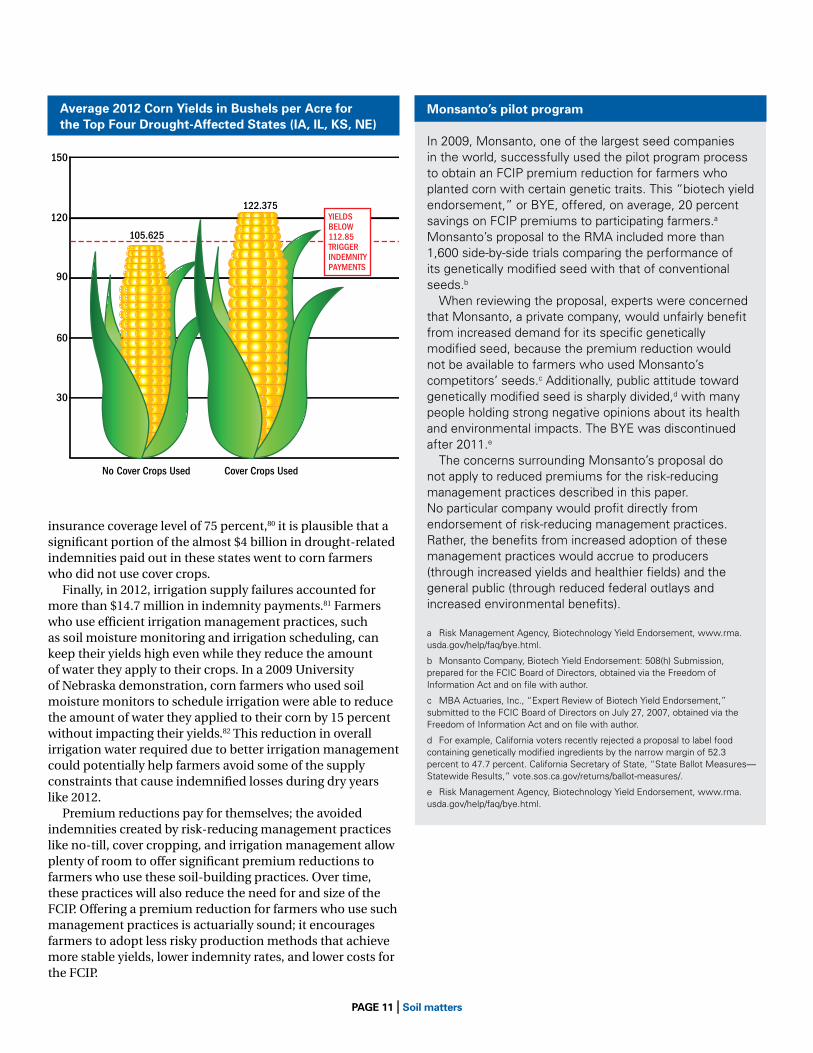
Similarly, in 2012, cover crops could have potentially helped avoid significant drought-related indemnity payments. Corn farmers in states that were most impacted by the 2012 drought—Illinois, Iowa, Nebraska, and Kansas— received nearly $4 billion in indemnities due to drought loss.76 Although even cover cropping corn farmers experienced average yields that were lower than historic yields in those states during the dry 2012 growing year, cover cropping yields were still more than 79 percent of typical yields;77 assuming an average crop insurance coverage level of 75 percent,78 indemnity payments were likely not triggered for many of these farmers. Yields from corn farms that did not have cover crops were much lower—only 68 percent of historic yields.79 Again, assuming an average crop
thE fEDEraL CroP INsuraNCE Program shouLD INCENtIvIzE rIsk-rEDuCINg aND ENvIroNmENtaLLy bENEfICIaL PraCtICEs through a PILot Program
According to the law that governs the FCIP, insurance companies may propose to the RMA “pilot programs” that reduce premium rates below those set with the loss cost formula if certain conditions are met.70 A pilot program could be used to provide more actuarially fair premiums to low-risk farmers and encourage adoption of risk-reducing management practices by lowering premium rates for farmers who adopt such practices. The law requires that two primary conditions be met in order for the RMA to implement a pilot premium rate reduction: The reduction must be actuarially sound, and it must be in the best interest of the producers.71 If a pilot premium reduction performs well for the first four years, RMA may expand the pilot for as long as it deems appropriate.72 A premium reduction for farmers who use risk-reducing management practices would be both actuarially sound and in the best interest of producers.
PagE 11 | soil matters
monsanto’s pilot program
In 2009, Monsanto, one of the largest seed companies in the world, successfully used the pilot program process to obtain an FCIP premium reduction for farmers who planted corn with certain genetic traits. This “biotech yield endorsement,” or BYe, offered, on average, 20 percent savings on FCIP premiums to participating farmers.a Monsanto’s proposal to the rMa included more than 1,600 side-by-side trials comparing the performance of its genetically modified seed with that of conventional seeds.b When reviewing the proposal, experts were concerned that Monsanto, a private company, would unfairly benefit from increased demand for its specific genetically modified seed, because the premium reduction would not be available to farmers who used Monsanto’s competitors’ seeds.c additionally, public attitude toward genetically modified seed is sharply divided,d with many people holding strong negative opinions about its health and environmental impacts. The BYe was discontinued after 2011.e The concerns surrounding Monsanto’s proposal do not apply to reduced premiums for the risk-reducing management practices described in this paper. No particular company would profit directly from endorsement of risk-reducing management practices. rather, the benefits from increased adoption of these management practices would accrue to producers (through increased yields and healthier fields) and the general public (through reduced federal outlays and increased environmental benefits).
a risk Management agency, Biotechnology Yield endorsement, www.rma.usda.gov/help/faq/bye.html.
b Monsanto Company, Biotech Yield endorsement: 508(h) submission, prepared for the FCIC Board of Directors, obtained via the Freedom of Information act and on file with author.
c MBa actuaries, Inc., “expert review of Biotech Yield endorsement,” submitted to the FCIC Board of Directors on July 27, 2007, obtained via the Freedom of Information act and on file with author.
d For example, California voters recently rejected a proposal to label food containing genetically modified ingredients by the narrow margin of 52.3 percent to 47.7 percent. California secretary of state, “state Ballot Measures—statewide results,” vote.sos.ca.gov/returns/ballot-measures/.
e risk Management agency, Biotechnology Yield endorsement, www.rma.usda.gov/help/faq/bye.html.
insurance coverage level of 75 percent,80 it is plausible that a significant portion of the almost $4 billion in drought-related indemnities paid out in these states went to corn farmers who did not use cover crops.
Finally, in 2012, irrigation supply failures accounted for more than $14.7 million in indemnity payments.81 Farmers who use efficient irrigation management practices, such as soil moisture monitoring and irrigation scheduling, can keep their yields high even while they reduce the amount of water they apply to their crops. In a 2009 University of Nebraska demonstration, corn farmers who used soil moisture monitors to schedule irrigation were able to reduce the amount of water they applied to their corn by 15 percent without impacting their yields.82 This reduction in overall irrigation water required due to better irrigation management could potentially help farmers avoid some of the supply constraints that cause indemnified losses during dry years like 2012.
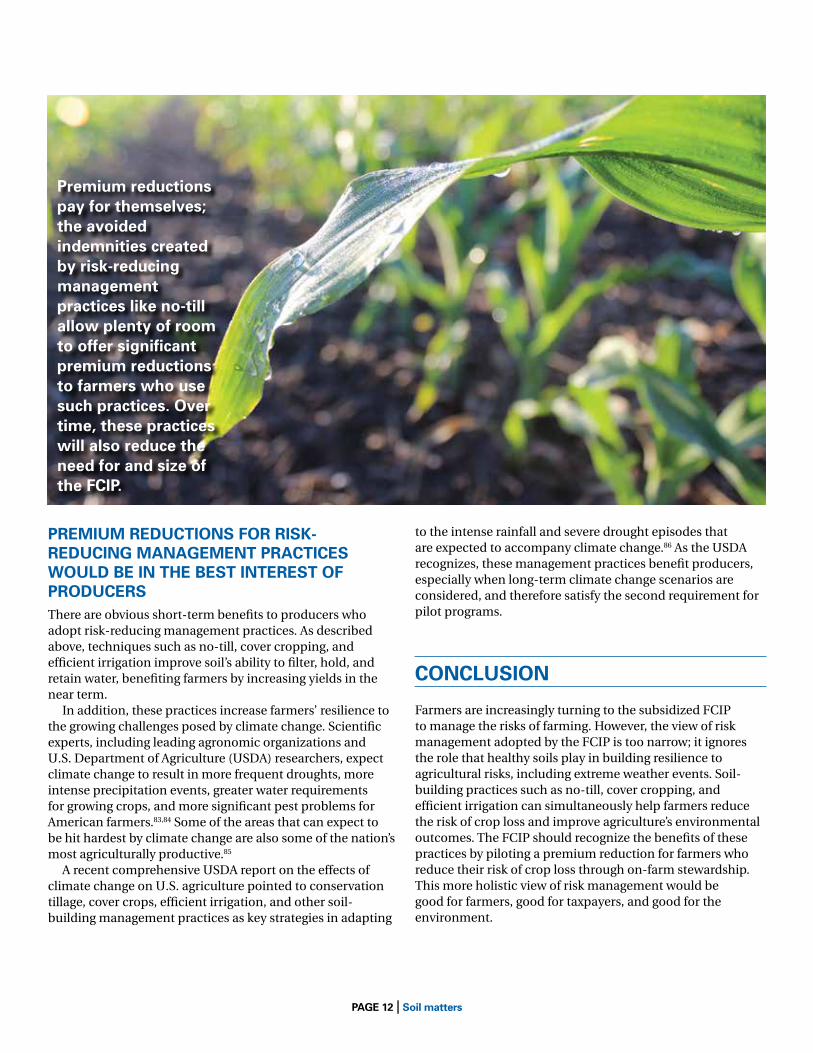
Premium reductions pay for themselves; the avoided indemnities created by risk-reducing management practices like no-till, cover cropping, and irrigation management allow plenty of room to offer significant premium reductions to farmers who use these soil-building practices. Over time, these practices will also reduce the need for and size of the FCIP. Offering a premium reduction for farmers who use such management practices is actuarially sound; it encourages farmers to adopt less risky production methods that achieve more stable yields, lower indemnity rates, and lower costs for the FCIP.
average 2012 Corn yields in bushels per acre for the top four Drought-affected states (Ia, IL, ks, NE)
150
105.625
122.375120
90
60
30
Cover Crops UsedNo Cover Crops Used
Average 2012 Corn Yields in Bushes per Acre for the top four drought-affected states (KS, NE, IA, IL)
YIELDS BELOW 112.85 TRIGGER INDEMNITYPAYMENTS
PagE 12 | soil matters
PrEmIum rEDuCtIoNs for rIsk-rEDuCINg maNagEmENt PraCtICEs wouLD bE IN thE bEst INtErEst of ProDuCErsThere are obvious short-term benefits to producers who adopt risk-reducing management practices. As described above, techniques such as no-till, cover cropping, and efficient irrigation improve soil’s ability to filter, hold, and retain water, benefiting farmers by increasing yields in the near term.
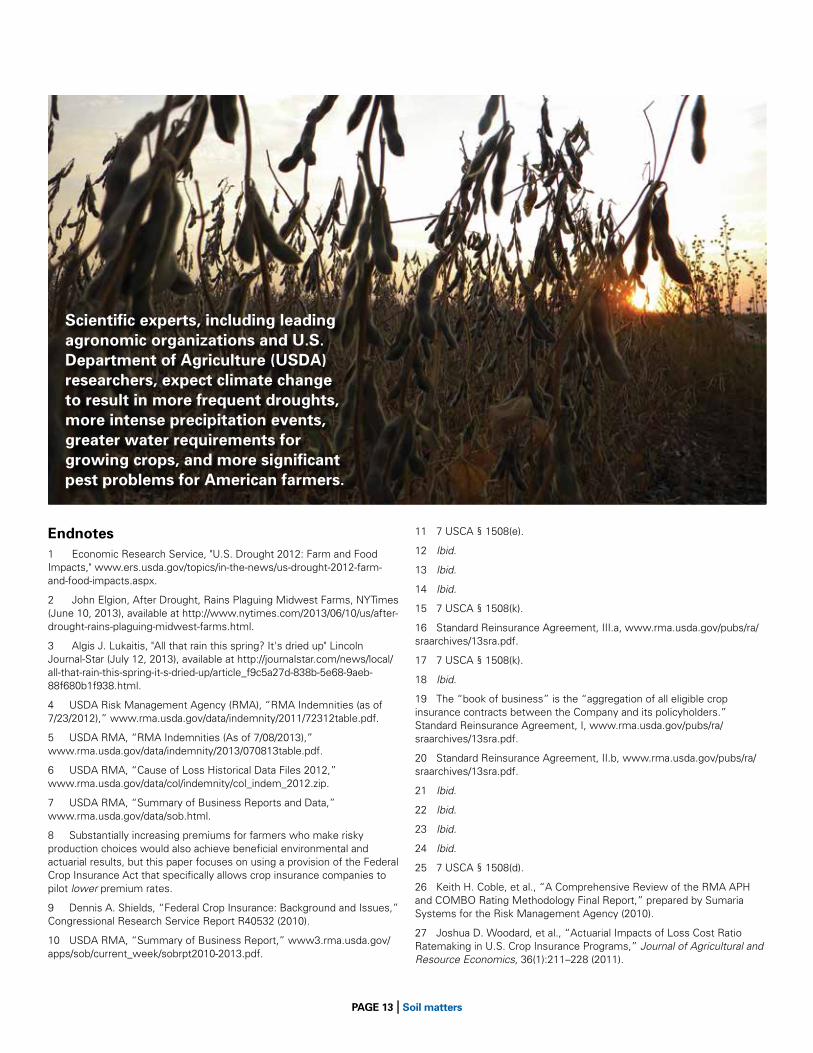
In addition, these practices increase farmers’ resilience to the growing challenges posed by climate change. Scientific experts, including leading agronomic organizations and U.S. Department of Agriculture (USDA) researchers, expect climate change to result in more frequent droughts, more intense precipitation events, greater water requirements for growing crops, and more significant pest problems for American farmers.83,84 Some of the areas that can expect to be hit hardest by climate change are also some of the nation’s most agriculturally productive.85
A recent comprehensive USDA report on the effects of climate change on U.S. agriculture pointed to conservation tillage, cover crops, efficient irrigation, and other soil-building management practices as key strategies in adapting
to the intense rainfall and severe drought episodes that are expected to accompany climate change.86 As the USDA recognizes, these management practices benefit producers, especially when long-term climate change scenarios are considered, and therefore satisfy the second requirement for pilot programs.
CoNCLusIoN
Farmers are increasingly turning to the subsidized FCIP to manage the risks of farming. However, the view of risk management adopted by the FCIP is too narrow; it ignores the role that healthy soils play in building resilience to agricultural risks, including extreme weather events. Soil-building practices such as no-till, cover cropping, and efficient irrigation can simultaneously help farmers reduce the risk of crop loss and improve agriculture’s environmental outcomes. The FCIP should recognize the benefits of these practices by piloting a premium reduction for farmers who reduce their risk of crop loss through on-farm stewardship. This more holistic view of risk management would be good for farmers, good for taxpayers, and good for the environment.
Premium reductions pay for themselves; the avoided indemnities created by risk-reducing management practices like no-till allow plenty of room to offer significant premium reductions to farmers who use such practices. over time, these practices will also reduce the need for and size of the fCIP.
PagE 13 | soil matters
scientific experts, including leading agronomic organizations and u.s. Department of agriculture (usDa) researchers, expect climate change to result in more frequent droughts, more intense precipitation events, greater water requirements for growing crops, and more significant pest problems for american farmers.
Endnotes1 economic research service, "u.s. Drought 2012: Farm and Food Impacts," www.ers.usda.gov/topics/in-the-news/us-drought-2012-farm-and-food-impacts.aspx.
2 John elgion, after Drought, rains Plaguing Midwest Farms, NYTimes (June 10, 2013), available at http://www.nytimes.com/2013/06/10/us/after-drought-rains-plaguing-midwest-farms.html.
3 algis J. Lukaitis, "all that rain this spring? It's dried up" Lincoln Journal-star (July 12, 2013), available at http://journalstar.com/news/local/all-that-rain-this-spring-it-s-dried-up/article_f9c5a27d-838b-5e68-9aeb-88f680b1f938.html.
4 usDa risk Management agency (rMa), “rMa Indemnities (as of 7/23/2012),” www.rma.usda.gov/data/indemnity/2011/72312table.pdf.
5 usDa rMa, “rMa Indemnities (as of 7/08/2013),” www.rma.usda.gov/data/indemnity/2013/070813table.pdf.
6 usDa rMa, “Cause of Loss Historical Data Files 2012,” www.rma.usda.gov/data/col/indemnity/col_indem_2012.zip.
7 usDa rMa, “summary of Business reports and Data,” www.rma.usda.gov/data/sob.html.
8 substantially increasing premiums for farmers who make risky production choices would also achieve beneficial environmental and actuarial results, but this paper focuses on using a provision of the Federal Crop Insurance act that specifically allows crop insurance companies to pilot lower premium rates.
9 Dennis a. shields, “Federal Crop Insurance: Background and Issues,” Congressional research service report r40532 (2010).
10 usDa rMa, “summary of Business report,” www3.rma.usda.gov/apps/sob/current_week/sobrpt2010-2013.pdf.
11 7 usCa § 1508(e).
12 Ibid.
13 Ibid.
14 Ibid.
15 7 usCa § 1508(k).
16 standard reinsurance agreement, III.a, www.rma.usda.gov/pubs/ra/sraarchives/13sra.pdf.
17 7 usCa § 1508(k).
18 Ibid.
19 The “book of business” is the “aggregation of all eligible crop insurance contracts between the Company and its policyholders.” standard reinsurance agreement, I, www.rma.usda.gov/pubs/ra/sraarchives/13sra.pdf.
20 standard reinsurance agreement, II.b, www.rma.usda.gov/pubs/ra/sraarchives/13sra.pdf.
21 Ibid.
22 Ibid.
23 Ibid.
24 Ibid.
25 7 usCa § 1508(d).
26 Keith H. Coble, et al., “a Comprehensive review of the rMa aPH and COMBO rating Methodology Final report,” prepared by sumaria systems for the risk Management agency (2010).
27 Joshua D. Woodard, et al., “actuarial Impacts of Loss Cost ratio ratemaking in u.s. Crop Insurance Programs,” Journal of Agricultural and Resource Economics, 36(1):211–228 (2011).
PagE 14 | soil matters
28 These problems may be characterized as what is known in the insurance world as “adverse selection” and “moral hazard.”
29 Taxpayer costs to administer the FCIP include premium subsidies, administrative subsidies to the private companies, and indemnity costs.
30 rMa, “Fiscal Year Government Cost of Federal Crop Insurance,” www.rma.usda.gov/aboutrma/budget/fycost2003-12.pdf.
31 For example, if a farmer wants to insure a corn yield of 100 bushels per acre and he has an approved yield of 125 bushels per acre based on the 10-year actual production history, he will need to buy 80 percent coverage. If that same farmer adopted practices so that in recent years he actually produced 150 bushels per acre, his yield will be dragged down by the earlier years with lower yields. If the farmer now actually produces closer to 150 bushels per acre in a typical year, he is paying for 80 percent coverage but receiving only 67 percent coverage.
32 Octavio a. ramirez, et al., “Can Crop Insurance Premiums Be reliably estimated?” Agricultural and Resource Economics Review 40/1: 81–94 (2011).
33 Woodard, supra note 27.
34 rMa recently offered farmers an option to purchase a “yield adjustment” for certain policies in certain areas; however, this ad hoc adjustment does not address the systemic issues with loss cost ratemaking, nor does it deal with the problem of farmers whose risky behavior causes them to be undercharged for their insurance. see rMa, “FCIC Board approves aPH Yield Option for Insured Corn and soybeans in 14 states,” press release (sept. 23, 2011), www.rma.usda.gov/news/2011/09/aphyield.html.
35 see Cory G. Walters, et al., “Crop Insurance, Land allocation, and the environment,” Journal of Agricultural and Resource Economics 37/2:301-320 (2012).
36 U.S. Government accountability Office, “Climate Change: Financial risks to Federal and Private Insurers in Coming Decades are Potentially significant,” GAO-07-285 (2007) [hereinafter GaO report].
37 ramirez, supra note 32.
38 see note 34.
39 see, e.g., Liberty Mutual Insurance, “Home Insurance Discounts,” www.libertymutual.com/home-insurance/home-coverages-and-benefits/home-insurance-save-money.
40 Cf. robert McLeman and Barry smit, “Vulnerability to Climate Change Hazards and risks: Crop and Flood Insurance,” The Canadian Geographer 50:217 (2006) (finding that subsidized crop insurance in New Zealand resulted in increased production on marginal land, but once subsidies were removed, farmers stopped putting marginal land into production).
41 JunJie Wu, “Crop Insurance, acreage Decisions, and Nonpoint-source Pollution,” American Journal of Agricultural Economics 81:305 (1999); cf. Barry K. Goodwin, et al., “an empirical analysis of acreage effects of Participation in the Federal Crop Insurance Program,” American Journal of Agricultural Economics 86:1058 (2004); and Walters, supra note 35 (finding a statistically significant, though modest, increase in crop acreage due to crop insurance); and Michael J. roberts, et al., “estimating the extent of Moral Hazard in Crop Insurance using administrative Data,” Review of Agricultural Economics 28:381 (2006) NOT Peer reVIeWeD (finding limited evidence of increased yield variability due to moral hazard in crop insurance).
42 See ruiquing Miao, et al., “Land use Consequences of Crop Insurance subsidies,” selected paper prepared for presentation at the agricultural & applied economics association’s aaea & Narea Joint annual Meeting, Pittsburgh, Pennsylvania, July 24-26, 2011.
43 Wu, supra note 41; see also Walters, supra note 35.
44 Craig Osteen, et al., “agricultural resources and environmental Indicators, 2012 edition,” economic research service, economic Information Bulletin No. 98 (2012).
45 economic research service, “Crop Production Practices for Corn: all survey states,” www.ers.usda.gov/data-products/arms-farm-financial-and-crop-production-practices/tailored-reports.aspx?reportPath=/arMsr4/CrossTab&survey_abb=CrOP&subject_num=1&report_num=17&series=TILLTYP&fips_st=00&series2=FarM&statYear=2010.
46 see Lloyd r. stone and alan J. schlegel, “Tillage and Crop rotation Phase effects on soil Physical Properties in the West-Central Great Plains,” Agronomy Journal 102:483 (2010) (finding significantly more precipitation infiltration in no-till systems than in tilled systems).
47 see X.-C. (John) Zhang, “Cropping and Tillage systems effects on soil erosion under Climate Change in Oklahoma,” Soil Science Society of America Journal 76:1789 (2012) (finding that soil loss is positively related to tillage and negatively related to residue cover and concluding that no-till is one method to prevent soil erosion from increasing due to climate change). erosion, or soil loss, has negative agronomic and environmental consequences. From an agronomic perspective, when soil erodes, it takes everything in the soil with it—including seeds, fertilizers, applied pesticides, and beneficial microbes—and diminishes the resources available to the crop. From an environmental perspective, water laden with soil (or sediment) affects the ability of fish and other organisms to perform their natural functions. Furthermore, eroded soil often contains chemical inputs, such as fertilizers and pesticides, that can be harmful to humans and other biological life that comes in contact with those chemicals.
48 see alegra M. Galle, et al., “avian use of Harvested Crop Fields in North Dakota During spring Migration,” Western North American Naturalist 69:491 (2009) (finding that untilled fields provided beneficial habitat for migratory birds in North Dakota’s Prairie Pothole region). Biological diversity is important from both an agronomic and an environmental perspective. From an agronomic perspective, biological diversity provides a range of nutrients and beneficial enzymes that aid growing crops. From an environmental perspective, it increases ecosystem resilience.
49 It should be noted that some benefits of no-till accrue more quickly than others. some, such as restoration of beneficial soil biota, take three to five years to become evident and continue to grow over time. However, other benefits of no-till, such as increased residue coverage, have an immediate positive impact on erosion and soil moisture. see Tami L. stubbs, et al., “soil ecosystem Changes During the Transition to No-Till Cropping,” Journal of Crop Improvement 11:105 (2004).
50 see Dustin K. Toliver, et al., “effects of No-Tillage Production Practices on Crop Yields as Influenced by Crop and Growing environment Factors,” selected paper prepared for presentation at the southern agricultural economics association annual Meeting (2011), Corpus Christi, Texas, February 5-8, 2011, ageconsearch.umn.edu/bitstream/98818/2/Dustin%20Toliver%202011%20saea%20selected%20Paper.pdf (finding that, when data from 1964-2005 were aggregated, most no-till fields had higher yields than conventional- or reduced-till fields, and that yields were positively correlated to the length of time that no-till had been in practice); see also randy Pryor, “No-Till Farming in Dryland Cropping systems,” university of Nebraska–Lincoln extension, report No. eC196-2 (2006).
51 Dustin r. Wiggans, et al., “Maize Water use in Living Mulch systems with stover removal,” Crop Science 52:327 (2012).
52 Humberto Blanco-Canqui, “addition of Cover Crops enhances No-till Potential for Improving soil Physical Properties,” soil & Water Management & Conservation 75:1471 (2011).
PagE 15 | soil matters
53 see Jason L. De Bruin, et al., “use of a rye Cover Crop Following Corn in rotation with soybean in the upper Midwest,” Agronomy Journal 97:587 (2005).
54 Blanco-Canqui, supra note 52.
55 stacey M. Williams and ray r. Weil, “Crop Cover root Channels May alleviate soil Compaction effects on soybean Crops,” Soil Science Society of America Journal 68:1403 (2004).
56 e.a. Nord, et al., "Integrating Multiple Tactics for Managing Weeds in High residue No Till soybean," agronomy Journal 103:1542 (2011).
57 s.s. snapp et al., “evaluating Cover Crops for Benefits, Costs and Performance Within Cropping system Niches,” agronomy Journal 97:322 (2005).
58 Blanco-Canqui supra note 52.
59 snapp, supra note 57.
60 Todd W. andraski and Larry G. Bundy, “Cover Crop effects on Corn Yield response to Nitrogen on an Irrigated sandy soil,” Agronomy Journal 97:1239 (2005).
61 Humberto Blanco-Canqui et al., “summer Cover Crops Fix Nitrogen, Increase Crop Yield, and Improve soil-Crop relationships,” Agronomy Journal 104:137 (2012).
62 snapp, supra note 57.
63 Conservation Technology Information Center and usDa North Central sustainable agriculture research & education, 2012–2013 Cover Crop Survey: June 2013 Survey Analysis, available at http://www.northcentralsare.org/educational-resources/From-the-Field/Cover-Crops-survey-analysis [hereinafter CTIC and sare Cover Crop survey]
64 Ibid.
65 National agricultural statistics service, “Farm and ranch Irrigation survey,” Table 36 (2007), www.agcensus.usda.gov/Publications/2007/Online_Highlights/Farm_and_ranch_Irrigation_survey/fris08_1_36.pdf.
66 see university of Nebraska–Lincoln, “Nebraska agricultural Management Network,” water.unl.edu/web/cropswater/project-background.
67 evapotranspiration is the amount of water returned to the atmosphere through plant surfaces and tissues. It is an indication of how much water plants need to grow. California Irrigation Management Information system, “CIMIs Overview,” www.cimis.water.ca.gov/cimis/welcome.jsp.
68 Jonghan Ko and Giovanni Piccinni, “Corn Yield responses under Crop evapotranspiration-Based Irrigation Management,” Agricultural Water Management 96:799 (2009).
69 see s. Irmak, et al., “Nebraska agricultural Water Management Demonstration Network (NaWMDN): Integrating research and extension/Outreach” Applied Engineering in Agriculture 26:599 (2010).
70 7 usCa § 1523.
71 7 usCa § 1523 requires that several additional conditions be met in order for the rMa to approve a premium reduction. For instance, such a reduction must avoid unfair discrimination among farmers, be offered in an adequate geographic area, have the potential to be expanded, and meet all technical and procedural requirements. any premium reduction program for risk reducing management practices could be designed to meet these final criteria.
72 7 u.s.C. § 1523(a).
73 7 usCa § 1508(d).
74 economic research service, supra note 45..
75 The reduced indemnities resulting from all farmers’ switching to no-till can be estimated by calculating the difference between current failures and projected failures under no-till, as follows:
(16,832,794 insured conventional till (CT) acres * .08258 CT indemnity rate – 16,832,796 CT acres *.05699 No-till (NT) indemnity rate) + (19,639,280 insured mulch till (MT) acres * .09202 MT indemnity rate – 19,639,280 MT acres * .05699 NT indemnity rate) + (16,635,367 insured reduced till (rT) acres * .09087 rT indemnity rate – 16,635,367 rT acres * .05699 NT indemnity rate) + (3,691,508 insured acres with undetermined tillage methods (uD) * .08090 average insured acres indemnity rate – 3,691,508 uD acres * .05699 NT indemnity rate) = 1,770,585 acres that failed under previous tillage methods, but would be expected not to fail under 100% NT. Ibid.
The cost savings of the reduction in failing acres can be calculated by multiplying the formerly failing acres by the average per-acre indemnity payment, as follows:
1,770,585 formerly failing acres * $126.67 per acre = $224,285,415 in reduced indemnities. Federal Crop Insurance Corporation, “Crop Year statistics for 2010,” www3.rma.usda.gov/apps/sob/current_week/crop2010.pdf.
76 usDa rMa Cause of Loss Historical Data Files, supra note 6.
77 Cover cropped fields yielded an average of 122 bushels of corn per acre in these states, while non-cover cropped fields yielded only 106 bushels of corn per acre in these states on average. Conservation Technology Information Center and usDa North Central sustainable agriculture research & education, “2012-2013 Cover Crop survey: June 2013 survey analysis,” available at www.northcentralsare.org/educational-resources/From-the-Field/Cover-Crops-survey-analysis; 10-year historic corn yields (used as a proxy for actual Production History) for these states averaged 150.5 bushels per acre. usDa National agricultural statistics service, Historic Corn Yield, available at http://quickstats.nass.usda.gov/results/9e984264-C64C-3542-8a8e-eD30e3Fe8641.
78 Pat Westhoff, Crop Insurance: Background statistics on Participa-tion and results, Food and agriculture Policy research Institute (2010), available at http://www.fapri.missouri.edu/outreach/publications/2010/FaPrI_Mu_report_10_10.pdf.
79 CTIC and sare Cover Crop survey, supra note 63; usDa National agricultural statistics service, supra note 77.
80 Westhoff, supra note 78.
81 usDa rMa Cause of Loss Historical Data Files, supra note 6.
82 university of Nebraska extension, 2009 NaWDN survey, available at http://water.unl.edu/c/document_library/get_file?uuid=7c342db7-0a59-488f-bccf-62120e4c8088&groupId=468040&.pdf.
83 Working Group representing the american society of agronomy, Crop science society of america, and soil science society of america, Position statement on Climate Change (2011).
84 C.L. Walthall, et al., “Climate Change and agriculture in the united states: effects and adaptation,” usDa Technical Bulletin 1935 (2012).
85 sujoy B. roy, et al., “evaluating sustainability of Projected Water Demands under Future Climate Change scenarios,” Tetra Tech, 2010.
86 Walthall, supra note 84.
PagE 16 | soil matters
Natural resources Defense Council40 West 20th streetNew York, NY 10011212 727-2700Fax 212 727-1773
Beijing
Chicago
Los angeles
Bozeman
san Francisco
Washington
www.nrdc.org
Printed on recycled paper
www.nrdc.org/water/soil-matterswww.nrdc.org/policy www.facebook.com/nrdc.org www.twitter.com/nrdc
Top Related