


Languages
Pages
Legal


NOTICE OF REGULAR BOARD MEETING OF THE UPPER SAN JUAN HEALTH SERVICE DISTRICT dba PAGOSA SPRINGS MEDICAL CENTER
Tuesday, October 15, 2019, at 5:30 PM The Board Room (direct access – northeast entrance)
95 South Pagosa Blvd., Pagosa Springs, CO 81147
AGENDA
1) CALL TO ORDER; ADMINISTRATIVE MATTERS OF THE BOARDa) Confirmation of quorumb) Board member self-disclosure of actual, potential or perceived conflicts of interestc) Approval of the Agenda (and changes, if any)
2) PUBLIC HEARING ON THE PROPOSED 2020 BUDGET FOR USJHSDa) Open the Public Hearing on the proposed 2020 budget
i) CEO direction for 2020ii) CFO’s overview of the budgetiii) Questions/comments of the Boardiv) Questions/comments of the public
b) Close the Public Hearing
3) PUBLIC COMMENT (This is an opportunity for the public to make comment and/or address USJHSDBoard. Persons wishing to address the Board need to notify the Clerk to the Board, Heather Thomas, prior tothe start of the meeting. All public comments shall be limited to matters under the jurisdiction of the Boardand shall be expressly limited to three (3) minutes per person. The Board is not required to respond to ordiscuss public comments. No action will be taken at this meeting on public comments.)
4) REPORTSa) Oral Reports (may be accompanied by a written report)
Chair Greg Schulte Dir. Kate Alfred and Dir. Karin Daniels Dir. Dr. Jim Pruitt and Dir. Karin Daniels Chief Executive Officer, Dr. Rhonda Webb
i) Chair Reportii) Contractsiii) Strategic Planningiv) CEO Reportv) Finance Report CFO, Chelle Keplinger and Treasurer, Dr. Campbell
b) Written Reports (no oral report unless the Board has questions)COO-CNO, Kathee Douglas i) Operations Report
ii) Medical Staff Report Chief of Staff, Dr. Ralph Battels

5) CONSENT AGENDA (The Consent Agenda is intended to allow Board approval, by a single motion, of
matters that are considered routine. There will be no separate discussion of Consent Agenda matters unless
requested.)
a) Approval of Board Member absences:
i) Regular meeting of 10/15/2019
b) Approval of Minutes for the following meeting(s):
i) Regular meeting of: 08/27/2019
c) Approval of Medical Staff report recommendations for new or renewal of provider privileges.
6) DECISION AGENDA (Matters to be discussed and possible action by the Board)
7) EXECUTIVE SESSIONThe Board reserves the right to meet in executive session for any other purpose allowed pursuant to C.R.S.
Section 24-6-402(4) and such topic is announced at open session of the meeting.
8) OTHER BUSINESS
9) ADJOURN
USJHSD FY 2020 Assumptions for Proposed Budget - UPDATED USJHSD Board Packet, 10-15-2019
Page 1 of 3
PUBLIC HEARING 2.a.

USJHSD FY 2020 Assumptions for Proposed Budget - UPDATED USJHSD Board Packet, 10-15-2019
Page 2 of 3
PUBLIC HEARING 2.a.

USJHSD FY 2020 Assumptions for Proposed Budget - UPDATED USJHSD Board Packet, 10-15-2019
Page 3 of 3
PUBLIC HEARING 2.a.

USJHSD Proposed Budget - UPDATED USJHSD Board Packet, 10-15-2019
Page 1 of 7
PUBLIC HEARING 2.a.

USJHSD Proposed Budget - UPDATED USJHSD Board Packet, 10-15-2019
Page 2 of 7
PUBLIC HEARING 2.a.

USJHSD Proposed Budget - UPDATED USJHSD Board Packet, 10-15-2019
Page 3 of 7
PUBLIC HEARING 2.a.

USJHSD Proposed Budget - UPDATED USJHSD Board Packet, 10-15-2019
Page 4 of 7
PUBLIC HEARING 2.a.

USJHSD Proposed Budget - UPDATED USJHSD Board Packet, 10-15-2019
Page 5 of 7
PUBLIC HEARING 2.a.

USJHSD Proposed Budget - UPDATED USJHSD Board Packet, 10-15-2019
Page 6 of 7
PUBLIC HEARING 2.a.

USJHSD Proposed Budget - UPDATED USJHSD Board Packet, 10-15-2019
Page 7 of 7
PUBLIC HEARING 2.a.

ORAL REPORTS 4.a.i.

USJHSD Finance Report USJHSD Board Packet, 10-15-2019
Page 1 of 1
Finance Committee & CFO Report, USJHSD Board Meeting on October 15, 2019
This report provides highlights of PSMC’s August financials and the discussions of the Board’s Finance Committee
that met on September 17, 2019.
1) August Bottom Line: PSMC had a total net gain of $79,451 in August. This net gain is actually a good result
given that August had a very high budgeted expense due to three payrolls and deductions to revenue for charity
care and bad debt were twice higher than budget. PSMC was able to have a net gain for the month by meeting
budget on expenses and exceeding budget on gross revenues. PSMC’s August financials were:
a) $5,719,164.00 in gross revenue (exceed budget by $350K);
b) $638.00 in net revenue (net revenue it the gross revenue after deductions for charity care, bad debt and
contractual deductions of payers - Medicare, Medicaid and commercial insurers);
c) $79,451.00 in net income (net revenue plus grants/donations/340b and less expenses)
d) $660,422.00 net gain year-to-date in 2019. PSMC’s total net gain year-to-date of $660,422, which is less
than budget but slightly exceeds 2018 YTD.
2) Revenues: Outpatient revenue was in excess of budget.
3) Deductions to Gross Revenues for Payer Contractuals, Charity and Bad Debt: Each month PSMC has
deductions to its revenue for bad debt, charity care as well as deductions made by third-party payers (Medicare
and commercial insurers) that are referred to as payer contractuals. Deductions for the month of August were
15% above budget. Year to date, PSMC’s charity care and contractual deductions by payers has greatly
exceeded budget resulting in a little more than 2 million greater deductions to PSMC revenue than budgeted.
4) Expenses: PSMC continued to do a good job holding down expenses, although we were flat with budget for
the month of August, year-to-date, expenses continue to be under budget by 2% (which is nearly $500,000).
August was a month with three payrolls – this happens twice a year and those months have a particularly high
expense.
5) Cash and collections:
a) PSMC increased operating cash from $5.1 MM in July 2019 to $5.2MM in August of 2019. This is not a
large increase but we did have a cash outlay of three payrolls in August so the increase was good.
b) Patient collections were $3.04 MM for the month, 63K less than forecasted. It is a priority for us to collect
co-pays and deductibles at the time of service.
c) As of the end of August, PSMC is at 58 days of gross A/R; and PSMC’s gross accounts receivable balance
decreased $600K to $10.64 MM. We continue diligently working the A/R and are hitting some targets
that we not did expect to hit until December.
6) Progress Report Re Consultant’s Recommendations to Increase Days of Cash: PSMC presented and
discussed in depth with the Finance Committee the status of progress on the consultant’s recommendations.
Per direction of the Board, until the goals are met, staff will provide the Board with a written monthly report
and an oral report quarterly (in May, August, & November).
ORAL REPORTS 4.a.v.
FINANCIAL PRESENTATION
YTD AUGUST 2019
ORAL REPORTS 4.a.v.

1
Summary of Financials
July YTD
Gross Revenue $ 35,026,226
Net Revenue $ 18,380,406 52.48%
Expenses $ 20,485,173
Grants, 340B and Tax Revenue $ 2,685,738
Grants and 340B $ 1,596,474
Tax Revenue $ 1,089,264
Net Income $ 580,971
GROSS REVENUE
07,500,000
15,000,00022,500,00030,000,00037,500,00045,000,000
YTD
40,745,389 39,686,52938,060,619
Actual Budget Prior Year
- 2,000,000 4,000,000 6,000,000 8,000,000
10,000,000
August
5,719,164 5,368,362 5,189,510
Budget Prior Year
350,802
6.53%
529,654
10.21%
1,058,860
2.67%2,684,770
7.05%
Actual
ORAL REPORTS 4.a.v.

2
GROSS REVENUE
$3,300,000
$3,600,000
$3,900,000
$4,200,000
$4,500,000
$4,800,000
$5,100,000
$5,400,000
$5,700,000
$6,000,000
$6,300,000
Jan Feb Mar Apr May Jun Jul Aug Sept Oct Nov Dec
FY 2019 FY 2018 FY 2017 FY 2016
NET PATIENT REVENUE
04,000,0008,000,000
12,000,00016,000,00020,000,00024,000,00028,000,00032,000,00036,000,00040,000,000
YTD
21,398,534 22,451,229
20,714,718
- 1,000,000 2,000,000 3,000,000 4,000,000 5,000,000 6,000,000
August
3,018,228 3,017,590 2,704,216
Prior Year
638
0%
-314,012
-11.61%
-1,052,695
-4.69%
683,816
3.30%
Actual Budget
Actual Budget Prior Year
ORAL REPORTS 4.a.v.

3
NET REVENUE
$1,000,000
$1,250,000
$1,500,000
$1,750,000
$2,000,000
$2,250,000
$2,500,000
$2,750,000
$3,000,000
$3,250,000
$3,500,000
$3,750,000
$4,000,000
$4,250,000
$4,500,000
Jan Feb Mar Apr May Jun Jul Aug Sept Oct Nov Dec
FY 2019 FY 2018 FY 2017 FY 2016
EXPENSES
04,000,0008,000,000
12,000,00016,000,00020,000,00024,000,00028,000,00032,000,000
YTD
23,699,527 24,178,435 23,141,809
- 750,000
1,500,000 2,250,000 3,000,000 3,750,000 4,500,000
August
3,214,354 3,212,373 2,889,789
1,981
0%
324,565
11.23%
-478,908
-1.98%
557,718
2.41%
Actual Budget Prior Year
Actual Budget Prior Year
ORAL REPORTS 4.a.v.

4
EXPENSES
$-
$250,000
$500,000
$750,000
$1,000,000
$1,250,000
$1,500,000
$1,750,000
$2,000,000
$2,250,000
$2,500,000
$2,750,000
$3,000,000
$3,250,000
$3,500,000
$3,750,000
$4,000,000
Jan Feb Mar Apr May Jun Jul Aug Sept Oct Nov Dec
FY 2019 FY 2018 FY 2017 FY 2016
NET INCOME
(1,000,000) -
1,000,000 2,000,000 3,000,000 4,000,000 5,000,000 6,000,000 7,000,000
YTD
660,422
1,770,911
622,130
- 500,000
1,000,000 1,500,000 2,000,000 2,500,000 3,000,000 3,500,000
August
79,451 206,034
47,530
-1,110,489
-62.71%
38,292
6.16%
Actual Budget Prior Year
Actual Budget Prior Year
ORAL REPORTS 4.a.v.

5
NET INCOME
$(600,000)
$(350,000)
$(100,000)
$150,000
$400,000
$650,000
$900,000
$1,150,000
$1,400,000
$1,650,000
$1,900,000
$2,150,000
$2,400,000
$2,650,000
$2,900,000
$3,150,000
Jan Feb Mar Apr May Jun Jul Aug Sept Oct Nov Dec
FY 2019 FY 2018 FY 2017 FY 2016 FY 2015
Summary of Financials
August YTD
Gross Revenue $ 40,745,389
Net Revenue $ 21,398,634 52.52%
Expenses $ 23,699,527
Grants, 340B and Tax Revenue $ 2,961,315
Grants and 340B $ 1,815,991
Tax Revenue $ 1,145,324
Net Income $ 660,422
ORAL REPORTS 4.a.v.

6
DAYS IN ACCOUNTS
RECEIVABLE
0
10
20
30
40
50
60
70
80
90
100
Jun-18 Aug-18 Oct-18 Dec-18 Feb-19 Apr-19 Jun-19 Aug-19
71.9 72.2 70.2 69.4 70.1 70.5 76.6 76.5 76.3
78.4
69.9 68.6 69.6
61.4 58.0 60.0 58.0
53.0 54.0 54.0 53.0
61.0 57.0
62.0 65.0
53.0 49.0
54.0 53.0 49.0
Gross Net
DAYS CASH ON HAND
0
10
20
30
40
50
60
70
80
90
100
Jan-18 Apr-18 Jul-18 Oct-18 Jan-19 Apr-19 Jul-19
48.6 49.4
44.3 45.1 40.7
33.9
43.0 38.8 40.2
43.2 48.9
52.4
38.3 41.2
36.4
47.4 50.3
39.3
46.1 46.8
ORAL REPORTS 4.a.v.

7
CASH COLLECTIONS
$-
$250,000
$500,000
$750,000
$1,000,000
$1,250,000
$1,500,000
$1,750,000
$2,000,000
$2,250,000
$2,500,000
$2,750,000
$3,000,000
$3,250,000
$3,500,000
$3,750,000
$4,000,000
Jan Feb Mar Apr May Jun Jul Aug Sept Oct Nov Dec
FY 2019 FY 2018 FY 2017
ORAL REPORTS 4.a.v.

Page 1
2019 Budget Difference Variance 2019 Budget Difference VarianceRevenue
2 In-patient Revenue
3 In-Patients 285,857$ 362,600$ (76,743)$ -21% 2,512,444$ 2,574,460$ (62,016)$ -2%
4 Central Supply 4,438$ 132,610$ (128,172)$ -97% 747,996$ 941,531$ (193,535)$ -21%
5 Surgery 26,224 90,529$ (64,305)$ -71% 427,001 704,116$ (277,115)$ -39%
6 Swing Beds 1,424 - 1,424 13,866 - 13,866
7 Total In-patient Revenue 317,943 585,739 (267,796) -46% 3,701,307 4,220,107 (518,800) -12%
8 Out-patient Revenue
9 ER 908,448 799,803 108,645 14% 6,478,714 6,131,823 346,891 6%
10 Lab 582,708 588,348 (5,640) -1% 4,134,822 4,445,296 (310,474) -7%
11 Ambulance 221,524 249,910 (28,386) -11% 1,458,161 1,749,370 (291,209) -17%
12 Clinic 434,058 407,844 26,214 6% 3,293,235 2,945,540 347,695 12%
13 Imaging 926,811 987,507 (60,696) -6% 6,960,308 7,511,493 (551,185) -7%
14 Central Supply 228,089 148,455 79,634 54% 1,371,845 1,105,165 266,680 24%
15 Surgery 455,612 280,246 175,366 63% 2,749,924 2,086,276 663,648 32%
16 Oncology 402,050 217,656 184,394 85% 2,014,386 1,877,283 137,103 7%
17 Other 574,065 580,706 (6,641) -1% 3,969,966 3,714,687 255,279 7%
18 Total Out-patient Revenue 4,733,365 4,260,475 472,890 11% 32,431,361 31,566,933 864,428 3%-
19 Professional Fees 667,856 522,148 145,708 28% 4,612,721 3,899,489 713,232 18%-
20 Total Patient Revenue 5,719,164 5,368,362 350,802 7% 40,745,389 39,686,529 1,058,860 3%
21 Revenue Deductions & Bad Debt
22 Contractual Allowances 2,555,793 2,396,384 159,409 7% 19,142,706 17,715,676 1,427,030 8%
23 Charity 81,289 33,131 48,158 145% 663,253 244,928 418,325 171%
24 Bad Debt 311,011 157,014 153,997 98% 1,633,125 1,160,752 472,373 41%
25 Provider Fee & Other (247,157) (235,757) (11,400) 5% (2,092,329) (1,886,056) (206,273) 11%
26 Total Revenue Deductions & Bad Debt 2,700,936 2,350,772 350,164 15% 19,346,755 17,235,300 2,111,455 12%
27 Total Net Patient Revenue 3,018,228 3,017,590 638 0% 21,398,634 22,451,229 (1,052,595) -5%
28 Grants - 180,000 (180,000) -100% 82,380 855,116 (772,736) -90%
29 Other Operating Income - Misc 219,517 152,103 67,414 44% 1,733,611 1,351,153 382,458 28%
30 Total Net Revenues 3,237,745 3,349,693 (111,948) -3% 23,214,625 24,657,498 (1,442,873) -6%
31 Operating Expenses
32 Salary & Wages 1,612,709 1,675,379 (62,670) -4% 12,455,866 12,660,578 (204,712) -2%
33 Benefits 372,430 338,551 33,879 10% 2,181,336 2,410,440 (229,104) -10%
34 Professional Fees 12,486 20,523 (8,037) -39% 183,046 159,170 23,876 15%
35 Contract Labor 24,361 31,168 (6,807) -22% 163,085 248,853 (85,768) -34%
36 Purchased Services 159,311 160,359 (1,048) -1% 1,298,593 1,232,406 66,187 5%
37 Supplies 507,295 455,540 51,755 11% 3,129,475 3,278,198 (148,723) -5%
38 Rent & Leases 38,263 47,846 (9,583) -20% 355,349 382,603 (27,254) -7%
39 Repairs & Maintenance 46,326 51,670 (5,344) -10% 363,090 408,977 (45,887) -11%
40 Utilities 32,661 40,072 (7,411) -18% 335,212 321,884 13,328 4%
41 Insurance 29,743 17,501 12,242 70% 213,849 140,005 73,844 53%
42 Depreciation & Amortization 152,673 162,168 (9,495) 1,256,571 1,253,101 3,470 0%
43 Interest 88,826 86,243 2,583 3% 725,393 689,944 35,449 5%
44 Other 137,270 125,352 11,918 10% 1,038,662 992,276 46,386 5%
45 Total Operating Expenses 3,214,354 3,212,373 1,981 0% 23,699,527 24,178,435 (478,908) -2%
46 Operating Revenue Less Expenses 23,391 137,320 (113,929) -83% (484,902) 479,063 (963,965) -201%
47 Non-Operating Income
48 Tax Revenue 56,060 47,880 8,180 17% 1,145,324 1,125,180 20,144 2%
49 Donations - 20,834 (20,834) -100% - 166,668 (166,668) -100%
50 Total Non-Operating Income 56,060 68,714 (12,654) -18% 1,145,324 1,291,848 (146,524) -11%
51 Total Revenue Less Total Expenses 79,451$ 206,034$ (126,583)$ -61% 660,422$ 1,770,911$ (1,110,489)$ -63%
Current Month Year-to-Date
Income Statement - - - August 31, 2019
Pagosa Springs Medical CenterORAL REPORTS 4.a.v.

Page 2
2019 2018 Difference Variance 2019 2018 Difference Variance
Revenue
2 In-patient Revenue
3 In-Patients 285,857$ 350,236$ (64,379)$ -18% 2,512,444$ 2,455,799$ 56,645$ 2%
4 Central Supply 4,438$ 105,905$ (101,467)$ -96% 747,996$ 1,007,841$ (259,845)$ -26%
5 Surgery 26,224 65,452$ (39,228)$ -60% 427,001 609,378$ (182,377)$ -30%
6 Swing Beds 1,424 - 1,424 13,866 - 13,866
7 Total In-patient Revenue 317,943 521,593 (203,650) -39% 3,701,307 4,073,018 (371,711) -9%
7 Out-patient Revenue
8 ER 908,448 830,366 78,082 9% 6,478,714 5,978,824 499,890 8%
9 Lab 582,708 557,588 25,120 5% 4,134,822 4,223,072 (88,250) -2%
10 Ambulance 221,524 244,268 (22,744) -9% 1,458,161 1,591,052 (132,891) -8%
11 Clinic 434,058 465,041 (30,983) -7% 3,293,235 3,064,598 228,637 7%
12 Imaging 926,811 1,021,273 (94,462) -9% 6,960,308 7,084,233 (123,925) -2%
13 Central Supply 228,089 118,619 109,470 92% 1,371,845 1,794,836 (422,991) -24%
14 Surgery 455,612 260,804 194,808 75% 2,749,924 1,284,746 1,465,178 114%
15 Oncology 402,050 174,829 227,221 130% 2,014,386 1,464,432 549,954 38%
16 Other 574,065 555,212 18,853 3% 3,969,966 3,905,113 64,853 2%
17 Total Out-patient Revenue 4,733,365 4,228,000 505,365 12% 32,431,361 30,390,906 2,040,455 7%
- -
18 Professional Fees 667,856 439,917 227,939 52% 4,612,721 3,596,695 1,016,026 28%
- -
19 Total Patient Revenue 5,719,164 5,189,510 529,654 10% 40,745,389 38,060,619 2,684,770 7%
20 Revenue Deductions & Bad Debt
21 Contractual Allowances 2,555,793 2,490,732 65,061 3% 19,142,706 17,432,552 1,710,154 10%
22 Charity 81,289 83,759 (2,470) -3% 663,253 330,854 332,399 100%
23 Bad Debt 311,011 261,111 49,900 19% 1,633,125 1,152,649 480,476 42%
24 Provider Fee & Other (247,157) (350,308) 103,151 -29% (2,092,329) (1,570,154) (522,175) 33%
25 Total Revenue Deductions & Bad Debt 2,700,936 2,253,241 447,695 20% 19,346,755 17,345,901 2,000,854 12%
2,485,294
26 Total Net Patient Revenue 3,018,228 2,704,216 314,012 12% 21,398,634 20,714,718 683,916 3%
27 Grants - - - 82,380 133,159 (50,779) -38%
28 Other Operating Income - Misc 219,517 189,628 29,889 16% 1,733,611 1,650,915 82,696 5%
29 Total Net Revenues 3,237,745 2,893,844 343,901 12% 23,214,625 22,498,792 715,833 3%
30 Operating Expenses
31 Salary & Wages 1,612,709 1,572,089 40,620 3% 12,455,866 12,348,256 107,610 1%
32 Benefits 372,430 261,441 110,989 42% 2,181,336 2,091,140 90,196 4%
33 Professional Fees 12,486 9,759 2,727 28% 183,046 144,439 38,607 27%
34 Contract Labor 24,361 54,745 (30,384) -56% 163,085 352,781 (189,696) -54%
35 Purchased Services 159,311 128,607 30,704 24% 1,298,593 1,002,177 296,416 30%
36 Supplies 507,295 348,229 159,066 46% 3,129,475 2,915,529 213,946 7%
37 Rent & Leases 38,263 35,445 2,818 8% 355,349 363,351 (8,002) -2%
38 Repairs & Maintenance 46,326 32,788 13,538 41% 363,090 338,886 24,204 7%
39 Utilities 32,661 34,752 (2,091) -6% 335,212 264,820 70,392 27%
40 Insurance 29,743 13,552 16,191 119% 213,849 122,134 91,715 75%
41 Depreciation & Amortization 152,673 175,054 (22,381) -13% 1,256,571 1,570,821 (314,250) -20%
42 Interest 88,826 87,611 1,215 1% 725,393 704,833 20,560 3%
43 Other 137,270 135,717 1,553 1% 1,038,662 922,642 116,020 13%
44 Total Operating Expenses 3,214,354 2,889,789 324,565 11% 23,699,527 23,141,809 557,718 2%
45 Operating Revenue Less Expenses 23,391 4,055 19,336 477% (484,902) (643,017) 158,115 -25%
46 Non-Operating Income
47 Tax Revenue 56,060 41,479 14,581 35% 1,145,324 1,138,564 6,760 1%
48 Donations - 1,996 (1,996) -100% - 126,583 (126,583) -100%
49 Total Non-Operating Income 56,060 43,475 12,585 29% 1,145,324 1,265,147 (119,823) -9%
50 Total Revenue Less Total Expenses 79,451$ 47,530$ 31,921$ 67% 660,422$ 622,130$ 38,292$ 6%
Pagosa Springs Medical Center
Income Statement Comparison - - - August 31, 2019Current Month Year-to-Date
ORAL REPORTS 4.a.v.

Page 3
Current Prior Current Prior
1 Assets Month Month Liabilities Month Month
2 Current Assets Current Liabilities
3 Cash
4 Operating 3,114,204$ 3,041,457$ Accts Payable - System 639,007$ 397,312$
5 Debt Svc. Res. 2016 Bonds 878,731 878,731 Accrued Expenses 1,253,287 1,205,439
6 Bond Funds - 2016 Bonds 106 106 Cost Report Settlement Res 1,096,049 1,073,378
7 Bond Funds - 2006 1,205,695 1,169,004 Wages & Benefits Payable 807,418 1,394,995
8 Capital Escrow - - Deferred Revenue 1,500 1,500
9 Total Cash 5,198,736 5,089,298 Current Portion of LT Debt-2006 320,000 320,000
10 Current Portion of LT Debt-2016 320,000 320,000
11 Accounts Receivable Total Current Liabilities 4,437,260 4,712,624
12 Patient Revenue - Net 4,721,499 4,939,510
13 Other Receivables 306,229 323,937 Long-Term Liabilities
14 Total Accounts Receivable 5,027,728 5,263,447 Leases Payable 239,410 247,932
15 Equipment Lease (Wells Fargo) 284,579 292,798
16 Inventory 1,564,644 1,557,213 Bond Premium (Net) - 2006 236,890 238,003
17 Bond Premium (Net) - 2016 135,942 136,366
18 Total Current Assets 11,791,108 11,909,958 Bonds Payable - 2006 8,705,000 8,705,000
19 Bonds Payable - 2016 9,920,000 9,920,000
20 Fixed Assets Total Long-Term Liabilities 19,521,821 19,540,099
21 Property Plant & Equip (Net) 8,632,395 8,779,557
22 Electronic Health Record (Net) 8,205 9,437 Net Assets
23 Clinic Expansion 13,377,405 13,377,405 Un-Restricted 9,745,929 9,745,929
24 Work In Progress 59,755 48,962 Current Year Net Income/Loss 660,422 580,971
25 Land 101,000 101,000 Total Un-Restricted 10,406,351 10,326,900
26 Total Fixed Assets 22,178,760 22,316,361
27 Restricted
28 Other Assets Total Net Assets 10,406,351 10,326,900
29 Prepaids & Other Assets 395,565 353,304
30 Total Other Assets 395,565 353,304
31
32 Total Assets 34,365,433$ 34,579,623$ Total Liabilities & Net Assets 34,365,433$ 34,579,623$
Balance Sheet - - - August 31, 2019
Pagosa Springs Medical Center
ORAL REPORTS 4.a.v.
Page 4
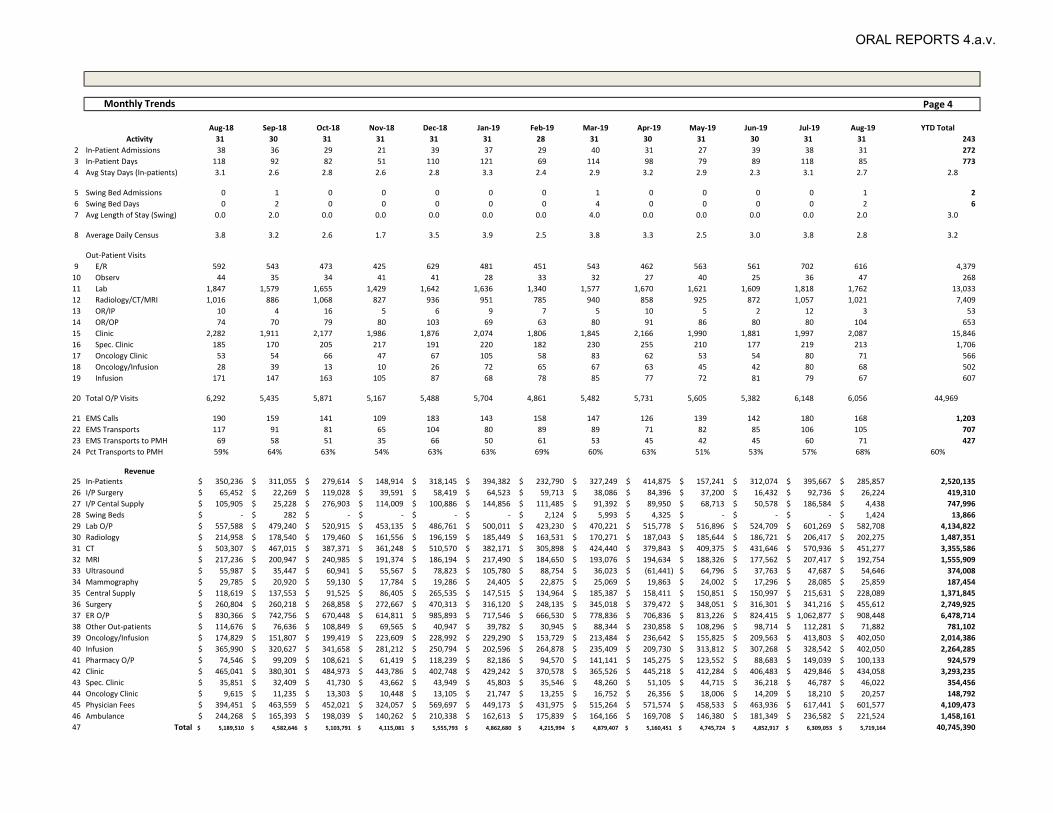
Aug-18 Sep-18 Oct-18 Nov-18 Dec-18 Jan-19 Feb-19 Mar-19 Apr-19 May-19 Jun-19 Jul-19 Aug-19 YTD Total
Activity 31 30 31 31 31 31 28 31 30 31 30 31 31 243
2 In-Patient Admissions 38 36 29 21 39 37 29 40 31 27 39 38 31 272
3 In-Patient Days 118 92 82 51 110 121 69 114 98 79 89 118 85 773
4 Avg Stay Days (In-patients) 3.1 2.6 2.8 2.6 2.8 3.3 2.4 2.9 3.2 2.9 2.3 3.1 2.7 2.8
5 Swing Bed Admissions 0 1 0 0 0 0 0 1 0 0 0 0 1 2
6 Swing Bed Days 0 2 0 0 0 0 0 4 0 0 0 0 2 6
7 Avg Length of Stay (Swing) 0.0 2.0 0.0 0.0 0.0 0.0 0.0 4.0 0.0 0.0 0.0 0.0 2.0 3.0
8 Average Daily Census 3.8 3.2 2.6 1.7 3.5 3.9 2.5 3.8 3.3 2.5 3.0 3.8 2.8 3.2
Out-Patient Visits
9 E/R 592 543 473 425 629 481 451 543 462 563 561 702 616 4,379
10 Observ 44 35 34 41 41 28 33 32 27 40 25 36 47 268
11 Lab 1,847 1,579 1,655 1,429 1,642 1,636 1,340 1,577 1,670 1,621 1,609 1,818 1,762 13,033
12 Radiology/CT/MRI 1,016 886 1,068 827 936 951 785 940 858 925 872 1,057 1,021 7,409
13 OR/IP 10 4 16 5 6 9 7 5 10 5 2 12 3 53
14 OR/OP 74 70 79 80 103 69 63 80 91 86 80 80 104 653
15 Clinic 2,282 1,911 2,177 1,986 1,876 2,074 1,806 1,845 2,166 1,990 1,881 1,997 2,087 15,846
16 Spec. Clinic 185 170 205 217 191 220 182 230 255 210 177 219 213 1,706
17 Oncology Clinic 53 54 66 47 67 105 58 83 62 53 54 80 71 566
18 Oncology/Infusion 28 39 13 10 26 72 65 67 63 45 42 80 68 502
19 Infusion 171 147 163 105 87 68 78 85 77 72 81 79 67 607
20 Total O/P Visits 6,292 5,435 5,871 5,167 5,488 5,704 4,861 5,482 5,731 5,605 5,382 6,148 6,056 44,969
21 EMS Calls 190 159 141 109 183 143 158 147 126 139 142 180 168 1,203
22 EMS Transports 117 91 81 65 104 80 89 89 71 82 85 106 105 707
23 EMS Transports to PMH 69 58 51 35 66 50 61 53 45 42 45 60 71 427
24 Pct Transports to PMH 59% 64% 63% 54% 63% 63% 69% 60% 63% 51% 53% 57% 68% 60%
Revenue25 In-Patients 350,236$ 311,055$ 279,614$ 148,914$ 318,145$ 394,382$ 232,790$ 327,249$ 414,875$ 157,241$ 312,074$ 395,667$ 285,857$ 2,520,135
26 I/P Surgery 65,452$ 22,269$ 119,028$ 39,591$ 58,419$ 64,523$ 59,713$ 38,086$ 84,396$ 37,200$ 16,432$ 92,736$ 26,224$ 419,310
27 I/P Cental Supply 105,905$ 25,228$ 276,903$ 114,009$ 100,886$ 144,856$ 111,485$ 91,392$ 89,950$ 68,713$ 50,578$ 186,584$ 4,438$ 747,996
28 Swing Beds -$ 282$ -$ -$ -$ -$ 2,124$ 5,993$ 4,325$ -$ -$ -$ 1,424$ 13,866
29 Lab O/P 557,588$ 479,240$ 520,915$ 453,135$ 486,761$ 500,011$ 423,230$ 470,221$ 515,778$ 516,896$ 524,709$ 601,269$ 582,708$ 4,134,822
30 Radiology 214,958$ 178,540$ 179,460$ 161,556$ 196,159$ 185,449$ 163,531$ 170,271$ 187,043$ 185,644$ 186,721$ 206,417$ 202,275$ 1,487,351
31 CT 503,307$ 467,015$ 387,371$ 361,248$ 510,570$ 382,171$ 305,898$ 424,440$ 379,843$ 409,375$ 431,646$ 570,936$ 451,277$ 3,355,586
32 MRI 217,236$ 200,947$ 240,985$ 191,374$ 186,194$ 217,490$ 184,650$ 193,076$ 194,634$ 188,326$ 177,562$ 207,417$ 192,754$ 1,555,909
33 Ultrasound 55,987$ 35,447$ 60,941$ 55,567$ 78,823$ 105,780$ 88,754$ 36,023$ (61,441)$ 64,796$ 37,763$ 47,687$ 54,646$ 374,008
34 Mammography 29,785$ 20,920$ 59,130$ 17,784$ 19,286$ 24,405$ 22,875$ 25,069$ 19,863$ 24,002$ 17,296$ 28,085$ 25,859$ 187,454
35 Central Supply 118,619$ 137,553$ 91,525$ 86,405$ 265,535$ 147,515$ 134,964$ 185,387$ 158,411$ 150,851$ 150,997$ 215,631$ 228,089$ 1,371,845
36 Surgery 260,804$ 260,218$ 268,858$ 272,667$ 470,313$ 316,120$ 248,135$ 345,018$ 379,472$ 348,051$ 316,301$ 341,216$ 455,612$ 2,749,925
37 ER O/P 830,366$ 742,756$ 670,448$ 614,811$ 985,893$ 717,546$ 666,530$ 778,836$ 706,836$ 813,226$ 824,415$ 1,062,877$ 908,448$ 6,478,714
38 Other Out-patients 114,676$ 76,636$ 108,849$ 69,565$ 40,947$ 39,782$ 30,945$ 88,344$ 230,858$ 108,296$ 98,714$ 112,281$ 71,882$ 781,102
39 Oncology/Infusion 174,829$ 151,807$ 199,419$ 223,609$ 228,992$ 229,290$ 153,729$ 213,484$ 236,642$ 155,825$ 209,563$ 413,803$ 402,050$ 2,014,386
40 Infusion 365,990$ 320,627$ 341,658$ 281,212$ 250,794$ 202,596$ 264,878$ 235,409$ 209,730$ 313,812$ 307,268$ 328,542$ 402,050$ 2,264,285
41 Pharmacy O/P 74,546$ 99,209$ 108,621$ 61,419$ 118,239$ 82,186$ 94,570$ 141,141$ 145,275$ 123,552$ 88,683$ 149,039$ 100,133$ 924,579
42 Clinic 465,041$ 380,301$ 484,973$ 443,786$ 402,748$ 429,242$ 370,578$ 365,526$ 445,218$ 412,284$ 406,483$ 429,846$ 434,058$ 3,293,235
43 Spec. Clinic 35,851$ 32,409$ 41,730$ 43,662$ 43,949$ 45,803$ 35,546$ 48,260$ 51,105$ 44,715$ 36,218$ 46,787$ 46,022$ 354,456
44 Oncology Clinic 9,615$ 11,235$ 13,303$ 10,448$ 13,105$ 21,747$ 13,255$ 16,752$ 26,356$ 18,006$ 14,209$ 18,210$ 20,257$ 148,792
45 Physician Fees 394,451$ 463,559$ 452,021$ 324,057$ 569,697$ 449,173$ 431,975$ 515,264$ 571,574$ 458,533$ 463,936$ 617,441$ 601,577$ 4,109,473
46 Ambulance 244,268$ 165,393$ 198,039$ 140,262$ 210,338$ 162,613$ 175,839$ 164,166$ 169,708$ 146,380$ 181,349$ 236,582$ 221,524$ 1,458,161
47 Total 5,189,510$ 4,582,646$ 5,103,791$ 4,115,081$ 5,555,793$ 4,862,680$ 4,215,994$ 4,879,407$ 5,160,451$ 4,745,724$ 4,852,917$ 6,309,053$ 5,719,164$ 40,745,390
Monthly Trends
ORAL REPORTS 4.a.v.

Page 5
1 In-Patient
2 Admissions:
3 Acute 31 43 (12) 272 346 (74) 327 289 38 13%
4 Swing Bed 1 - 1 2 - 2 - - - #DIV/0!
5 Total 32 43 (11) 274 346 (72) 327 289 38 13%
7 Patient Days:
8 Acute 85 130 (45) 773 922 (149) 851 733 118 16%
9 Swing Bed 2 - 2 6 - 6 - - - #DIV/0!
10 Total 87 130 (43) 779 922 (143) 851 733 118 16%
12 Average Daily Census:
13 # Of Days 31 31 243 243 243 212
14 Acute 2.7 4.2 (1.5) 3.2 3.8 (0.6) 3.5 3.5 0.0 1%
15 Swing Bed 0.1 - 0.1 0.0 - 0.0 0.0 - 0.0 #DIV/0!
16 Total 2.8 4.2 (1.4) 3.2 3.8 (0.6) 3.5 3.5 0.0 1%
18 Length of Stay:
19 Acute 2.7 3.0 (0.3) 2.8 2.7 0.2 2.6 2.5 0.1 3%
20 Swing Bed 2.0 #DIV/0! #DIV/0! 3.0 #DIV/0! #DIV/0! #DIV/0! #DIV/0! #DIV/0! 0%
21 Total 2.7 3.0 (0.3) 2.8 2.7 0.2 2.6 2.5 0.1 3%
23 Revenue: -
24 Acute 316,519 585,739 (269,220) 3,687,441 4,220,107 (532,666) 4,073,018 3,551,425 521,593 15%
25 Swing Bed 1,424 - 1,424 13,866 - 13,866 - - - #DIV/0!
26 Total 317,943 585,739 (267,796) 3,701,307 4,220,107 (518,800) 4,073,018 3,551,425 521,593 15%
28 Revenue Per Pat Day:
29 Acute 3,724 4,506 (782) 4,770 4,577 193 4,786 4,845 (59) -1%
30 Swing Bed 712 #DIV/0! #DIV/0! 2,311 #DIV/0! #DIV/0! #DIV/0! #DIV/0! #DIV/0! #DIV/0!
31 Total 3,655 4,506 (851) 4,751 4,577 174 4,786 4,845 (59) -1%
33 Out-Patient
34 Out-Patient Visits
35 E/R 616 615 1 4,379 4,630 (251) 4,601 4,009 592 15%
36 Observ 47 43 4 268 299 (31) 285 241 44 18%
37 Lab 1,762 1,877 (115) 13,033 13,618 (585) 13,351 11,504 1,847 16%
38 Radiology/MRI/US/CT 1,021 1,284 (263) 7,409 9,427 (2,018) 7,607 6,591 1,016 15%
39 OR 104 80 24 653 604 49 680 596 84 14%
40 Clinic 2,087 2,104 (17) 15,846 15,920 (74) 16,669 14,387 2,282 16%
41 Oncology Clinic 71 35 36 566 294 272 335 282 53 19%
42 Oncology Infusion 68 35 33 502 294 208 229 201 28 14%
43 Infusion 67 120 (53) 607 611 (4) 805 634 171 27%
44 Total 5,843 6,193 (350) 43,263 45,697 (2,434) 44,562 38,445 6,117 16%
45 Spec. Clinic 213 139 74 1,706 855 851 761 576 185 32%
46 ER Physician 616 615 1 4,379 4,630 (251) 4,601 4,009 592 15%
47 Out-Patient Revenue
48 E/R 870,185 763,254 106,931 6,192,240 5,851,614 340,626 5,708,113 4,922,062 786,051 16%
49 Observ 38,263 36,549 1,714 286,474 280,209 6,265 270,711 226,396 44,315 20%
50 Lab 582,708 588,348 (5,640) 4,134,822 4,445,296 (310,474) 4,223,072 3,665,484 557,588 15%
51 Radiology 202,275 233,253 (30,978) 1,487,351 1,762,356 (275,005) 1,605,799 1,390,841 214,958 15%
52 CT 451,277 452,961 (1,684) 3,355,586 3,472,701 (117,115) 3,389,312 2,886,005 503,307 17%
53 Ultrasound 54,646 57,132 (2,486) 374,008 431,664 (57,656) 391,322 335,335 55,987 17%
54 MRI 192,754 220,014 (27,260) 1,555,909 1,662,328 (106,419) 1,519,090 1,301,854 217,236 17%
55 Mammography 25,859 24,147 1,712 187,454 182,444 5,010 178,710 148,925 29,785 20%
56 Central Supply 228,089 148,455 79,634 1,371,845 1,105,165 266,680 1,026,683 908,064 118,619 13%
57 OR 455,612 280,246 175,366 2,749,924 2,086,276 663,648 2,052,899 1,792,095 260,804 15%
58 Clinic 434,058 407,844 26,214 3,293,235 2,945,540 347,695 3,064,598 2,599,557 465,041 18%
59 Oncology Clinic 20,257 12,483 7,774 148,792 94,316 54,476 73,068 63,453 9,615 15%
60 Oncology Infusion 402,050 217,656 184,394 2,014,386 1,877,283 137,103 1,464,432 1,289,603 174,829 14%
61 Other 574,065 580,706 (6,641) 3,969,966 3,714,687 255,279 3,905,113 3,349,901 555,212 17%
62 Total 4,532,098 4,023,048 509,050 31,121,992 29,911,879 1,210,113 28,872,922 24,879,575 3,993,347 16%
63 Spec. Clinic 46,022 29,960 16,062 354,456 200,732 153,724 161,793 125,942 35,851 28%
64 Physician 581,320 467,222 114,098 3,960,681 3,510,125 450,556 3,288,766 2,903,930 384,836 13%
65 Total 647,599 509,665 137,934 4,463,929 3,805,173 658,756 3,523,627 3,093,325 430,302 14%
66 Ambulance
67 Ambulance Calls 168 1,203 1,229 1,039 190 18%
68 Ambulance Transports 105 707 715 598 117 20%
69 Transports to PMH 71 111 427 717 (290) 420 351 69 20%
70 Transports to PMH % 68% 60% 59% 59%
71 Transports to Other 34 280 295 247 48
72 Transports to Other % 32% 40% 41% 41%
73 Revenue: 221,524 249,910 (28,386) 1,458,161 1,749,370 (291,209) 1,591,052 1,346,784 244,268 18%
74 Revenue Per Transport: 2,110 2,062 2,225 2,252 (27) -1%
75 Total Revenues 5,719,164 5,368,362 350,802 40,745,389 39,686,529 1,058,860 38,060,619 32,871,109 5,189,510 16%
Pagosa Springs Medical Center - - - Statistical Review
Statistical ReviewAugust Prior Y-T-D
VarianceY-T-D Actual
Prior Y-T-D
Actual Difference
Current Month
Actual
Current Month
Budget Variance
Y-T-D
Actual Y-T-D Budget Variance2019
August August
ORAL REPORTS 4.a.v.
Page 6
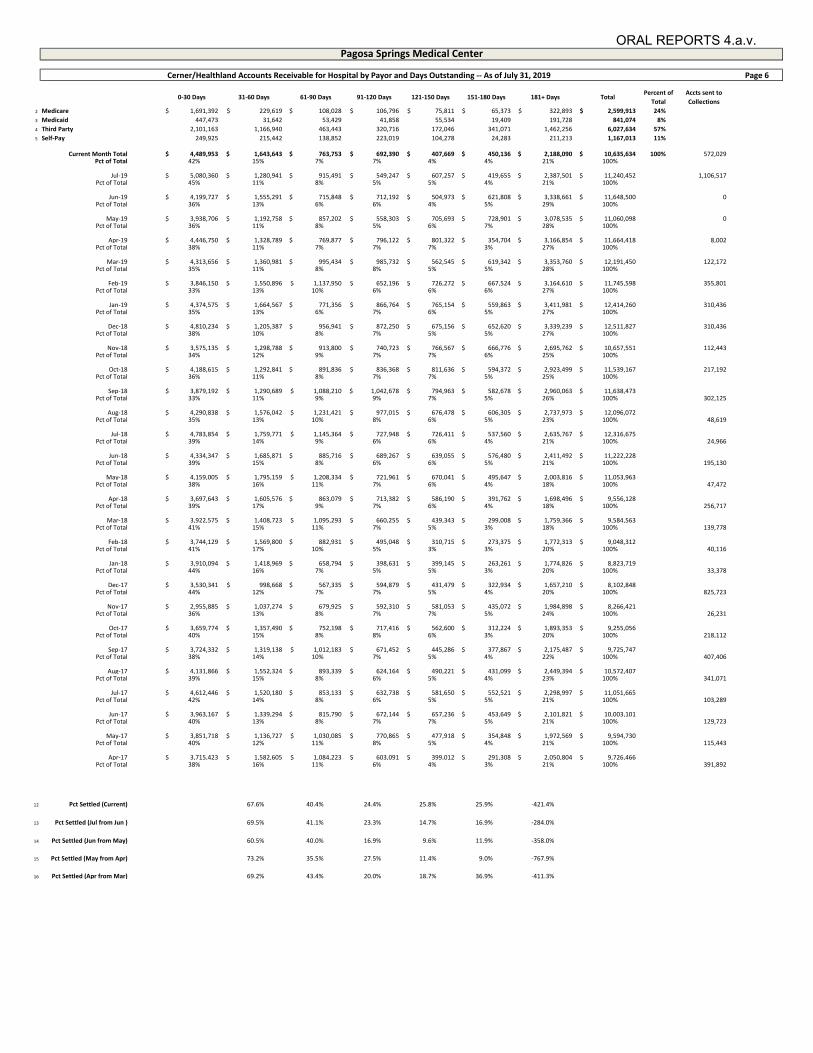
0-30 Days 31-60 Days 61-90 Days 91-120 Days 121-150 Days 151-180 Days 181+ Days TotalPercent of
Total
Accts sent to
Collections
2 Medicare 1,691,392$ 229,619$ 108,028$ 106,796$ 75,811$ 65,373$ 322,893$ 2,599,913$ 24%
3 Medicaid 447,473 31,642 53,429 41,858 55,534 19,409 191,728 841,074 8%
4 Third Party 2,101,163 1,166,940 463,443 320,716 172,046 341,071 1,462,256 6,027,634 57%
5 Self-Pay 249,925 215,442 138,852 223,019 104,278 24,283 211,213 1,167,013 11%
Current Month Total 4,489,953$ 1,643,643$ 763,753$ 692,390$ 407,669$ 450,136$ 2,188,090$ 10,635,634$ 100% 572,029Pct of Total 42% 15% 7% 7% 4% 4% 21% 100%
Jul-19 5,080,360$ 1,280,941$ 915,491$ 549,247$ 607,257$ 419,655$ 2,387,501$ 11,240,452$ 1,106,517Pct of Total 45% 11% 8% 5% 5% 4% 21% 100%
Jun-19 4,199,727$ 1,555,291$ 715,848$ 712,192$ 504,973$ 621,808$ 3,338,661$ 11,648,500$ 0Pct of Total 36% 13% 6% 6% 4% 5% 29% 100%
May-19 3,938,706$ 1,192,758$ 857,202$ 558,303$ 705,693$ 728,901$ 3,078,535$ 11,060,098$ 0Pct of Total 36% 11% 8% 5% 6% 7% 28% 100%
Apr-19 4,446,750$ 1,328,789$ 769,877$ 796,122$ 801,322$ 354,704$ 3,166,854$ 11,664,418$ 8,002Pct of Total 38% 11% 7% 7% 7% 3% 27% 100%
Mar-19 4,313,656$ 1,360,981$ 995,434$ 985,732$ 562,545$ 619,342$ 3,353,760$ 12,191,450$ 122,172Pct of Total 35% 11% 8% 8% 5% 5% 28% 100%
Feb-19 3,846,150$ 1,550,896$ 1,137,950$ 652,196$ 726,272$ 667,524$ 3,164,610$ 11,745,598$ 355,801Pct of Total 33% 13% 10% 6% 6% 6% 27% 100%
Jan-19 4,374,575$ 1,664,567$ 771,356$ 866,764$ 765,154$ 559,863$ 3,411,981$ 12,414,260$ 310,436Pct of Total 35% 13% 6% 7% 6% 5% 27% 100%
Dec-18 4,810,234$ 1,205,387$ 956,941$ 872,250$ 675,156$ 652,620$ 3,339,239$ 12,511,827$ 310,436Pct of Total 38% 10% 8% 7% 5% 5% 27% 100%
Nov-18 3,575,135$ 1,298,788$ 913,800$ 740,723$ 766,567$ 666,776$ 2,695,762$ 10,657,551$ 112,443Pct of Total 34% 12% 9% 7% 7% 6% 25% 100%
Oct-18 4,188,615$ 1,292,841$ 891,836$ 836,368$ 811,636$ 594,372$ 2,923,499$ 11,539,167$ 217,192Pct of Total 36% 11% 8% 7% 7% 5% 25% 100%
Sep-18 3,879,192$ 1,290,689$ 1,088,210$ 1,042,678$ 794,963$ 582,678$ 2,960,063$ 11,638,473$ Pct of Total 33% 11% 9% 9% 7% 5% 26% 100% 302,125
Aug-18 4,290,838$ 1,576,042$ 1,231,421$ 977,015$ 676,478$ 606,305$ 2,737,973$ 12,096,072$ Pct of Total 35% 13% 10% 8% 6% 5% 23% 100% 48,619
Jul-18 4,783,854$ 1,759,771$ 1,145,364$ 727,948$ 726,411$ 537,560$ 2,635,767$ 12,316,675$ Pct of Total 39% 14% 9% 6% 6% 4% 21% 100% 24,966
Jun-18 4,334,347$ 1,685,871$ 885,716$ 689,267$ 639,055$ 576,480$ 2,411,492$ 11,222,228$ Pct of Total 39% 15% 8% 6% 6% 5% 21% 100% 195,130
May-18 4,159,005$ 1,795,159$ 1,208,334$ 721,961$ 670,041$ 495,647$ 2,003,816$ 11,053,963$ Pct of Total 38% 16% 11% 7% 6% 4% 18% 100% 47,472
Apr-18 3,697,643$ 1,605,576$ 863,079$ 713,382$ 586,190$ 391,762$ 1,698,496$ 9,556,128$ Pct of Total 39% 17% 9% 7% 6% 4% 18% 100% 256,717
Mar-18 3,922,575$ 1,408,723$ 1,095,293$ 660,255$ 439,343$ 299,008$ 1,759,366$ 9,584,563$ Pct of Total 41% 15% 11% 7% 5% 3% 18% 100% 139,778
Feb-18 3,744,129$ 1,569,800$ 882,931$ 495,048$ 310,715$ 273,375$ 1,772,313$ 9,048,312$ Pct of Total 41% 17% 10% 5% 3% 3% 20% 100% 40,116
Jan-18 3,910,094$ 1,418,969$ 658,794$ 398,631$ 399,145$ 263,261$ 1,774,826$ 8,823,719$ Pct of Total 44% 16% 7% 5% 5% 3% 20% 100% 33,378
Dec-17 3,530,341$ 998,668$ 567,335$ 594,879$ 431,479$ 322,934$ 1,657,210$ 8,102,848$ Pct of Total 44% 12% 7% 7% 5% 4% 20% 100% 825,723
Nov-17 2,955,885$ 1,037,274$ 679,925$ 592,310$ 581,053$ 435,072$ 1,984,898$ 8,266,421$ Pct of Total 36% 13% 8% 7% 7% 5% 24% 100% 26,231
Oct-17 3,659,774$ 1,357,490$ 752,198$ 717,416$ 562,600$ 312,224$ 1,893,353$ 9,255,056$ Pct of Total 40% 15% 8% 8% 6% 3% 20% 100% 218,112
Sep-17 3,724,332$ 1,319,138$ 1,012,183$ 671,452$ 445,286$ 377,867$ 2,175,487$ 9,725,747$ Pct of Total 38% 14% 10% 7% 5% 4% 22% 100% 407,406
Aug-17 4,131,866$ 1,552,324$ 893,339$ 624,164$ 490,221$ 431,099$ 2,449,394$ 10,572,407$ Pct of Total 39% 15% 8% 6% 5% 4% 23% 100% 341,071
Jul-17 4,612,446$ 1,520,180$ 853,133$ 632,738$ 581,650$ 552,521$ 2,298,997$ 11,051,665$ Pct of Total 42% 14% 8% 6% 5% 5% 21% 100% 103,289
Jun-17 3,963,167$ 1,339,294$ 815,790$ 672,144$ 657,236$ 453,649$ 2,101,821$ 10,003,101$ Pct of Total 40% 13% 8% 7% 7% 5% 21% 100% 129,723
May-17 3,851,718$ 1,136,727$ 1,030,085$ 770,865$ 477,918$ 354,848$ 1,972,569$ 9,594,730$ Pct of Total 40% 12% 11% 8% 5% 4% 21% 100% 115,443
Apr-17 3,715,423$ 1,582,605$ 1,084,223$ 603,091$ 399,012$ 291,308$ 2,050,804$ 9,726,466$ Pct of Total 38% 16% 11% 6% 4% 3% 21% 100% 391,892
12 Pct Settled (Current) 67.6% 40.4% 24.4% 25.8% 25.9% -421.4%
13 Pct Settled (Jul from Jun ) 69.5% 41.1% 23.3% 14.7% 16.9% -284.0%
14 Pct Settled (Jun from May) 60.5% 40.0% 16.9% 9.6% 11.9% -358.0%
15 Pct Settled (May from Apr) 73.2% 35.5% 27.5% 11.4% 9.0% -767.9%
16 Pct Settled (Apr from Mar) 69.2% 43.4% 20.0% 18.7% 36.9% -411.3%
Pagosa Springs Medical Center
Cerner/Healthland Accounts Receivable for Hospital by Payor and Days Outstanding -- As of July 31, 2019
ORAL REPORTS 4.a.v.

Page 7
31 28 31 30 31 30
Jan-19 Feb-19 Mar-19 Apr-19 May-19 Jun-19
31 31 30 31 30 31
Jul-19 Aug-19 Sep-18 Oct-18 Nov-18 Dec-18
12 Medicare 33% 21 97,225$ 673,768$
13 Medicaid 7% 35 97,225$ 238,201$
14 Blue Cross 15% 48 97,225$ 700,018$
15 Commercial 26% 65 97,225$ 1,643,098$
16 Self Pay 19% 150 97,225$ 2,770,906$
17 Total: 100% 6,025,991$
18 97,225$
19 62
61Net Days in A/R 53 49 54 54 53
Net Patient Rev/Day (2 month Avg) 93,602$ 97,225$ 87,436$ 86,304$ 80,953$ 84,267$
Net Accounts Receivable 4,939,510$ 4,721,499$ 4,737,306$ 4,650,770$ 4,261,223$ 5,111,778$
Net Patient Revenue 3,009,707$ 3,018,228$ 2,629,201$ 2,634,021$ 2,308,147$ 2,839,498$
85,762$
Pagosa Springs Medical Center
Pagosa Springs Medical Center - - - Net Days in A/R 2019
2,703,510$
53
77,105$ 90,251$ 89,001$
4,645,356$
49 54
Net Patient Rev/Day (2 month Avg) 88,961$
Net Days in A/R 57
2,897,839$
Gross Days in A/R Target
Pagosa Springs Medical Center - - - Gross Days Target
2,523,644$
Net Accounts Receivable 5,096,441$ 4,830,219$ 4,992,507$ 4,763,720$ 4,371,767$
Net Patient Revenue 2,676,087$
78,315$
1,968,516$ 2,601,105$
6562
9
10
2
3
4
5
7
8
ORAL REPORTS 4.a.v.

Pagosa Springs Medical Center
Financial Forecast
Statement of Cash Flows
Cash Flows from operating activities August, 2019
Change in net assets 79,451
Adjustments to reconcile net assets to net cash
Depreciation and amortization 154,210
Patient accounts receivable 218,011
Accounts payable and wages payable (345,882)
Accrued liabilities 47,848
Pre-paid assets (42,261)
Deferred revenues -
Other receivables 17,708
Change in bond premium (1,537)
Reserve for third party settlement 22,671
Inventory (7,431)
Net Cash Provided by (used in) operating activities 142,788
Cash Flows from investing activities
Purchase of property and equipment (12,852)
Work in progress -
Proceeds from sale of equipment/(Loss) -
Net Cash Provided by (used in) investing activities (12,852)
Cash Flows from financing activities
Principal payments on long-term debt -
Proceeds from debt
Change in Prior Year Net Assets -
Change in leases payable (16,741)
Net Cash Provided by (used in) financing activities (16,741)
Net Increase in Cash 113,195
Cash Beginning of Month 5,089,298
Cash End of Month 5,198,736
Check -
ORAL REPORTS 4.a.v.
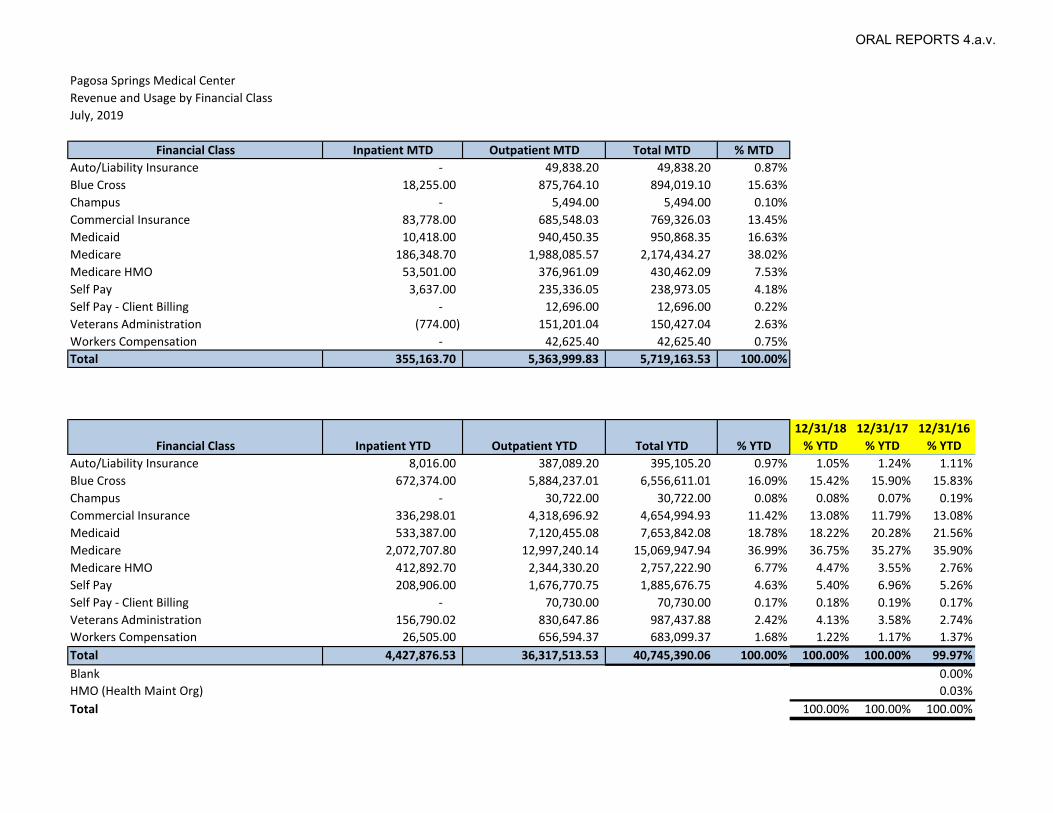
Pagosa Springs Medical Center
Revenue and Usage by Financial Class
July, 2019
Financial Class Inpatient MTD Outpatient MTD Total MTD % MTD
Auto/Liability Insurance - 49,838.20 49,838.20 0.87%
Blue Cross 18,255.00 875,764.10 894,019.10 15.63%
Champus - 5,494.00 5,494.00 0.10%
Commercial Insurance 83,778.00 685,548.03 769,326.03 13.45%
Medicaid 10,418.00 940,450.35 950,868.35 16.63%
Medicare 186,348.70 1,988,085.57 2,174,434.27 38.02%
Medicare HMO 53,501.00 376,961.09 430,462.09 7.53%
Self Pay 3,637.00 235,336.05 238,973.05 4.18%
Self Pay - Client Billing - 12,696.00 12,696.00 0.22%
Veterans Administration (774.00) 151,201.04 150,427.04 2.63%
Workers Compensation - 42,625.40 42,625.40 0.75%
Total 355,163.70 5,363,999.83 5,719,163.53 100.00%
Financial Class Inpatient YTD Outpatient YTD Total YTD % YTD
12/31/18
% YTD
12/31/17
% YTD
12/31/16
% YTD
Auto/Liability Insurance 8,016.00 387,089.20 395,105.20 0.97% 1.05% 1.24% 1.11%
Blue Cross 672,374.00 5,884,237.01 6,556,611.01 16.09% 15.42% 15.90% 15.83%
Champus - 30,722.00 30,722.00 0.08% 0.08% 0.07% 0.19%
Commercial Insurance 336,298.01 4,318,696.92 4,654,994.93 11.42% 13.08% 11.79% 13.08%
Medicaid 533,387.00 7,120,455.08 7,653,842.08 18.78% 18.22% 20.28% 21.56%
Medicare 2,072,707.80 12,997,240.14 15,069,947.94 36.99% 36.75% 35.27% 35.90%
Medicare HMO 412,892.70 2,344,330.20 2,757,222.90 6.77% 4.47% 3.55% 2.76%
Self Pay 208,906.00 1,676,770.75 1,885,676.75 4.63% 5.40% 6.96% 5.26%
Self Pay - Client Billing - 70,730.00 70,730.00 0.17% 0.18% 0.19% 0.17%
Veterans Administration 156,790.02 830,647.86 987,437.88 2.42% 4.13% 3.58% 2.74%
Workers Compensation 26,505.00 656,594.37 683,099.37 1.68% 1.22% 1.17% 1.37%
Total 4,427,876.53 36,317,513.53 40,745,390.06 100.00% 100.00% 100.00% 99.97%
Blank 0.00%
HMO (Health Maint Org) 0.03%
Total 100.00% 100.00% 100.00%
ORAL REPORTS 4.a.v.
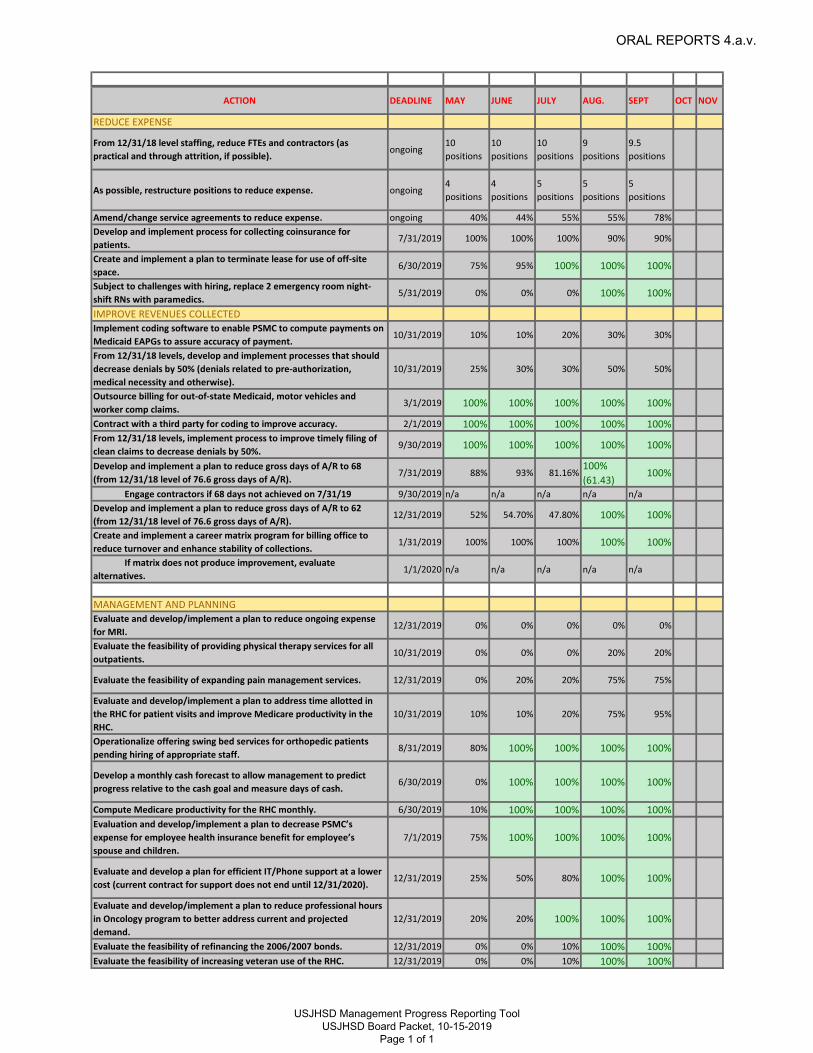
ACTION DEADLINE MAY JUNE JULY AUG. SEPT OCT NOV
REDUCE EXPENSE
From 12/31/18 level staffing, reduce FTEs and contractors (as
practical and through attrition, if possible).ongoing
10
positions
10
positions
10
positions
9
positions
9.5
positions
As possible, restructure positions to reduce expense. ongoing4
positions
4
positions
5
positions
5
positions
5
positions
Amend/change service agreements to reduce expense. ongoing 40% 44% 55% 55% 78%
Develop and implement process for collecting coinsurance for
patients.7/31/2019 100% 100% 100% 90% 90%
Create and implement a plan to terminate lease for use of off-site
space.6/30/2019 75% 95% 100% 100% 100%
Subject to challenges with hiring, replace 2 emergency room night-
shift RNs with paramedics.5/31/2019 0% 0% 0% 100% 100%
IMPROVE REVENUES COLLECTED
Implement coding software to enable PSMC to compute payments on
Medicaid EAPGs to assure accuracy of payment.10/31/2019 10% 10% 20% 30% 30%
From 12/31/18 levels, develop and implement processes that should
decrease denials by 50% (denials related to pre-authorization,
medical necessity and otherwise).
10/31/2019 25% 30% 30% 50% 50%
Outsource billing for out-of-state Medicaid, motor vehicles and
worker comp claims.3/1/2019 100% 100% 100% 100% 100%
Contract with a third party for coding to improve accuracy. 2/1/2019 100% 100% 100% 100% 100%
From 12/31/18 levels, implement process to improve timely filing of
clean claims to decrease denials by 50%.9/30/2019 100% 100% 100% 100% 100%
Develop and implement a plan to reduce gross days of A/R to 68
(from 12/31/18 level of 76.6 gross days of A/R).7/31/2019 88% 93% 81.16%
100%
(61.43)100%
Engage contractors if 68 days not achieved on 7/31/19 9/30/2019 n/a n/a n/a n/a n/a
Develop and implement a plan to reduce gross days of A/R to 62
(from 12/31/18 level of 76.6 gross days of A/R).12/31/2019 52% 54.70% 47.80% 100% 100%
Create and implement a career matrix program for billing office to
reduce turnover and enhance stability of collections.1/31/2019 100% 100% 100% 100% 100%
If matrix does not produce improvement, evaluate
alternatives.1/1/2020 n/a n/a n/a n/a n/a
MANAGEMENT AND PLANNING
Evaluate and develop/implement a plan to reduce ongoing expense
for MRI.12/31/2019 0% 0% 0% 0% 0%
Evaluate the feasibility of providing physical therapy services for all
outpatients.10/31/2019 0% 0% 0% 20% 20%
Evaluate the feasibility of expanding pain management services. 12/31/2019 0% 20% 20% 75% 75%
Evaluate and develop/implement a plan to address time allotted in
the RHC for patient visits and improve Medicare productivity in the
RHC.
10/31/2019 10% 10% 20% 75% 95%
Operationalize offering swing bed services for orthopedic patients
pending hiring of appropriate staff.8/31/2019 80% 100% 100% 100% 100%
Develop a monthly cash forecast to allow management to predict
progress relative to the cash goal and measure days of cash.6/30/2019 0% 100% 100% 100% 100%
Compute Medicare productivity for the RHC monthly. 6/30/2019 10% 100% 100% 100% 100%
Evaluation and develop/implement a plan to decrease PSMC’s
expense for employee health insurance benefit for employee’s
spouse and children.
7/1/2019 75% 100% 100% 100% 100%
Evaluate and develop a plan for efficient IT/Phone support at a lower
cost (current contract for support does not end until 12/31/2020).12/31/2019 25% 50% 80% 100% 100%
Evaluate and develop/implement a plan to reduce professional hours
in Oncology program to better address current and projected
demand.
12/31/2019 20% 20% 100% 100% 100%
Evaluate the feasibility of refinancing the 2006/2007 bonds. 12/31/2019 0% 0% 10% 100% 100%
Evaluate the feasibility of increasing veteran use of the RHC. 12/31/2019 0% 0% 10% 100% 100%
USJHSD Management Progress Reporting Tool USJHSD Board Packet, 10-15-2019
Page 1 of 1
ORAL REPORTS 4.a.v.

71
2 0 0
1018
1
19
0 1 3
0
10
20
30
40
50
60
70
80
90
100
Nu
mb
er o
f 9
11
Res
po
nse
s
EMS 911 Response
2019
125Total 911 Responses:
4
Breakdown of EMS Standbys
Fire/SAR/LE/USF
Paid
Special Event (Not Paid)
Refusal
Total Standbys
4
3335
0
10
20
30
40
50
Nu
mb
er o
f In
terf
acili
ty T
ran
spo
rts
Total Interfacility Transports
2019 2018
Operations Report for August 2019
EMS: August
USJHSD Operations Report USJHSD Board Packet, 10-15-2019
Page 1 of 9
WRITTEN REPORTS 4.b.i.

0
16
0 0 1 0
12
30 1 0
0
5
10
15
20
25
30
35
40
Nu
mb
er o
f Tr
asn
po
rts
Interfacility Transports by Destination
00.5
11.5
22.5
33.5
44.5
5
Flight/ShuttleCrew
3rd/4th Crew Dispatch Error Assist at PSMC Walk-In EMS Public Assist
0
5
2
0 0 0
"Oth
er"
Cal
ls
Other EMS Calls
2019
EMS: August
USJHSD Operations Report USJHSD Board Packet, 10-15-2019
Page 2 of 9
WRITTEN REPORTS 4.b.i.
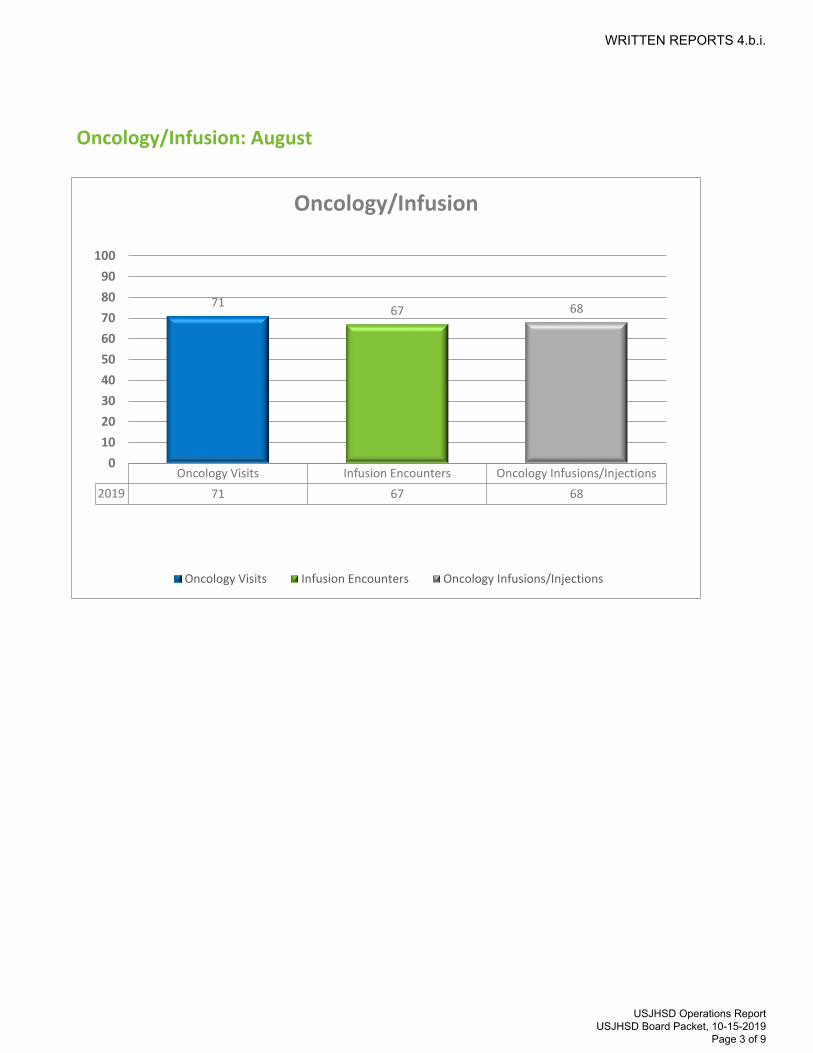
Oncology/Infusion:
Oncology Visits Infusion Encounters Oncology Infusions/Injections
2019 71 67 68
7167 68
0
10
20
30
40
50
60
70
80
90
100
Oncology/Infusion
Oncology Visits Infusion Encounters Oncology Infusions/Injections
August
USJHSD Operations Report USJHSD Board Packet, 10-15-2019
Page 3 of 9
WRITTEN REPORTS 4.b.i.

ED:
Jan Feb Mar Apr May Jun Jul Aug Sep Oct Nov Dec
2019 481 451 543 462 563 561 702 616 552
2018 619 532 554 470 532 589 713 592 543 473 425 629
0
100
200
300
400
500
600
700
800
Nu
mb
er o
f p
atie
nts
ED Yearly Volume Comparison
2019 2018
28 2931 36
0
100
200
300
400
500
600
Admits Transfers
Nu
mb
er o
f P
atie
nts
ED Inpatient Admissions and Transfers Monthly Comparison
2019 2018
August
USJHSD Operations Report USJHSD Board Packet, 10-15-2019
Page 4 of 9
WRITTEN REPORTS 4.b.i.
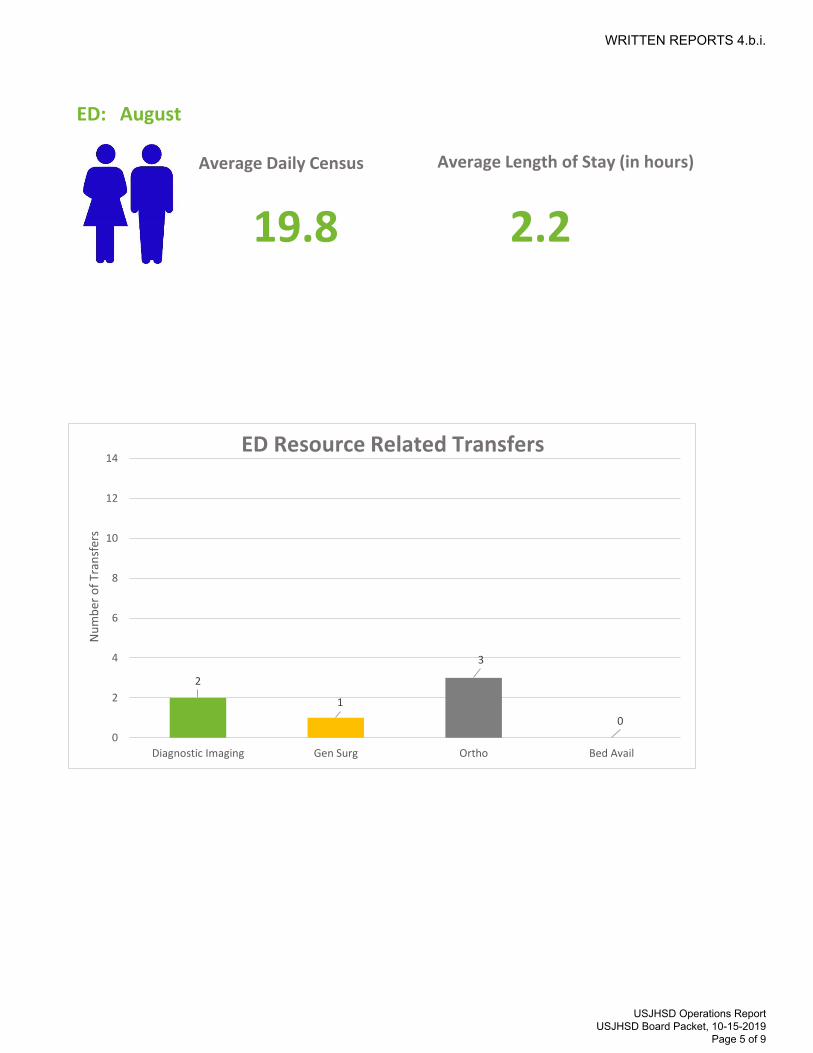
Average Daily Census
19.8
Average Length of Stay (in hours)
2.2
2
1
3
0
0
2
4
6
8
10
12
14
Diagnostic Imaging Gen Surg Ortho Bed Avail
Nu
mb
er o
f Tr
ansf
ers
ED Resource Related Transfers
ED: August
USJHSD Operations Report USJHSD Board Packet, 10-15-2019
Page 5 of 9
WRITTEN REPORTS 4.b.i.

Inpatient :
Average Daily Census Average Length of Stay (in days)
3.9 2.8
Jan Feb Mar Apr May Jun Jul Aug Sep Oct Nov Dec
2019 37 28 40 31 27 39 38 31 25
2018 50 41 44 34 33 44 41 38 36 29 21 39
0
10
20
30
40
50
60
Inp
atie
nt
Ad
mis
sio
ns
Inpatient Admission Comparison
2019
2018
August
USJHSD Operations Report USJHSD Board Packet, 10-15-2019
Page 6 of 9
WRITTEN REPORTS 4.b.i.

Diagnostic Imaging:
1370
1021
1412
1016
0
200
400
600
800
1000
1200
1400
1600
Procedures Patients
Diagnostic Imaging Stats by Month
2019 2018
2019
2018
0
20
40
60
2D Echo Stress Echo
2019 49 12
2018 55 8
49
12
55
8
Cardiology 2D Echo & Stress by Month
2019 2018
August
USJHSD Operations Report USJHSD Board Packet, 10-15-2019
Page 7 of 9
WRITTEN REPORTS 4.b.i.

Lab:
5002
1762
4954
1847
0
1000
2000
3000
4000
5000
6000
Tests Patients
Lab Test & Patient Volume by Month
2019 2018
Clinic
1648
439
1706
487
0
200
400
600
800
1000
1200
1400
1600
1800
PCP Encounters Speciality Clinic Encounters
Rural Health Clinic Encounters by Month
2019 2018
Clinic :
August
August
USJHSD Operations Report USJHSD Board Packet, 10-15-2019
Page 8 of 9
WRITTEN REPORTS 4.b.i.
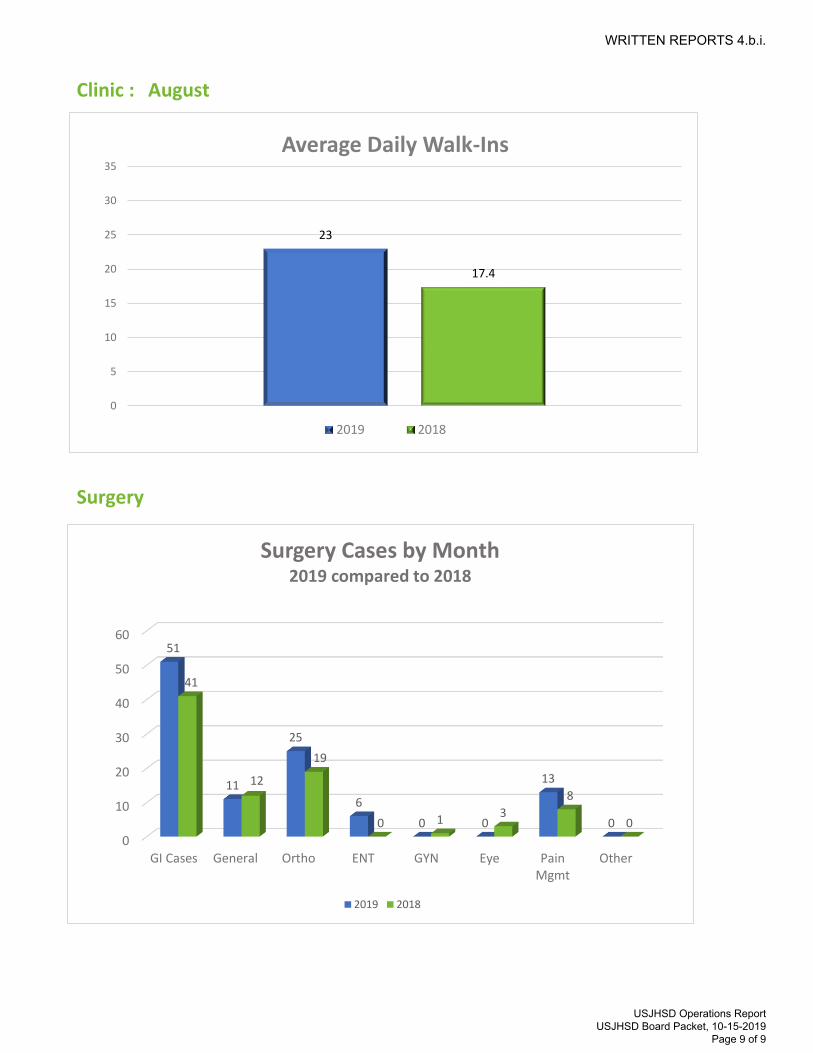
23
17.4
0
5
10
15
20
25
30
35
Average Daily Walk-Ins
2019 2018
Surgery
0
10
20
30
40
50
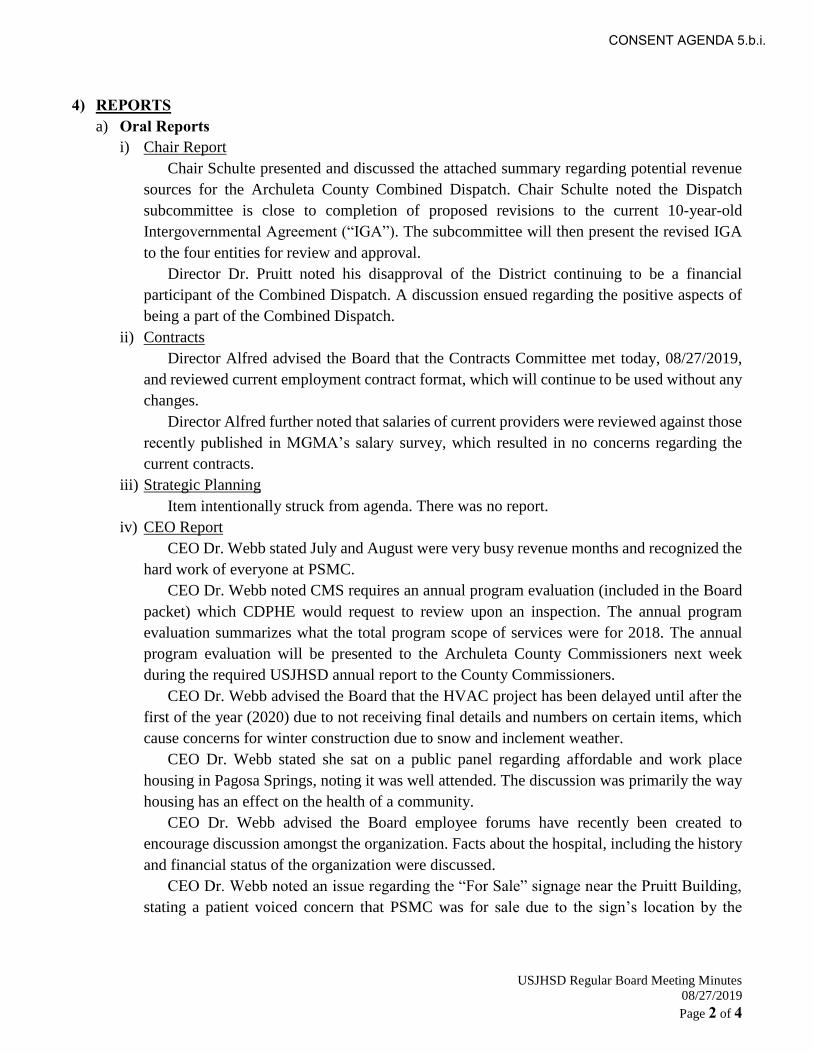
60
GI Cases General Ortho ENT GYN Eye PainMgmt
Other
51
11
25
6
0 0
13
0
41
12
19
0 13
8
0
Surgery Cases by Month2019 compared to 2018
2019 2018
Clinic : August
USJHSD Operations Report USJHSD Board Packet, 10-15-2019
Page 9 of 9
WRITTEN REPORTS 4.b.i.

USJHSD Medical Staff Report
USJHSD Board Packet, 10-15-2019
Page 1 of 1
THE UPPER SAN JUAN HEALTH SERVICE DISTRICT DOING BUSINESS AS PAGOSA SPRINGS MEDICAL CENTER
MEDICAL STAFF REPORT BY CHIEF OF STAFF, RALPH BATTELS October 15, 2019
I. STATEMENT OF THE MEDICAL STAFF’S RECOMMENDATIONS FOR THE USJHSD BOARD ACCEPTANCE
OF NEW POLICIES OR PROCEDURES ADOPTED BY THE MEDICAL STAFF:
II. STATEMENT OF THE MEDICAL STAFF’S RECOMMENDATIONS FOR THE USJHSD BOARD ACCEPTANCE
OF PROVIDER PRIVILEGES (ACCEPTANCE BY THE BOARD RESULTS IN THE GRANT OF PRIVILEGES):
NAME INITIAL/REAPPOINT/CHANGE TYPE OF PRIVILEGES SPECIALTY John Brach, MD Initial Appointment Courtesy/Ophthalmology Ophthalmology
Maysun Ali, DO Reappointment Telemedicine/Teleneurology Neurology & Vascular
Neurology
Brett Bartz, MD Reappointment Telemedicine/Teleradiology Diagnostic Radiology &
Pediatric Radiology
Joshua Borgstadt, PA-C Reappointment AHP/Family Medicine Family Medicine
Judith Cole, RNFA Reappointment AHP/Registered Nurse First
Assistant
Registered Nurse First
Assistant
Richard Coursey, MD Reappointment Telemedicine/Teleradiology Diagnostic Radiology &
Interventional Radiology
Tyler Green, MD Reappointment Telemedicine/Teleradiology Diagnostic Radiology &
Interventional Radiology
Corinne Reed, DO Reappointment Active/Family Medicine,
Hospitalist, Osteopathic
Manipulative Therapy
Family Medicine
Aaron Singh, PA-C Reappointment AHP/Family Medicine Family Medicine
William Webb, MD Reappointment Active/Orthopedics General Orthopaedics
III. REPORT OF NUMBER OF PROVIDERS BY CATEGORY
Active: 17
Courtesy: 28
Telemedicine: 122
Allied Health Professionals: 29
Total: 196
WRITTEN REPORTS 4.b.ii.

USJHSD Regular Board Meeting Minutes
08/27/2019
Page 1 of 4
MINUTES OF REGULAR BOARD MEETING Tuesday, August 27, 2019
5:30 PM The Board Room
95 South Pagosa Blvd., Pagosa Springs, CO 81147
The Board of Directors of the Upper San Juan Health Service District (the “Board”) held its regular board
meeting on August 27, 2019, at Pagosa Springs Medical Center, The Board Room, 95 South Pagosa Blvd.,
Pagosa Springs, Colorado.
Directors Present: Chair Greg Schulte, Vice-Chair Matt Mees, Director Kate Alfred, Director Dr. Jim
Pruitt, and Director Karin Daniels.
Director(s) Absent: Treasurer-Secretary Dr. King Campbell and Director Jason Cox. (The noted absences
were excused due to prior notification.)
1) CALL TO ORDERa) Call for quorum: Chair Schulte called the meeting to order at 5:30 p.m. MDT and Clerk of the
Board, Heather Thomas, recorded the minutes. A quorum of directors was present and
acknowledged.
b) Board member self-disclosure of actual, potential or perceived conflicts of interest: There were
none.
c) Approval of the Agenda: The Board noted approval of the agenda.
2) PUBLIC COMMENTThere was no public comment.
3) PRESENTATIONPSMC Orthopedic Surgeon, Dr. William Webb, presented the attached PowerPoint presentation
regarding the orthopedic service line.
CONSENT AGENDA 5.b.i.
USJHSD Regular Board Meeting Minutes
08/27/2019
Page 2 of 4
4) REPORTSa) Oral Reports
i) Chair Report
Chair Schulte presented and discussed the attached summary regarding potential revenue
sources for the Archuleta County Combined Dispatch. Chair Schulte noted the Dispatch
subcommittee is close to completion of proposed revisions to the current 10-year-old
Intergovernmental Agreement (“IGA”). The subcommittee will then present the revised IGA
to the four entities for review and approval.
Director Dr. Pruitt noted his disapproval of the District continuing to be a financial
participant of the Combined Dispatch. A discussion ensued regarding the positive aspects of
being a part of the Combined Dispatch.
ii) Contracts
Director Alfred advised the Board that the Contracts Committee met today, 08/27/2019,
and reviewed current employment contract format, which will continue to be used without any
changes.
Director Alfred further noted that salaries of current providers were reviewed against those
recently published in MGMA’s salary survey, which resulted in no concerns regarding the
current contracts.
iii) Strategic Planning
Item intentionally struck from agenda. There was no report.
iv) CEO Report
CEO Dr. Webb stated July and August were very busy revenue months and recognized the
hard work of everyone at PSMC.
CEO Dr. Webb noted CMS requires an annual program evaluation (included in the Board
packet) which CDPHE would request to review upon an inspection. The annual program
evaluation summarizes what the total program scope of services were for 2018. The annual
program evaluation will be presented to the Archuleta County Commissioners next week
during the required USJHSD annual report to the County Commissioners.
CEO Dr. Webb advised the Board that the HVAC project has been delayed until after the
first of the year (2020) due to not receiving final details and numbers on certain items, which
cause concerns for winter construction due to snow and inclement weather.
CEO Dr. Webb stated she sat on a public panel regarding affordable and work place
housing in Pagosa Springs, noting it was well attended. The discussion was primarily the way
housing has an effect on the health of a community.
CEO Dr. Webb advised the Board employee forums have recently been created to
encourage discussion amongst the organization. Facts about the hospital, including the history
and financial status of the organization were discussed.
CEO Dr. Webb noted an issue regarding the “For Sale” signage near the Pruitt Building,
stating a patient voiced concern that PSMC was for sale due to the sign’s location by the
CONSENT AGENDA 5.b.i.

USJHSD Regular Board Meeting Minutes
08/27/2019
Page 3 of 4
entrance to PSMC. CEO Dr. Webb advised that PSMC is not for sale, and is seeking grant
monies to assist in purchasing new signage, with a marquee, to place near Highway 160.
CEO Dr. Webb ended by advising the Board that PSMC’s Controller, Johna Lederhouse,
who has worked at PSMC for five years, is moving. CEO Dr. Webb and members of the Board
voiced their appreciation for Ms. Lederhouse’s years of service.
A discussion ensued regarding jurisdiction of new signage placement.
v) Finance Report
CFO, Chelle Keplinger, presented and discussed the financial PowerPoint presentation,
highlighting that July ended with the highest-ever gross revenue for the District.
Chair Schulte asked a question regarding tax revenue. CFO Keplinger answered.
CFO Keplinger recognized the Patient Financial Services Department, noting the
attendance of Director of Revenue Cycle, Debbie Campbell, and a few of the employees from
Patient Financial Services – Robyn Nembhard, Robin Whitman, Deana Condon and Tina
Corley, and congratulating the department for their accomplishment in achieving a drop of 20
days in AR to 55.96 days. The Board noted their appreciation for their hard work.
CFO Keplinger then presented and discussed updates to the Management Progress
Reporting Tool.
CAO Ann Bruzzese discussed the summary to the Board regarding evaluation of
refinancing the 2006 bonds as presented in the board packet. Director Dr. Pruitt asked a
question regarding a range of potential savings. CAO Bruzzese answered.
Director Alfred noted that she appreciates the Management Progress Reporting Tool and
suggested to change the report by placing any item still pending at the beginning of the
report and any item completed placed at the bottom of the report. Only items of
discussion would be those not yet completed. The Board noted their consent and approval of
the change to the Reporting Tool.
b) Written Reportsi) Operations Report
Director Dr. Pruitt asked a question regarding the cost of air transports. COO/CNO Kathee
Douglas and CEO Dr. Webb answered.
ii) Medical Staff Report
Director Dr. Pruitt asked a question regarding the initial appointments of the telemedicine
specialists listed within the Medical Staff Report, whether they were for emergency or clinic
services. COO/CNO Douglas answered. Director Dr. Pruitt then asked a question regarding
the status of procuring telemedicine services for the Clinic and psychiatric services. COO/CNO
Douglas answered.
CONSENT AGENDA 5.b.i.

USJHSD Regular Board Meeting Minutes
08/27/2019
Page 4 of 4
5) CONSENT AGENDA
Director Daniels motioned to approve the noted Board member absences, the minutes of the
regular meeting of 07/23/2019, and the Medical Staff report recommendations for new or renewal of
provider privileges.
Upon motion seconded by Director Alfred, the Board unanimously approved said consent agenda
items.
6) DECISION AGENDA
Chair Schulte gave an overview of Resolution 2019-07, regarding adjusting the meeting schedule
in September and October and affirming the days and times that the Board will meet each month for
the remainder of 2019.
Director Dr. Pruitt motioned to accept Resolution 2019-07. Upon motion seconded by Director
Daniels, the Board unanimously accepted said resolution.
7) EXECUTIVE SESSION
The Board did not meet in executive session.
8) OTHER BUSINESS
CEO Dr. Webb reminded the Board of the upcoming Open House to commence Thursday, 09/26/2019
at 5:30 p.m. Notice will be provided to the public regarding a possible quorum due to Directors’ presence
at the Open House.
9) ADJOURN There being no further business, Chair Schulte adjourned the regular meeting at 6:45 p.m. MDT.
Respectfully submitted by:
Heather Thomas, serving as Clerk of the Board
CONSENT AGENDA 5.b.i.
Top Related