


Languages
Pages
Legal

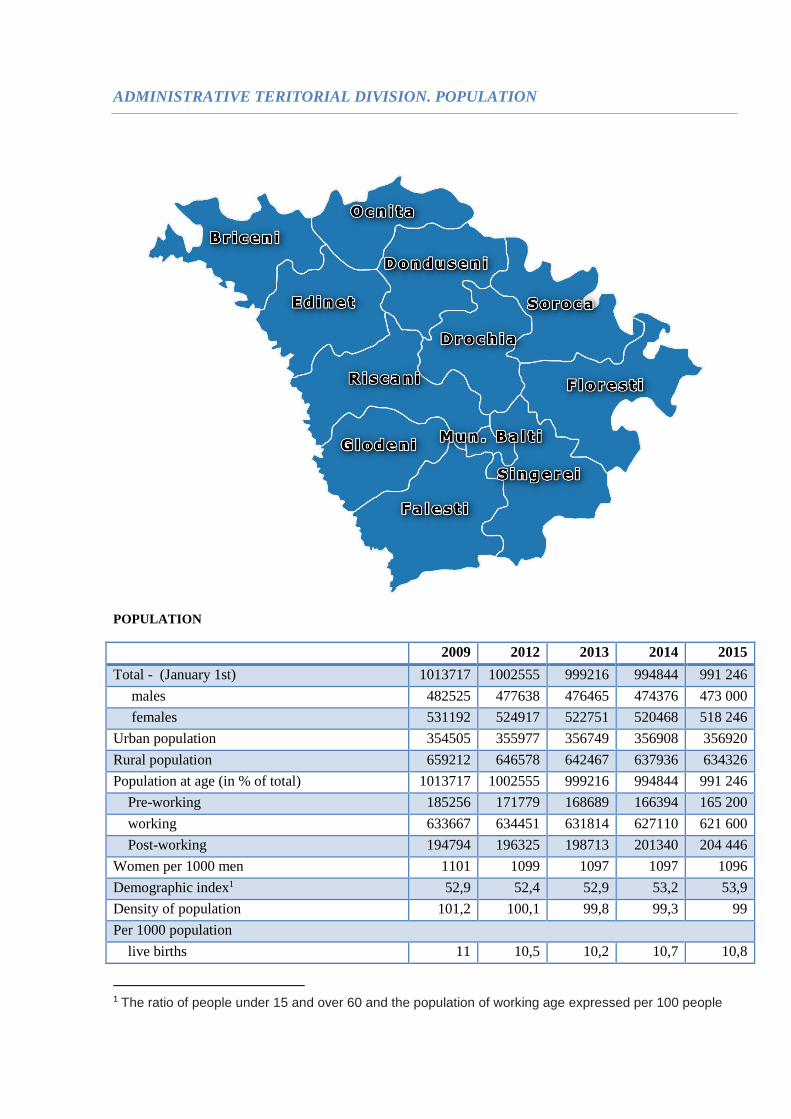
ADMINISTRATIVE TERITORIAL DIVISION. POPULATION
POPULATION
2009 2012 2013 2014 2015
Total - (January 1st) 1013717 1002555 999216 994844 991 246
males 482525 477638 476465 474376 473 000
females 531192 524917 522751 520468 518 246
Urban population 354505 355977 356749 356908 356920
Rural population 659212 646578 642467 637936 634326
Population at age (in % of total) 1013717 1002555 999216 994844 991 246
Pre-working 185256 171779 168689 166394 165 200
working 633667 634451 631814 627110 621 600
Post-working 194794 196325 198713 201340 204 446
Women per 1000 men 1101 1099 1097 1097 1096
Demographic index1 52,9 52,4 52,9 53,2 53,9
Density of population 101,2 100,1 99,8 99,3 99
Per 1000 population
live births 11 10,5 10,2 10,7 10,8
1 The ratio of people under 15 and over 60 and the population of working age expressed per 100 people

deaths 13,9 13,1 13 13 13,1
natural increase -2,9 -2,6 -2,8 -2,3 -2,3
marriages 6,5 6 6,2 6,3 6,3
divorces 2,9 2,7 2,8 3 2,9
infant deaths (under 1 year) 12 9,4 10,2 11,4 9,1
average life expectancy, years 70,1 71,8 72,1 72,2 -
STRUCTURE OF POPULATION BY AGE GROUPS IN NDR, 2009-2015, %
LABOUR MARKET
2009 2012 2013 2014 2015
Employed population, thousands of people 322,9 324,5 340,9 347,4 366,7
males 157,1 153,6 168,4 171,7 175,6
females 165,8 170,9 172,5 175,7 191,1
Employed population, by age, thousands of people
15-24 years old 27,8 27,4 26,4 28,5 26,2
25-34 years old 55,9 66,4 74,8 73,6 78,2
35-44 years old 80,3 80,9 80,6 85,3 91,2
45-54 years old 99,1 88,8 92,9 88,8 88,7
55-64 years old 46,5 50,4 52,8 55,0 62,6
65 years and above 13,3 10,6 13,4 16,3 19,7
People aged 15 and above working abroad,
thousands of people
86,4 98 101,6 101,3 97,6
males 60,2 69,5 70 69,9 69,4
females 26,2 28,5 31,6 31,3 28,2
DISTRIBUTION OF EMPLOYED POPULATION BY REGIONAL ECONOMIC SECTORS
18,27% 17,85% 17,46% 17,13% 16,88% 16,73% 16,67%
62,51% 62,89% 63,24% 63,28% 63,23% 63,04% 62,71%
19,22% 19,26% 19,30% 19,58% 19,89% 20,24% 20,62%
0,00%
20,00%
40,00%
60,00%
80,00%
100,00%
120,00%
2009 2010 2011 2012 2013 2014 2015
0-14 15-57/62 57/62+

UNEMPLOYED PEOPLE
2009 2012 2013 2014 2015
Total, thousands of people 18 15,8 13,7 8,6 17,4
males 11,6 9 7,1 4,9 9,8
females 6,5 6,8 6,6 3,8 7,6
Unemployment rate, % 5,3 4,6 3,9 2,4 4,5
Unemployment rate according to age
groups, %
15-24 14 13,2 10,4 7 14,2
25-34 5,4 5 6 3,1 6,4
35-44 4,6 5,1 3,7 2,7 3,8
45-54 4,8 3,3 1,9 1,8 3,3
55-64 3 1,6 1,8 0,4 1,7
UNEMPLOYMENT RATE, %
ACTIVITY OF ECONOMIC AGENTS
2009 2010 2011 2012 2013 2014
41%
12%
2%
15%
4%
22%
4%
2011
49%
10%3%
12%
4%
17%
5%
2014 Agriculture, hunting
and pisciculture
Industry
Construction
Wholesale and retail.
Hotels and restaurants
Transport and
communication
Public administration;
Education; Health
and social welfareOthers
5,3 5,75,2
4,6
3,9
2,4
4,5
0
1
2
3
4
5
6
2009 2010 2011 2012 2013 2014 2015
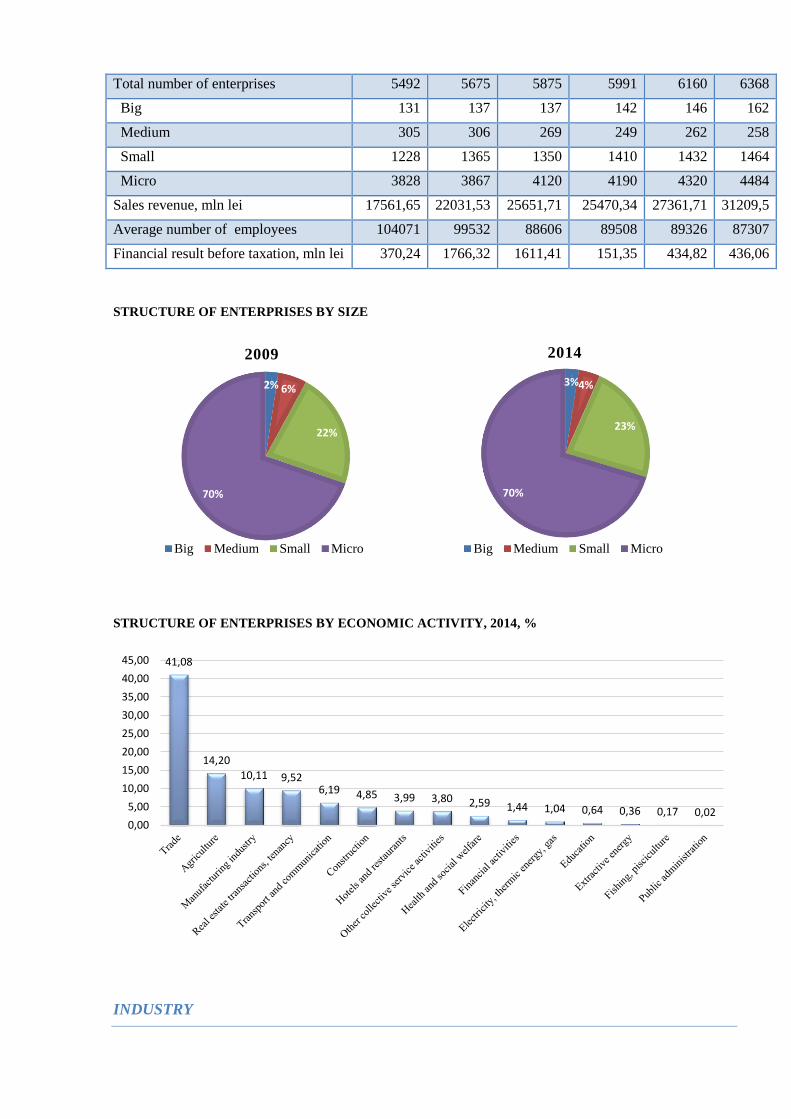
Total number of enterprises 5492 5675 5875 5991 6160 6368
Big 131 137 137 142 146 162
Medium 305 306 269 249 262 258
Small 1228 1365 1350 1410 1432 1464
Micro 3828 3867 4120 4190 4320 4484
Sales revenue, mln lei 17561,65 22031,53 25651,71 25470,34 27361,71 31209,5
Average number of employees 104071 99532 88606 89508 89326 87307
Financial result before taxation, mln lei 370,24 1766,32 1611,41 151,35 434,82 436,06
STRUCTURE OF ENTERPRISES BY SIZE
STRUCTURE OF ENTERPRISES BY ECONOMIC ACTIVITY, 2014, %
INDUSTRY
2% 6%
22%
70%
2009
Big Medium Small Micro
3%4%
23%
70%
2014
Big Medium Small Micro
41,08
14,2010,11 9,52
6,19 4,85 3,99 3,80 2,59 1,44 1,04 0,64 0,36 0,17 0,020,00
5,00
10,00
15,00
20,00
25,00
30,00
35,00
40,00
45,00

VALUE OF INDUSTRIAL PRODUCTION, MLN OF LEI
-31,24
-1,541,70
24,87 24,77
-40,00
-30,00
-20,00
-10,00
0,00
10,00
20,00
30,00
0,00
2.000,00
4.000,00
6.000,00
8.000,00
10.000,00
2009 2012 2013 2014 2015
VIP, mln lei Growth rate reported to 2008

MAIN FOOD PRODUCTS, 2015
AGRICULTURE
AGRICULTURAL SURFACE ARABLE LAND SURFACE
HARVEST OF MAIN AGRICULTURAL CROPS, 2015
67%57% 55%
37% 40%
33%43% 45%
63% 60%
M I L K A N D D A I R Y P R O D U C T S
P E A R L C E R E A L S F O R A G E C A N N E D V E G E T A B L E S A N D
F R U I T S
G R A V E L
pastures and
hayfields
17%
permanent
crops6%
arable land
surface77%
industrial crops44%
forage 1%
cereals53%
potatoes, vegetables
2%
98% 96%88%
74%57% 57%
40% 38%
2% 4%12%
26%43% 43%
60% 62%
S U G A R B E E T S O Y A P O T A T O E S R A P E F R U I T S F I E L D V E G E T A B L E S
S U N F L O W E R C E R E A L S

INVESTMENT
EVOLUTION OF LONG-TERM INVESTMENT, MLN LEI
1948,21758,8
2713,7
2400,7
2828,13044,8
2459,1
0
500
1000
1500
2000
2500
3000
3500
2009 2010 2011 2012 2013 2014 2015

INVESTMENT BY ECONOMIC ACTIVITY, MLN LEI
64
1,6
7
52
4,7
8
27
1,5
7
21
0,8
4
18
3,3
9
14
5,8
4
13
2,9
4
11
2,7
9
77
,14
48
,41
39
,38
20
,12
14
,22
13
,63
12
,64
3,9
3
1,0
5
4,7
3
0
100
200
300
400
500
600
700
Top Related