


Languages
Pages
Legal

Ø Solving!for!Unknown!Values!in!the!Normal!Model
Ø Sum!of!Normal!Random!Variables
ØNormal!Approximation!for!the!Binomial
Normal Distribution: Part 2
Lecture!13Sections!7.2,!7.4,!7.5
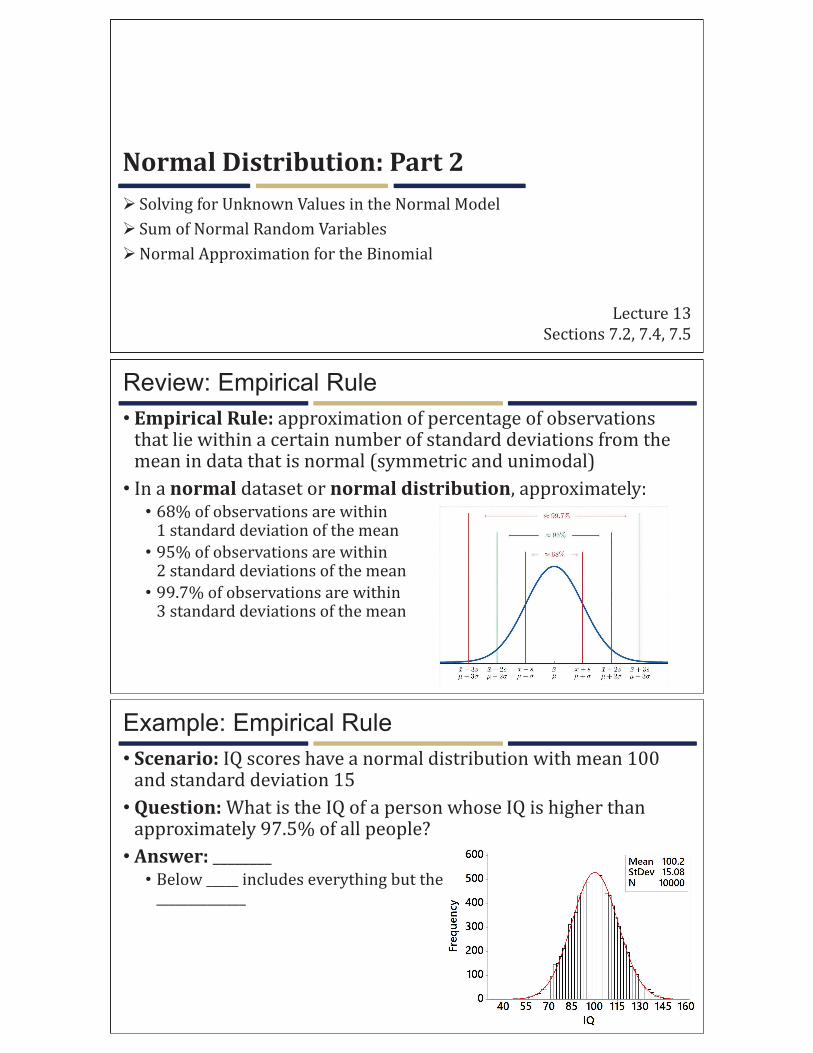
Review: Empirical Rule
• Empirical Rule: approximation!of!percentage!of!observations!that!lie!within!a!certain!number!of!standard!deviations!from!the!mean!in!data!that!is!normal!(symmetric!and!unimodal)
• In!a!normal dataset!or!normal distribution,!approximately:• 68%!of!observations!are!within!1!standard!deviation!of!the!mean
• 95%!of!observations!are!within!2!standard!deviations!of!the!mean
• 99.7%!of!observations!are!within!3!standard!deviations!of!the!mean
Example: Empirical Rule
• Scenario: IQ!scores!have!a!normal!distribution!with!mean!100!and!standard!deviation!15
• Question: What!is!the!IQ!of!a!person!whose!IQ!is!higher!than!approximately!97.5%!of!all!people?
• Answer: ________• Below!_____ includes!everything!but!the!______________

Example: Empirical Rule
• Scenario: IQ!scores!have!a!normal!distribution!with!mean!100!and!standard!deviation!15
• Question: What!is!the!IQ!of!a!person!whose!IQ!is!higher!than!approximately!90%!of!all!people?
• Answer: ____________________________________________________• 115!has!________!to!the!left;!130!has!________!to!the!left
• Best!estimate:!__________________________
Review: Normal Probabilities
• Known: Value!of!observation!! from!normally!distributed!random!variable!with!mean!" and!standard!deviation!#
• Unknown: Area!(probability)!to!the!left!of!!
• Strategy:
• Standardize!using!$ =%&'
(
• Find!probability!using!standard!normal!table
Normal Percentiles
• Known: Area!to!the!left!(or!right)!of!desired!observation!from!normally!distributed!random!variable
• Unknown: Either�• Value!of!the!observation
• Mean!of!the!distribution
• Standard!deviation!of!the!distribution
• Strategy:• Find!Z-score!corresponding!to!desired!percentile• Locate!the!closest!percentile/probability!inside the!table
• Work!to!the!left!and!up!to!the!top!row!to!solve!for!the!Z-score
• Solve!for!the!unknown!value!in!$ =%&'
(

Example: Unknown Observation
• Scenario: IQ!scores!have!a!normal!distribution!with!mean!100!and!standard!deviation!15
• Question: What!is!the!IQ!of!a!person!whose!IQ!is!higher!than!approximately!90%!of!all!people?
• Picture: • Sub-Question 1: What!Z-score!will!give!us!90%!of!the!area!in!the!lower!tail?• Find!the!___________________________!_________________________• Solve!for!______________• 90th percentile:!___________________
_______
_______
_______
_______
Example: Unknown Observation
• Scenario: IQ!scores!have!a!normal!distribution!with!mean!100!and!standard!deviation!15
• Question: What!is!the!IQ!of!a!person!whose!IQ!is!higher!than!approximately!90%!of!all!people?
• Picture: • Sub-Question 2: What!specific!value!is!this!many!standard!deviations!above!the!mean?
• Set!up!__________:!__________________
• Solve!for!__________________________:!_____________________________________
Example: Unknown Mean
• Scenario: Tire!manufacturer!promises!that!its!tires!will!last!60,000!miles!or!patrons!get!a!refund.!!Assume!# = 7000miles.
• Question: If!mileages!are!normal,!what!must!the!mean!mileage!be!such!that!no!more!than!3%!of!tires!last!less!than!60,000!miles?
• Picture: • Sub-Question 1: What!Z-score!will!give!us!3%!of!the!area!in!the!lower!tail?• Find!the!probability!______ inside!the!table• Solve!for!_____________• 3rd percentile:!____________________
_______
_______

_______
_______
Example: Unknown Mean
• Scenario: Tire!manufacturer!promises!that!its!tires!will!last!60,000!miles!or!patrons!get!a!refund.!!Assume!# = 7000miles.
• Question: If!mileages!are!normal,!what!must!the!mean!mileage!be!such!that!no!more!than!3%!of!tires!last!less!than!60,000!miles?
• Picture: • Sub-Question 2: What!should!the!mean!tires!length!be!if!3%!of!the!area!is!in!the!lower!tail?
• Set!up!Z-score:!____________________
• Solve!for!missing!mean:!!!!!!!!!!!" = ________________________________
= ____________
Example: Unknown Standard Deviation
• Scenario:More!consistent!speeds!on!the!highway!tend!to!reduce!accidents.!!The!speed!limit!on!PA!highways!is!70!mph.!!Suppose!7%!of!cars!travel!faster!than!80!mph!and!speeds!are!normal.
• Question: What!is!the!standard!deviation!of!the!speeds!of!cars?
• Picture: • Sub-Question 1: What!Z-score!will!give!us!7%!of!the!area!in!the!upper!tail?• 7%!in!upper!tail!means!_________!percentile• ________!percentile:!________________
_______
_______
Example: Unknown Standard Deviation
• Scenario:More!consistent!speeds!on!the!highway!tend!to!reduce!accidents.!!The!speed!limit!on!PA!highways!is!70!mph.!!Suppose!7%!of!cars!travel!faster!than!80!mph!and!speeds!are!normal.
• Question: What!is!the!standard!deviation!of!the!speeds!of!cars?
• Picture: • Sub-Question 2: With!mean!70,!what!standard!deviation!yields!7%!of!the!area!in!the!upper!tail?
• Set!up!Z-score:!____________________
• Solve!for!standard!deviation:!
# = ________________________________

Using Excel
• One!function!will!find!the!value!of!missing!observation:• =NORM.INV([PROBABILITY], [MEAN], [STANDARD DEVIATION])• Used!before!standardizing
• One!function!will!find!the!Z-score!corresponding!to!a!percentile:• =NORM.S.DIST([PROBABILITY])
• Used!if!the!probability!is!known!but!either!mean!or!standard!deviation!is!missing!so!more!work!needs!to!be!done
Sum and Difference of Normal Random Variables
• Suppose!) and!* are!two!different!normal!distributions!with!means!"+ and!", and!standard!deviations!#+ and!#,.!!Then:
• The!distribution!of!the!sum!) - * is!normal!with:• Mean:!"+., = "+ - ",
• Standard!Deviation:!#+., = #+/ - #,
/
• The!distribution!of!the!difference!) 1 * is!normal!with:• Mean:!"+., = "+ 1 ",
• Standard!Deviation:!#+., = #+/ - #,
/
Example: Sum of Normal Random Variables
• Scenario: Sales!at!a!coffee!shop!on!weekdays!average!$1500!with!a!standard!deviation!of!$120!while!sales!on!weekends!average!$1200!with!a!standard!deviation!of!$150.
• Question: What!are!the!mean!and!standard!deviation!of!the!total!sales!over!a!weekend?
• Answer: ) = ______________;!* = _____________• Mean: "+., = ___________________________________________
• Standard Deviation: #+., = _________________________________________________

Example: Sum of Normal Random Variables
• Scenario: Sales!at!a!coffee!shop!on!weekdays!average!$1500!with!a!standard!deviation!of!$120!while!sales!on!weekends!average!$1200!with!a!standard!deviation!of!$150.
• Question: What!is!the!probability!that!sales!are!less!than!$2000!over!a!weekend?
• Answer:
____________________!= ___________________________
= _____________________
= ____________
Example: Difference of Normal Random Variables
• Scenario: Sales!at!a!coffee!shop!on!weekdays!average!$1500!with!a!standard!deviation!of!$120!while!sales!on!weekends!average!$1200!with!a!standard!deviation!of!$150.
• Question: What!are!the!mean!and!standard!deviation!of!the!difference!in!sales!between!a!weekday!and!weekend!day?
• Answer: ) = ______________;!* = _____________• Mean: "+&, = ___________________________________________
• Standard Deviation: #+&, = _________________________________________________
Example: Difference of Normal Random Variables
• Scenario: Sales!at!a!coffee!shop!on!weekdays!average!$1500!with!a!standard!deviation!of!$120!while!sales!on!weekends!average!$1200!with!a!standard!deviation!of!$150.
• Question: What!is!the!probability!that!sales!on!a!randomly!selected!weekday!will!exceed!those!on!a!random!weekend!day?
• Answer:
____________________!= ___________________________
= _____________________
= _____________________
= _____________________
= ____________

Motivation: Normal Approximation for the Binomial
• Scenario: 8%!of!males!in!the!general!population!are!color!blind.
• Question: In!a!random!sample!of!500!males,!what!is!the!probability!that!35!or!fewer!males!in!the!sample!are!color!blind?
• Problem: Calculating!this!probability!without!software!would!require!____________________________________• 2 ) 3 45 = ________________________________________________________________
• Solution: Use!the!__________________!to!_______________!the!probability
Normal Approximation for the Binomial
• If!68 9 :0 and!6; 9 :0,!then!the!binomial!model!can!be!approximated!using!a!normal!model!with:• Mean: " = 68
• Standard Deviation: # = 68;
• Note:!The!normal!model!will!not!be!appropriate!if!the!sample!size!is!_______________________________.
Example: Normal Approximation for the Binomial
• Scenario: 8%!of!males!in!the!general!population!are!color!blind.
• Question: In!a!random!sample!of!500!males,!what!is!the!probability!that!35!or!fewer!males!in!the!sample!are!color!blind?
• Answer:• Mean: " = ___________________
• Standard Deviation: # = ___________________________
• Approximate Probability:
____________________!= ___________________________
= _____________________
= ____________
• Exact Probability: ____________
Top Related