


Languages
Pages
Legal

Presented by
Joel Humphrey CPA, CA, CISA
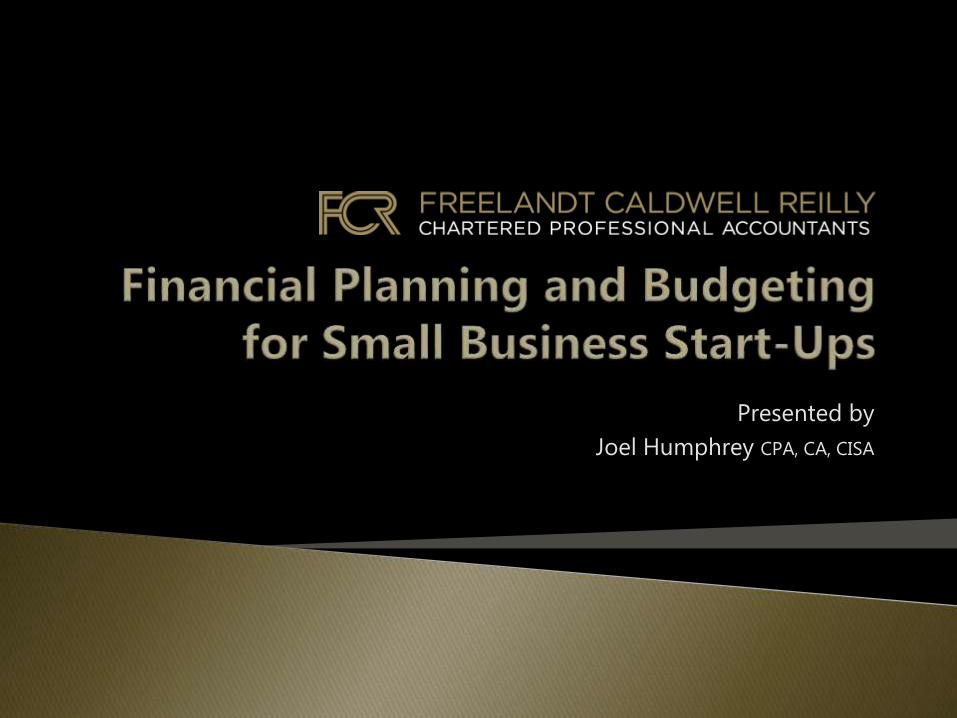
Why is financial planning important?
Basic components of the financial plan
Forecasting and budgeting for your
start-up
Overview of financial statements
Financing your business start-up
Tools and resources

Business
Plan
Executive
Summary
Mission
Statement
Company
Analysis
Product
Description
and CVP
Human
Resource
Planning
SWOT
Analysis
Industry
Analysis
Competitor
Analysis
Operations
Planning
Marketing
Strategy
Financial
Plan
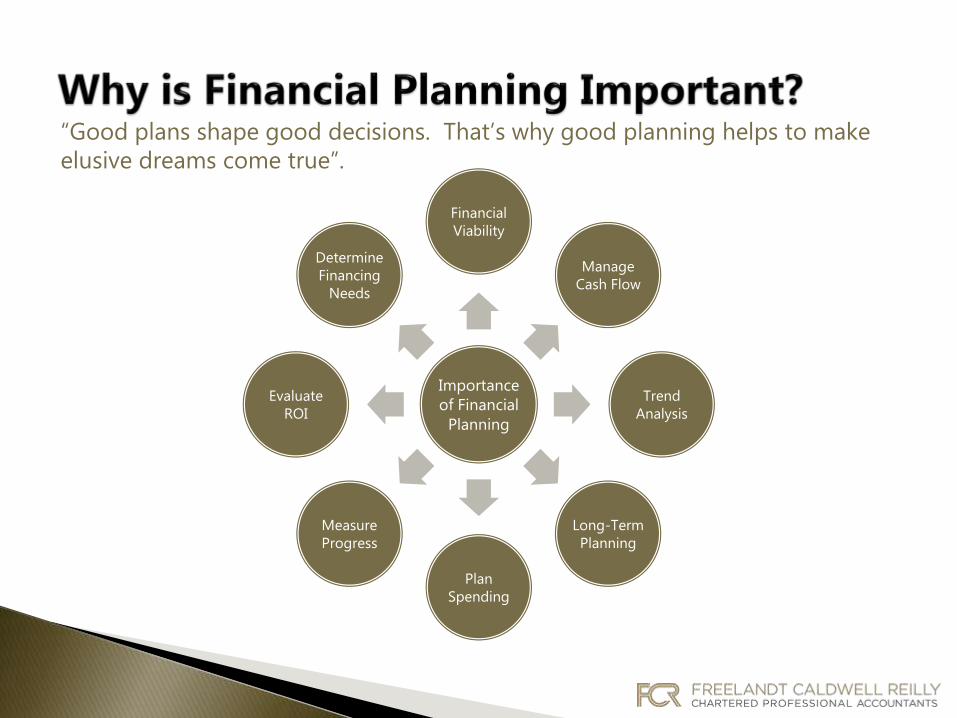
Importance
of Financial
Planning
Financial
Viability
Manage
Cash Flow
Trend
Analysis
Long-Term
Planning
Plan
Spending
Measure
Progress
Evaluate
ROI
Determine
Financing
Needs
“Good plans shape good decisions. That’s why good planning helps to make
elusive dreams come true”.

Critical part of the business plan – the
numbers have to make sense!
A good financial plan has all of these
components.
Integrate with business plan.
Typical timeframe 3-5 years.
The first year should be broken down
by month.
Should be consistently updated with
new and more reliable information.
Sales Forecast
Expense Budget
Capital Asset Budget
Cash Flow Budget

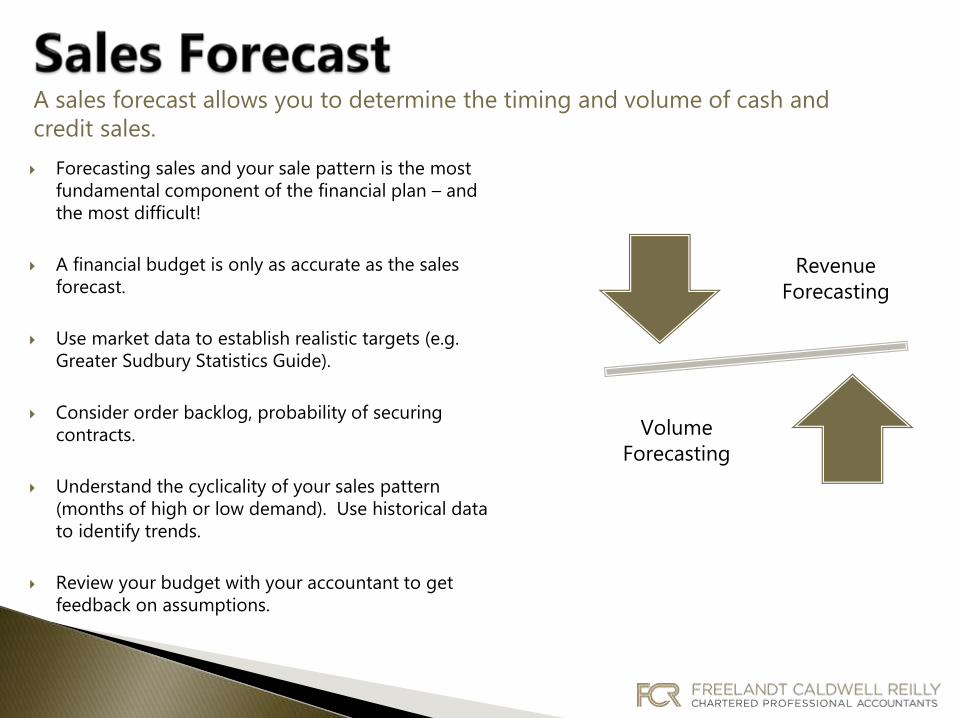
Forecasting sales and your sale pattern is the most
fundamental component of the financial plan – and
the most difficult!
A financial budget is only as accurate as the sales
forecast.
Use market data to establish realistic targets (e.g.
Greater Sudbury Statistics Guide).
Consider order backlog, probability of securing
contracts.
Understand the cyclicality of your sales pattern
(months of high or low demand). Use historical data
to identify trends.
Review your budget with your accountant to get
feedback on assumptions.
A sales forecast allows you to determine the timing and volume of cash and
credit sales.
Revenue
Forecasting
Volume
Forecasting
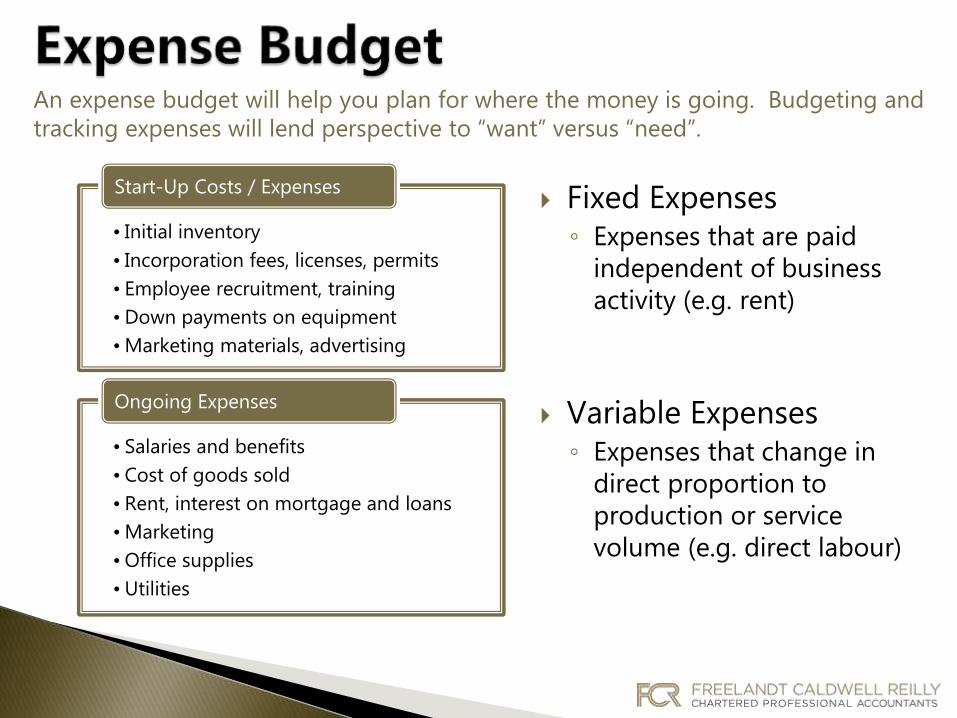
• Initial inventory
• Incorporation fees, licenses, permits
• Employee recruitment, training
• Down payments on equipment
• Marketing materials, advertising
Start-Up Costs / Expenses
• Salaries and benefits
• Cost of goods sold
• Rent, interest on mortgage and loans
• Marketing
• Office supplies
• Utilities
Ongoing Expenses
Fixed Expenses◦ Expenses that are paid
independent of business
activity (e.g. rent)
Variable Expenses◦ Expenses that change in
direct proportion to
production or service
volume (e.g. direct labour)
An expense budget will help you plan for where the money is going. Budgeting and
tracking expenses will lend perspective to “want” versus “need”.
How to determine what your business expenses are.
Start with fixed expenses that are predictable
(rent, property taxes etc).
Variable expenses can be identified by thinking
through the production, sales and delivery
processes (labour, cost of goods sold,
transportation etc).
Cost of goods sold can often be expressed as a
percentage of sales (gross margin).
Build in a contingency for unplanned expenses
– there will be!
Be conservative but realistic.
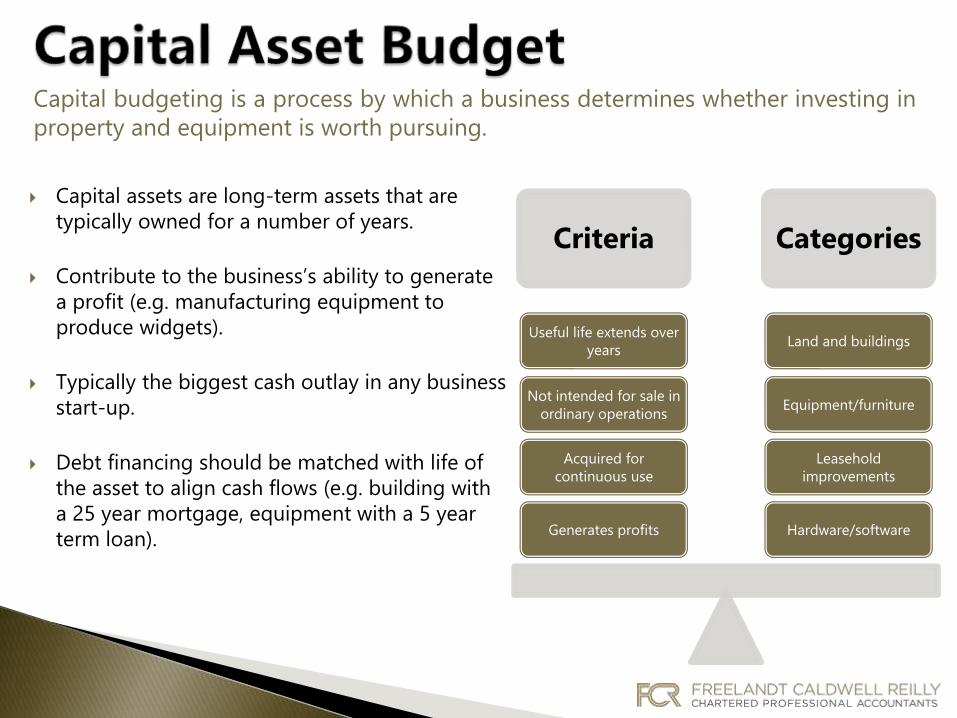
Capital budgeting is a process by which a business determines whether investing in
property and equipment is worth pursuing.
Criteria Categories
Hardware/software
Leasehold
improvements
Equipment/furniture
Land and buildings
Generates profits
Acquired for
continuous use
Not intended for sale in
ordinary operations
Useful life extends over
years
Capital assets are long-term assets that are
typically owned for a number of years.
Contribute to the business’s ability to generate
a profit (e.g. manufacturing equipment to
produce widgets).
Typically the biggest cash outlay in any business
start-up.
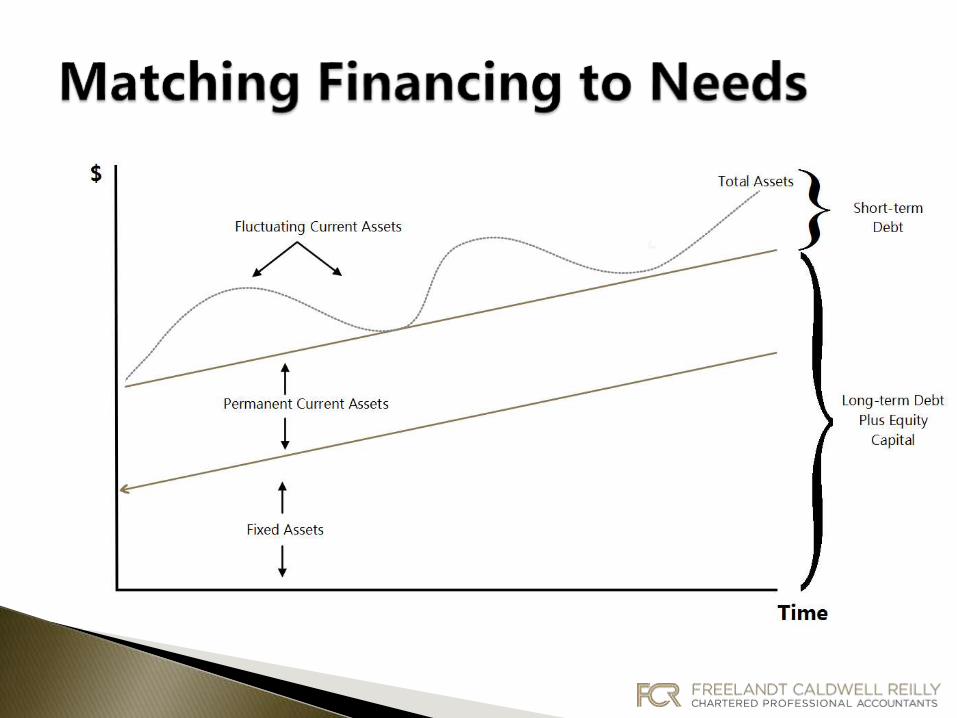
Debt financing should be matched with life of
the asset to align cash flows (e.g. building with
a 25 year mortgage, equipment with a 5 year
term loan).
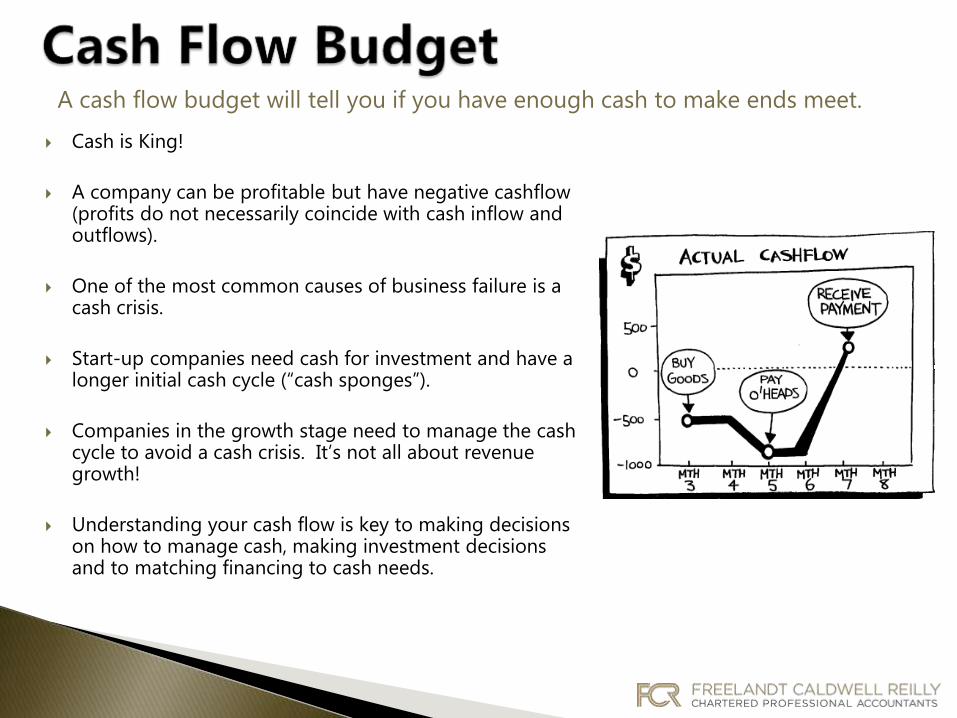
Cash is King!
A company can be profitable but have negative cashflow (profits do not necessarily coincide with cash inflow and outflows).
One of the most common causes of business failure is a cash crisis.
Start-up companies need cash for investment and have a longer initial cash cycle (“cash sponges”).
Companies in the growth stage need to manage the cash cycle to avoid a cash crisis. It’s not all about revenue growth!
Understanding your cash flow is key to making decisions on how to manage cash, making investment decisions and to matching financing to cash needs.
A cash flow budget will tell you if you have enough cash to make ends meet.
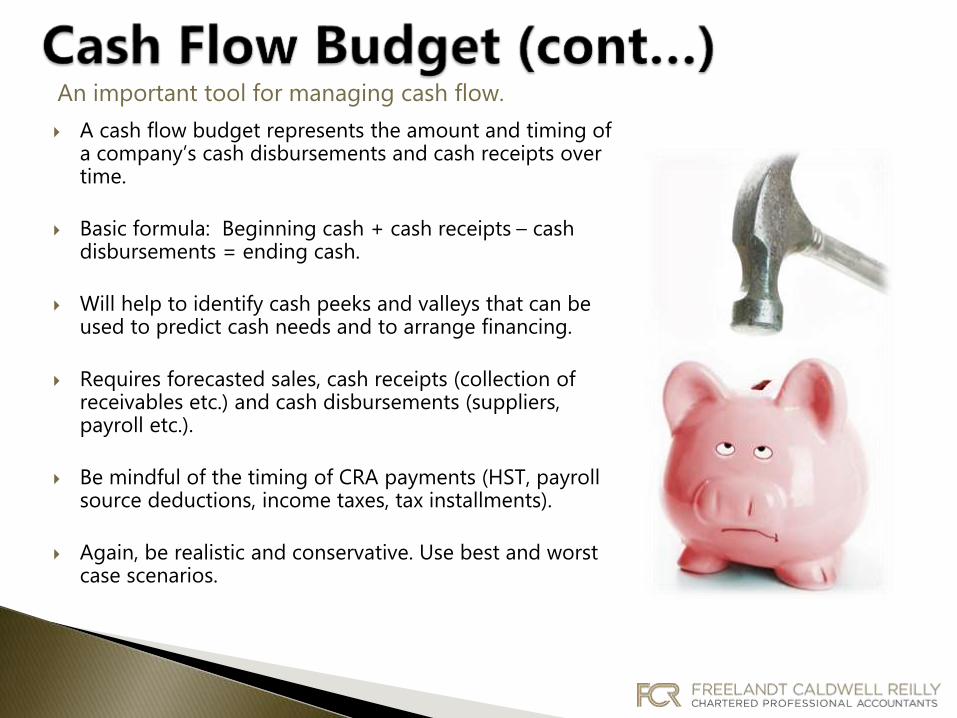
A cash flow budget represents the amount and timing of a company’s cash disbursements and cash receipts over time.
Basic formula: Beginning cash + cash receipts – cash disbursements = ending cash.
Will help to identify cash peeks and valleys that can be used to predict cash needs and to arrange financing.
Requires forecasted sales, cash receipts (collection of receivables etc.) and cash disbursements (suppliers, payroll etc.).
Be mindful of the timing of CRA payments (HST, payroll source deductions, income taxes, tax installments).
Again, be realistic and conservative. Use best and worst case scenarios.
An important tool for managing cash flow.

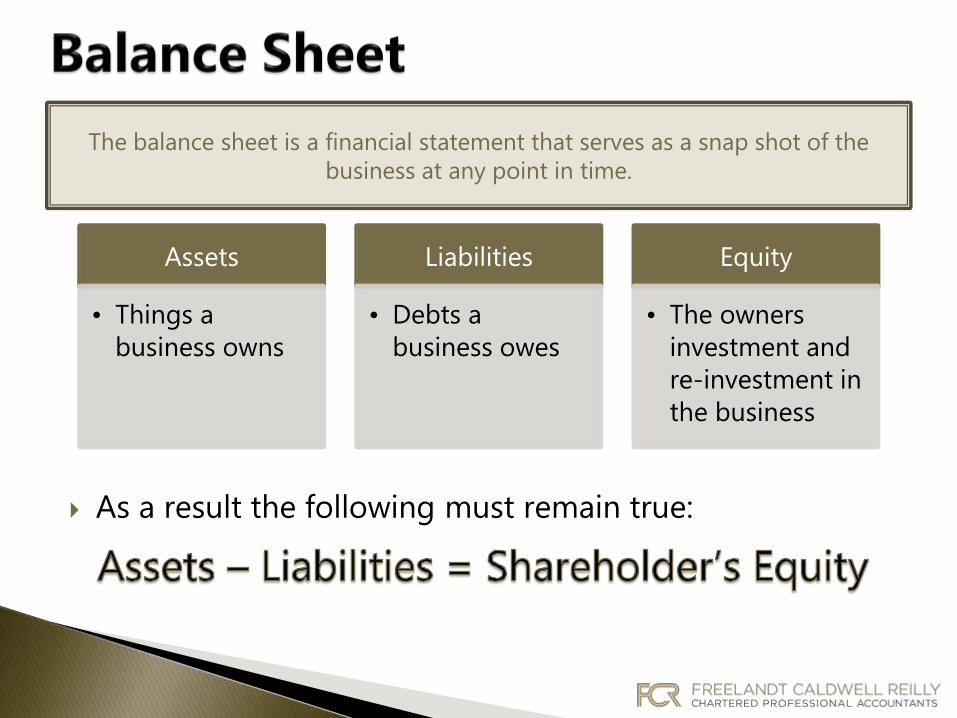
As a result the following must remain true:
The balance sheet is a financial statement that serves as a snap shot of the
business at any point in time.
Assets
• Things a
business owns
Liabilities
• Debts a
business owes
Equity
• The owners
investment and
re-investment in
the business
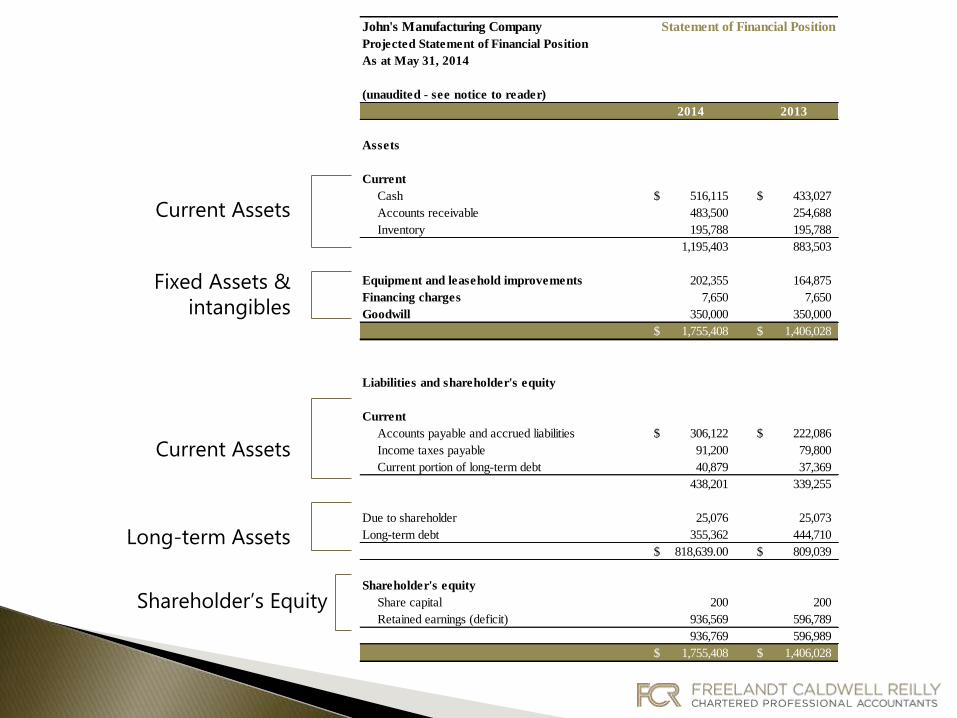
Current Assets
Fixed Assets &
intangibles
Current Assets
Long-term Assets
Shareholder’s Equity
John's Manufacturing Company Statement of Financial Position
Projected Statement of Financial Position
As at May 31, 2014
(unaudited - see notice to reader)
2014 2013
Assets
Current
Cash 516,115$ 433,027$
Accounts receivable 483,500 254,688
Inventory 195,788 195,788
1,195,403 883,503
Equipment and leasehold improvements 202,355 164,875
Financing charges 7,650 7,650
Goodwill 350,000 350,000
1,755,408$ 1,406,028$
Liabilities and shareholder's equity
Current
Accounts payable and accrued liabilities 306,122$ 222,086$
Income taxes payable 91,200 79,800
Current portion of long-term debt 40,879 37,369
438,201 339,255
Due to shareholder 25,076 25,073
Long-term debt 355,362 444,710
818,639.00$ 809,039$
Shareholder's equity
Share capital 200 200
Retained earnings (deficit) 936,569 596,789
936,769 596,989
1,755,408$ 1,406,028$
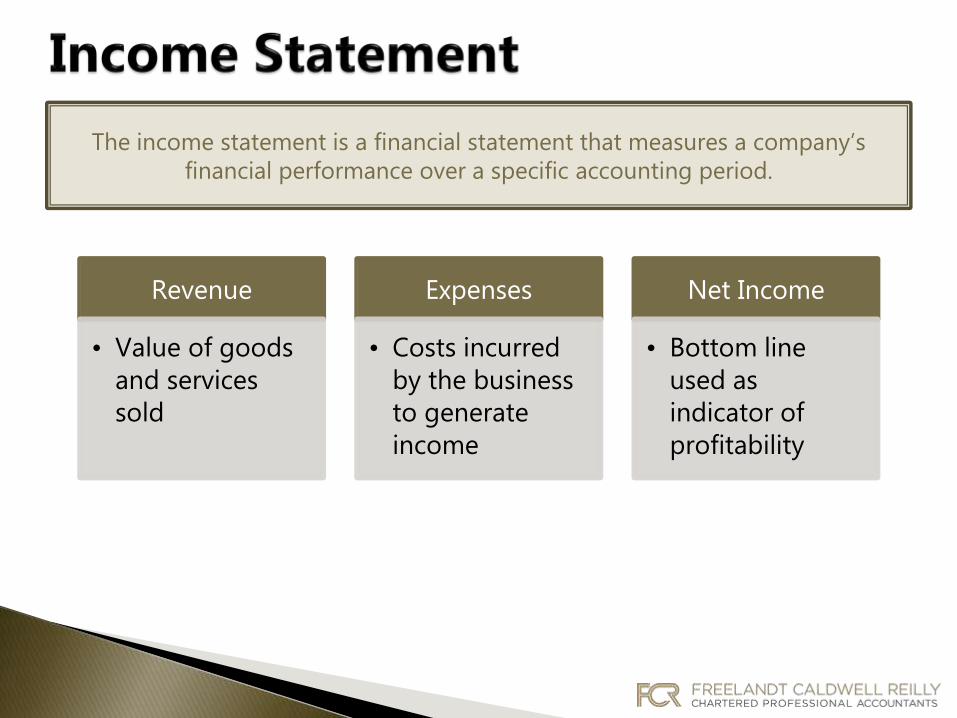
The income statement is a financial statement that measures a company’s
financial performance over a specific accounting period.
Revenue
• Value of goods
and services
sold
Expenses
• Costs incurred
by the business
to generate
income
Net Income
• Bottom line
used as
indicator of
profitability
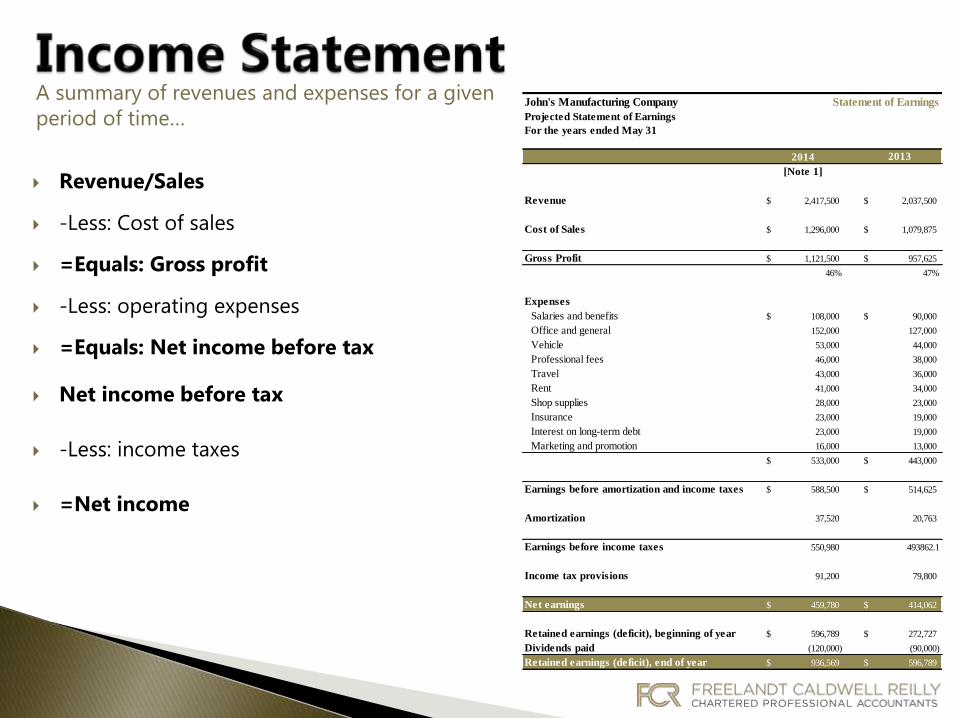
Revenue/Sales
-Less: Cost of sales
=Equals: Gross profit
-Less: operating expenses
=Equals: Net income before tax
Net income before tax
-Less: income taxes
=Net income
A summary of revenues and expenses for a given
period of time…John's Manufacturing Company Statement of Earnings
Projected Statement of Earnings
For the years ended May 31
2014 2013
[Note 1]
Revenue 2,417,500$ 2,037,500$
Cost of Sales 1,296,000$ 1,079,875$
Gross Profit 1,121,500$ 957,625$
46% 47%
Expenses
Salaries and benefits 108,000$ 90,000$
Office and general 152,000 127,000
Vehicle 53,000 44,000
Professional fees 46,000 38,000
Travel 43,000 36,000
Rent 41,000 34,000
Shop supplies 28,000 23,000
Insurance 23,000 19,000
Interest on long-term debt 23,000 19,000
Marketing and promotion 16,000 13,000
533,000$ 443,000$
Earnings before amortization and income taxes 588,500$ 514,625$
Amortization 37,520 20,763
Earnings before income taxes 550,980 493862.1
Income tax provisions 91,200 79,800
Net earnings 459,780$ 414,062$
Retained earnings (deficit), beginning of year 596,789$ 272,727$
Dividends paid (120,000) (90,000)
Retained earnings (deficit), end of year 936,569$ 596,789$

The statement of cash flows is a financial statement that shows the amount of
cash generated and used by a business in a given period.
Cash Flows from
Operations
• measurement of the
amount of cash
generated by a
company’s normal
business operations
Cash Flows from Investing
Activities
• change in a company’s
cash resulting from
buying and selling
investments and
investing in capital assets
Cash Flows from Financing
Activities
• change in cash resulting
from issuing stocks,
taking or repaying loans
and paying dividends
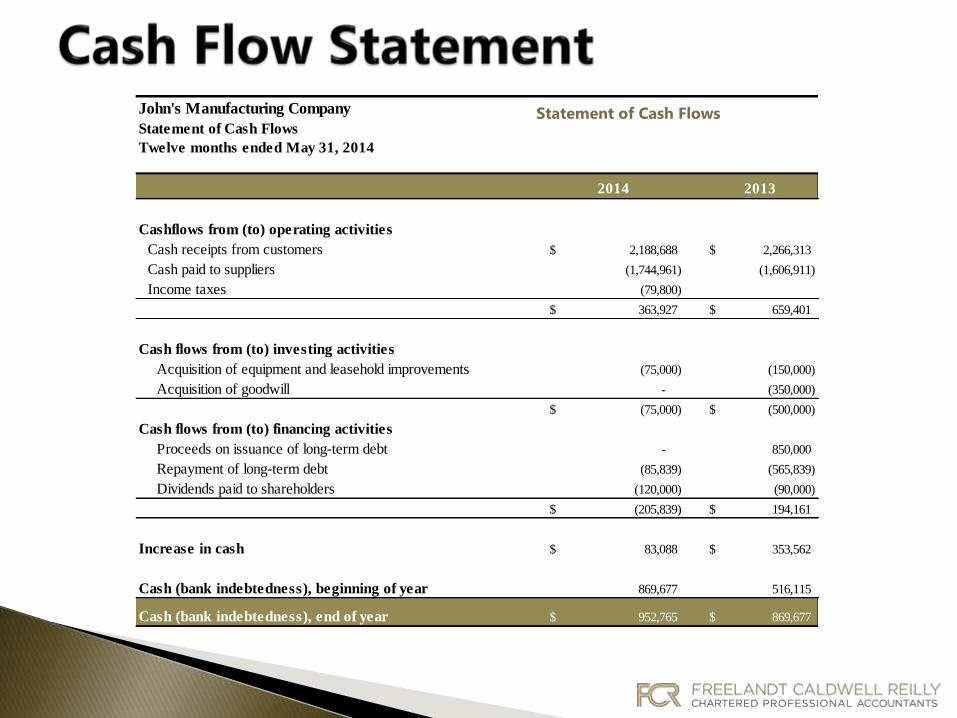
John's Manufacturing Company Statement of Cash Flows
Statement of Cash Flows
Twelve months ended May 31, 2014
2014 2013
Cashflows from (to) operating activities
Cash receipts from customers 2,188,688$ 2,266,313$
Cash paid to suppliers (1,744,961) (1,606,911)
Income taxes (79,800)
363,927$ 659,401$
Cash flows from (to) investing activities
Acquisition of equipment and leasehold improvements (75,000) (150,000)
Acquisition of goodwill - (350,000)
(75,000)$ (500,000)$
Cash flows from (to) financing activities
Proceeds on issuance of long-term debt - 850,000
Repayment of long-term debt (85,839) (565,839)
Dividends paid to shareholders (120,000) (90,000)
(205,839)$ 194,161$
Increase in cash 83,088$ 353,562$
Cash (bank indebtedness), beginning of year 869,677 516,115
Cash (bank indebtedness), end of year 952,765$ 869,677$
Statement of Cash Flows
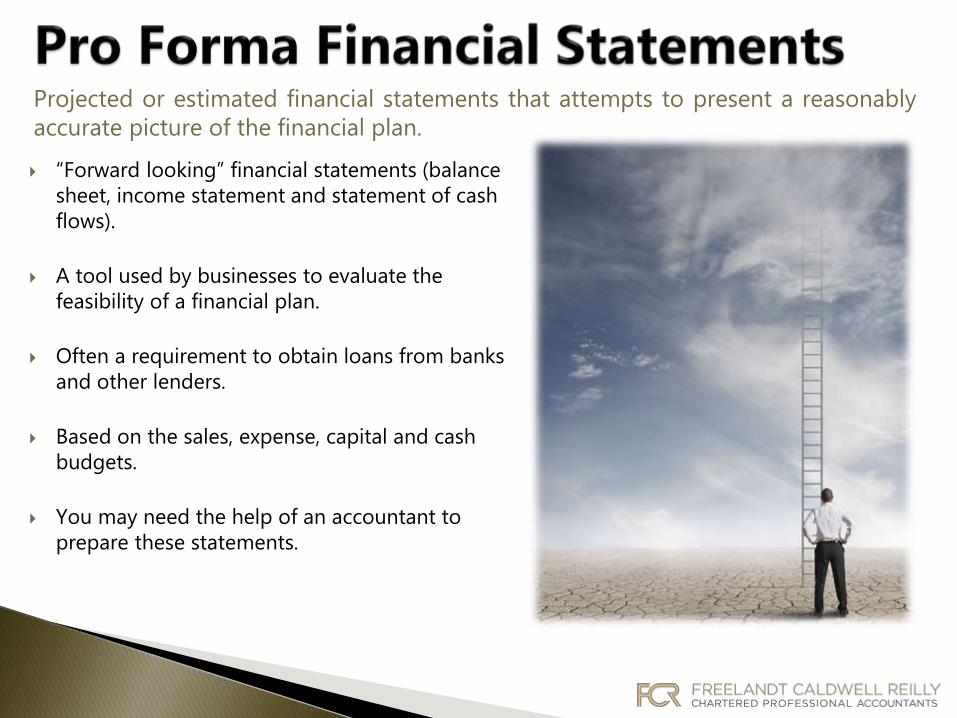
Projected or estimated financial statements that attempts to present a reasonably
accurate picture of the financial plan.
“Forward looking” financial statements (balance
sheet, income statement and statement of cash
flows).
A tool used by businesses to evaluate the
feasibility of a financial plan.
Often a requirement to obtain loans from banks
and other lenders.
Based on the sales, expense, capital and cash
budgets.
You may need the help of an accountant to
prepare these statements.

Balance Sheet
• Snapshot • A - L = E • summary of
financial
position
Income Statement
• Period of
time
• Revenues
and gains v.
expenses and
losses
• summary of
profitability
Statement of Cash Flow
•Period of
time
• Operating v.
investing v.
financing
activities
• summary of
actual flow of
cash in and
out of
business
FS Relationships FS Summary

Financing
Alternatives
Bootstrapping
Traditional
Lending
Equity
Injection
Leasing
Personal
Loans
Canada Small
Business
Financing Loan
Program
Grants
(NOHFC,
FedNor)
Angel /
Venture
Capital

There are many types of loans you can use to finance aspects of your business
start-up.
Operating line of credit used to fund short-
term cash needs.
Terms loans used to buy capital assets
(equipment, vehicles).
Mortgages term loan for land and building.
Leases equipment, machinery and vehicles.
Shareholder loans startup capital.
Make sure to get advice from a lawyer or
accountant before signing any banking or loan
agreement
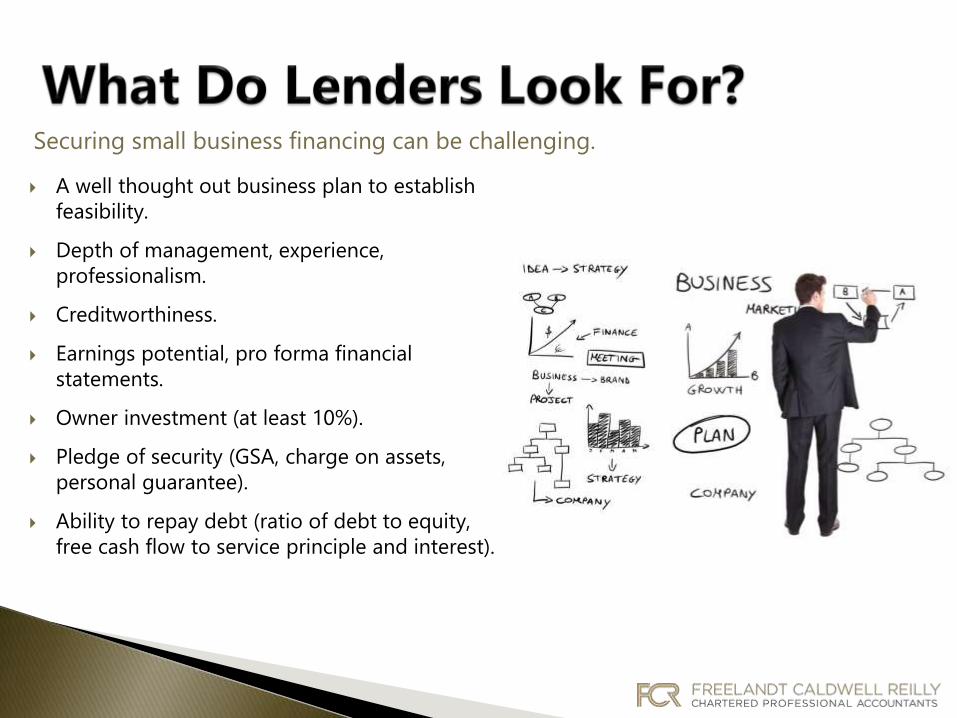
Securing small business financing can be challenging.
A well thought out business plan to establish
feasibility.
Depth of management, experience,
professionalism.
Creditworthiness.
Earnings potential, pro forma financial
statements.
Owner investment (at least 10%).
Pledge of security (GSA, charge on assets,
personal guarantee).
Ability to repay debt (ratio of debt to equity,
free cash flow to service principle and interest).


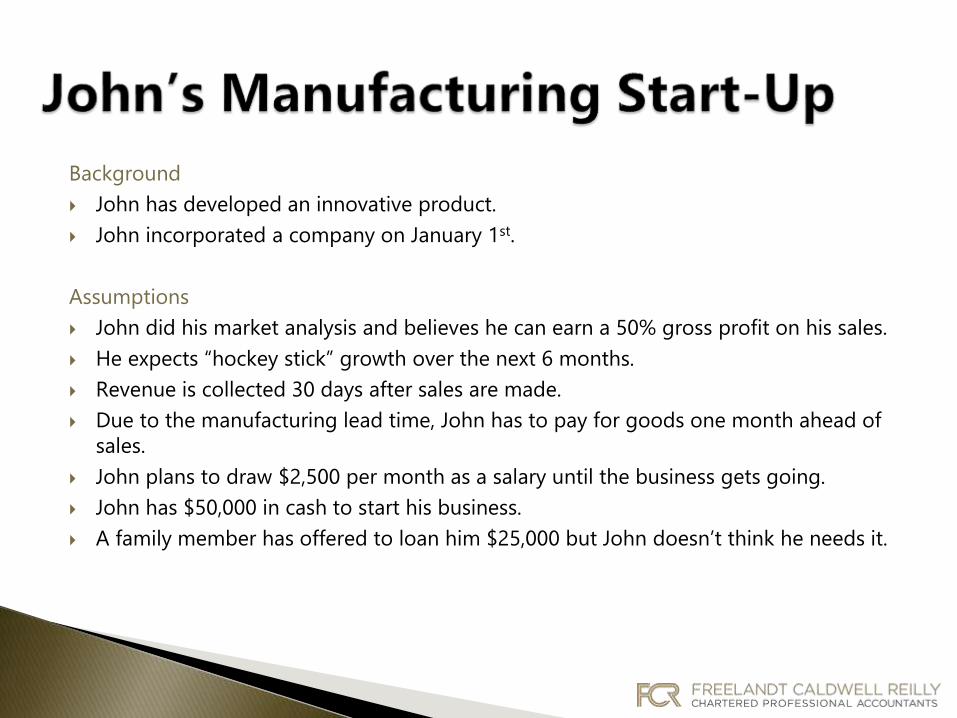
Background
John has developed an innovative product.
John incorporated a company on January 1st.
Assumptions
John did his market analysis and believes he can earn a 50% gross profit on his sales.
He expects “hockey stick” growth over the next 6 months.
Revenue is collected 30 days after sales are made.
Due to the manufacturing lead time, John has to pay for goods one month ahead of
sales.
John plans to draw $2,500 per month as a salary until the business gets going.
John has $50,000 in cash to start his business.
A family member has offered to loan him $25,000 but John doesn’t think he needs it.

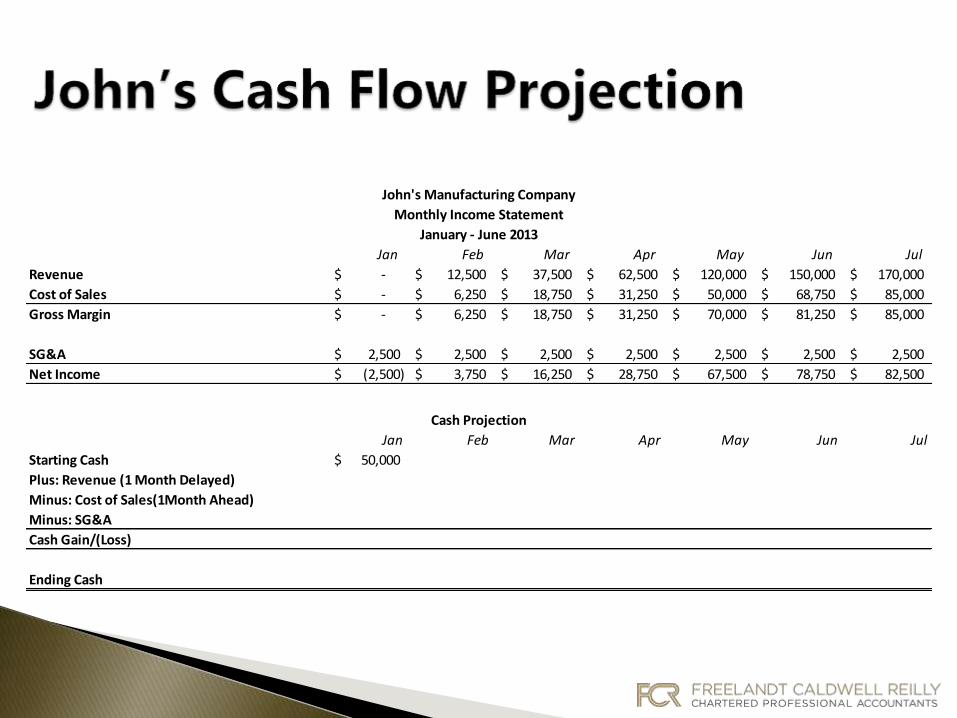
Jan Feb Mar Apr May Jun Jul
Revenue -$ 12,500$ 37,500$ 62,500$ 120,000$ 150,000$ 170,000$
Cost of Sales -$ 6,250$ 18,750$ 31,250$ 50,000$ 68,750$ 85,000$
Gross Margin -$ 6,250$ 18,750$ 31,250$ 70,000$ 81,250$ 85,000$
SG&A 2,500$ 2,500$ 2,500$ 2,500$ 2,500$ 2,500$ 2,500$
Net Income (2,500)$ 3,750$ 16,250$ 28,750$ 67,500$ 78,750$ 82,500$
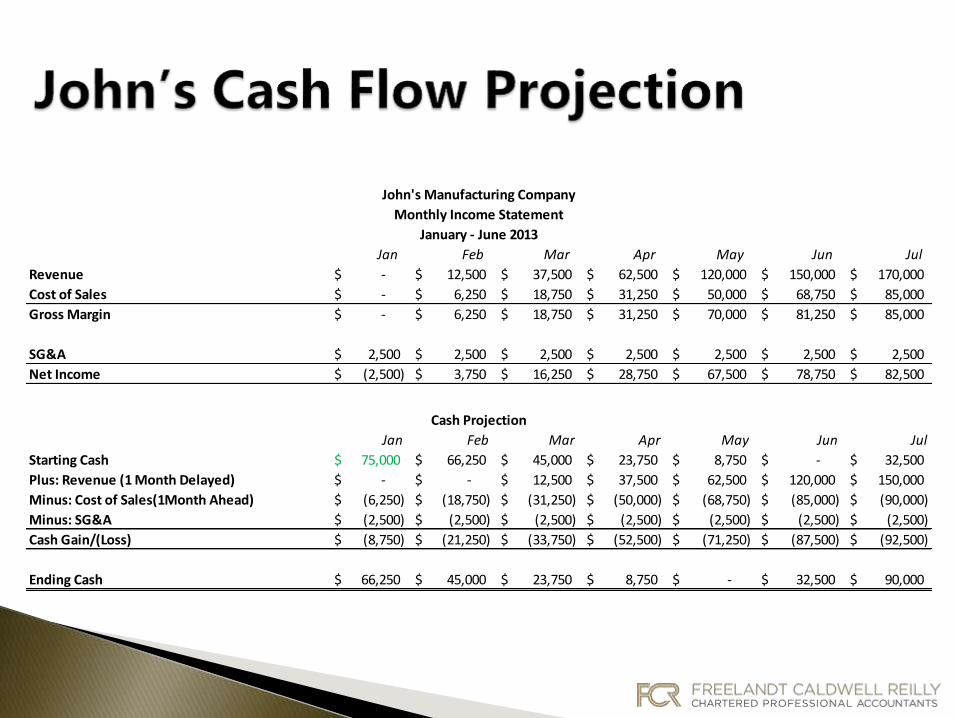
John's Manufacturing Company
Monthly Income Statement
January - June 2013
Jan Feb Mar Apr May Jun Jul
Revenue -$ 12,500$ 37,500$ 62,500$ 120,000$ 150,000$ 170,000$
Cost of Sales -$ 6,250$ 18,750$ 31,250$ 50,000$ 68,750$ 85,000$
Gross Margin -$ 6,250$ 18,750$ 31,250$ 70,000$ 81,250$ 85,000$
SG&A 2,500$ 2,500$ 2,500$ 2,500$ 2,500$ 2,500$ 2,500$
Net Income (2,500)$ 3,750$ 16,250$ 28,750$ 67,500$ 78,750$ 82,500$
John's Manufacturing Company
Monthly Income Statement
January - June 2013
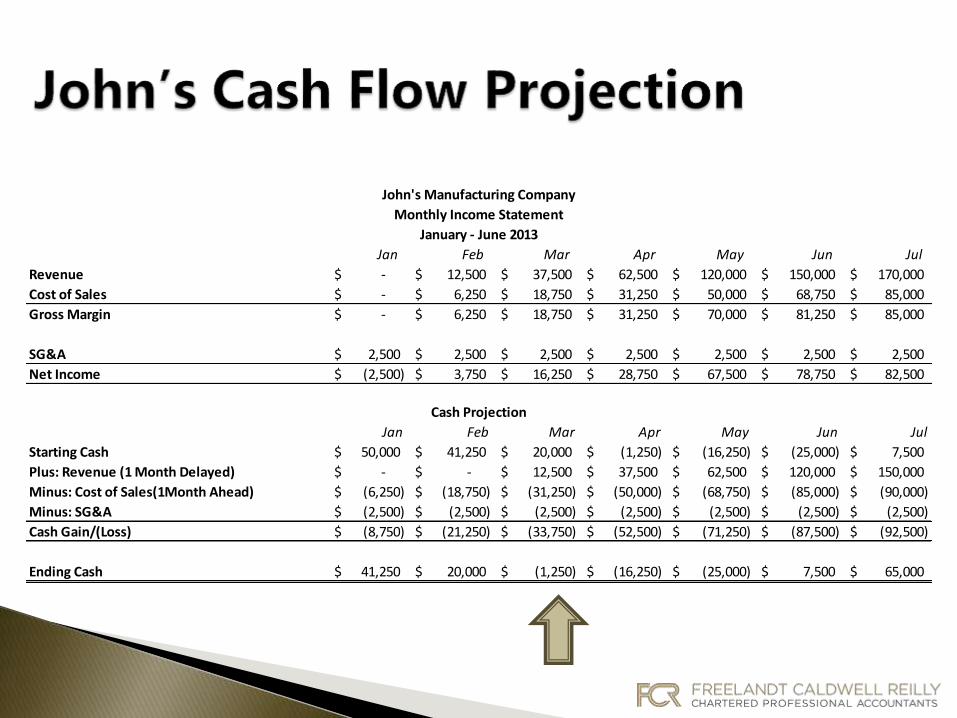
Jan Feb Mar Apr May Jun Jul
Starting Cash 50,000$ 41,250$ 20,000$ (1,250)$ (16,250)$ (25,000)$ 7,500$
Plus: Revenue (1 Month Delayed) -$ -$ 12,500$ 37,500$ 62,500$ 120,000$ 150,000$
Minus: Cost of Sales(1Month Ahead) (6,250)$ (18,750)$ (31,250)$ (50,000)$ (68,750)$ (85,000)$ (90,000)$
Minus: SG&A (2,500)$ (2,500)$ (2,500)$ (2,500)$ (2,500)$ (2,500)$ (2,500)$
Cash Gain/(Loss) (8,750)$ (21,250)$ (33,750)$ (52,500)$ (71,250)$ (87,500)$ (92,500)$
Ending Cash 41,250$ 20,000$ (1,250)$ (16,250)$ (25,000)$ 7,500$ 65,000$
Cash Projection

Jan Feb Mar Apr May Jun Jul
Revenue -$ 12,500$ 37,500$ 62,500$ 120,000$ 150,000$ 170,000$
Cost of Sales -$ 6,250$ 18,750$ 31,250$ 50,000$ 68,750$ 85,000$
Gross Margin -$ 6,250$ 18,750$ 31,250$ 70,000$ 81,250$ 85,000$
SG&A 2,500$ 2,500$ 2,500$ 2,500$ 2,500$ 2,500$ 2,500$
Net Income (2,500)$ 3,750$ 16,250$ 28,750$ 67,500$ 78,750$ 82,500$
John's Manufacturing Company
Monthly Income Statement
January - June 2013
Jan Feb Mar Apr May Jun Jul
Starting Cash 50,000$ 41,250$ 20,000$ (1,250)$ (16,250)$ (25,000)$ 7,500$
Plus: Revenue (1 Month Delayed) -$ -$ 12,500$ 37,500$ 62,500$ 120,000$ 150,000$
Minus: Cost of Sales(1Month Ahead) (6,250)$ (18,750)$ (31,250)$ (50,000)$ (68,750)$ (85,000)$ (90,000)$
Minus: SG&A (2,500)$ (2,500)$ (2,500)$ (2,500)$ (2,500)$ (2,500)$ (2,500)$
Cash Gain/(Loss) (8,750)$ (21,250)$ (33,750)$ (52,500)$ (71,250)$ (87,500)$ (92,500)$
Ending Cash 41,250$ 20,000$ (1,250)$ (16,250)$ (25,000)$ 7,500$ 65,000$
Cash Projection
Jan Feb Mar Apr May Jun Jul
Revenue -$ 12,500$ 37,500$ 62,500$ 120,000$ 150,000$ 170,000$
Cost of Sales -$ 6,250$ 18,750$ 31,250$ 50,000$ 68,750$ 85,000$
Gross Margin -$ 6,250$ 18,750$ 31,250$ 70,000$ 81,250$ 85,000$
SG&A 2,500$ 2,500$ 2,500$ 2,500$ 2,500$ 2,500$ 2,500$
Net Income (2,500)$ 3,750$ 16,250$ 28,750$ 67,500$ 78,750$ 82,500$
John's Manufacturing Company
Monthly Income Statement
January - June 2013
Jan Feb Mar Apr May Jun Jul
Starting Cash 75,000$ 66,250$ 45,000$ 23,750$ 8,750$ -$ 32,500$
Plus: Revenue (1 Month Delayed) -$ -$ 12,500$ 37,500$ 62,500$ 120,000$ 150,000$
Minus: Cost of Sales(1Month Ahead) (6,250)$ (18,750)$ (31,250)$ (50,000)$ (68,750)$ (85,000)$ (90,000)$
Minus: SG&A (2,500)$ (2,500)$ (2,500)$ (2,500)$ (2,500)$ (2,500)$ (2,500)$
Cash Gain/(Loss) (8,750)$ (21,250)$ (33,750)$ (52,500)$ (71,250)$ (87,500)$ (92,500)$
Ending Cash 66,250$ 45,000$ 23,750$ 8,750$ -$ 32,500$ 90,000$
Cash Projection
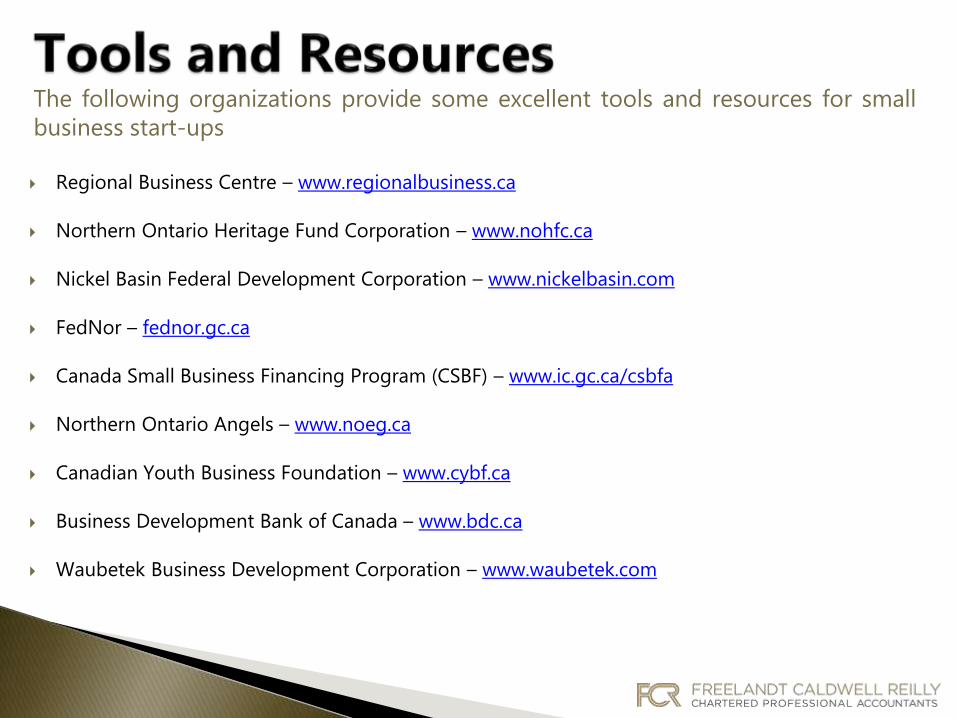
The following organizations provide some excellent tools and resources for small
business start-ups
Regional Business Centre – www.regionalbusiness.ca
Northern Ontario Heritage Fund Corporation – www.nohfc.ca
Nickel Basin Federal Development Corporation – www.nickelbasin.com
FedNor – fednor.gc.ca
Canada Small Business Financing Program (CSBF) – www.ic.gc.ca/csbfa
Northern Ontario Angels – www.noeg.ca
Canadian Youth Business Foundation – www.cybf.ca
Business Development Bank of Canada – www.bdc.ca
Waubetek Business Development Corporation – www.waubetek.com
FCR | Freelandt Caldwell Reilly LLP

Top Related