


Languages
Pages
Legal


November | 2014
Non
-Inva
sive
Str
ateg
y in
Ass
essi
ng A
sthm
aTh
roug
h B
ioflu
ids
Met
abol
omic
s Ex
plor
atio
nE
xhal
ed b
reat
h an
d ur
ine
pote
ntia
litie
sM
icha
el M
anue
l Lim
a C
alde
ira
TD
Non-Invasive Strategy in Assessing AsthmaThrough Biofluids Metabolomics ExplorationExhaled breath and urine potentialitiesDOCTORAL THESIS
DIMENSÕES: 45 X 29,7 cm
PAPEL: COUCHÊ MATE 350 GRAMAS
IMPRESSÃO: 4 CORES (CMYK)
ACABAMENTO: LAMINAÇÃO MATE
NOTA*Caso a lombada tenha um tamanho inferior a 2 cm de largura, o logótipo institucional da UMa terá de rodar 90º ,para que não perca a sua legibilidade|identidade.
Caso a lombada tenha menos de 1,5 cm até 0,7 cm de largura o laoyut da mesma passa a ser aquele que constano lado direito da folha.
Nom
e do
Pro
ject
o/R
elat
ório
/Dis
sert
ação
de
Mes
trad
o e/
ou T
ese
de D
outo
ram
ento
| N
ome
do A
utor
TD
Michael Manuel Lima CaldeiraDOCTORATE IN CHEMISTRYSPECIALTY IN ANALYTICAL CHEMISTRY
SUPERVISORSJosé Sousa Câmara
Sílvia Maria da Rocha Simões Carriço
Michael Manuel Lima CaldeiraDOCTORATE IN CHEMISTRYSPECIALTY IN ANALYTICAL CHEMISTRY
Non-Invasive Strategy in Assessing AsthmaThrough Biofluids Metabolomics ExplorationExhaled breath and urine potentialitiesDOCTORAL THESIS

Non-invasive strategy in assessing asthma through biofluids metabolomics exploration: exhaled breath and urine potentialities
Michael Manuel Lima Caldeira
Thesis submitted to Madeira University in order to obtain the degree of Doctor in Analytical Chemistry
Thesis supervised by:
Professor Doutor José Sousa Câmara
Professora Doutora Sílvia Maria da Rocha Simões Carriço
Funchal – Portugal
November, 2014


Dedication
To my wife Joana and my parents Conceição and Manuel


"The important thing is not to stop questioning. Curiosity has its own reason for existing."
Albert Einstein


Acknowledgements
i
Acknowledgements
I would like to express my appreciation to all persons, colleagues and friends that
helped me throughout my dissertation and herein I shall mention them:
My supervisors Prof José S. Câmara and Prof Sílvia M. Rocha, for their support,
assistance, patience and availability to guide me through the right path throughout these years
Dr António Barros (UA) for the various insights, advice in multivariate analysis and
very rewarding discussions in several parts of the developed work
Profª Dr. Ana Gil and Dr Iola Duarte for allowing the possibility of using the NMR
and for the healthy discussions in the analysis of the results
A special thanks to Fundação para a Ciência e Tecnologia (FCT) for my PhD grant
(SFRH/BD/40374/2007). To both universities for providing the conditions: Aveiro
University (UA) I thank for welcoming me and providing the conditions to develop all
experimental and written work for my thesis and Madeira University (UMa) for the last
stage of this thesis. Funding is acknowledged from the European Regional Development
Fund (FEDER) through the Competitive Factors Thematic Operational Programme
(COMPETE) and from the FCT, Portugal, under projects PEst-C/QUI/UI0062/2013
(Research Unit 62/94 QOPNA), PTDC/QUI-QUI/117803/2010, PTDC/QUI-
BIQ/119881/2010 and PEst-OE/QUI/UI0674/2011) (Research Unit CQM). I also thank
Sigma-Aldrich® for providing the first dimension column for GC×GC–ToFMS analysis.
To Hospital Infante D. Pedro E.P.E (Aveiro, Portugal) for allowing this work to be
accomplished. A special thanks to Dr Arménia Parada, Dr Maria João Bilelo and Dr Ana
Morête for their support in the sample and data collection for this thesis. A special
acknowledgment to Dr Ana Morête for receiving me for three years on her consultation, for
the discussions that allowed me a deeper insight to the asthma pathology and for giving me
the medical perspective on asthma from a diagnosis to the continuous healthcare administered
to the patients. I am very grateful to the donors that kindly supplied the samples from
Paediatric Service of Hospital D. Pedro E.P.E (Aveiro, Portugal) and Immunoalergology
Services of the Hospital Infante D. Pedro E.P.E (Aveiro, Portugal) for allergic asthma
samples, as well as, CIAQ (Centro de Infância de Arte e Qualidade, Aveiro, Portugal) for
healthy samples. Particularly, I want to thank a special volunteer, Íris Rocha Carriço, that
gently supplied the samples whenever requested, and at times, several samples in the same
day.

Acknowledgements
ii
I acknowledge my colleagues that made this a special journey and made this an easier
ride. They are forever in my heart and prayers: Andrea da Silva, Claúdia Rocha, Eduarda
Correia, Elisabete Coelho, Gonçalo Graça, Joana Carrola, João Rodrigues, Juliana
Vinholes, Magda Santos, Sílvia Diaz, Inês Sousa, Catarina Luís Silva and Freddy
Rodrigues. A special thanks to my friend and colleague Rosa Perestrelo for her company in
and out of the lab, camaraderie and wit.
To the most important people in my life: my family. A heartfelt and special thanks to
my beautiful wife Joana Luís. Her continuous support, affection, love (even being thousands
of kilometers away) was essential to the completion of my PhD and of course this thesis. Our
long talks encouraged me to pursue the goals and for that I do not have enough words to
express how grateful I am… And my loving parents Conceição Caldeira and Manuel
Caldeira, I also wish to express a very heartfelt acknowledgment for providing me with all
the support, love and for listening even when they did not understand what I was talking
about… Thank you for teaching work ethics, for my education, for pushing me to do better,
for being an example. In conclusion, for helping to build the man that I am today.
My sincere gratitude also to those that in any way helped in my professional and
technical formation.

Resumo
iii
Resumo
A asma é um problema de saúde pública com impacto significativo na população
pediátrica que tem apresentado um crescimento notável ao longo dos anos. O desafio proposto
para esta tese de doutoramento foi o desenvolvimento de metodologias avançadas para o
estabelecimento de padrões metabolómicos em urina e ar exalado associados à asma, cuja
aplicabilidade foi posteriormente explorada para avaliar o estado da doença, a adesão ou
efeito da terapia e para fins de diagnóstico.
A composição volátil do ar exalado foi estudada combinando a microextração em fase
sólida em modo espaço-de-cabeça (HS-SPME) com cromatografia de gás acoplada a
espectrometria de massa ou com a cromatografia gasosa bidimensional abrangente acoplada à
espectrometria de massa com analisador de tempo de voo de alta resolução (GC×GC-
TOFMS). Estas metodologias permitiram identificar centenas de compostos de diferentes
famílias químicas. A análise multivariada (MVA) permitiu concluir que o perfil
metabolómico de indivíduos com asma é caracterizado por teores mais elevados de compostos
associados à peroxidação lipídica, eventualmente associado a stress oxidativo e inflamação
(alcanos e aldeídos). Com vista a futuras aplicações em contexto clínico, foi definido um
conjunto de 9 metabolitos, cuja aplicabilidade foi comprovada na monitorização do estado da
doença e avaliação do efeito e/ou adesão à terapia.
O metaboloma volátil global de urina também foi explorado usando um método HS-
SPME/GC×GC-TOFMS, tendo sido identificados cerca de 200 compostos. Foi realizada uma
análise-direccionada usando 78 metabolitos relacionados com a peroxidação lípidica e
consequentemente com os níveis de stress oxidativo e inflamação. O padrão metabolômico
não volátil urinária de asma foi estabelecido usando ressonância magnética nuclear de protão
(1H NMR). Esta análise permitiu identificar vias metabólicas, como o stress oxidativo,
metabolismo dos amino ácidos e lipídico e alterações da microflora intestinal, alterações no
ciclo do ácido tricarboxílico, no metabolismo da histidina, acidose láctica, e a modificação de
resíduos de tirosina livre após a estimulação de eosinófilos.
Os resultados obtidos permitiram explorar e demonstrar a potencialidade da análise do
perfil metabolómico do ar exalado e urina na asma. Além do desenvolvimento bem sucedido
das metodologias de análise, foi possível explorar através do ar exalado e da urina vias
metabólicas afetadas pela asma observando-se complementaridade entre as matrizes, bem
como verificar a aplicabilidade clínica dos métodos desenvolvidos.
Palavras-chave Asma; Ar exalado; Urina; Metabolómica; GCxGC-ToFMS; 1H NMR;

iv

Abstract
v
Abstract
Asthma is a significant health issue in the pediatric population with a noteworthy
growth over the years. The proposed challenge for this PhD thesis was the development of
advanced methodologies to establish metabolomic patterns in urine and exhaled breath associated with
asthma whose applicability was subsequently exploited to evaluate the disease state, the therapy
adhesion and effect and for diagnostic purposes.
The volatile composition of exhaled breath was studied combining headspace solid
phase microextraction (HS-SPME) with gas chromatography coupled to mass spectrometry or
with comprehensive two-dimensional gas chromatography coupled to mass spectrometry with
a high resolution time of flight analyzer (GC×GC–ToFMS). These methodologies allowed the
identification of several hundred compounds from different chemical families. Multivariate
analysis (MVA) led to the conclusion that the metabolomic profile of asthma individuals is
characterized by higher levels of compounds associated with lipid peroxidation, possibly
linked to oxidative stress and inflammation (alkanes and aldehydes) known to play an
important role in asthma. For future applications in clinical settings a set of nine compounds
was defined and the clinical applicability was proven in monitoring the disease status and in
the evaluation of the effect and / or adherence to therapy.
The global volatile metabolome of urine was also explored using an HS-
SPME/GC×GC–ToFMS method and c.a. 200 compounds were identified. A targeted analysis
was performed, with 78 compounds related with lipid peroxidation and consequently to
oxidative stress levels and inflammation. The urinary non-volatile metabolomic pattern of
asthma was established using proton nuclear magnetic resonance (1H NMR). This analysis
allowed identifying central metabolic pathways such as oxidative stress, amino acid and lipid
metabolism, gut microflora alterations, alterations in the tricarboxylic acid (TCA) cycle,
histidine metabolism, lactic acidosis, and modification of free tyrosine residues after
eosinophil stimulation.
The obtained results allowed exploring and demonstrating the potential of analyzing
the metabolomic profile of exhaled air and urine in asthma. Besides the successful
development of analysis methodologies, it was possible to explore through exhaled air and
urine biochemical pathways affected by asthma, observing complementarity between
matrices, as well as, verify the clinical applicability.
Keywords Asthma; Exhaled breath; Urine; Metabolomics; GCxGC-ToFMS; 1H NMR

vi

Publications
vii
Publications
Publications in international journals with referee
M. Caldeira, A.S. Barros, M.J. Bilelo, A. Parada, J.S. Câmara, S.M. Rocha, Profiling allergic
asthma volatile metabolic patterns using a headspace-solid phase microextraction/gas
chromatography based methodology. J. Chromatogr. A 1218 (2011) 3771.
M. Caldeira, R. Perestrelo, A.S. Barros, M.J. Bilelo, A. Morête, J.S. Câmara, SM. Rocha,
Allergic asthma exhaled breath metabolome: a challenge for comprehensive two-dimensional
gas chromatography. J. Chromatogr. A 1254 (2012) 87.
M. Caldeira, A.S. Barros, A. Morête, J.S. Câmara, S.M. Rocha, The unexplored potential of
exhaled breath analysis in the aid of asthma clinical management, 2015, submitted.
M. Caldeira, A.S. Barros, A. Morête, J.S. Câmara, S.M. Rocha, Asthma volatile urinary
metabolome uncovered by comprehensive two-dimensional gas chromatography-time of
flight mass spectrometry (under preparation).
Oral communications
M. Caldeira, J.S. Câmara, S.M. Rocha, Estabelecimento de perfis metabólicos em crianças
com asma alérgica e crianças controlo, 4ªs Jornadas de Bioquímica da Universidade de
Aveiro, Aveiro, Portugal, April 2010.
M. Caldeira, J.S. Câmara, S.M. Rocha, In-deep study of compounds from oxidative stress in
breath: a challenge to allergic asthma diagnosis, 12th International Symposium on Extraction
Technologies, Poznan, Poland, September 2010.
M. Caldeira, A.S. Barros, J.S. Câmara, S.M. Rocha, Asthma molecular diagnosis in the
clinical practice: reality or utopia?, 6as Jornadas de Bioquímica da Universidade de Aveiro-
6th Biochemistry day – Pharmaceutical Biochemistry, Aveiro, Portugal, April 2012.

Publications
viii
Poster communications
M. Caldeira, A.S. Barros, J.S. Câmara, S.M. Rocha, Development of complete factorial
design to assess of allergic respiratory diseases metabolomic patterns by SPME/GC-qMS
based methodology, International Conference on Breath and Breath Odor Research,
Dortmund, Germany, April 2009.
M. Caldeira, A.S. Barros, A. Parada, J.S. Câmara, S.M. Rocha, Development of a complete
factorial design to assess allergic respiratory diseases metabolomic patterns by a solid-phase
microextraction gas chromatography-mass spectrometry based methodology, 6º Encontro
Nacional de Cromatografia, Funchal, Portugal, December 2009.
M. Caldeira, J.S. Câmara, S.M. Rocha, Allergic asthma exhaled breath: from one dimensional
to comprehensive two-dimensional chromatographic analysis, 34nd International Symposium
on Capillary Chromatography and 7th GCxGC Symposium, Riva del Garda, Itália, May
2010.
M. Caldeira, J.S. Câmara, S.M. Rocha, Profiling oxidative stress markers in allergic asthma
by analysis of exhaled breath using comprehensive two-dimensional chromatography,
Exhaled Breath Analysis Conference: From Sensors to Devices and Applications, Barga,
Italy, October 2010.

Table of Contents
ix
Table of Contents
Acknowledgements ................................................................................................................ i
Resumo ................................................................................................................................ iii
Abstract ..................................................................................................................................v
Publications ......................................................................................................................... vii
Table of Contents ................................................................................................................. ix
Figure Captions .................................................................................................................. xiii
List of Tables ......................................................................................................................xix
CHAPTER 1 INTRODUCTION ............................................................................................1
1.1 Asthma .............................................................................................................................................. 1
1.1.1 Asthma: definition, symptoms and clinical diagnosis .......................................................... 1
1.1.2 Costs, incidence and prevalence .......................................................................................... 5
1.1.3 Disease management ............................................................................................................ 7
1.1.4 Asthma Pathophysiology ................................................................................................... 10
1.2 Metabolomics ................................................................................................................. 25
1.2.1 Concept .............................................................................................................................. 25
1.2.2 Analytical techniques in metabolomics: MS or NMR based methodologies ..................... 27
1.2.3 Metabolomics in asthma .................................................................................................... 29
Exhaled breath ................................................................................................................................... 30
Urine .................................................................................................................................................. 32
1.3 Biofluid Analysis: breath and urine ................................................................................. 34
1.3.1 Methodological aspects of sampling procedures ............................................................... 34
Exhaled breath ................................................................................................................................... 34
Urine .................................................................................................................................................. 37
1.3.2 Breath and urine characterization based on solid phase microextraction combined with gas chromatography analysis ....................................................................................................................... 38
1.3.3 Urine characterization based on proton based nuclear magnetic ressonance ..................... 47
1.4 Data pre-processing and multivariate analysis ................................................................. 51
1.4.1 Data normalization in metabolomics ................................................................................. 51
1.4.2 Principal component analysis and partial least squares - discriminant analysis ................ 52
1.4.3 Statistical models validation .............................................................................................. 53
1.5 Aims and outlines of this PhD thesis ............................................................................... 55
1.6 References ...................................................................................................................... 57
CHAPTER 2 EXHALED BREATH AS A SOURCE OF INFORMATION ON ASTHMA .. 69

Table of Contents
x
2.1 Overview ........................................................................................................................ 71
2.2 Profiling allergic asthma volatile metabolic patterns using a headspacesolid phase microextraction/gas chromatography based methodology ..................................................... 73
2.2.1 Abstract .............................................................................................................................. 74
2.2.2 Framework ......................................................................................................................... 75
2.2.3 Experimental ...................................................................................................................... 76
Standards and materials ..................................................................................................................... 76
Breath samples .................................................................................................................................. 76
Experimental design .......................................................................................................................... 77
Breath analysis .................................................................................................................................. 77
GC-MS analysis ................................................................................................................................ 79
Statistical analysis ............................................................................................................................. 79
2.2.4 Results and discussion ....................................................................................................... 80
Experimental design: HS-SPME optimization .................................................................................. 80
Breath analysis .................................................................................................................................. 82
Multivariate analysis ......................................................................................................................... 89
2.2.5 Concluding remarks ........................................................................................................... 92
2.3 Allergic asthma exhaled breath metabolome: A challenge for comprehensive two-dimensional gas chromatography .......................................................................................... 95
2.3.1 Abstract .............................................................................................................................. 97
2.3.2 Framework ......................................................................................................................... 98
2.3.3 Experimental ...................................................................................................................... 99
Standards and materials ..................................................................................................................... 99
Samples ............................................................................................................................................. 99
Breath sampling............................................................................................................................... 100
HS-SPME methodology .................................................................................................................. 101
GC×GC–ToFMS analysis ............................................................................................................... 101
Multivariate Analysis ...................................................................................................................... 102
2.3.4 Results and Discussion ..................................................................................................... 103
Structured chromatogram and sensitivity ........................................................................................ 103
Multivariate analysis in the establishment of asthma “breath-print” ............................................... 110
“Breath-print” exploration as a potential aid to the clinical practice ............................................... 114
2.3.5 Concluding remarks ......................................................................................................... 117
2.5 The unexplored potential of exhaled breath analysis in the aid of asthma clinical management ....................................................................................................................... 119
.5.1 Abstract .............................................................................................................................. 119
2.5.2 Framework ....................................................................................................................... 120
2.5.3 Material and methods ....................................................................................................... 120
Patients clinical history and samples collection schedule ............................................................... 120
Breath sampling and analysis .......................................................................................................... 123
Multivariate Analysis ...................................................................................................................... 124
2.5.4 Results and Discussion ..................................................................................................... 125

Table of Contents
xi
PLS-DA model prediction: applicability of developed breath metabolomics based model ............ 125
Asthma clinical management through breath analysis: exacerbation condition .............................. 129
Omalizumab therapy adherence: Evaluation of breath sampling relation and patient’s clinical status 131
2.5.5 Concluding remarks ......................................................................................................... 134
2.6 References .................................................................................................................... 135
CHAPTER 3 ...................................................................................................................... 141
EXPLORATION OF ASTHMA URINE METABOLOME ................................................ 141
3.1 Overview ...................................................................................................................... 143
3.2 Asthma volatile urinary metabolome uncovered by comprehensive two-dimensional gas chromatography-time of flight mass spectrometry .............................................................. 145
3.2.1 Abstract ............................................................................................................................ 145
3.2.3 Material and Methods ...................................................................................................... 147
Subjects ........................................................................................................................................... 147
Urine analysis using SPME/GC×GC–ToFMS ................................................................................ 148
Data Processing ............................................................................................................................... 148
3.2.4 Results and discussion ..................................................................................................... 149
Urine volatile composition provided by HS-SPME/GC×GC–ToFMS ............................................ 149
Targeting urinary asthma metabolomics toward oxidative stress impact ....................................... 158
3.2.5 Concluding remarks ......................................................................................................... 164
3.3 Exploring the urinary metabolomic profile of children with asthma by 1H Nuclear Magnetic Resonance ........................................................................................................... 165
3.3.1 Abstract ............................................................................................................................ 165
3.2.2 Framework ....................................................................................................................... 166
3.2.3 Experimental .................................................................................................................... 166
Subjects ........................................................................................................................................... 166
Sample Preparation and 1H NMR analysis ...................................................................................... 168
Data processing ............................................................................................................................... 168
3.2.4 Results and discussion ..................................................................................................... 170
Normalization of urinary compounds .............................................................................................. 170
Improving metabolomic data through variable selection ................................................................ 173
Asthma urinary asthma metabolomics based on 1H NMR .............................................................. 177
3.2.5 Concluding remarks ......................................................................................................... 180
CHAPTER 4 CONCLUSIONS AND FUTURE PERSPECTIVES ..................................... 185
4.1 Conclusions .................................................................................................................. 189
4.2 Future Work ................................................................................................................. 189
APPENDIX ........................................................................................................................ 190

xii

Figure Captions
xiii
Figure Captions
Figure 1.1 - The interaction between airway inflammation and clinical symptoms…….. 1
Figure 1.2 - Skin prick test………………………………………………………………. 4
Figure 1.3 - Cost of care for asthma in Europe………………………………………….. 6
Figure 1.4 - Worldwide prevalence of asthma………………………………………….. 7
Figure 1.5 - Non-pharmacological and pharmacological asthma management………… 8
Figure 1.6 - Asthma management continuum (ICS- Inhaled Corticosteroid; LABA- long
acting beta2-agonists; LTRA- Leukotriene Receptor
Antagonist).………………………………………………………………………………. 9
Figure 1.7 - Allergic asthma pathophysiology representation of sensitization and re-exposure
(CD- Cluster of Differentiation; IL- Interleukin; TCR- T-cell receptor).
…………………………………………………………………………………………… 11
Figure 1.8 - Main altered biochemical pathways in asthma……………………………. 13
Figure 1.9 - Allergens and reactive oxygen species linked in asthma Allergens and reactive
oxygen species linked in asthma (DEP- Diesel Exhaust Particles; GM-CSF- granulocyte
macrophage colony-stimulating factor; MCP- Monocyte chemotactic protein; TNFα- tumor
necrosis factor alpha).…………………………………………………………………….. 14
Figure 1.10- Secondary products formation in LPO (ALEs - advanced lipoxidation end
products)………………………………………………………………………………… 16
Figure 1.11 - Possibilities of the damage caused by ROS……………………………… 17
Figure 1.12 - Reactive oxygen species damage nuclear and mitochondrial DNA……… 18
Figure 1.13 – Example of amino acid involvement in other biochemical pathways ( AAs –
Amino Acids; Ala- Alanine; Arg- Arginine; Asp- Aspartic acid; ASA- Argininosuccinate;
Cit- Citrulline; Cys-Cysteine; Ser-Serine; Gly- Glycine; His- Histidine; KGA- α-Ketoglutaric
Acid; Leu- Leucine; Ile- Isoleucine; Lys- Lysine; Met- Methionine; OAA- Oxaloacetic Acid;
Phe – Phenylalanine; Orn- Ornithine; Pro- Proline; Succinyl CoA- Succinyl Coenzyme A;
Thr-Threonine; Trp-Tryptophan; Tyr- Tyrosine; Val- Valine ……………………………21
Figure Captions
xiv
Figure 1.14 - Role of histamine in allergic reaction……………………………………... 22
Figure 1.15 – Methionine pathway to cysteine and glutathione (AMP- Adenosine
monophosphate SAH- S-adenosyl-homocysteine; SAM- S-adenosyl
methionine).………………………………………………………………………………. 23
Figure 1.16 - The interactions between the different omics fields……………………… 25
Figure 1.17 - Metabolomic analysis workflow…………………………………………. 26
Figure 1.18 - Asthma biomarkers overview: present and future? (ECP- Eosinophil Cationic
Protein; FeNO- Fractional exhaled nitric oxide; uLTE- Urinary
Leukotriene)........................................................................................................................ 29
Figure 1.19 - Representation of non-invasive to invasive sampling techniques………… 31
Figure 1.20 - Capnograph waveforms with mixed expiratory and alveolar sampling (Phase I-
Respiratory baseline, Phase II- Expiratory Stroke, Phase III- Expiratory Plateau; PetCO2-
partial pressure of end-tidal carbon
dioxide…............................................................................... 35
Figure 1.21 - Comparison between liquid-liquid and solid phase extraction…………… 39
Figure 1.22 - GC×GC generation and visualization…………………………………….. 46
Figure 1.23 - Example of a urine 1H NMR spectrum……………………………………. 48
Figure 2.1 - Full factorial design of solid-phase microextraction conditions for GC-MS
analysis of exhaled breath
……………………………………………………………………………………............. 81
Figure 2.2 - Total peak area and number of compounds comparison between two breath
collection containers (Tedlar® gas sampling bags and BIOVOC®). a.u. – arbitrary
units………………………………………………………………………………………. 83
Figure 2.3 - Cleaning procedure effects with rising number of nitrogen flushes for two
reported contaminants ((N,N-dimethyl)-acetamide and phenol) in Tedlar bags. a.u. – arbitrary
units………………………………………………………………………………………. 85
Figure Captions
xv
Figure 2.4 - Evaluation of the intra-individual variability over a period of three weeks for
selected group of six compounds. – u.a. arbitrary units………………………………….. 86
Figure 2.5 - (A) PLS-DA LV1xLV2 scores scatter plot and (B) loading weights plot of
exhaled breath for allergic asthma (AA and AA+RA) and heatlhy children. Peak identification
is presented in Table 2.5 ………………………………………………………………… 89
Figure 2.6 - Peak apex plot of the alkanes (linear, ramified and cyclic), alkenes, aldehydes
and ketones identified using allergic asthma exhaled breath sample…………………… 108
Figure 2.7 - Blow-up of a part of total ion GC×GC chromatogram contour plot obtained from
an allergic asthma exhaled breath showing the corresponding ramified alkane, cycloalkane
and ramified aldehyde: 4-ethyloctane (33), 1,1,2,3-tetramethylcyclohexane (34) and 2-
ethylhexanal(35), respectively……………………………………………………………. 109
Figure 2.8 - Total ion GC×GC chromatogram and corresponding contour plots of 1-dodecene
(94) and dodecane (95) varying the concentration from 20 (A) to 200×103 pg/L (B)…… 110
Figure 2.9 - PLS-DA LV1×LV2 scores scatter plot (A) and LV1 loading weights plot (B) of
exhaled breath for allergic asthma and healthy children using a sub-set of 23 compounds
identified by GC×GC –ToFMS, and previously reported in a study related to allergic asthma
(peak attribution shown in Table 2.5)……………………………………………………. 111
Figure 2.10 - PLS-DA LV1×LV2 scores scatter plot (A) and LV1 loading weights plot (B)
showing the potentiality of exhaled breath using the full dataset of 134 compounds identified
by GC×GC –ToFMS for allergic asthma and healthy children
discrimination..…………………………………………………………………………… 112
Figure 2.11 - Q2 values distribution of the original and permuted Monte-Carlo Cross
Validation for PLS-DA of exhaled breath of full dataset (134
compounds)………………………………………………………………………………. 113
Figure 2.12 - PLS-DA LV1×LV2 scores scatter plot (A) showing the potentiality of using a
sub-set of 9 compounds of exhaled breath in discrminating allergic asthma and healthy
children and the corresponding LV1 loading weights plot (B): nonane (20), 2,2,4,6,6-
pentamethylheptane (52), decane (58), 2-methyldecane (64), dodecane (95), tetradecane
(128), nonanal (82), decanal (98), dodecanal (129). Path of the naive child - a through d - four
breath……………………………………………………………………………………... 116

Figure Captions
xvi
Figure 2.13 - Q2 values distribution of the original and permuted Monte-Carlo Cross
Validation for PLS-DA of exhaled breath of sub-set of 9 compounds: nonane, 2,2,4,6,6-
pentamethylheptane, decane, 2-methyldecane, dodecane, tetradecane, nonanal, decanal, and
dodecanal………………………………………………………………………………… 117
Figure 2.14 - (A) Projection of new exhaled breath dataset using the breath metabolomics
based model of chapter 2.4 for asthmatic and healthy children and (B) validation of the
obtained results Q2 values distribution of the original and permuted MCCV (1000
permutations)……………………………………………………………………………... 125
Figure 2.15 - (A) Projection of new exhaled breath dataset using the breath metabolomics
based model of chapter 2.4 using a sub-set of 9 compounds (nonane, 2,2,4,6,6-
pentamethylheptane, decane, 2-methyldecane, dodecane, tetradecane, nonanal, decanal, and
dodecanal) and (B) validation of the obtained results Q2 values distribution of the original and
permuted MCCV (1000 permutations)
............................................................................................................................................. 127
Figure 2.16 - PLS-DA LV1×LV2 scores scatter plot of exhaled breath for asthmatic and
healthy children using a data set with 130 compounds coloured according to (A) age range (3
to 5 years old, 6 to 9 years old and 10 to 16 years old) and (B) according to exhaled breath
collection site demonstrating no influence on the discrimination. Figures based on
metabolomic PLS-DA based models previously
developed............................................................................................................................. 128
Figure 2.17 - (A) Alkane variations for 10 breath samples collected for three years in the
same asthmatic child based on the built PLS-DA model with two LVs and (B) predicted Y
value against reference Y value behavior. a. u. arbitrary units…………………………… 130
Figure 2.18 - PLS-DA LV1×LV2 scores scatter plot of exhaled breath for asthmatic and
healthy children using the 9 compounds subset and projection of new exhaled breath dataset
(state sate and exacerbation conditions for two patients). The path of two children in
exacerbation condition (E) and stable state (S) is shown, through different sampling times. E1
and E2 are the initial exhaled breath samples: S1 exhaled breath was collected twice: 1 month
and half and 3 months and nine days after the initial samples. S2 was collected 3 months and
half later after the initial sampling
……………………………………………………............................................................. 131

Figure Captions
xvii
Figure 2.19 - (A) Omalizumab therapy monthly frequency monitoring and (B) PLS-DA
LV1×LV2 scores scatter plot of exhaled breath for asthmatic and healthy children using a
sub-set of 9 compounds. Path of the severe asthma patient is highlighted - A through F
sampling moments: 4 months (a), 4 months and half (b), 6 months (c), 6 months and half (d),
17 months (e), and 20 months (f) after Omalizumab initial
treatment………………………………………………………………………………….. 132
Figure 3.1 - Peak apex plot of the compounds identified in urine depicting all the chemical
families present in Table 3.2……………………………………………………………… 156
Figure 3.2 - Peak apex plots depicting five biochemically relevant selected families: alcohols,
aldehydes, alkanes, alkenes and ketones. Comparison between the asthma and healthy groups
scaled peak areas…………………………………………………………………………. 158
Figure 3.3 - Heat map of biochemically relevant selected families, aldehydes, ketones,
alkanes, alkenes and alcohols. Each line represent a scaled volatile compound (organized by
chemical families) and each column represents a subject (organized by healthy and asthma
children)………………………………………………………………………………….. 159
Figure 3.4 - (A) A) PLS-DA scores scatter plot showing a clear discrimination between
allergic asthma and healthy children, (B) LV1 loading weights plot of the selected 78
metabolites with the identification of main compounds related to the healthy group
……………………………………………………………………………………………. 161
Figure 3.5 - ROC space (A) where each point represents a prediction result (sensitivity and 1-
specificity) of the confusion matrices obtained from MCCV (500 iterations) of the PLS-DA
model for the different data normalization techniques employed and Q2 values distribution (B)
of the original and permuted Monte-Carlo Cross Validation for PLS-DA of exhaled breath of
full dataset………………………………………………………………………………… 162
Figure 3.6 - Partial Least Squares Discriminant Analysis (PLS-DA) applied to 1H NMR urine
spectra (δ0.50 to 10.0, excluding 4.55-6.05) using different data normalization techniques:
(A) normalized to total area, (B) normalized to creatinine signal and (C) by probabilistic
quotient normalization (PQN). The R2 for the total area, creatinine normalizations and PQN
was 0.03, 0.11 and 0.22, respectively. The healthy subjects are in full symbols whilst the

Figure Captions
xviii
asthma patients are represented by open symbols
………………………………………………………........................................................ 171
Figure 3.7 - ROC space, where each point represents a prediction result (sensitivity and 1-
specificity) of the confusion matrices obtained from MCCV of the PLS-DA model with PQN;
full symbols, prediction results in the original model (class membership, healthy or asthma,
correctly assigned); open symbols, prediction results in the permuted model (class
membership randomly permuted)
…………………………………………………………………………………………… 172
Figure 3.8 - PLS-DA LV1 loadings plot of all compounds colored as a function of VIP. Blue
represents VIP starting from 0 and red represents the highest obtained VIP value……… 173
Figure 3.9 - Scores plot for the first two latent variables of PLS-DA models from 1H NMR
spectra of urine using PQN using two possible variable selection: (A) Variable Importance in
Projection (VIP) higher than 1 and (B) by selecting regions between 0.5-3ppm and 6-9.5ppm
combined with VIP>1……………………………………………………………………. 175
Figure 3.10 - ROC space, where each point represents a prediction result (sensitivity and 1-
specificity) of the confusion matrices obtained from MCCV (500 iterations) of the (A) PLS-
DA model with PQN and selecting variables VIP >1 and (B) model with PQN and selecting
regions between 0.5-3ppm and 6-9.5ppm combined with VIP>1. Full symbols, prediction
results in the original model (class membership, healthy or asthma, correctly assigned); open
symbols, prediction results in the permuted model (class membership randomly
permuted…………………………………………………………………………………. 177

List of Tables
xix
List of Tables
Table 1.1 - LPO mechanism phases …...............................................................................14
Table 1.2 - Lipid metabolism related compounds by Nuclear Magnetic Ressonance ....... 15
Table 1.3 - Oxidative stress and LPO secondary compounds in asthma studies analysing
exhaled breath by GC-MS……………………………………………………………….. 17
Table 1.4 - Energy metabolism affected by asthma……………………………………... 19
Table 1.5 - Amino acid metabolism affected by asthma………………………………… 20
Table 1.6 - Commercially available SPME coatings…………………………………….. 41
Table 2.1 - Characteristics of the studied population in GC-MS study: allergic asthma and
healthy children………………………………………………………………………….. 77
Table 2.2 - Volatiles identified in Tedlar bags and cleansing procedure effects with rising
number of nitrogen flushes………………………………………………………………. 84
Table 2.3 - Identified compounds in exhaled breath in both children with allergic asthma and
healthy children and obtained from ambient air parallel sampling………………………. 87
Table 2.4. - Characteristics of the studied population in the GC×GC-ToFMS: allergic asthma
and healthy children……………………………………………………………………… 100
Table 2.5 - List of volatile compounds identified by GC×GC –ToFMS in exhaled breath of
allergic asthma and healthy children……………………………………………………... 105
Table 2.6 - Traits of the allergic asthma population used in the projection……………... 121
Table 3.1 - Characteristics of the studied population in the GC×C-ToFMS study: allergic
asthma patients and healthy controls.................................................................................. 147
Table 3.2 - Urinary compounds dataset tentatively identified by GC×GC–ToFMS from
allergic asthma and healthy children.…………………………………………………….. 150

List of Tables
xx
Table 3.3 – Characteristics of the studied population in the1H NMR : allergic asthma patients
and healthy children……………………………………………………………………… 167
Table 3.4 - Compounds (variables) contributing for the discrimination between healthy
subjects and asthma patients (VIP>1; highest VIP and corresponding chemical shift
highlighted) and comparison between the data available in the literature for each compound
and the obtained results in this study. The bold values were used in test T……………… 174
Table 3.5 - Prediction Results Obtained by MCCV (500 Iterations) of PLS-DA Models Built
for the Classes: Healthy vs Asthma (n=142).Comparison between the PLS-DA using PQN,
and a selection of variables with VIP higher than 1 (VIP>1) and by selecting regions between
0.5-3ppm and 6-9.5ppm combined with VIP>1 (regions)………………………………... 176

List of abbreviations
xxi
List of Abbreviations Abbreviation/
Acronyms Significance
1D One dimensional 1H NMR Proton nuclear magnetic resonance
AIT Allergen specific immunotherapy
BAL Bronchoalveolar lavage
BALF Bronchoalveolar lavage fluid
Car/PDMS Carboxen / polydimethylsiloxane
CLTs Cysteinyl leukotrienes
CW/DBV Carbowax/divinylbenzene
DC Direct current
DVB/CAR/PDMS Divinylbenzene/carboxen/polydimethylsiloxane
EBC Exhaled breath condensate
FeNo Fractional exhaled nitric oxide
FEV1 Forced expiratory volume 1
FVC Forced vital capacity
GC×GC–ToFMS Comprehensive two-dimensional gas chromatography coupled to mass spectrometry with a high resolution time of flight analyzer
GC–MS Gas chromatography coupled to mass spectrometry
GINA Global Initiative for Asthma
GMC-SF Granulocyte macrophage colony stimulating factor
HS-SPME Headspace solid phase microextraction
ICS Inhaled corticosteroids
IgE Immunoglobulin E
IL Interleukin
ISAAC International Study of Asthma and Allergies in Childhood
LABAs Long acting beta2 agonists
LC-MS Liquid chromatography coupled to mass spectrometry
LLE Liquid-liquid extraction
LOO-CV Leave one out cross validation
LPO Lipid peroxidation
LTC4 Leukotriene C4
LTMs Leukotriene modifiers
LTRA Leukotriene receptor antagonists
LTRI Leukotriene receptor inhibitors
MCCV Monte Carlo cross validation
List of Abbreviations
xxii
Abbreviation/ Acronyms
Significance
MDGC Multidimensional gas chromatography
MVA Multivariate analysis
PA Polyacrylate
PCA Principal component analysis
PDMS Polydimethylsiloxane
PDMS/DVB Polydimethylsiloxane/ divinylbenzene
PLS-DA Partial least squares discriminating analysis
PQN Probabilistic normalization quotient
RF Radio frequency
RI Retention indices
RNS Reactive nitrogen species
ROC Receiver operating characteristics
ROS Reactive oxygen species
SABAs Short acting beta2 agonists
SPE Solid-phase extraction
TCA Tricarboxylic acid
Th T-helper
TNF-α Tumor necrosis factor alpha
UPLC-MS Ultra performance liquid chromatography coupled to mass spectrometry
VOCs Volatile organic compounds

CHAPTER 1 INTRODUCTION
Chapter
1


Chapter I - Introduction
1
1.1 Asthma
1.1.1 Asthma: definition, symptoms and clinical diagnosis
Asthma is a complex chronic disorder of the airways characterized by variable
and recurring symptoms, airflow obstruction, bronchial hyperresponsiveness, and an
underlying inflammation1. These characteristics interact and determine the clinical
manifestations, asthma severity and treatment response. The symptomatology associated
with asthma is coughing, wheezing, breathlessness and chest tightness that varies from
person to person in severity and frequency (Figure 1.1).
Figure 1.1 – The interaction between airway inflammation and clinical symptoms1.
Asthma severity is divided into four groups: intermittent, persistent-mild,
persistent-moderate and persistent-severe. Asthma control can also be classified as well,
not well and poorly controlled2. Both asthma severity and control are assessed by
criteria, such as symptoms presence, nighttime awakenings, normal activity impairment
and peak flow among others. Asthma severity classification is highlighted when
initiating therapy whereas asthma control is emphasized to monitor and change therapy
as needed. Actually, asthma control is weighted equally with asthma severity to

Chapter I - Introduction
2
establish the adequate therapy. Nevertheless, asthma severity can change over time and
therefore continuing care is highly recommended3.
Asthma complexity leads to an evolving concept. Previously, asthma emphasized
the duality of allergic asthma and non-allergic asthma. More recently, research in this
field led to separate into subgroups based upon clinical, physiologic, and pathologic
characteristics. Thus, an array of phenotypes and endotypes arose. Asthma phenotypes
include allergic asthma, severe steroid-resistant asthma and asthma induced by exposure
to air pollution, cigarette smoke, diesel exhaust particles, obesity, aspirin and exercise4.
Eighty percent of childhood asthma has been reported to be allergic5. The triggers that
cause allergic asthma are known as allergens. These comprise a large array of
substances that two important characteristics: (1) they are almost always organic and (2)
are always harmless to non-allergic individuals. Common sources include animal
proteins (cat and dog allergens), dust mites, cockroaches, fungi and pollens.
Asthma symptoms can manifest at any time in life, although many people develop
asthma as children. In this PhD thesis, the focus was on pediatric asthma. Diagnosing
asthma in children can be a difficult task to perform differing from pre-school children,
school-aged children, adolescents and adults in several ways. In early life, asthma is
quite variable and not fully grasped. Early childhood wheezing and symptoms related to
asthma are heterogeneous disorders with several phenotypes and variable expressions
during infancy. Another issue is related to the use of objective lung function tests in
children, as these procedures poses a challenge for children to perform. Asthma control
in children is also a complex issue due to the anatomic differences, as for example the
smaller size of airways and lower inspiratory flow rate, affecting medication deposition
in the affected airways. In addition to these aspects, there are a number of comorbidities
that have similar symptoms to the ones caused by asthma, as well as, asthma is also
associated with other pathologies such as rhinitis, hay fever, atopic eczema and
rhinosinusitis. These comorbidities have a role in asthma clinical expressions and are
documented to influence asthma management and control6.
In children younger than 6 years old, lung function tests lack accuracy and the
physician relies on the information that the parents and even the child give. The
diagnosis may be in a halt until months have passed of symptom observation. Children
younger than age 3 that have asthma symptoms the physician doctor may use a wait-
and-see approach as the effects of medication are still not clear. In children 6 years old

Chapter I - Introduction
3
and older, pulmonary function tests are performed: auscultation, spirometry and
bronchodilator response test1.
Spirometry is a relatively simple and non-invasive method to measure the full
lung inflation air volume and flow using forced manoeuvres7. It plays an important role
in diagnosis and managing respiratory diseases; nevertheless there is no standard
reference tests to accurate determine the sensitivity or specificity of spirometry to
establish airflow limitation8. Gender, age, height, weight and ethnic group are factors
that influence the obtained values9. The volume of air exhaled forcefully in 1 second is
denominated forced expiratory volume 1 (FEV1) and the forced vital capacity (FVC) is
the volume that can be maximally forcefully exhaled, so FVC contains FEV1. To detect
an obstruction the ratio FEV1/FVC has to be lower than 0.7 and FEV1 less than 80% of
the predicted value. FVC is highly dependent on the effort and collaboration of the
subject and to complete a maneuver subjects must expel air forcefully and completely at
least three times. This is extremely difficult for elderly subjects, children and those with
severe airflow limitation. Another disadvantage in spirometry is that it is not
recommended for asymptomatic individuals, being used for those with respiratory
symptoms and there is no benefit in using spirometry to monitor disease status. This
limitation leads to underdiagnosis in younger subjects and overdiagnosis in elderly
subjects, which leads to false positives and false-negatives depending on age10.
The determination of nitric oxide (NO) levels in exhaled breath is also an
available tool that may complement asthma diagnosis. NO induced by inflammatory
mediators in the airways are reportedly increased in asthmatic patients11. Several reports
have been published to demonstrate its clinical value. NO is produced when L-arginine
is catalyzed by nitric oxide synthases (NOS) into L-citrulline12. NO can be measured
online allowing the evaluation with a real-time display. In the offline mode exhaled
breath is collected into containers for posterior analysis. NO values are affected by
several factors such as age, race, gender, atopy, diet, nasal NO contamination,
measurement techniques, exhalation flow rate, among others. Although a connection
between NO levels and eosinophils in blood, bronchoalveolar lavage fluid (BALF),
sputum, and bronchial biopsies may correlate to eosinophilic inflammation, there are
confounders that might result in higher eosinophilic content. Other pathologies that
cause inflammation other than asthma, as atopic eczema reported by Zinelli and co-
authors13, increase the levels of NO found in exhaled breath. Recently, Hastie et al.14
reported that NO levels, among other biomarkers, are poor surrogates in the accurate

Chapter I - Introduction
4
prediction of sputum eosinophil and neutrophil percentages. The link between NO and
treatments remain unclear, nevertheless lower values of NO are reported with the
administration of short acting β-agonists15. Using NO in the clinical practice is still
debated due to the inconsistencies and due to the large number of factors that can affect
the outcome.
Whenever the doctor suspects that asthma is related to allergens evaluation can be
performed by skin prick tests. This test is performed by pricking the skin with a pin that
contains a small dosage of the allergen, and if an immune-response arises in the form
rash or urticaria the conclusion is that the patient has a hypersensitivity to that allergen
(Figure 1.2).
Figure 1.2 – Skin prick test16
The advantage of this method is the quick interpretation (15-20 minutes) after pricking
the skin, accompanied with visual indication of the results. Nevertheless, this test is not
practical with patients with extensive eczema, dermographism, urticaria, and moreover
cannot be applied in subjects that are consuming anti-histamines or other medications
that may interfere with the results and lacks procedure worldwide standardization and
allergen panels17. Although there was a considerable progress in asthma diagnosis,
management and treatment, in the past years the development of new methods that
allow standardization, more reliable results, and the follow-up of therapy, to yield better
asthma controlled status, led to considerable research that take into consideration

Chapter I - Introduction
5
important parameters such as airway inflammation, instead of symptoms and lung
function.
The invasive method of obtaining samples such as BALF, bronchoscopy or
bronchial biopsy are normally used to measure airway inflammation and to give more
detailed information of asthmatic patients. Sputum induction is performed by inhaling
isotonic or hypertonic solutions by nebulisation to induce airway secretion that can be
expectorated18. BALF is an important tool in the diagnosis of several lung diseases in
which a bronchoscope is passed through the mouth or nose into the lungs and a liquid is
squirted in and collected for examination. The use of lung tissue in asthma is also a
possibility using samples obtained during the bronchoscopy procedure yielding
important information on tissue resident cells19. Although these procedures indicate
airway inflammation more accurately, the invasiveness impairs their regular use in the
clinical practice creating the necessity to assess the inflammation status in a less
invasive manner. Blood is a less invasive method than sputum induction and
bronchoscopy. It can be assumed that it can be used to indirectly measure the state of
asthma as the inflamed tissue releases chemoatratractants and cytokines, which recruit
activated immune cells from peripheral blood. Another possibility for atopy evaluation
is the determination of allergen specific Immunoglobulin E (IgE) from blood samples.
IgE antibodies are detected and measured by allergen-specific IgE antibody assays. The
amount of bound allergen-specific IgE is interpolated from a standard calibration curve
linked to WHO IgE standard20.
1.1.2 Costs, incidence and prevalence
According to the Global Initiative for Asthma (GINA) it is reported that 300
million individuals suffer from asthma, and is the most chronic disease among
children21. Asthma represents a substantial burden on society and is considered an
important public health issue. Asthma is associated with high direct and indirect costs,
being between 1-3% of the total medical expenditures in most countries. Around 30
million people in Europe suffer from asthma22. In Europe, it is projected that these cost
represent about €18 billion23,24 (Figure 1.3).

Chapter I - Introduction
6
Figure 1.3 – Cost of care for asthma in Europe (data from 2003)24.
These elevated costs are related to disease severity, poor illness control and
underdiagnosis (direct costs) in addition to the costs related to time off work or school
(indirect costs). It can be observed from Figure 1.3 that more than 50% of the costs are
due the indirect costs of asthma not only of those affected by the pathology but also the
caregivers. In England, up to 69% of parents had to miss working days due to their child
asthma and 13% have been reported to quit their jobs25. The direct costs have also
increased in the primary and secondary care, in addition to hospital admissions and
treatment costs. The expenses associated with asthma drugs represent about 20% of the
total costs in Europe25. Asthma, therefore, has a significant socioeconomic impact not
only on patients, but on the whole family and consequently reducing life quality26.27
Incidence and prevalence are two important concepts. Incidence is the risk
evaluation to develop a new condition in a specific period of time whereas prevalence is
the population portion that has the said condition28. Over the last years, it has been
observed a striking increase in asthma incidence mainly in the urban areas of developed
countries. It is thought that urbanization and industrialization are the main contributors
to this tendency. Developing countries have also shown signals in following this
pathway. Nevertheless, globally in the past 5-10 years data suggests stabilization of
asthma incidence29. Asthma prevalence, despite of hundreds of reports, is difficult to
determine as there is a lack of a precise and well-defined definition of asthma that
makes the comparison of reported prevalence rather difficult30 (Figure 1.4). Globally the
prevalence of asthma for different countries varied between 1 and 18%31 accordingly to
the data listed in 2012 GINA report.
Outpatient care €3.8 Billion
Drugs € 3.6 Billion
Inpatient care €0.5 Billion
Productivity Losses €9.8
Billion

Figure 1.4
There is a sharp increase in global prevalence over the last 40 years, increasing by
50% each decade. The data from hospitalization due to asthma reflects an increase in
asthma severity and poor disease management, especially in young children
In Portugal, the latest asthma
Portuguese population has asthma currently whilst 10.5% had lifetime asthma
this, and according to the International Study of Asthma and Allergies in Childhood
(ISAAC) performed in 4 different Por
Porto), children between the ages of 6
teenagers (13-14 years old) varied between 9% (in 1995) and 12% (2002)
1.1.3 Disease management
After diagnosing asthma a
The control is focused in decreasing the risk of asthma attacks, the impairment, the
symptoms frequency and intensity and whatever functional restrictions that the patient
may possess - such as lung function decline
Chapter I - Introduction
Figure 1.4 – Worldwide prevalence of asthma32
se in global prevalence over the last 40 years, increasing by
50% each decade. The data from hospitalization due to asthma reflects an increase in
asthma severity and poor disease management, especially in young children33.
In Portugal, the latest asthma prevalence study (2012) has shown that 6.8% of the
Portuguese population has asthma currently whilst 10.5% had lifetime asthma
this, and according to the International Study of Asthma and Allergies in Childhood
(ISAAC) performed in 4 different Portuguese cities (Coimbra, Funchal, Portimão,
Porto), children between the ages of 6-7 asthma prevalence was 13%, whilst asthma in
14 years old) varied between 9% (in 1995) and 12% (2002)35.
Disease management
After diagnosing asthma and assessing its severity, an action plan is required.
The control is focused in decreasing the risk of asthma attacks, the impairment, the
symptoms frequency and intensity and whatever functional restrictions that the patient
nction decline1.
Introduction
7
se in global prevalence over the last 40 years, increasing by
50% each decade. The data from hospitalization due to asthma reflects an increase in
.
prevalence study (2012) has shown that 6.8% of the
Portuguese population has asthma currently whilst 10.5% had lifetime asthma34. Before
this, and according to the International Study of Asthma and Allergies in Childhood
tuguese cities (Coimbra, Funchal, Portimão,
7 asthma prevalence was 13%, whilst asthma in
nd assessing its severity, an action plan is required.
The control is focused in decreasing the risk of asthma attacks, the impairment, the
symptoms frequency and intensity and whatever functional restrictions that the patient

Chapter I - Introduction
8
The control of asthma symptoms can be achieved by either a non-
pharmacological and/or a pharmacological management (Figure 1.5). The non-
pharmacological management can be performed before or after the disease onset being
designated primary and secondary prophylaxis, respectively. House dust mite, animal
allergens (dog or cat fur, for example), tobacco smoke, pollen, specific foods (for
example, eggs or milk) are some examples of triggers if avoided can help in controlling
asthma symptoms.
Figure 1.5 – Non-pharmacological and pharmacological asthma management36
Asthma treatment is an intricate pathway involving several steps that aims to
achieve asthma control (Figure 1.5). The objective is to promote the decrease on
medication intake to the lowest possible whilst the asthma condition remains stable.
Nevertheless, treatment is approached in a step wise fashion, i.e., if the asthma severity
increases the frequency and medications increases or if it diminishes the opposite is
observed36. Asthma is treated with two types of medicines: controller asthma (long-term
control) and rescue asthma (quick-relief) medications. Long-term control medicines
help reduce airway inflammation and prevent asthma symptoms. Quick-relief, or
"rescue," medicines alleviate asthma symptoms that may flare up. The initial treatment
will depend on the asthma severity. In case of allergic asthma, many triggers can set off
or worsen your asthma symptoms.
The pharmacological management aims to control the disease, which entails
several parameters to be achieved such as no daytime or nighttime symptoms, no need
for rescue medications, no exacerbations, normal lung function, no limitation in activity
and all with minimal medication side effects. Asthma medication can be divided into
two main classes: medication for long-term control that includes inhaled corticosteroids
(ICS), leukotriene modifiers (LTMs) and long acting beta2-agonists (LABAs). For quick
relief of airflow obstruction and symptoms there are available short-acting beta2-
Asthma management
Non-pharmacological Pharmacological
Primary prophylaxis Secondary prophylaxis
CorticosteroidsLeukotriene receptor
antagonist
Inhaled anticholinergic
Long-actingbeta2-agonist
Rescue asthma medication Controller asthma medication
Short-acting beta2-agonist

Chapter I - Introduction
9
agonists (SABAs), anticholinergics and systemic corticosteroids. ICS are the most
effective long term control medication for asthma that reduces inflammation in the
airways and clinically there is a reduction of symptom severity, improvement of asthma
control, diminished airway hyperresponsiveness, hospitalization reduction and
prevention of exacerbation, among others. Moreover, ICS suppresses cytokine
generation and the release of inflammatory mediators37. LTMs are divided into two
classes: leukotriene-receptor antagonists (LTRA) and leukotriene-receptor inhibitors
(LTRI). Leukotrienes are potent biochemical mediators that contract airway smooth
muscle, increase vascular permeability, increase mucus secretions and activate
inflammatory cells in airways of patients with asthma. LTRA prevents leukotriene
binding whilst LTRI focus on synthesis inhibition38. As for inhaled LABAs, their
actions is to relax airway smooth muscle by stimulating beta2-receptors and are used as
an adjunct to inhaled CCS to provide long-term control of asthma symptoms39. SABAs
provide quick relief of symptoms relaxing the muscles lining the airway within 5
minutes, increasing the airflow thus relieving asthma symptoms. Nevertheless, SABAs
do no control the inflammation. Asthma management is a continuous appreciation of the
patient’s asthma status as shown in Figure 1.6.
Figure 1.6 – Asthma management continuum40 (ICS- Inhaled Corticosteroid; LABA- long
acting beta2-agonists; LTRA- Leukotriene Receptor Antagonist).
Environmental Control
Controlled Uncontrolled
Fast-acting bronchodilator on demand
Inhaled CorticosteroidSecond line: Leukotriene Receptor Antagonist
≥ 12 years: Add LABA
6-11 years: Increase ICS
≥ 12 years: Add LTRA
Prednisone
6-11 years: Add LABA or LTRA

Chapter I - Introduction
10
Allergen-specific immunotherapy (AIT) is a treatment used whenever asthma
symptoms cannot be controlled by medication and environmental control, who cannot
tolerate the medication, or do not comply with the medication regimen. AIT entails the
administration of allergen extracts to provoke clinical and immunologic tolerance to the
allergen. AIT can be administered subcutaneously or sublingually. This therapy
stimulates desensitization and allergen specific tolerance in addition to the inhibition of
allergic inflammation in affected tissues41. Several disadvantages limits a broader
applicability, as for example, unwanted secondary effects, and poor efficacy/specificity
that are mainly related to a poor quality of natural allergen extracts and the treatment
takes several years42.
For those suffering from the severe type of asthma and that have allergies
Omalizumab® can be considered. This drug is a humanized, monoclonal anti-IgE
antibody that stops the allergy cascade by binding to the circulating IgE. This
medication is subcutaneously injected every 2 to 4 weeks usually related to the total IgE
levels. This therapy is used whenever in patients 6 years of age or older with severe,
persistent allergic asthma and elevated serum IgE levels whose symptoms cannot be
controlled with ICS. This drug lowers the IgE levels regardless allergen specificity
preventing free IgE from interacting with mast cells, basophils, macrophages, dendritic
cells, among other cells43.
1.1.4 Asthma Pathophysiology
Sensitization to the allergen has to occur in order for an individual to develop
allergic asthma. This process can happen years before any clinical symptoms begin.
Allergic sensitization is the result of a intricate interaction between the allergen and the
host. After the allergen has been inhaled antigen-presenting cells as dendritic cells,
which are present in ephithelium lining of the airways and nose, internalise, process and
expresses the allergen on their surface. Afterward, the allergens are presented to
immune response cells as T-lymphocytes that differentiate into T-helper (Th) 2-type
cells. The activation of these cells produce inflammatory cytokines and consequently
allergen-specific B-cells propagate and IgE-antibodies that are able of binding to a
particular allergen are produced. Allergen-specific antibodies are produced whenever
stimulation occurs by different allergens. IgE then connects to high affinity receptors on

Chapter I - Introduction
11
mast cells so that the allergen specific receptor site is potentially accessible for the
allergen. The process is completed with the production of allergen specific IgE-
antibodies (Figure 1.7).
Figure 1.7 – Allergic asthma pathophysiology representation of sensitization and re-
exposure44(CD- Cluster of Differentiation; IL- Interleukin; TCR- T-cell receptor ).
Allergen re-exposure makes the immune system react more agressively and in a
rapid memory response way. The allergen connects to the allergen-specific IgE on mast
cells that leads to the release of the previously formed mediators. Whenever a sufficient
number of mast cell/basophil- bound IgE antibodies are bound to the allergen cell
degranulation occurs, leading to the release of inflammation mediators such as
histamine chemokines, lymphokines, eicosanoids, proinflammatory cytokines and
growth factors is initiated in an intra-cellular signalling process. The TH2 lymphocyte is
very important in asthma pathogenesis as it produces cytokines involved in the initiation
and maintenance of the inflammation cascade. Cytokines, such as interleukin (IL) 3,
granulocyte macrophage colony-stimulating factor (GMC-SF) and IL-5, play a critical
role in the differentiation, proliferation, survival and activation of eosinophils45.
Eosinophils secret cytotoxic granule proteins and produce lipid-derived pro-
inflammatory mediators such as leukotriene C4 (LTC4), mediate the damage to the
airway epithelium46. IL-3 and to a lesser extent IL-4, are critical in the development of
mast cells47, which play a prominent role in the acute-phase response. IL-4 and IL-13

Chapter I - Introduction
12
are required for isotype switch to IgE. IL-1 and tumor necrosis factor alpha (TNF-α) are
potent pro-inflammatory cytokines that are involved in the upregulation of adhesion
molecules on vascular endothelium, an essential step in the migration of leukocytes to
sites of inflammation48.
The response of the immune system is usually split in two phases: early and late
phase reaction. Early phase reaction is the immediate hypersensitivity where the
chemical mediators, as histamine, prostaglandins, leukotrienes and thromboxane, are
released by mast cells producing characteristic allergic reaction responses. Some
examples are edema, mucus secretion and sneezing in the respiratory tract, vasodilation
in the nose and bronchoconstriction in the lung that leads to wheezing. In the late phase
reaction, that usually occurs 4-6 hours after the early phase reaction, the continued
allergic response leads to cellular infiltration, fibrin deposition and tissue destruction.
This reaction increases bronchial reactivity, edema and extra inflammatory cell
recruitment. Eosinophils, T lymphocytes and macrophages, as well as, the epithelial,
endothelial and smooth muscle cells support the airway inflammation chronic
symptoms. These cells are also thought to play an important role in the formaiton of
inflammatory mediators like chemokines, cytokines, and leukotrienes44. IgE plays an
important tole in the response that the immune systems yields to allergens as it triggers
mas cell mediator release that directs to early and late phase reactions49.
The role of oxidative stress in asthma pathogenesis is still in debate. Oxidative
sress is observed on asthma patients and it may be derived from the inflammation or it
may a contributory factor to asthma pathogenesis as several reports have been made on
the role of oxidative stress in the immulogic diseases. ROS act as transfer stimulating
signals as a critical intracellular second menssenger modulating immune responses.
Oxidative stress increases airway inflammation as it induces pro-inflammatory
mediators, which in its turn enhaces bronchial hyperresponsiveness, stimulates
bronchspasm and increases mucus secretion. In fact, intracellular ROS, whenever
NADPH oxidase activity occurs, increases temporarily in many types of cellular stimuli
that include antigens, infections, chemical mediators and growth factors50,51.
Asthma metabolic disorders
Asthma produces alterations on a person’s physiology and hypothetically the
metabolic profile of an asthmatic is different from a healthy individual. Therefore, the

Chapter I - Introduction
13
metabolic signature would be different for differentiated conditions52. The asthma
complexity is reflected in the myriad of biochemical pathways involved, as shown in
Figure 1.8.
Figure 1.8 – Main altered biochemical pathways in asthma53.
Compounds and the inherent metabolic pathways have been identified, such as
oxidative stress (that damages lipids, proteins and DNA), lactic acidosis, tricarboxylic
acid (TCA) cycle, the amino acids and energy metabolisms.
Oxidative stress and lipid peroxidation (LPO) is a lipid metabolism dysfucntion 54 and asthma is characterized by sistemic and localized oxidative stress and subsequent
LPO. Inflammatory cells (activated eosinophils, neutrophils, macrophages and
monocytes) and epithelial/smooth muscle cells can generate reactive oxygen species50.
Free radicals reactive oxygen species (ROS) and reactive nitrogen species (RNS) are
generated in the body by various endogenous systems, exposure to different
physiochemical conditions or pathological states. A free radical can behave as an
oxidant or reductant as they can accept or donate an electron from other molecules.
Table 1.1 shows the three phases of the LPO mechanism
Altered Amino Acids Metabolism
Tryptophan Tyrosine Homocysteine
2-hydroxyisobutyrateKynurenine
Altered Energy MetabolismAltered Lipid Metabolism
Acetyl-CoAFatty Acids
Urea Cycle
Creatine
Creatinine
Phosphoenol-Pyruvate
Acetoacetyl-CoA 3-Hydroxybutyrate
Pyruvate
Hydrocarbons
Glucose
Altered TCA Cycle
Citrate
cis-Aconitate
D-Isocitrate
αααα-ketoglutarate
Succinate
Fumarate
Malate
Oxaloacetate
Succinyl-CoA
Leucine
3-hydroxy-3methylglutaryl-CoA
Threonine
Propionyl-CoA
Carnitine
O-Acetylcarnitine
3-hydroxy-3-methylglutarate
Histidine
1-methylhistamine
Formate
Choline
BetaineArginine
Methionine
DNA methylation
Lactate
Phenylalanine

Chapter I - Introduction
14
Table 1.1 - LPO mechanism phases
Phase Description
1 Initiation: formation of free radicals
2 Propagation: free radical chain reactions
3 Termination: formation of non radical products
The initiation can begin in a single event that can convert hundreds of fatty acids
into lipid hydroperoxides. The length of the propagation depends on many factors as the
lipid-protein ratio, the fatty acid composition, oxygen concentration and the presence of
antioxidants within the membrane that might interrupt the chain reaction55. Propagation
takes place by the reaction of lipid radical with a methylene group of a non-oxidized
unsaturated fatty acid molecule to yield another lipid hydroperoxide and another fatty
acid radical, which can react with oxygen to start a chain reaction56. These reactions
occur until termination that occurs when there is a combination of two radicals forming
a non radical product or by the presence of hydrogen or electron donor57. Some
examples of important oxygen-containing free radicals in several disease states are for
example superoxide anion, hydroxyl, hydrogen peroxide and peroxynitrite. Free radical
formation occurs continuously in the cells as a consequence of both enzymatic and non-
enzymatic reactions. Figure 1.9 shows the link of allergens and ROS in asthma.
Figure 1.9 – Allergens and reactive oxygen species linked in asthma58 (DEP- Diesel Exhaust
Particles; GM-CSF- granulocyte macrophage colony-stimulating factor; MCP- Monocyte chemotactic
protein; TNFα- tumor necrosis factor alpha).

Chapter I - Introduction
15
If an imbalance between the free radicals and the antioxidant defenses is
observed, a condition known as oxidative stress arises. Free radicals alter lipids,
proteins and DNA and are known to generate a number of human diseases. Oxidative
stress is thought to have a role in the development of human diseases such as cancer,
cardiovascular disorders and immunologic diseases59.
Lipid metabolism is also affected by asthma pathology as shown in the reports
by Ho53, Saude et al.77 and Jung et al.
81 (Table 1.2). Lipid metabolism has shown to
contribute to asthma pathophysiology in childhood60.
Table 1.2 - Lipid Metabolism related compounds by Nuclear Magnetic Ressonance
Author Compound ↑↑↑↑ Biofluid
Jung et al.81
methionine Asthma Serum
choline Healthy
Saude et al.77
carninitine Asthma Urine
O-acetylcarnitine Asthma
The latter author has demonstrated that there is a strong and direct influence of
metabolic pathways on the immune mechanisms. Saude et al.77 has described that the
urinary levels of carnitine are high in asthma patients with unstable status. This
compound has a role in oxidative metabolism in mitochondrial and hypoxemic stress.
The identified compounds in lipid metabolism pathways are identified in Table 1.1.
Oxidative stress has been proven to affect smooth muscle contraction, induce
airway hyperresponsiveness and increase mucus secretion and epithelial shedding
within respiratory cells. Excessive ROS production in asthma can trigger key enzymatic
and non-enzymatic reactions, leading to an antioxidant-oxidant imbalance in respiratory
airways which promotes state of oxidative stress in asthma61.
There is evidence that free radicals are influential components of the molecular
mechanisms involved in the pathogenesis of asthma, namely airway inflammation, and
determinant of asthma severity61. Inflammatory cells and resident cells (epithelial and
smooth muscle cells) can generate ROS that can attack proteins to form carbonyls and
react with nitrogen species and tyrosine to form nitrotyrosine. It has been shown that
nitrotyrosine formation is increased after allergen exposure50. ROS also reacts with
lipids to release isoprostane. 8-isoprostane has been reported to be elevated in the
exhaled breath condensate of asthma patients62. ROS excess production also correlates
with airway hyperresponsiveness, as for example, in the immediate formation of O2-

Chapter I - Introduction
16
when an asthma attack occurs being high at the sites of antigen challenge that persists
through the late asthmatic phase63. NO also plays an important role in asthma. There is
evidence that the autoxidation of NO results in nitrite, which is a substrate for
eosinophil peroxidase and myeloperoxidase64. NO reacts with superoxide that yields
ONOO- and consequently can nitrate tyrosine residues and damage enzymes, structural
and functional proteins65. ROS production by neutrophils also correlates with asthma
severity as demonstrated by the levels of 3-bromotyrosine, a product of eosinophil
peroxidase and eosinophil, which was 3 times higher in the bronchoalveolar lavage fluid
in individuals with asthma when compared with control subjects66.
Beside the previously identified compounds, volatile organic compounds
(VOCs) have also been associated with asthma (Figure 1.10).
Figure 1.10 – Secondary products formation in LPO (ALEs - advanced lipoxidation end products)67.

Chapter I - Introduction
17
VOCs are generated during pulmonary physiologic and pathologic processes,
such as LPO and inflammation68. The production of secondary compounds constitutes a
minor degradation pathway and they comprise an array of chemical families, from
aldehydes, ketones and alkanes with the latter being more stable not reacting with
proteins. Dallinga et al.69 and Ibrahim et al.
70 have reported C13 alkanes in the
characterization of asthmatic population through exhaled breath (Table 1.3). Although
the mechanism by which these alkanes are formed (namely, ramified alkanes) is still not
well understood there are been reports on the volatile composition of lung cancer cell
lines where these metabolites have an important role71.
Table 1.3 - Oxidative stress and LPO secondary compounds in asthma studies analysing exhaled breath
by GC-MS
Author Compound
Dallinga et al.69
(branched) hydrocarbon (C13H28) (branched) hydrocarbon (C13H28) unsaturated hydrocarbon (C15H26) (branched) hydrocarbon (C11H24)
Ibrahim et al.70 2,6,11-trimethyl-dodecane
(branched) hydrocarbon (C13H28)
Increased ROS is known to damage DNA, lipids, proteins and carbohydrates
affecting cellular functions and increase inflammation (Figure 1.11).
Figure 1.11 – Possibilities of the damage caused by ROS 72.
The oxidative damage to DNA is known to affect nuclear or mitochondrial DNA
leading to mutation, gene expression changes73. For example, it has been shown that
hydrogen peroxide induces DNA strand breaks in airway epithelial cells that leads to
modifications in the epithelial cell-specific gene expression74. DNA strand breaks also
showed to influence type 2 alveolar epithelial cells and shows a relationship to the
development of lung disease73 (Figure 1.12).
Cell membranedamage
MitochondriadamageDNA
damage

Chapter I - Introduction
18
Figure 1.12 – Reactive oxygen species damage nuclear and mitochondrial DNA75.
ROS’s protein modification affects their biological function that in several
occasions are important to initiate and maintain inflammation. An example is the loss of
antioxidant capacity of the superoxide dismutases known to catalyze superoxide to
hydrogen peroxide and subsequently to water. Moreover, inflammatory cells can secrete
enzymes that damages oxidatively the protein by producing reactive brominating,
chlorinating and nitrogen species76.
Other metabolic pathways are affected by asthma like the TCA and urea cycles.
The TCA cycle is the central metabolic hub of the cell, which is the final common
pathway for the oxidation of amino acids, fatty acids and carbohydrates. It is a
fundamental metabolic pathway for energy production through aerobic respiration that
takes place in the mitochondria. Saude et al.77 analyzed human urine from asthmatic
individuals using proton nuclear magnetic resonance (1H-NMR) and found compounds
related to the TCA that were critical for the discrimination attained between healthy
individuals, outpatient asthmatics and even asthmatics from emergency department. Ho
et al.53 studied in sensitized mice BALF that also identified compounds that are related
to the TCA cycle.
Succinate, fumarate, lactate and cis-acotinate concentrations were higher in
asthmatics when compared to the healthy children whilst threonine and α-oxoglutarate
levels are higher for the healthy children. Ho et al.53 found increases in malate, lactate

Chapter I - Introduction
19
and creatinine mice BALF that are energy metabolism related compounds. The behavior
of these energy-related compounds may be explained by an increased burden and
subsequent demand of a higher energy intake by the inflammatory cells. Higher levels
of lactate are a consequence of poor oxygenation (hypoxia), in which the mitochondria
are unable to produce adenosine triphosphate in a sufficient rate to supply the cell.
Subsequently, glycolysis is increased and the pyruvate excess is converted in lactate that
is released to the bloodstream. For example, lactate was also found to be elevated in
patients with lung cancer78. Malate is a TCA cycle intermediate and there are no reports
that describe this compound to be altered in asthma or any lung related pathology with
the exception of Ho et al.53. Nevertheless, other intermediates of the TCA cycle
succinate, fumarate and cis-aconitate, have been reported by Saude et al.77 to be altered
in asthmatics which supports the evidence that TCA cycle is affected by this pathology.
Creatine takes part in the energy supply to muscles, as for example airway smooth
muscles79 and as shown by Saude et al.77 the levels of this compound is increased in the
asthmatic patients. This behavior is also attributed to the increased respiratory burden77.
Creatinine is a downstream compound of creatine, and according to Ho et al.53, it has
higher values in sensitized mice which corroborate the hypothesis of the promotion of
energy metabolism, but by the urea cycle. The information is compiled in Table 1.4.
Pyruvate is an end product of glycolysis and is converted to acetyl CoA involved
in the TCA cycle80. Pyruvate has been identified in asthmatic sera81, nevertheless there
is no reference of asthma influencing this particular compound but compounds that arise
from different pathways have been reported. Lactate levels were increased in the sera of
asthma patients81, as well as, in urine77.
Table 1.4 - Energy metabolism affected by asthma
Author Metabolites ↑↑↑↑ Metabolic
pathways
Analytical
technique Biofluid
Saude et al.77
α-oxoglutarate Healthy
TCA Cycle NMR
Human
Urine
succinate Asthma fumarate Asthma threonine Healthy
lactate Asthma cis-conitate Asthma
Ho et al.53
malate Asthma TCA Cycle GC-MS
LC-MS
Mice
BALF lactate Asthma
creatinine Asthma Urea cycle creatine Asthma

Chapter I - Introduction
20
Lactate concentration rises whenever lactic acidosis occurs82, that typically
occurs when cells receives too little oxygen (hypoxia)83 and it is considered as a distinct
form of metabolic acidosis. Lactic acidosis is more frequent in adult patients with severe
asthma84, nevertheless it does occur in the pediatric population to a lower extent85.
Lactate levels are also increased in lung cancer patients, as reported by Rocha et al.78.
Glucose results from non-carbohydrate carbon substrate, such as pyruvate and lactate86,
and the concentration of this compound has been reported to be higher in urine of
asthmatic patients when compared to the healthy control levels77. Nonetheless, in sera
glucose has decreased levels81, but in this study lactate levels, as previously mentioned,
are increased which could explain this result. Ho et al.53 has also demonstrated lower
levels of carbohydrate related compounds (mannose, galactose and arabinose) and
suggested that these compounds could be used to yield lactate and malate to provide
extra energy. Formate can also be formed from pyruvate and in serum the concentration
is lower for asthmatics than in children81, nevertheless in exhaled breath condensate the
levels of formate are 40% higher in asthmatic samples when compared to children
considering this result as an indication of the airway S-nitrosothiol depletion87.
The protein and amino acid metabolisms are reportedly changed by the asthma
pathology. Ho et al.53 and Saude et al.
77 also noticed the alteration in the protein and
amino acid metabolism and the compounds that supported this hypothesis are shown in
Table 1.5.
Table 1.5 - Amino acid metabolism affected by asthma
Author Metabolites ↑↑↑↑ Analytical
technique Biofluid
Saude et al.77
2-hydroxyisobutyrate Asthma
NMR Human Urine 3-OH-3-methylglutarate Asthma
1-methylhistamine Asthma tryptophan Asthma threonine Healthy
kynurenine Asthma
Jung et al.81 methionine Asthma NMR Human sera
histidine Asthma
The protein metabolism is a set of biochemical processes (Figure 1.13) that
comprise the protein and amino acid synthesis, as well as, protein breakdown by
catabolism.

Chapter I - Introduction
21
Figure 1.13 – Example of amino acid involvement in other biochemical pathways88 ( AAs – Amino
Acids; Ala- Alanine; Arg- Arginine; Asp- Aspartic acid; ASA- Argininosuccinate; Cit- Citrulline; Cys-
Cysteine; Ser-Serine; Gly- Glycine; His- Histidine; KGA- α-Ketoglutaric Acid; Leu- Leucine; Ile-
Isoleucine; Lys- Lysine; Met- Methionine; OAA- Oxaloacetic Acid; Phe – Phenylalanine; Orn- Ornithine;
Pro- Proline; Succinyl CoA- Succinyl Coenzyme A; Thr-Threonine; Trp-Tryptophan; Tyr- Tyrosine;
Val- Valine)
Another reported alteration is related to the histidine metabolism. Histamine is
formed by decarboxylation reaction catalyzed by the enzyme histidine decarboxylase.
Jung et al.81 have shown that histidine is elevated in the sera of asthmatic patients
showing that this biochemical pathway may be influenced by asthma. A downstream
compound of histamine (Figure 1.14), 1-methylhistamine, was reportedly increased in
urine of asthmatic patients81.
Glucose Triglycerides
LipolysisGlycolysis
lactate Fatty acidspyruvate
Fatty acyl-CoAAla Ser Thr Trp Gly Cys
ACAC-CoAAcetyl-CoALeuIleTrp
Proteins in tissues
Proteolysis
Endogenous AAs
αααα -keto acid ΝΗΝΗΝΗΝΗ4444
Asp OAA citrate
KGA
TCA cycleSuccinyl CoA
ProArgOrnHisCit
Glu
ThrValIleMet
PheTyr
urea Arginine
Ornithine ASAUreacycle succinatefumarate
malate
Phe Tyr Trp Lys Leu
Citrulline

Chapter I - Introduction
22
Figure 1.14 - Role of histamine in allergic reaction93.
Histamine is a known airway constrictor and influences the cells types that play a
role in immune and inflammatory reactions. In asthmatics BALF, the histamine
concentration has been shown to be higher89. The release of histamine, during allergic
reactions, is activated by immunologic and non-immunologic triggers from cytoplasmic
granules of mast cells and basophils90. Upon antigen challenge, histamine levels
increase as well as IgE stimulated mast cells. Depending on the location, histamine
release causes symptoms as acute rhinitis, bronchospasm, and flare responses, among
others. The majority of acute symptoms in allergic asthma are the result of fast activity
of histamine on vascular endothelium and bronchial and vascular smooth muscle cells91.
Histamine elicits such responses as vasodilation, smooth muscle contraction,
mucus hypersecretion, and edema as part of the immediate-phase allergic reaction92,93. It
has also a significant immune/pro-inflammatory properties that are mediated by
numerous cell types, including macrophages, T lymphocytes, epithelial and endothelial
cells and their products, and other key regulatory molecules94.
Kynurenine pathway is a major route for tryptophan catabolism. Tryptophan is a
precursor of several biochemical pathways, such as kynurenine, serotonin, melatonin
and protein synthesis95. The kynurenine pathway exists in varying extents in most cell
types, among them infiltrating macrophages and endothelial cells. The first stable
intermediate in the tryptophan catabolism is kynurenine. Subsequently, several free-
radical generators can be formed96. The evidence that the kynurenine pathway is

Chapter I - Introduction
23
important in the immune system regulation has been increasing in the past years97. The
up-regulation of the kynurenine pathway has been associated to several pathologies,
which include lung and breast cancer98. Kynurenine was found in higher concentrations
in asthmatics than in healthy children77. Its concentration was also reported for
interstitial lung disease to be higher when compared to normal subjects99.
Phenylalanine is an essential amino acid and it reportedly has adverse effects on
asthma100 as phenylketonuria is associated with increased plasma IgE and atopic
dermatitis101. It has also been associated with the production of tyrosine and
catecholamines, as for example epinephrine102. Tyrosine residues react with ROS, as
peroxynitrite to form a stable product nitrotyrosine that reportedly induces
hyperresponsiveness in airways of guinea pigs, inhibits pulmonary surfactant and
damages pulmonary epthilelial cells103. Tyrosine can also be catabolized to fumarate
and acetoacetate80, which are intermediaries of the TCA cycle which may be influenced
by asthma77.
Methionine is involved in several processes such as the biosynthesis of cysteine,
taurine, lecithin, phosphatidylcholine and other phospolipids (Figure 1.15). Methonine
is reported to be elevated in asthmatic sera81. It has been apparently involved in the
DNA methylation phenomena104.
Figure 1.15 – Methionine pathway to cysteine and glutathione105 (AMP- Adenosine monophosphate
SAH- S-adenosyl-homocysteine; SAM- S-adenosyl methionine).
Methionine
SAM
SAH
Homocysteine
Cysteine
Glutathione
Protein synthesis
Methylation of DNA, RNA, Proteins, Catecholamines,Phospholipids, Creatine
Adenosine AMP
Inosine
TranssulfurationPathwayEnzymes

Chapter I - Introduction
24
Asthma also affects the leucine metabolism77. 3-Hydroxy-3-methylglutarate,
which arises from leucine catabolism, is reported to be in higher concentration in
unstable asthmatics when compared to the levels obtained with healthy children. 3-
Hydroxy-3-methylglutarate converts to 3-hydroxy-3-methylglutaryl-CoA and
acetoacetate that can be converted to acetyl-CoA which plays a role, for example, in the
TCA cycle and the urea cycle. This means that 3-hydroxy-3-methylglutarate may have
an indirect role in these cycles influencing the normal outcome in these metabolic
pathways. It has also been shown that 3-hydroxy-3-methylglutarate induces lipid and
protein oxidative damage106.

Chapter I - Introduction
25
1.2 Metabolomics
1.2.1 Concept
Metabolomics is an extensive measurement of the overall compounds in a
biological system. This allows uncovering a wide range of endogenous and exogenous
compounds and has a significant role in investigating physiological status, diagnosing
diseases, pattern discovery for disease characterization and identification of affected
biochemical pathways due to diseases or treatment. These small compounds play a
significant part in the biological systems and are candidates to understand disease
phenotypes107.
These compounds are downstream products of numerous biochemical processes
and can be a sensitive measure of an organism’s environment-gene interactions, in the
identification of disease biomarkers and drug discovery108. The metabolome is
complementary to transcriptomics and proteomics, nevertheless it has advantages since
it reflects more closely the activities of the cells at a functional level, and the changes it
reflects are expected to be amplified relative to the changes in the transcriptome and
proteome109 (Figure 1.16).
Figure 1.16 – The interactions between the different omics fields110.
The environmental, developmental stimuli and/or genetic mutation can lead to
alterations in cells, biofluids or even cell media. With these changes, the amount of the
intermediate pathway metabolites and/or even the terminal metabolites may vary. The
metabolites typically range from pmol to mmol and all compounds, if possible, should

Chapter I - Introduction
26
be analyzed in a single analysis. Nevertheless this is unlikely to occur due to
technological issues and a holistic approach is employed111. This approach, instead of
identifying and quantifying each compound of the biological fluid, treats the obtained
spectra as a unique classifiable metabolic fingerprint. With the use of an array of
statistical tools, the spectral profiles of blood, tissue, urine or exhaled breath are
classified in specific categories, conditions or disease states. All compounds are looked
at once and a pattern of compounds may be formed for a determined status of the
biological system understudy112.
Figure 1.17 shows the workflow of the main steps involved in the metabolomic
analysis for this PhD thesis. The experimental metabolomic workflow included the
selection of the biological material to be studied. Direct analysis would be ideally
performed; nevertheless it is an infrequent option. It was followed by sample
preparation and subsequent measurement using the selected analytical chemistry
methods and instrumentation. The raw data obtained was processed and normalized to
yield a data matrix for statistical analysis. The compounds that discriminated the groups
were identified and this information was biochemically interpreted and biological
insights were achieved113.
Figure 1.17 – Metabolomic analysis workflow (adapted from Zhang et al.114).
Control Group
PatientGroup
Data acquisition
Sample Collection
Chemometric Data analysis
MetabolomicInterpretation
Altered Amino Acids Metabolism
Tryptophan Tyrosine Homocysteine
2-hydroxyisobutyrateKynurenine
Altered Energy MetabolismAltered Lipid Metabolism
Acetyl-CoAFatty Acids
Urea Cycle
Creatine
Creatinine
Phosphoenol-Pyruvate
Acetoacetyl-CoA 3-Hydroxybutyrate
Pyruvate
Hydrocarbons
Glucose
Altered TCA Cycle
Citrate
cis-Aconitate
D-Isocitrate
αααα-ketoglutarate
Succinate
Fumarate
Malate
Oxaloacetate
Succinyl-CoA
Leucine
3-hydroxy-3methylglutaryl-CoA
Threonine
Propionyl-CoA
Carnitine
O-Acetylcarnitine
3-hydroxy-3-methylglutarate
Histidine
1-methylhistamine
Formate
Choline
BetaineArginine
Methionine
DNA methylation
Lactate
Phenylalanine

Chapter I - Introduction
27
1.2.2 Analytical techniques in metabolomics: MS or NMR based
methodologies
Several analytical techniques are applied to profile the diverse compounds of a
given biofluid or tissue, which makes metabolomic an interdisciplinary field of science
that may combine analytical chemistry, NMR115, Fourier transform-infrared
spectroscopy (FT-IR)116 and MS coupled to separation techniques, including GC-MS117,
GC×GC-ToFMS118, liquid chromatography-mass spectrometry (LC-MS)119, FT-MS120
and ultra high pressure liquid chromatography-mass spectrometry (UPLC-MS)121 with
sophisticated multivariate data analysis107. For a comprehensive metabolome study the
parallel application of several techniques followed by data integration should be sought
to have a broader perspective and the most complete information.
MS techniques, often coupled with other techniques, is extensively used in
metabolomics offering high selectivity and sensitivity in the identification of several
metabolites that are known end-products of cellular processes. The combination with
chromatographic separation due to compound separation on a time dimension reduces
spectra complexity and offers information on the analytes physicochemical properties.
GC-MS has been widely used for metabolomics and can provide efficient and
reproducible results122. The coupling of powerful separation and detection systems
enables unbiased analysis of thousands of known and unknown compounds that can
provide novel insights into the biological system under study. It is possible to analyze
both volatile and nonvolatile compounds after derivatization. The MS electron
ionization energy of 70 eV yields reproducible mass spectra and highly transferable
electron ionization MS spectral libraries (as the National Institute of Standards and
Technologies library) allowing the identification of compounds match to the spectral
library. Retention indices are another tool useful to confirm compound identification on
compounds that have similar mass spectra but are separated with chromatography.
Although GC-MS provides adequate information for a variety of analytical tasks,
it does not resolve the numerous components present in complex biological samples.
Technological advances led to development of comprehensive two-dimensional gas
chromatography (GC×GC). One dimensional GC in most cases provides adequate
resolution, however does not resolve the numerous components present in biological
samples118. In GC×GC two capillary columns with different stationary phases are

Chapter I - Introduction
28
connected through a modulator and this setup increases separation efficiencies and peak
capacities123. GC×GC has superior resolving power, which is suited for the analysis of
low-molecular weight analytes in complex samples; sensitivity is enhanced due to
solute band re-concentration and provides a two-dimensional chromatogram with
chemically similar compound patterns124. The use of GC×GC coupled with a time of
flight mass spectrometer (ToFMS) has been used in the analysis of the volatile profile
for diabetes biomarker discovery125 or in the analysis of specific compounds, as
reported by Snyder et al.126 for l-β-methylamino-alanine. GC×GC-ToFMS has also been
applied in the metabolic footprinting of tumorigenic and nontumorigenic uroepithelial
cells revealing the advantages that this technique presents and the potentiality that it
demonstrated in the analysis of bladder cancer127. Hartonen et al.128 characterized
cerebrospinal fluid and serum samples using GC×GC which led to distinct metabolomic
profiles mainly identifying sugar and amino acid derivatives.
NMR has been extensively used in providing unbiased information about
compound profiles as it is a straight forward technique, largely automated and non-
destructive. Extensive research has been performed using NMR because this technique
allows analyzing the pattern of compounds in a target matrix instead of all individual
compounds making it a more realist and suitable approach. In addition, it permits the
identification of primary and secondary compounds. In the NMR spectrum the signals
are proportional to their molar concentration which makes the direct comparison
possible, without the need to construct calibration curves for each compound.
Nevertheless, the NMR application has a major drawback, the low sensitivity. Another
limitation is the considerable signal overlap in the NMR spectra as it has hundreds of
overlapping signals that may amper signal identification and accurate peak
integration129. Nevertheless, several studies have been performed using NMR in a wide
range of pathologies and have been extensively reviewed such as in HIV-infected
biofluids130, cancer131, neurological diseases132, cardiac133, paediatric respiratory
diseases and bronchiolitis134, among others.

Chapter I - Introduction
29
1.2.3 Metabolomics in asthma
Asthma is complex with several biochemical pathways affected. Additionally,
this complexity translates to the clinical practice. Therapy responsiveness is not
identical for each patient or even consistent in individual patients over time. There is
considerable variability when it comes to asthma control that can be related to known
asthma triggers (for example, allergen exposure) or unknown triggers. Nevertheless, a
non-controlled status asthmaticus is associated to increased levels of airway
inflammation and the objective measurement of this phenomenon would be of
significant value in the clinical practice. This knowledge would result in selecting the
right therapy, adjust medication dose, possibly separate asthma phenotypes and offer an
objective classification of asthma. Figure 1.18 summarizes what is available in the
clinical practice and under development.
Figure 1.18 – Asthma biomarkers overview: present and future?135 (ECP- Eosinophil Cationic
Protein; FeNO- Fractional exhaled nitric oxide; uLTE- Urinary Leukotriene;)

Chapter I - Introduction
30
As previously verified, asthma diagnosis and management is based on asthma
symptoms combined with lung function tests and normally these do not reflect
accurately airway inflammation136. Bronchoscopy and bronchoalveolar lavage (BAL)
are the used tests to assess airway inflammation, but are generally too invasive. With
this in mind, it is necessary to find asthma biomarkers or pattern of biomarkers that deal
with the issues of identifying clinical asthma phenotypes, optimize diagnosis, guide
treatment and eventually enlighten the biochemical pathways that are affected by
asthma.
Exhaled breath
Exhaled breath is a rich source of information from a molecular point-of-view
due the thousands compounds that are comprised in this biofluid. Over the past years
exhaled breath has emerged as a new endpoint yielding useful biomarkers. The
composition of exhaled breath has been correlated to several disease statuses. Exhaled
breath has been extensively studied for the cancer (lung, breast, colorectal), asthma,
cystic fibrosis, chronic pulmonary disease, interstitial lung diseases, among others. The
identified compounds in exhaled breath have been classified as inorganic compounds
(carbon dioxide, oxygen and nitric oxide), non-volatile compounds (isoprostanes,
leukotrienes) and VOCs (hydrocarbons, aldehydes, ketones, sulphur compounds,
alcohols)137.
Thomas et al.138 reviewed the potential of exhaled breath condensate (EBC) in
the diagnosis and evaluation of the inflammation of asthmatic children. Several markers
are reported such as pH, nitric oxide products, glutathione and aldehydes, hydrogen
peroxide, eicosanoids, leukotrienes and cytokines. EBC is obtained by cooling using a
collection device, which allows collecting different respiratory particles, droplets and
water vapor.
Murata et al.139, using a cohort of 29 asthmatics and 33 healthy individuals,
showed that pH had lower levels in the asthma group and that the hydrogen peroxide
values were elevated. Nevertheless, it was also found out that these values did not
correlate with the asthma control test scores, the fractional exhaled nitric oxide (FeNo)
or even with the pulmonary function. Similarly to NO, a single marker is unlikely to
reflect various pathologies present in a heterogeneous disease such as asthma and
additional markers of airway inflammation would be necessary.

Chapter I - Introduction
31
EBC is also composed by other compounds that may be helpful asthma markers
such as leukotrienes and isoprostanes that are considered inflammation biomarkers.
Balanzá140 has shown that LTB4, as well as, 8-isoprostane concentrations were
increased in asthmatic children when compared with healthy individuals and were able
to differentiate two degrees of asthma severity. EBC methodologies remain
controversial due to standardization issues and a high intra-individual variability141.
The measurement of VOCs in exhaled breath is a metabolomic approach to
study molecular signatures of respiratory disease as it contains a complex mixture of
potentially thousands of VOCs. These compounds derive from the metabolic processes
in the airways and the presence and/or concentration of the different compounds may be
influenced by airway inflammation. It is the least invasive method to obtain information
about airway inflammation and oxidative stress (Figure 1.19).
Figure 1.19 – Representation of non-invasive to invasive sampling techniques142.
To determine the VOCs, two different methods can be applied: the use of a
polymer-based gas sensor array (electronic nose) or GC-MS. The electronic nose
represents a total expired VOC profile in which individual compounds cannot be
identified and mimics the human nose. Dragonieri et al.143 has shown that an electronic
nose has the ability to differentiate asthma patients from controls; however
distinguishing different asthma severity degrees was not possible.
The use of GC-MS or any related techniques is considered the gold standard in volatile
analysis and the use of these techniques have been applied in analysis of exhaled breath
in asthma populations. Recently, the reports of VOCs in asthma have increased and an

Chapter I - Introduction
32
example is the study made by Gahleitner et al.144 attaining discrimination between
asthmatic and healthy children using a panel of 8 compounds, namely 1-
(methylsulfanyl)propane, ethylbenzene, 1,4-dichlorobenzene, 4-isopropenyl-1-
methylcyclohexene, 2-octenal, octadecyne, 1-isopropyl-3-methylbenzene and 1,7-
dimethylnaphtalene. Robroeks et al.145 using a pattern of 6 volatile compounds (p-
xylene, 3-methylpentane, 2-ethyl-4-methyl-1-pentanol, an unknown compound, 1-
phenyl-1-butene and 4,6,9-nonadecatriene) were able to predict exacerbations of
childhood asthma. Ibrahim et al.146 built a model using 15 compounds (2,6,10-
trimethyldodecane, 2,6,11-trimethyldodecane, benzyl alcohol, 3,4-dihydrobenzonitrile,
2-methyldecane, 1-methyl-4-(1-methylethylidene)cyclohexene, 2,2,-dimethyl-3-oxo
butanoic acid ethyl ester, 4-nitroso ethylester benzoic acid, 2-butylcyclohexanol, 5,5-
dibutylnonane, 4-ethenyl-1,2-dimethylbenzene, 2,6-bis(1,1-dimethylethyl)-2,5-
cyclohexadiene, 2-butanone, pentadecanal and allyl methyl sulphide) with an accuracy
of 86% and were able to classify clinically relevant disease phenotypes. Dallinga et
al.147 developed a diagnostic tool for asthmatic children with a 92% classification rate
and relatively high specificity (95%) and sensitivity (89%) with a total of ten
compounds (two branched hydrocarbons (C13H28), carbon disulphide, 1-penten-2-one,
butanoic acid, 3-(1-methylethyl)-benzene, an unsaturated hydrocarbon, (C15H26),
benzoic acid, p-xylene, and a branched hydrocarbon (C11H24)).
Urine
Urine is non-invasive, accessible, “informative”, stable body fluid. Bouatra et
al.108 have compiled the information on the studies that have been performed to identify
asthma biomarkers using urine as biofluid/matrix. The premise relies in the fact that
asthma affects the body as a whole and alterations in the metabolism may be reflected in
urine.
Cysteinyl leukotrienes (CLTs) are major eicosanoids products released from
various cells including eosinophils, neutrophils and mast cells. CLT4 and D4 are quickly
catabolized to LTE4 and this compound appears in urine providing an indication of LTs
production135. Misso et al.148 measured LTE4 in urine showing that there was no
statistical difference between the asthmatics and the controls and it varied widely both
in the control group, as well as, in the asthmatics. More recently, Balgoma et al. 149
developed a method using LC-MS/MS to quantify eicosanoid compounds in urine of

Chapter I - Introduction
33
atopic asthmatics and discovered increases in compounds of prostaglandin D2, CLTs
and isoprostanes after allergen provocation.
A study performed by Saude et al.77 using urine of stable and unstable asthmatic
patients/healthy children and 70 compounds were measured. Multivariate tools were
used in the discrimination of the tree groups with high classification rates. The obtained
results allowed extrapolating some biochemical pathways affected by asthma.
Mattarucchi et al.150 characterized urine of asthmatic and healthy groups by LC-MS
attaining discrimination between both groups and identified compounds that are
supposedly correlated with inflammatory diseases.

Chapter I - Introduction
34
1.3 Biofluid Analysis: breath and urine
1.3.1 Methodological aspects of sampling procedures
Several reports have been made with highly promising results using exhaled
breath and urine with an assortment of compounds characterizing asthma. Nevertheless,
the regular use of these discoveries have not been introduced in the clinical practice due
to technical obstacles such as a sampling, preconcentration and analysis, as well as,
methodological issues such as normalization and data expression151. A brief discussion
will be made addressing the studied matrices, exhaled breath and urine.
Exhaled breath
Exhaled breath is largely composed by nitrogen, oxygen, carbon dioxide, water
vapor and inert gases. Several hundred volatile compounds of exogenous and
endogenous sources comprise a small portion of exhaled breath. Exhaled breath
potential to determine normal or abnormal physiology has been used for centuries
beginning with Hippocrates. Subjective impressions of exhaled breath odor has been
used to distinguish uncontrolled diabetes, liver, renal or dental diseases152. In the
1970’s, Linus Pauling showed that exhaled breath was a complex gas containing more
than 200 VOCs153. Since then, the identification and quantification of compounds in
exhaled breath has been gained interest.
The collection of exhaled breath is one of the most important steps in breath
analysis (Figure 1.20) and can be made in one of two ways:
• Mixed expiratory sampling
• Alveolar sampling
Mixed expiratory sampling is an easy and commonly used sampling method as it
only requires spontaneously breathing by the subjects to a collection system and
requires no additional sampling equipment. In this sampling procedure total breath,
which included dead space air, is collected and a disadvantage can arise and be
attributed to inaccuracy as the sample is diluted by dead space air. In order to
circumvent this disadvantage, a breath capture system can be used, and adding a
capnograph to the system only alveolar breath can be sampled.
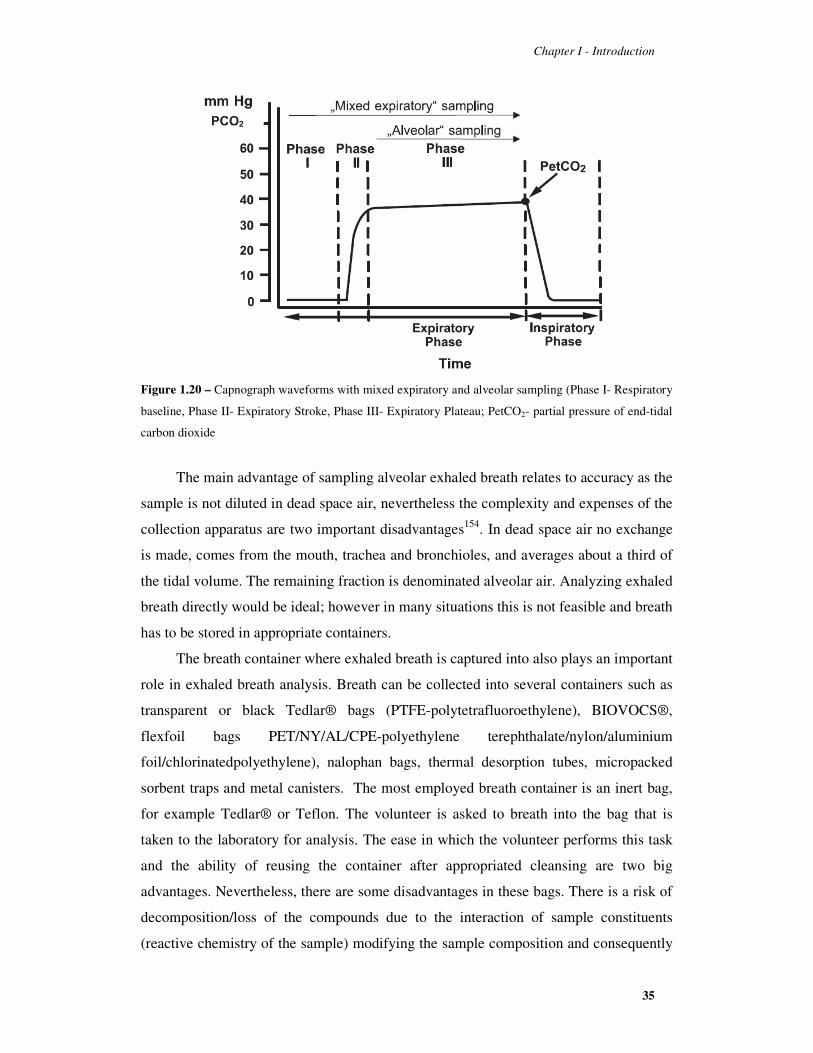
Chapter I - Introduction
35
Figure 1.20 – Capnograph waveforms with mixed expiratory and alveolar sampling (Phase I- Respiratory
baseline, Phase II- Expiratory Stroke, Phase III- Expiratory Plateau; PetCO2- partial pressure of end-tidal
carbon dioxide
The main advantage of sampling alveolar exhaled breath relates to accuracy as the
sample is not diluted in dead space air, nevertheless the complexity and expenses of the
collection apparatus are two important disadvantages154. In dead space air no exchange
is made, comes from the mouth, trachea and bronchioles, and averages about a third of
the tidal volume. The remaining fraction is denominated alveolar air. Analyzing exhaled
breath directly would be ideal; however in many situations this is not feasible and breath
has to be stored in appropriate containers.
The breath container where exhaled breath is captured into also plays an important
role in exhaled breath analysis. Breath can be collected into several containers such as
transparent or black Tedlar® bags (PTFE-polytetrafluoroethylene), BIOVOCS®,
flexfoil bags PET/NY/AL/CPE-polyethylene terephthalate/nylon/aluminium
foil/chlorinatedpolyethylene), nalophan bags, thermal desorption tubes, micropacked
sorbent traps and metal canisters. The most employed breath container is an inert bag,
for example Tedlar® or Teflon. The volunteer is asked to breath into the bag that is
taken to the laboratory for analysis. The ease in which the volunteer performs this task
and the ability of reusing the container after appropriated cleansing are two big
advantages. Nevertheless, there are some disadvantages in these bags. There is a risk of
decomposition/loss of the compounds due to the interaction of sample constituents
(reactive chemistry of the sample) modifying the sample composition and consequently
Chapter I - Introduction
36
altering the outcome. Storage is also an important parameter in breath analysis as most
chemical compounds found in breath are highly reactive and perishable. This
disadvantage can be overcome by experimentally determine the most adequate bag
158,155 or determine how long exhaled breath can be maintained in the container without
any significant loss156. The use of pre-concentration methods can be applied, as for
example sorbent traps or solid-phase microextraction (SPME) which can diminish the
decomposition issues. Stability assays have been performed to determine the
compounds stability in the polymer bags157,158. Condensation also presents as a problem,
namely in water-soluble compounds. It has been shown that there are differences
between dry and wet samples by 10% and this number has risen up to 40% in heavier
compounds. The volume of breath in the Tedlar® bag is also a parameter of interest as
it has been shown that smaller volumes may affect the stability of the sample due to
permeation problems. The actual recommendation by Mochalski and co-authors158 is to
store breath for a maximum of 6 hours filling the maximum volume of the Tedlar®
bag159.
Another issue with polymer bags is related with the possible chemical
contamination from the bag itself. Appropriate cleaning procedures must be adopted to
circumvent these issues. Tedlar® bags often release N,N-dimethylacetamide and
phenol, septa may release compounds such as carbon disulfide or 3-methylpentane and
plasticizers from tubings and/or valves may contaminate breath samples. Another
approach is to collect breath directly to a trapping system avoiding the use of containers
or even into glass vials or metal canisters, nevertheless this adds complexity to the
design and also increases the expenses.
Another issue that has to be addressed in exhaled breath analysis is the
background contamination and the decision whether the identified compound are
endogenous or exogenous. To overcome this drawback, room air volatile composition
can be determined and taken into account as high concentrations of substances that can
be inspired can impact the concentration of endogenous compounds. Another parameter
that influences the possible outcomes of exhaled breath is the intra-individual variability
that represents a possible issue in breath analysis. The intra-individual variability
represents the variability associated with replicate exhaled breath samples from the
same subject, and it is verified that natural biological intra-individual variability can be
expected, as well as, related to diet or lifestyle changes 160,161.

Chapter I - Introduction
37
Urine
The primary route of removing water-soluble waste products is urination. Urine
is a transparent, amber-colored fluid that contains high amounts of urea, inorganic salts,
creatinine, ammonia, organic acids, various water-soluble toxins and pigmented
products of hemoglobin breakdown. The kidneys also remove excess water, sugars and
numerous other compounds. Currently, urine is analyzed to evaluate urinary glucose,
bilirubin, ketone bodies, nitrates, leukocyte esterase, specific gravity, hemoglobin,
urobilinogen and protein. Other more detailed urine analysis can be used to verify renal
diseases such as bladder, ovarian and kidney diseases.
The use of urine for medical purposes dates back to ancient Egypt and
throughout time the examination of color, cloudiness, smell and even taste was used to
help in the identification of a wide range of diseases. As an important biological fluid,
urine has been subjected to a detailed chemical analysis over the last 100 years and
normal reference values have been documented for more than 100 urine ions and
compounds. In addition to this information, several research groups have studied urine
using a myriad of technologies and more than 3000 metabolites have been identified.108
Urine is biofluid collected in a non-invasive way with great information potential to add
to standardized studies that may be performed. So, there are been several studies that
analyzed this matrix using an assortment of analytical techniques for several
pathologies. In asthma, one can argue that urine is not directly linked to the lung tissue,
yet urine is an integrated biofluid and it can reflect localized and systemic changes;
nevertheless, this also is a disadvantage as this can difficult the determination of the
origin of the metabolic changes. Another concern is the possible alteration of the
compounds excretion by kidney or any liver diseases.
After weighing the advantages and disadvantages of the matrix itself, strategies
have to be employed to minimize variability and remove sample bias. A number of
factors can influence considerably the obtained metabolome and this encompasses
sampling time, diet, age, environment, exercise, among others. Beside these factors,
other parameters may also influence the possible outcome such as collection method,
collected volume, collection time, processing and storage. Harmonizing urine
collection, handling and storage is determinant to yield meaningful discoveries and
outcomes.

Chapter I - Introduction
38
Urine samples can be obtained in a random fashion, in timed sampling and/or 24-
h sampling. The random sampling can take place at any time of the day but does not
take into account the excretion variation and usually a correction is necessary, as for
example the ratio to a compound such as creatinine162. The 24-h sampling is
burdensome but yields a more complete depiction of the excretion. The recovery of the
first morning urine is also frequently used163.
Another methodological issue with urine collection is the type of container used.
The use of a container designed to facilitate the collection, ensure an optimal transport,
free of interfering agents and made of non-absorbing materials is also a factor that has
to be taken into consideration163.The use of high throughput and sensible MS and NMR
based technology requires just a few microliters to milliliters of urine to proceed to a
full metabolomic analysis.
Urine stability during storage is an important consideration so that it provides
valid data and reliable information. The effects of freezing urine have been performed:
at -80ºC immediately or stored at 4ºC for 24-h before being frozen. In general there
were no statistical differences between the metabolic profiles of the samples stored in
the two conditions164. Klein and co-authors studied the stability of selenium compounds
in urine and reached to the conclusion that urine samples can be stored at -80ºC up to 4
weeks without measurable changes165. Urine contains components that precipitate when
cooled in refrigerators and centrifugation is necessary as non-centrifuged samples have
shown different metabolomic profiles163.
Despite the influence that the previous factors that may affect the urine
metabolome outcome, an approach that is common to several groups is to consider that
these possible confounding factors may not be controlled and that the compounds that
allow the discrimination between a group with a determined pathology and the control
groups is sufficient and intra-individual variability is supplanted.
1.3.2 Breath and urine characterization based on solid phase
microextraction combined with gas chromatography analysis
Sample preparation is often a necessary step and the main purpose is to extract
the analytes from complex biological matrices, which removes matrix components that
may interfere with the analysis. In the case of low-level compounds a pre-concentration

Chapter I - Introduction
39
step is necessary to achieve the detection limits of the chosen analytical technique.
Conventional sample preparation techniques, such as liquid-liquid extraction (LLE) and
solid-phase extraction (SPE) (Figure 1.21) are often not feasible as analytes might be
incompletely extracted and losses occur if the extract is concentrated. Solvent can
interfere with analytes during gas chromatography process, for example compounds can
be cut off with solvent delay, and solvent-free preparation techniques are often chosen.
Traditional extraction techniques, such as LLE and SPE, have been extensively used in
the preparation of biological samples. These techniques have some disadvantages,
which include complicated and time-consuming operations, being difficult to automate,
require solvents, usually involving large quantities of sample and usually the sample
amount is limited. These multi-step procedures are prone to analyte losses. Therefore,
the use of sample preparation techniques that can be easily automated, miniaturized,
with a high throughput performance, using little or no solvent and with the possibility to
couple on-line with analytical equipment has been subject of interest in metabolomic
analysis166.
Figure 1.21 – Comparison between liquid-liquid and solid phase extraction167.
Liquid -liquid extraction
Solid -phase extraction
(1) (2) (3)

Chapter I - Introduction
40
SPME is an example used in the analysis of volatile and semi-volatile
compounds in metabolomics168. SPME, an extraction technique, introduced by
Pawliszyn in 1990s169, convenes these characteristics and has been extensively used in
the metabolomics extraction procedures. The first report using SPME as the extraction
technique occurred in 1997 with the analysis of ethanol, isoprene and acetone in healthy
volunteers170 whilst the analysis of urine by SPME was first reported in 1995 in the
analysis of thinner components171. Since then, SPME has been used in urine analysis for
potential cancer biomarkers172,173,174, in the analysis of cell cultures of cancer175, in the
comparison of volatile compounds from melanoma and benign skin176, lung cancer
chemotherapy control by breath profile177, determination of acetone in human breath178,
among many other studies in the investigation of several pathologies. In spite of the
technique simplicity, there are parameters that have to be optimized before analyzing
exhaled breath and/or urine that will be discussed subsequently.
SPME was developed to facilitate sample preparation, reduce solvent use, easy
to operate and to be field compatible. There are several phase geometries: fiber, disk,
thin film, stirrer, suspendend particles and vessel. The most used is the fiber, a modified
syringe that contains a stainless steel microtubing within its syringe needle with a fused-
silica fiber tip with about 1cm coated with an organic polymer. Sampling can be made
by immersion/direct extraction (DI-SPME) or by headspace extraction (HS-SPME). In
DI-SPME the fiber is put directly in the sample whereas in HS-SPME the compounds
are extracted from the gas phase that is in equilibrium with the sample. On HS-SPME,
the fiber has no direct contact with the sample, therefore the matrix effect and
background effect are reduced, increasing the lifetime of the SPME fibers and
increasing the selectivity by extracting volatile and semi-volatile compounds179. In this
PhD thesis, HS-SPME mode was chosen. After the coated fiber is exposed using the
pre-determined SPME conditions it is inserted in the injection port of the
chromatograph to release the analytes, and in GC this is performed resorting to thermal
desorption.
The SPME extraction is non-exhaustive, which means that a small fraction of
compounds are extracted representing the compounds overall composition. In this PhD
thesis, it was decided to select the conditions that promoted greater extraction
efficiency, i.e., a compromise between the number of extracted compounds, an
acceptable chromatographic intensity and time.

Chapter I - Introduction
41
Upon exposure the fiber enters in a mass-transfer process driven by the second
law of thermodynamics and the amount of analyte sorbed are expressed by:
n =C� × V� × V� × K
K × V� + V�
Where C0 is the initial concentration of analyte, Vf is the fiber volume, Vs is
sample volume (or headspace) and K is equal to Kf� × K�� (Kfh is the partition
coefficient between the fiber coating and headspace and Khs the partition coefficient
between the headspace and the sample).
The aforementioned SPME parameters namely fiber coating, temperature and
extraction time, stirring effect, salt addition, sample pH among others, are usually
experimentally optimized.
There are several commercially available SPME coating fibers with different
polarities, film thicknesses and with different type of interaction with the compounds.
There are liquid and solid coatings and the performance is quite different. Initially,
extraction begins by analyte adsorption at the extraction phase-matrix interface followed
by analyte diffusion into the bulk of the extraction-phase. If the diffusion coeficient of
the analytes is high, absorption occurs with the analytes fully partitioning between the
two phases. However if the diffusion coeficient is low, the analyte remains in the
interface and adsorption occurs.The fibre coatings consist of one, two or three polymers.
The fibers with two or three polymers have a synergetic effect of adsorption and
absorption. When compared to the fibers with one polymer, a higher retention capacity
and a higher sensitivity are achieved. Some examples are shown in Table 1.6.
Table 1.6 – Commercially available SPME coatings
Coating type Film thickness (µµµµm) Polarity
Polydimethylsiloxane (PDMS) 7
Nonpolar 30
100
Polyacrylate (PA) 85 Polar
Polydimethylsiloxane/ divinylbenzene (PDMS/DVB) 65 Polar
Carbowax/divinylbenzene (CW/DBV) 65 Polar
Carboxen / polydimethylsiloxane(Car/PDMS) 85 Bipolar
Divinylbenzene/carboxen/polydimethylsiloxane (DVB/CAR/PDMS) 55/30 Bipolar
Temperature has a significant effect on the kinetics of the SPME process as it
determines the vapour pressure of the analytes above the condensed phase, as well as,
the compounds solubility on liquid samples. The increase of temperature results in an

Chapter I - Introduction
42
increase of the analyte’s Henry’s constant, an increase in the the diffusion coefficient,
and a decrease in the extracted amount at equilibrium (as the distribution constant
decreases with temperature increase) 180. Consequently, increasing temperature will lead
to the improvement of the extraction time. Nevertheless, a compromisse has to be
achieved as elevated sampling temperatures decrease the fibre/sample partition
coefficients leading to the decrease of the amount extracted in equilibrium.
Another highly important parameter is the extraction time. Theoretically, if the
period of time is long enough a concentration equilibirum can be reached between the
extraction phase and the matrix and exposing the fiber longer will not result in the
accumulation of more analytes. However, in a practical point-of-view the equilibrium
time is defined as the time required to extract 95% of the analyte181. The optimum
extraction time is independent of sample concentration and is a compromisse between
the desired length, sensitivity and repeatability and reaching equilibrium provides the
highest sensitivity. However, equilibrium extraction times tend to be long182. This is
not convenient in laboratory assays and a compromisse should be reached.
In liquid samples, such as urine, an optimizable parameter is ionic strength.
Adding salt to a sample solution increases the constant Kfs improving sensitivity in
most applications. The analytes mass transport from the aqueous phase to the headspace
is improved and consequently the extraction efficiency is increased. Sodium chloride
with high purity is usually added and this addition changes the properties of the
boundary phase. Also the compound solubility decreases in the aqueous phase, a
process known as salting-out where the water molecules form hydration shperes around
the salt molecules. The water content that dissolve the analytes molecules is reduced
and the compounds pass to the headspace. At the saturation point the compounds may
interact with the salt ions in solution and this reduces the extraction efficiency183.
Agitation can also improve extraction efficiency and increase extraction efficiency. This
is provided by the use of a magnetic stirring bar and the compounds are transported
from the solution to the proximity of the fiber. The effect caused by the depletion zone
that is produced close to the fiber is reduced and the analytes diffusion coefficients is
decreased. pH adjustment can also improve method sensitivity converting analytes that
might be present in the sample into the neutral forms, so it is another parameter that can
be optimized in sample such as urine182.
After the extraction procedure is completed the exhaled breath and urine volatile
and semi-volatile compounds are generally analyzed using gas chromatographic

Chapter I - Introduction
43
techniques. GC-MS is the powerful combination of two analytical tools: gas
chromatography for the gas-phase separation of the components in complex mixtures,
and mass spectrometry that allows the identification of these components. GC-MS was
developed in the 1950’s and it has been considered a highly valuable tool in any
analytical chemistry laboratory184. Since its development the technique had numerous
advances that allowed an in-depth sample characterization. The main advantages of GC-
MS are sensitivity, compound identification, and widely available instrumentation at
relatively low cost (compared to other equipments)185. This analytical technique has
been extensively used in exhaled breath186, 187, 188 and urine analysis189, 190, 191.
Briefly, in GC-MS the components of a mixture are physically separated and
selectively distributed between the mobile phase (which is an inert carrier gas) and a
stationary phase present in inner column wall or as column packing particles.
Nowadays, the majority of used columns are capillary with the stationary phase coated
in the inner wall. The separation occurs due to different distribution coefficients of the
single components of the mixture and the chromatographic process is a result of
repeated sorption and desorption processes as the analytes move through the stationary
phase carried by the inert gas. The GC instrumentation consists of a sample introduction
device, a column housed in a temperature programmable oven, an interface, a mass
spectrometer and a data collecting system. There are several detection systems
available; nevertheless as the quadrupole mass analyzer was used in this study a more
detailed description will be made. The quadrupole is a powerful analyzer for GC-MS
systems as it presents several advantages such as the simplicity, size, reasonable cost
and rapid scanning. This analyzer uses the ions trajectories stability in oscillating
electric fields separating ions according to their m/z ratios. Quadrupole analyzers are
constituted by four rods with circular, or ideally, hyperbolic section having a fixed
direct current (DC) and alternating radio frequency (RF) voltages applied to the ions.
These ions, produced in the source, are focused and passed in the middle of the rods and
the motion depends on the electric fields, so the ions of a particular m/z will be in
resonance and pass through to the detector. The ion motion is directly proportional to
the mass, voltage on the quadrupole and RF. The RF voltages are varied, thus bringing
different m/z ions to the detector forming a mass spectrum. Before entering the
analyzer, the ions go through a potential to give the ions a determined speed to pass
along the center of the quadrupole192.

Chapter I - Introduction
44
As for compound identification, standard injection and mass spectrum inspection
are normally used. In addition, another strategy to improve identification confidence
may employed, as for example retention indices (RI) values. After the injection of an n-
alkane series, usually ranging from C6 to C20, in the same GC column and
chromatographic method the RI values can be calculated using the van den Dool and
Kratz equation193. The obtained values can then be compared with literature values
obtained in equal or similar chromatographic columns used experimentally. The RI
values are relatively independent from individual chromatographic system conditions
such as column length/diameter, film thickness, carrier gas velocity, and pressure. These
values are obtained by normalizing the retention times to an adjacent n-alkane which
makes RI values based on carbon number of the molecule.
Although GC-MS yields significant analytical results, the matrices complex
nature usually requires longer GC runs. It has also been shown that some peaks are
formed by two or more compounds, a process denominated co-elution. For these
reasons, in the last decades, research has been performed to overcome these issues and
increase resolving power. The overall resolving power of 1D GC can be described by
the peak capacity that is the maximum number of peaks that can be place, side by side,
into the available one-dimensional separation space at a given resolution. In 1D GC,
values of peak capacity of 1000 are very difficult to obtain194. A trustworthy option that
has emerged is multidimensional gas chromatography (MDGC), namely GC×GC.
MDGC is a robust and reliable technique that exceeds the separation capacity of
single dimensional chromatography. MDGC incorporates multiple sequential
separations of different mechanisms (for example, different column selectivity) with a
transfer process between dimensions that serve to effectively split individual
retentions195.
GC×GC is reported by Liu and Phillips196 for the first time in 1991. The authors
incorporated a thermal modulator between two columns that traps, focus and injects
small amounts from the first column to the second column. When compared to one
dimensional (1D-GC) the GC×GC presents several advantages:
1. higher peak capacity, the highest number of chromatographic peaks is
significantly enhanced due to the product of the peak capacity of both
dimensions;

Chapter I - Introduction
45
2. signal enhancement due to analyte refocusing followed by fast
chromatography avoiding band broadening and the signal to noise ratio is
improved due to improved analyte separation and;
3. the ability to produce structured chromatograms. The structuration
obtained of the 2D chromatographic space can be highlighted. Due to the
complementary separation mechanisms of the two columns, a spatial
distribution of the analytes occurs in the 2D space according to their
chemical properties allowing the separation in compound classes. This
can be used to reduce analysis time and the identification is more
trustworthy as characteristic patterns are formed in an ordered manner197.
For example, the use of non-polar capillary column in 1D leads to
separation by volatility whilst the use of a polar column in 2D separates
the analytes by polarity.
These advantages makes GC×GC a powerful tool that has been used in different
applications that are not easily solved in 1D GC 198. For this purpose, multidimensional
chromatography is a technology that uses two orthogonal separation mechanisms to
increase resolution power and peak capacity199. The theoretical peak capacity of these
systems is the sum of the peak capacities of the first and second dimensions multiplied
by the number of heart-cuts200.
In GC×GC, two separations based on different separating mechanisms are
applied to originate orthogonality. Orthogonality in GC×GC is created using columns
that provide independent separation mechanisms in the first and second dimension201.
The separation on the GC system is based on two parameters: the analytes volatility and
the interaction with the stationary phase. The use of a non-polar column, where
volatility is the only parameter of interest, and a polar column that will separate the
analytes by specific interactions; but also by volatility is a common column set-up.
Usually, using this set-up a structure chromatogram is obtained and it is possible to
perform group-type identification202. Ryan et al.203 studied separation orthogonality
using different sets of 1D and 2D columns and concluded that if the columns used are
very different the separation on the second dimension is maximized. The in-series
connection is performed through an interface known as the modulator. An example of
the interface is the cryomodulator. This interface cuts small fractions of the eluate from 1D by cryofocusing and re-injecting into the second column. Nevertheless, to maintain

Chapter I - Introduction
46
the 1D separation the interface cuts the fractions so that they are no larger than one
quarter of peak width. Then each individual fraction is refocused and injected in the
second column which is a very fast process when compared to the first column
separation204. Large series of high-speed second-dimension chromatograms are
transformed to form a two-dimensional chromatogram that is usually performed by
laboratory-written program. The visualization can be made in a contour plot (colored or
not) or in a 3D plot202 (Figure 1.22).
Figure 1.22 - GC×GC generation and visualization202.
There are several detectors that can be used in combination with GC×GC, as for
example, the flame ionization detector (FID), electron capture detector or ToFMS. The
detectors used in GC×GC have to be very fast due to the fast separation in the second
dimension that lead to peaks with typical widths between 100-600ms205. In the
developed study, the GC×GC was combined with a ToFMS. ToFMS separation relies in
the mass separation principle with the determination, by time measurement, of ion
mass-to-charge ratio. The ions velocity, attained by homogeneous electrostatic field
acceleration, depends on the mass-to-charge ratio. So ions with the same charge will
possess the same kinetic energy and heavier ions will have lower velocities and lighter
ions will have higher velocities206. ToFMS is ideal in the characterization for fast gas

Chapter I - Introduction
47
chromatographic separation due to two main attributes: high spectral acquisition rates (a
few hundred full-mass-range spectra per second) and spectral continuity across the
chromatographic peak profile for a single-component peak. Spectral continuity means
that for all the points on a chromatographic peak the ion abundance ratios for the
different masses are the same207. Using the ToF spectrometer, even though
concentration changes during peak elution, spectral continuity is not affected. The use
of quadrupole MS or other scanning instruments the analyte concentration changes
which results in skewed spectra that is resolved by averaging spectra across the apex of
the chromatographic peak208.
The use of comprehensive two-dimensional gas chromatography coupled to
mass spectrometry with a high resolution time of flight analyzer (GC×GC–ToFMS) has
brought a significant advantage in research and in analytes identification in several
fields. Over the past years the use of GC×GC–ToFMS in the analysis of exhaled breath
and urine compositions has gained interest in the scientific community. In exhaled
breath it has been used in the detection of breath metabolome demonstrating the added
value of this technique. Much more analytes were identified than in the 1D GC-MS
reports due to the improved separation and increased sensitivity209,210.The GC×GC–
ToFMS was also used in urine analysis in infant urine finding several organic acids that
would not be possible using 1D GC211. Other applications using GC×GC–ToFMS
concerned the bladder cancer metabotyping212 and in the analysis of anabolic agents in
doping control213.
1.3.3 Urine characterization based on proton based nuclear magnetic
ressonance
NMR to analyze biofluids goes back to early 1980s. Actually, NMR is applied in
several areas as disease diagnosis, drug discovery, microbiology, nutrition, toxicology,
plant and environmental sciences. NMR is widely used in metabolomics applications as
this technique is resolute, reproducible, reliable, and the data obtained is easily
quantified and robust. Additionally, NMR requires minimal or even no sample
preparation/separation and is of non-destructive nature. A major advantage in using
NMR to obtain a metabolomic profile in a biological sample is that the acquisition can
take from 1-15 min with acceptable sensitivity to be able to differentiate subtle

Chapter I - Introduction
48
biological differences214. The major drawback is related to the sensitivity level when
compared with MS-base methods
NMR is able to detect a wide range of structurally different compounds in a
single run in the micromole per liter range. The number of compounds in human fluids
are estimated between 2000-3000 and a maximum of about 20 000 compounds. The
smaller compounds, including sugars, amino acids and bioactive products that are
paramount in several metabolic pathways, are of great interest to researchers. Usually
these compounds act as signaling functions at very low concentrations. The complexity
of the urine 1 H NMR spectrum can be observed with several resolved peaks (Figure
1.23).
Figure 1.2
Several 1H NMR urine studies have been performed and have been extensively
reviewed. Bouatra and co-authors
human urine. These authors found out that by NMR several hundred compounds were
reported in a study performed with 22 healthy children up to 209 unique compounds
have been identified and each compound was indisputably
These high-dimensional datasets are attained by bucketing. A bucket is a small slice of
the spectrum and the integral is calculated to obtain a variable for each bucket. This
procedure reduces the total number of variables and c
. The major drawback is related to the sensitivity level when
base methods215.
NMR is able to detect a wide range of structurally different compounds in a
gle run in the micromole per liter range. The number of compounds in human fluids
3000 and a maximum of about 20 000 compounds. The
smaller compounds, including sugars, amino acids and bioactive products that are
eral metabolic pathways, are of great interest to researchers. Usually
these compounds act as signaling functions at very low concentrations. The complexity
H NMR spectrum can be observed with several resolved peaks (Figure
23– Example of a urine 1H NMR spectrum108
H NMR urine studies have been performed and have been extensively
authors108 have built a database of detectable compounds in
human urine. These authors found out that by NMR several hundred compounds were
reported in a study performed with 22 healthy children up to 209 unique compounds
have been identified and each compound was indisputably identified and quantified.
dimensional datasets are attained by bucketing. A bucket is a small slice of
the spectrum and the integral is calculated to obtain a variable for each bucket. This
procedure reduces the total number of variables and compensates the possible
. The major drawback is related to the sensitivity level when
NMR is able to detect a wide range of structurally different compounds in a
gle run in the micromole per liter range. The number of compounds in human fluids
3000 and a maximum of about 20 000 compounds. The
smaller compounds, including sugars, amino acids and bioactive products that are
eral metabolic pathways, are of great interest to researchers. Usually
these compounds act as signaling functions at very low concentrations. The complexity
H NMR spectrum can be observed with several resolved peaks (Figure
H NMR urine studies have been performed and have been extensively
a database of detectable compounds in
human urine. These authors found out that by NMR several hundred compounds were
reported in a study performed with 22 healthy children up to 209 unique compounds
identified and quantified.
dimensional datasets are attained by bucketing. A bucket is a small slice of
the spectrum and the integral is calculated to obtain a variable for each bucket. This
ompensates the possible

Chapter I - Introduction
49
misalignments. Beside inorganic ions and gases, the most abundant constituents in a
healthy individual are urea, creatinine, hippuric acid and citric acid. Other compounds
include branched-chain amino acids, organic acids, N-acetylated amino acids,
hydroxycarboxylic acids, aromatic signals (for example, indoxylsulfate, histidine,
phenylacetylglutamine), sugars, phenylacetate derivatives, among others216.
NMR and metabolomics have been mainly applied in the human disease
diagnosis field. The metabolomic studies using urine have provided important
information on several pathologies such as cancer217,218, inborn errors of metabolism219,
prenatal disorders220, cardiovascular pathologies221, respiratory diseases222, neurological
pathologies223 and kidney pathologies224, among others.

Chapter I - Introduction
50

Chapter I - Introduction
51
1.4 Data pre-processing and multivariate analysis
Multivariate analysis (MVA) plays an exceptionally significant role in
metabolomic analysis. The several compounds found in the studied biofluid, the lack of
reference NMR and MS spectra for all the compounds and the inherent variability in
each sample due to the individuality of the each organism highlights the role of MVA.
The identification of the chemical features that characterize the object of study against
the large background of compounds that define the system, the variations attained by
disturbing the studied system by experimental and environmental factors and even the
fluctuation on data spectra due to instrument instability or sampling variability requires
a robust MVA methodology to verify the trends in the data set. Principal component
analysis (PCA) and partial least squares discriminant analysis (PLS-DA) are tools used
in metabolomics do determine relative differences between two data sets225.
A metabolomic data analysis consists in several steps: pre-processing, pre-
treatment, processing, post-processing, validation and interpretation. Data pre-
processing consists in the obtention of clean data from raw instrumental data.
Deconvolution, peak-picking, target analysis, alignment, phasing, baseline correction
and bucketing are pre-processing tools used in NMR spectra and MS chromatograms
(the last three tools are NMR specific). Pre-treatment involves normalization
procedures, centering or mean-centering, scaling (autoscaling, range or pareto scaling),
transforming the data (using logaritm, square root or box-cox) and examining for
outliers226.
In this PhD thesis, the unsupervised method of PCA and supervised methods of
PLS-DA were employed due to the multivariate nature of the obtained data The basic
principles will be described. Previously the normalization is discussed as it is an
intrinsic part of the adopted MVA for the performed studies.
1.4.1 Data normalization in metabolomics
Metabolomic data needs to be transformed before proceding to MVA as the raw
data varies due to experimental or biological reasons. This situation has to be previously
dealt with so that the intended goals can be accomplished. The experimental verified

Chapter I - Introduction
52
variation can be due to human error (sample preparation and/or extraction), instrument
variation (temperature alteration in the instrument, sample degradation or even loss in
equipment sensibility in the runs), different sets, laboratories and even different
analytical platforms. Another possibility are biological discrepancies, as for example
different biofluid concentrations, which might be mistaken as possible features of
interest. This unwanted variation can be detected as in weight or volume of biological
samples or even cells number, or remains undetected as for instance the aferomentioned
biofluid concentration or other factors that might influence as form/size of cells.
With this in mind, normalization procedures can identifiy and eliminate the
observed and unnoticed factors mentioned taking a central role in metabolomic data
analysis, as MVA results depends on the adopted procedure. These features are
identified and eliminated by the normalization procedure and the selection of the
appropriate method has to take into account a number of factors. Usually normalization
is data and experiment-dependent but should also depend on the goal of the statistical
analysis. This procedure can be performed by using an internal standard or by applying
scaling factors for the samples under study for the complete dataset such as
normalization by average, median, maximum, standard deviation, among others.
In the present work the most classical case of normalization, mean
normalization, was chosen in exhaled breath and urine volatile data. This procedure
consists in dividing each row of a data matrix by its average, thus neutralizing the
influence of any hidden factor. In urine data obtained by 1H NMR three normalization
techniques were tested, namely total area normalization, creatinine227 and probabilistic
normalization quotient (PQN)228. After the appropriate normalization method is
selected, MVA tools are used to develop models and identify biologically revelant
features for future analysis.
1.4.2 Principal component analysis and partial least squares -
discriminant analysis
The most popular tools for MVA in metabolomics are PCA and PLS229.
Essentially these techniques are used to distinguish the classes in highly complex
datasets, although there are other factors that may cause class variability. Generally a
data matrix X, which contains N observation row vectors of K variables each, is the

Chapter I - Introduction
53
most common manner to depict the acquired data. The data matrix X inputed is the
spectral data obtained by MS and/or NMR.
PCA is widely applied in statistical analysis in chemometrics in general. PCA is
a orthogonal linear transformation of the data preserving the variance of the original
data. In metabolomics it is the starting point of MVA being used for exploratory
purposes and to reduce the obtained data230. It may establish intrinsic class-related
patterns or clusters although PCA is an unsupervised method and may enable the
detection of outliers in the data set. PCA is desgined to extract and display the
systematic variation in a data matrix X and the projection of each sample into a plane
(defined by the first two components) makes it possible to visualize all samples231.
Though the unsupervised PCA yields an unbiased dimensionality reduction, only
when the within-group variation is sufficiently less than the between-group variation a
group structure is revealed. As a result supervised MVA tools, such as PLS-DA, are
applied in metabolomic experiments where class membership of each observation is
inputted. Class memberships are usually coded in the matrix to Y component and this
way forced to be orthogonal229. PLS-DA is a powerful tool in the metabolomic data
classification232. The information may be quantitative or qualitative and the information
is used to focus the model plane to capture the Y-related variation in X . PLS focus on
maximizing the variance of the dependent variables explained by the idependent ones
instead of reproducing the empirical covariance matrix233. When the information
provided by Y is qualitative, the method is denominated by PLS-DA to make the
distinction from the quantitative.
1.4.3 Statistical models validation
Validation is a crucial step to guarantee the reliability of any developed
statistical models. For example, the most common method PLS-DA234 overfits models
to data where completely random variables have excellent class separation.
The categorical variable Y indicates class membership, meaning that values of -
1 and 1 represent the healthy and the asthmatics under study, respectively. Nevertheless,
due to the properties of regression models, the prediction is not inevitably the exact
value. The challenges of PLS-DA are classification procedure and precise estimation of
the quality of the obtained models and thereby differences between two classes. To

Chapter I - Introduction
54
verify the quality of the obtained discrimination models several tools have been
developed, among them cross validation235. Regression model validation determines the
if the relationships between the variables, obtained from regression analysis, truly
describes the data. In the present work , an out-of-sample evaluation were considered.
Cross validation is widely applied in chemometrics as the use of this tool is
indispensable to validate data from supervisioned tests such as PLS-DA, and if not
mentioned, it is simply referred as the leave-one-out cross validation (LOO-CV). LOO-
CV is a practical and reliable fashion to test the significance of the developed models.
Briefly, LOO-CV uses one observation for validation purposes whilst the remaining
observations are considered the training data and the process is repeated until each
observation is used once for validation236. LOO-CV has the disadvantage of being
computationally expensive and often causes overfitting, and on average, gave an under-
estimation of the true predictive error237. MCCV first reported by Cook238 and tested for
chemometric purposes by Xu and Liang239, can avoid an unnecessary large model and
therefore decreases the risk of over-fitting for the calibration model. MCCV splits the
data into a learning set or a test set and the model developed on the learning set and the
error evaluated in the test set. The test set estimates are averaged over the learning-
testing random splits and each case only appears in the learning set or the test set, but
not in both240. MCCV substancially reduces the variance of the split-sample error
estimate241. MCCV yields the statistical model classification rate, sensitivity and
specificity. The classification rate indicates the samples correctly identified, the
sensitivity yields the percentage of positives that are correctly identified and specificity
measures the percentage of negatives to be true negatives. Receiver operating
characteristics (ROC) curves plot sensitivity versus (1-specificity). This graphical
illustration gives the proportion of true positives against the false positives. Also, the
values of R2 could be used to assess the the degree of the model to the data in spite not
being a cross validation evaluation. However, if R2 is much higher that Q2 obtained in
MCCV it possibly indicates model overfitting229.

Chapter I - Introduction
55
1.5 Aims and outlines of this PhD thesis
Following several steps, the work developed in this PhD thesis ultimately
intended the development simple methodologies in the analysis of non-invasively
obtained samples for asthma regarding for their clinical applications. The matrices
under study were exhaled breath and urine that are promising biofluids that over the
years have attracted scientific and clinical interest. These matrices are rich sources of
information, obtained in a non-invasive manner and effortlessly. Among several
available analytical techniques, GC-MS, GC×GC-ToFMS and 1H NMR were chosen to
obtain the most complete volatile and non-volatile information. The chosen extraction
methodology for the study of exhaled breath and urine volatile composition was HS-
SPME. This technique has been widely used in research in the clinical context as it
possesses several advantages that make this technique meritorious in the analysis of the
aforementioned matrices. In metabolomics, the use of multivariate tools is essential.
These tools are necessary as the datasets are of multivariate nature due to the
instrumentation availability and the complexity of systems and processes. These tools
allow the extraction of relevant data with several variables using all the variables
simultaneously forming a metabolomic pattern that may characterize the pathology.
In Chapter 1, the state-of-the-art is described, namely asthma definition, the
metabolomic alterations produced, definition of metabolomics and used analytical
techniques and biofluid analysis. The results of this thesis are then presented as follows.
Chapter 2 begins with the optimization of the SPME parameters, as well as, of exhaled
breath sampling parameters with the use of GC-MS. The optimized conditions were
then applied to a set of asthmatic and healthy children and multivariate tools were
applied. A GC×GC–ToFMS method was then developed to confirm and enrich the
previous information using a new cohort of children. To add robustness to the
developed statistical models, an external validation method (MCCV) was applied.
Subsequently, using prediction tools new exhaled breath samples were collected to
verify the possibility to use the developed method in a clinical practice environment.
Case studies were included to appraise the method response versus the clinical status of
the subject under study. In Chapter 3, the analysis of the urine volatile composition was
made using an in-lab developed method. The same strategy was used as in exhaled
breath and multivariate/validation tools were used. To complement this study, the non-
volatile composition was accessed by 1H NMR. This allowed obtaining more

Chapter I - Introduction
56
information on asthma using this matrix, in addition to the development of statistical
models that could be certainly used for future endeavors. Chapter 4 has the general
conclusions of this PhD thesis, as well, recommendations for future research.
Chapter I - Introduction
57
1.6 References (1) National Asthma Education and Prevention Program, Third Expert Panel on the Diagnosis and
Management of Asthma. Expert Panel Report 3: Guidelines for the Diagnosis and Management of Asthma. Bethesda (MD): National Heart, Lung, and Blood Institute (US); 2007 Aug. Section 2, Definition, Pathophysiology and Pathogenesis of Asthma, and Natural History of Asthma. Available from: http://www.ncbi.nlm.nih.gov/books/NBK7223/
(2) Colice G.L., Categorizing Asthma Severity: An Overview of National Guidelines. Clin. Med. Res. (2004) 2: 155-163.
(3) Pollart S.M., Elward K.S., Overview of Changes to Asthma Guidelines: Diagnosis and Screening. Am. Fam. Physician. (2009) 79: 761-767
(4) Kim H.Y., DeKruyff R.H., Umetsu D.T., The many paths to asthma: phenotype shaped by innate and adaptive immunity. Nat. Immunol. (2010) 11: 577-584
(5) Johansson S.G., Lundahl J., Asthma, atopy, and IgE: what is the link? Curr. Allergy Asthma Rep. (2001) 1: 89-90
(6) Boulet L.P., Boulay M.È., Asthma-related comorbidities. Expert. Rev. Respir. Med. (2011) 5: 377-393.
(7) Ferguson G.T., Enright P.L., Buist A.S. Higgins M.W., Office spirometry for lung health assessment in adults: a consensus statement from the National Lung Health Education Program. Chest (2000) 117: 1146–61
(8) Liang B-M., Lam D.C.L., Feng Y-L., Clinical applications of lung function tests: A revisit. Respirology (2012) 17: 611-619
(9) Barreto L.M., Duarte M.A., Moura S.C.D.O, Alexandre B.L., Augusto L.S., Fontes M.J.F., Comparison of measured and predicted values for maximum respiratory pressures in healthy students. Fisioter. Pesqui. (2013) 20: 235-243
(10) Aggarwal A.N., Gupta D., Argawal R., Jindal S.K., Comparison of the Lower Confidence Limit to the Fixed-Percentage Method for Assessing Airway Obstruction in Routine Clinical Practice. Resp. Care (2011) 56: 1778-1784
(11) Kharitonov S.A., Yates D., Robbins R.A., Logan-Sinclair R., Shinebourne E.A., Barnes P.J., Increased nitric oxide in exhaled air of asthmatic patients. Lancet (1994) 343: 133–135
(12) Huynh N.N., Chin-Dusting J., Amino acids, arginase and nitric oxide in vascular health. Clin. Exp. Pharmacol. Physiol. (2006) 33: 1-8
(13) Zinelli C., Caffarelli C., Strid J., Jaffe A., Atherton D.J., Measurement of nitric oxide and 8-isoprostane in exhaled breath of children with atopic eczema. Clin. Exp. Dermatol. (2009) 34: 607–612.
(14) Hastie A.T., Moore W.C., Li H., Rector B.M., Ortega V.E., Pascual R.M., Peters S.P., Meyers D.A., Bleecker E.R.; National Heart, Lung, and Blood Institute's Severe Asthma Research Program. Biomarker surrogates do not accurately predict sputum eosinophil and neutrophil percentages in asthmatic subjects. J. Allergy Clin. Immunol. (2013) 132: 72-80.
(15) Peirsman E.J., Carvelli T.J., Hage P.Y., Hanssens L.S., Pattyn L., Raes M.M., Sauer K.A., Vermeulen F., Desager K.N., Exhaled nitric oxide in childhood allergic asthma management a randomised controlled trial. Pediatr. Pulmonol. (2014) 49: 624-631.
(16) http://healthierchoices.ca/TestsAndProcedures_details.aspx?TP_id=2&Type=2 (reviewed in 09/11/2014)
(17) Heinzerling L., Mari A., Bergmann K.C., Bresciani M., Burbach G., Darsow U., Durham S., Fokkens W., Gjomarkaj M., Haahtela T., Bom A.T., Wöhrl S., Maibach H., Lockey R., The skin prick test - European standards. Clin. Transl. Allergy. (2013) 1: 3-13
(18) Paggiaro P.L., Chanez P., Holz O., Ind P.W., Djukanović R., Maestrelli P., Sterk P.J., Sputum induction. Eur Respir J Suppl. (2002) 37: S3-S8
(19) Snell N., Newbold P., The clinical utility of biomarkers in asthma and COPD. Curr. Opin. Pharmacol. (2008) 8: 222-235.
(20) Cox L., Williams B., Sicherer S., Oppenheimer J., Sher L., Hamilton R., Golden D.; American College of Allergy, Asthma and Immunology Test Task Force; American Academy of Allergy, Asthma and Immunology Specific IgE Test Task Force. Pearls and pitfalls of allergy diagnostic testing: report from the American College of Allergy, Asthma and Immunology/American Academy of Allergy, Asthma and Immunology Specific IgE Test Task Force. Ann. Allergy Asthma Immunol. (2008) 101: 580-92.
(21) Global Strategy for Asthma Management and Prevention. Global Initiative for Asthma (GINA), 2006. Available from www.ginasthma.org Date last updated, 2012

Chapter I - Introduction
58
(22) Samolinski B., Fronczak A., Kuna P., Akdis C.A., Anto J.M., Bialoszewski A.Z., Burney P.G., Bush
A., Czupryniak A., Dahl R., Flood B., Galea G., Jutel M., Kowalski M.L., Palknone S., Papadopoulos N., Raciborski F., Sienkiewicz D., Tomaszewska A., Von Mutius E., Willman D., Wtodarczyk A., Yusuf O., Zuberbier T., Bousquet J., Prevention and control of childhood asthma and allergy in the EU from the public health point of view: Polish Presidency of the European Union, Eur. J. All.Clin. Immun. (2012) 67: 726-731
(23) European Respiratory Society and the European Lung Foundation. European lung white book. Brussels, Belgium: European Respiratory Society and the European Lung Foundation, 2003.
(24) http://www.chemicalshealthmonitor.org/spip.php?rubrique8 (reviewed in 11/12/2013) (25) European Lung white book, Chapter 11 Childhood Asthma, European Respiratory Society (2013) (26) Barnes P.J., Jonsson B., Klim J.B., The costs of asthma, Eur. Respir. J. (1996) 9: 636-642. (27) http://www.chemicalshealthmonitor.org/spip.php?rubrique8 (reviewed in 11/12/2014) (28) Rothman K.J., Epidemiology: An introduction (2012), Second Edition, Oxford University Press,
New York, New York, USA (29) Chang C., Asthma in children and adolescents: a comprehensive approach to diagnosis and
management. Clin. Rev. Allergy Immunol. (2012) 43: 98-137 (30) Bousquet J., Bousquet P.J., Godard P., Daures J.P., The public health implications of asthma Bulletin
of the World Health Organization, (2004) 83: 548-554 (31) From the Global Strategy for Asthma Management and Prevention, Global Initiative for Asthma
(GINA) 2011. Available from: http://www.ginasthma.org/. (32) Masoli M., Fabian D., Holt S., Beasley R.; Global Initiative for Asthma (GINA) Program. The global
burden of asthma: executive summary of the GINA Dissemination Committee report. Allergy (2004) 59: 469-478.
(33) Braman S.S., The global burden of asthma, Chest 2006, 130: S4-S12. (34) Sa-Sousa A., Morais-Almeida M., Azevedo L.F., Carvalho R., Jacinto T., Todo-Bom A., Loureiro
C., Bugalho-Almeida A., Bousquet J., Fonseca J.A., Prevalence of asthma in Portugal – The Portuguese National Asthma Survey. Clin. Transl. Allergy. 2 (2012) 2:15
(35) International Study of Asthma and Allergies in Childhood (ISAAC): Worldwide variations in the prevalence of asthma symptoms: the International Study of Asthma and Allergies in Childhood (ISAAC). Eur. Respir. J. 1998, 12: 315-35
(36) British Thoracic Society Scottish Intercollegiate Guidelines Network, British Guideline on the Management of Asthma, Thorax (2008) 63: Suppl 4: iv1-121
(37) Barnes P.J., Corticosteroid effects on cell signalling, Eur. Respir. J., (2006) 27: 413-416 (38) Berger W.E., New approaches to managing asthma: a US perspective, Ther. Clin. Risk. Manag.
(2008) 4: 363-379 (39) Barnes P.J., Scientific rationale for inhaled combination therapy with long-acting β2-agonists and
corticosteroids, Eur Respir. J. (2002) 19: 182-191. (40) Lougheed M.D., Lemière C., Dell S.D., Ducharme F.M., FitzGerald J.M, Leigh R., Licskai C., Rowe
R.H., Bowie D., Becker A., Boulet L.H., Canadian Thoracic Society Asthma Management Continuum – 2010 Consensus Summary for children six years of age and over, and adults. Can. Respir. J. (2010) 17: 15-24.
(41) Lin S.Y., Erekosima N., Suarez-Cuervo C., Ramanathan M., Kim J.M., Ward D., Chelladurai Y., Segal J. B., Allergen-Specific Immunotherapy for the Treatment of Allergic Rhinoconjunctivitis and/or Asthma: Comparative Effectiveness Review. Agency for Healthcare Research and Quality (US) (2013) Available from: http://www.ncbi.nlm.nih.gov/books/NBK133240/ (42) Focke M., Swoboda I., Marth K., Valenta R., Developments in allergen-specific immunotherapy:
from allergen extracts to allergy vaccines bypassing allergen-specific immunoglobulin E and T cell reactivity. Clin. Exp. Allergy (2010) 40: 385-97.
(43) Kopp M.V., Omalizumab: Anti-IgE therapy in allergy. Curr. Allergy Asthma Rep. (2011) 11: 101-106
(44) Taher Y.A., Henricks P.A., van Oosterhout A.J. Allergen-specific subcutaneous immunotherapy in allergic asthma: immunologic mechanisms and improvement. Libyan J. Med. (2010) 5: 5303
(45) Hercus T.R., Thomas D., Guthridge M.A., Ekert P.G., King-Scott J., Parker M.W., Lopez A.F., The granulocyte-macrophage colony-stimulating factor receptor: linking its structure to cell signaling and its role in disease. Blood (2009) 114: 1289-1298.
(46) Jönsson F., Daëron M., Mast cells and company. Front. Immunol. (2012) 20: 3-16. (47) Hu Z.Q., Zhao W.H., Shimamura T., Regulation of mast cell development by inflammatory factors.
Curr. Med. Chem. (2007) 14:3044-3050.

Chapter I - Introduction
59
(48) Advances in Combination Therapy for Asthma and COPD, (2012) Jan Lötvall, Wiley-Blackwell,
John Wiley & Sons, Ltd , Hoboken , USA (49) van Ree R., Hummelshøj L., Plantinga M., Poulsen L.K., Swindle E. Allergic sensitization: host-
immune factors. Clin. Transl. Allergy. (2014) 4: 12-21. (50) Sahiner U.M., Birben E., Erzurum S., Sackesen C., Kalayci O., Oxidative Stress in Asthma. World
Allergy Organ. J. (2011) 4:151-158. (51) Cho Y.S., Moon H-B., The Role of Oxidative Stress in the Pathogenesis of Asthma. Allergy Asthma
Immunol. Res. (2010) 2: 183-187 (52) Admako D.J., Skyes B.D., Howe B.H., The metabolomics of asthma: novel diagnostic potential.
Chest (2012) 141: 1295-1302 (53) Ho W.E., Xu Y.J., Xu F., Cheng C., Peh H.Y., Tannenbaum S.R., Wong W.S., Ong C.N.,
Metabolomics reveals altered metabolic pathways in experimental asthma. Am. J. Respir. Cell. Mol. Biol. (2013) 48:204-211.
(54) Borza C., Muntean D., Dehelean C., Săvoiu G., Şerban C., Simu G., Andoni M., Butur M., Drăgan S. (2013)., Prof. Rodrigo Valenzuela Baez (Ed.), ISBN: 978-953-51-0944-0, InTech, DOI: 10.5772/51627. Available from: http://www.intechopen.com/books/lipid-metabolism/oxidative-stress-and-lipid-peroxidation-a-lipid-metabolism-dysfunction.
(55) Halliwell B., Chirico S., Lipid peroxidation: its mechanism, measurement, and significance. Am. J. Clin. Nutr. (1993) 57: S715-S724.
(56) Storey K.B., Functional Metabolism: Regulation and Adaptation (2004), John Wiley and Sons Inc., New Jersey, USA.
(57) Shils M.E., Shike M., Modern Nutrition in Health and Disease (2006), Lippincott Williams & Wilkins, Philadelphia, USA,.
(58) Maes T., Provoost S., Lanckacker E.A., Cataldo D.D., Vanoirbeek J.A., Nemery B., Tournoy K.G., Joos G.F., Mouse models to unravel the role of inhaled pollutants on allergic sensitization and airway inflammation. Respir. Res. (2010) 11: 7-38
(59) Lobo V., Patil A., Phatak A., Chandra N., Free radicals, antioxidants and functional foods: Impact on human health. Pharmacogn. Rev. (2010) 4: 118-126
(60) Cottrell L., Neal W.A., Ice C., Perez M.K., Piedimonte G., Metabolic abnormalities in children with asthma. Am. J. Respir. Crit. Care Med., (2011) 183: 441-448.
(61) Zuo L., Otenbaker N.P., Rose B.A., Salisbury K.S., Molecular mechanisms of reactive oxygen species-related pulmonary inflammation and asthma. Molec. Immun. (2013) 56: 57-63
(62) Montuschi P., Corradi M., Ciabattoni G., Nightingale J., Kharitonov S.A., Barnes P.J., Increased 8-isoprostane, a marker of oxidative stress, in exhaled condensate of asthma patients. Am. J. Respir. Crit. Care Med. (1999) 160: 216-220.
(63) Wedes S.H., Khatri S.B., Zhang R., Wu W., Comhair S.A., Wenzel S., Teague W.G., Israel E., Erzurum S.C., Hazen S.L. Noninvasive markers of airway inflammation in asthma. Clin. Transl. Sci. (2009) 2: 112–117.
(64) van Dalen C.J., Winterbourn C.C., Kettle A.J., Mechanism of nitrite oxidation by eosinophil peroxidase: implications for oxidant production and nitration by eosinophils. Biochem. J. (2006) 394: 707-713.
(65) Pacher P., Beckman J.S., Liaduet L., Nitric Oxide and Peroxynitrite in Health and Disease. Physiol. Rev. (2007) 87: 315-424.
(66) Wu W., Samoszuk M.K., Comhair S.A., Thomassen M.J., Farver C.F., Dweik R.A., Kavuru M.S., Erzurum S.C., Hazen S.L. Eosinophils generate brominating oxidants in allergen induced asthma. J. Clin. Invest. (2000) 105: 1455–1463.
(67) Negre-Salvayre A., Coatrieux C., Ingueneau C., Salvayre R., Advanced lipid peroxidation end products in oxidative damage to proteins. Potential role in diseases and therapeutic prospects for the inhibitors. Br. J. Pharmacol. (2008) 153: 6-20
(68) Boots A.W., van Berkel J.J., Dallinga J.W., Smolinska A., Wouters E.F., van Schooten F.J., The versatile use of exhaled volatile organic compounds in human health and disease. J. Breath Res. (2012) 6: 027108.
(69) Dallinga J.W., Robroeks C.M., van Berkel J.J., Moonen E.J., Godschalk R.W., Jöbsis Q., Dompeling E., Wouters E.F., van Schooten F.J., Volatile organic compounds in exhaled breath as a diagnostic tool for asthma in children. Clin. Exp. Allergy (2010) 40: 68-76
(70) Ibrahim B., Basanta M., Cadden P., Singh D., Douce D., Woodcock A., Fowler S.J., Non-invasive phenotyping using exhaled volatile organic compounds in asthma, Thorax (2011) 66: 804-809
(71) Ligor M., Ligor T., Bajtarevic A., Ager C., Pienz M., Klieber M., Denz H., Fiegl M., Hilbe W., Weiss W., Lukas P., Jamnig H., Hackl M., Buszewski B., Miekisch W., Schubert J., Amann A.,

Chapter I - Introduction
60
Determination of volatile organic compounds appearing in exhaled breath of lung cancer patients by solid phase microextraction and gas chromatography mass spectrometry. Clin. Chem. Lab. Med. (2009) 47: 550–560.
(72) http://www.whfoods.com/genpage.php?dbid=19&tname=faq (reviewed on 18/09/2014) (73) Barker G.F., Manzo N.D., Cotich K.L., Shone R.K., Waxman A.B., DNA Damage 2008) 153: 6-20 (73) Boots A.W., van Berkel J.J., Dallinga J.W., Smolinska A., Wouters E.F., van Schooten F.J., The
versatile use of exhaled volatile organic compounds in human health and disease. J. Breath Res. (2012) 6: 027108.
(73) Dallinga J.W., Robroeks C.M., van Berkel J.J., Moonen E.J., Godschalk R.W., Jöbsis Q., Dompeling E., Wouters E.F., van Schooten F.J., Volatile organic compounds in exhaled breath as a diagnostic tool for asthma in children. Clin. Exp. Allergy (2010) 40: 68-76
(73) Ibrahim B., Basanta M., Cadden P., Singh D., Douce D., Woodcock A., Fowler S.J., Non-invasive phenotyping using exhaled volatile organic compounds in asthma, Thorax (2011) 66: 804-809
(73) Ligor M., Ligor T., Bajtarevic A., Ager C., Pienz M., Klieber M., Denz H., Fiegl M., Hilbe W., Weiss W., Lukas P., Jamnig H., Hackl M., Buszewski B., Miekisch W., Schubert J., Amann A., Determination of volatile organic compounds appearing in exhaled breath of lung cancer patients by solid phase microextraction and gas chromatography mass spectrometry. Clin. Chem. Lab. Med. (2009) 47: 550–560.
(73) http://www.whfoods.com/genpage.php?dbid=19&tname=faq (reviewed on 18/09/2014) (73) Barker G.F., Manzo N.D., Cotich Induced by Hyperoxia: Quantitation and Correlation with Lung
Injury. Am. J. Respir. Cell Mol. Biol. (2006) 35: 277–288 (74) Henricks P.A., Nijkamp F.P., Reactive oxygen species as mediators in asthma. Pulm. Pharmacol.
Ther. (2001) 14: 409-20 (75) Mann D.M., Molecular biology's impact on our understanding of aging. BMJ (1997) 315: 1078-1081 (76) Comhair S.A., Erzurum S.C., Redox control of asthma: molecular mechanisms and therapeutic
opportunities. Antioxid. Redox Signal. (2010) 12: 93-124 (77) Saude E.J., Skappak C.D., Regush S., Cook K., Ben-Zvi A., Becker A., Moqbel R., Sykes B.D.,
Rowe B.H., Adamko D.J., Metabolomic profiling of asthma: diagnostic utility of urine nuclear magnetic resonance spectroscopy. J. Allergy Clin. Immunol. (2011) 127: 757-764
(78) Rocha C.M., Carrola J., Barros A.S., Gil A.M., Goodfellow B.J., Carreira I.M., Bernardo J., Gomes A., Sousa V., Carvalho L., Duarte I.F., Metabolic signatures of lung cancer in biofluids: NMR-based metabonomics of blood plasma. J. Proteome Res. (2011) 10: 4314-4324.
(79) Bolton C.F., Sepsis and the systemic inflammatory response syndrome: neuromuscular manifestations. Crit Care Med (1996) 24: 1408–1416.
(80) Berg J.M., Tymoczko J.L., Stryer L. Biochemitry (2002), 5th Edition, New York: W H Freeman (81) Jung J., Kim S.H., Lee H.S., Choi G.S., Jung Y.S., Ryu D.H., Park H.S., Hwang G.S., Serum
metabolomics reveals pathways and biomarkers associated with asthma pathogenesis. Clin. Exp. Allergy (2013) 43: 425-433.
(82) Phypers B., Pierce J.M., Lactate physiology in health and disease. Contin. Educ. Anaesth. Crit. Care Pain (2006) 6: 128-132.
(83) Luft F.C., Lactic Acidosis Update for Critical Care Clinicians. JASN (2001) 12: S15-S19. (84) Rashid A.O., Azam H.M., DeBari V.A., Blamoun A.I., Moammar M.Q., Khan M.A. Non-anion gap
acidosis in asthma: clinical and laboratory features and outcomes for hospitalized patients. Ann. Clin. Lab. Sci. (2008) 38: 228-234.
(85) Meert K.L., McCaulley L., Sarnaik A.P., Mechanism of lactic acidosis in children with acute severe asthma. Pediatr. Crit. Care Med. (2012) 13: 28-31.
(86) Lehninger A., Nelson D.L., Cox M.M., Nelson D.L., Lehninger Principles of Biochemistry (2004), W H Freeman & Co, New York.
(87) Greenwald R., Fitzpatrick A.M., Gaston B., Marozkina N.V., Erzurum S., Teague W.G., Breath formate is a marker of airway S-nitrosothiol depletion in severe asthma. PLoS One (2010) 5: e11919.
(88) Zhao Y., Fu L., Li R., Wang L.N., Yang Y., Liu N.N., Zhang C.M., Wang Y., Liu P., Tu B.B., Zhang X., Qiao J., Metabolic profiles characterizing different phenotypes of polycystic ovary syndrome: plasma metabolomics analysis. BMC Med. (2012) 10: 153 -168
(89) Jarjour N.N., Calhoun W.J., Schwartz L.B., Buse W.W., Elevated bronchoalveolar lavage fluid histamine levels in allergic asthmatics are associated with increased airway obstruction. Am. Rev. Respir. Dis. (1991) 144: 83-87
(90) Falcone F.H., Hass H., Gibbs B.F., The human basophil: a new appreciation of its role in immune responses. Blood (2000) 96: 4028-4038.

Chapter I - Introduction
61
(91) Gelfand E.W., Role of Histamine in the Pathophysiology of Asthma: Immunomodulatory and
Antiinflammatory Activities of H1-Receptor Antagonists. Am. J. Med. (2002), 113: 2-7 (92) Naclerio R., Clinical manifestations of the release of histamine and other inflammatory mediators. J.
Aller. Clin. Immun. (1999) 3: S382-S385. (93) http://biotechhelpline16.blogspot.pt/2012/09/hypersensitivity-i.html (reviewed in 11/12/2014) (94) Zitt M.J., The role of nonsedating antihistamines in asthma therapy. Allergy Asthma. Proc. (2003)
24: 239-252. (95) Boccuto L., Chen C.F., Pittman A.R., Skinner C.D., McCartney H.J., Jones K., Bochner B.R.,
Stevenson R.E., Schwartz C.E., Decreased tryptophan metabolism in patients with autism spectrum disorders. Mol. Autism. (2013) 4: 16
(96) Chen Y., Guillemin G.J., Kynurenine Pathway Compounds in Humans:Disease and Healthy States. Int. J. Tryptophan Res. (2009) 2: 1-19.
(97) Mándi Y., Vécsei L., The kynurenine system and immunoregulation. J. Neural Transm. (2012) 119: 197-209.
(98) Platten M., Wick W., Van den Eynde B.J., Tryptophan catabolism in cancer: beyond IDO and tryptophan depletion. Cancer Res. (2012) 72: 5435-5440.
(99) Meyer K.C., Arend R.A., Kalayoglu M.V., Rosenthal N.S., Byrne G.I., Brown R.R., Tryptophan metabolism in chronic inflammatory lung disease. J. Lab. Clin. Med. (1995) 126: 530-540.
(100) Fogarty A., Broadfield E., Lewis S., Lawson N., Britton J., Amino acids and asthma: a case-control study. Eur. Respir. J. (2004) 23: 565-568.
(101) Gupta K.B., Verma M., Nutrition and asthma. Lung India (2007) 24: 105-114. (102) Fernstrom J.D., Fernstrom M.H., Tyrosine, phenylalanine, and catecholamine synthesis and
function in the brain. J. Nutr. (2007) 137: S1539-S1547. (103) Hanazawa T., Kharitonov S.A., Barnes P.J., Increased nitrotyrosine in exhaled breath condensate of
patients with asthma. Am. J. Respir. Crit. Care Med. (2000) 162: 1273-1276. (104) Ulrey C.L., Liu L., Andrews L.G., Tollefsbol T.O., The impact of metabolism on DNA
methylation. Hum. Mol. Genet. (2005) 14: 139-147, (105) http://www.science-autism.org/oxidative.htm (reviewed in 11/12/2013) (106) Leipnitz G., Seminotti B., Haubrich J., Dalcin M.B., Dalcin K.B., Solano A., de Bortoli G., Rosa
R.B., Amaral A.U., Dutra-Filho C.S., Latini A., Wajner M., Evidence that 3-hydroxy-3-methylglutaric acid promotes lipid and protein oxidative damage and reduces the nonenzymatic antioxidant defenses in rat cerebral cortex. J. Neurosci. Res. (2008) 86: 686-693.
(107) Zhang A., Sun H., Wang P., Han Y., Wang X., Modern analytical techniques in metabolomics analysis. Analyst (2012) 137: 293-300
(108) Bouatra S., Aziat F., Mandal R. Cuo A.C., Wilson M.R., Knox C., Bjorndahl T.C., Krishnamurthy R., Saleem F., Liu P., Dame Z.T., Poelzer J., Huynh J., Yallou F.S., Psychogios N., Dong E., Bogumil R., Roehring C., Wishart D.S., The human urine metabolome. Plos One (2013) 8: e73076.
(109) Goodacre R., Vaidyanathan S., Dunn W.B., Harrigan G.G., Kell D.B., Metabolomics by numbers: acquiring and understanding global compound data. Trens. Biotechnol. (2004) 22: 245-252.
(110) Dunn W.B., Broadhurst D.I., Atherton H.J., Goodacre R., Griffin J.L., Systems level studies of mammalian metabolomes: the roles of mass spectrometry and nuclear magnetic resonance spectroscopy. Chem. Soc. Rev. (2011) 40: 387-426
(111) Zhang A., Sun H., Wang X., Power of metabolomics in biomarker discovery and mining mechanisms of obesity. Obes. Rev. (2013) 14: 344-349
(112) Villas-Bôas S.G., Roessner U., Hansen M.A.E.,Smedsgaard J., Nielsen J., Metabolome Analysis: An Introduction. (2007) John Wiley & Sons, Inc., Hoboken, New Jersey, USA
(113) Álvarez-Sanchéz B., Priego-Capote F., de Castro M.D.L., Metabolomics analysis I. Selection of biological samples and practical aspects preceding sample preparation. Trends Anal. Chem. (2010) 29: 111-119
(114) Zhang S., Gowda G.A.N., Ye T., Raftery D., Advances in NMR-based biofluid analysis and metabolite profiling. Analyst (2010) 135: 1490-1498.
(115) Dunn, W. B., Broadhurst, D. I., Atherton, H. J., Goodacre, R., Griffin, J. L. Systems level studies of mammalian metabolomes: the roles of mass spectrometry and nuclear magnetic resonance spectroscopy. Chem. Soc. Rev. (2011) 40: 387–426.
(116) Ma Y., Zhang P., Yang Y., Wang F., Qin H., Metabolomics in the fields of oncology: a review of recent research. Mol. Biol. Rep. (2012) 39: 7505-7511.

Chapter I - Introduction
62
(117) Akoto L., Vreuls R.J.J., Irth H., Pel R., Stellaard F. Fatty acid profiling of raw human plasma and
whole blood using direct thermal desorption combined with gas chromatography-mass spectrometry. J. Chromatogr. A (2008) 1186: 365–371
(118) Almstetter M.F., Oefner P.J., Dettmer K. Comprehensive two-dimensional gas chromatography in metabolomics. Anal. Bioanal. Chem.(2012) 402: 1993-2013
(119) Perwaiz S., Tuchweber B., Mignault D., Gilat T., Yousef I.M. Determination of bile acids in biological fluids by liquid chromatography-electrospray tandem mass spectrometry. J. Lip. Res. (2001) 42: 114–119.
(120) Junot C., Madalinski G., Tabet J.C., Ezan E., Fourier transform mass spectrometry for metabolome analysis. Analyst (2010) 135: 2203-2219.
(121) Zelena E, Dunn WB, Broadhurst D, Francis-McIntyre S, Carroll KM, Begley P., O’Hagan S., Knowles J.D., Halsall A., Husermet Consortium, Wilson I.D., Kell D.B., Development of a robust and repeatable UPLC-MS method for the long-term metabolomic study of human serum. (2009) Anal. Chem. 81: 1357–1364.
(122) Pasikanti K.K., Ho P.C., Chan E.C.Y., Gas chromatography/mass spectrometry in metabolic profiling of biological fluids. J. Chromatogr. B. (2008) 871: 202-211.
(123) Lei Z., Huhman D.V., Sumner L.W., Mass spectrometry strategies in metabolomics. J. Biol. Chem. (2011) 286: 25435-25442
(124) Mondello L., Tranchida P.Q., Dugo P., Dugo G., Comprehensive two-dimensional gas chromatography-mass spectrometry: A review. J. Chromatogr. B (2008) 871: 202-211
(125) Li X., Xu Z., Lu X., Yang X., Yin P., Kong H., Yu Y., Xu G., Comprehensive two-dimensional gas chromatography/time-of-flight mass spectrometry for metabonomics: Biomarker discovery for diabetes mellitus. Anal. Chim. Acta. (2009) 633: 257-262.
(126) Snyder L.R., Hoggard J.C., Montine T.J., Synovec R.E., Development and application of a comprehensive two-dimensional gas chromatography with time-of-flight mass spectrometry method for the analysis of L-beta-methylamino-alanine in human tissue. J. Chromatogr. A. (2010) 1217: 4639-4647.
(127) Pasikanti K.K., Norasmara J., Cai S., Mahendran R., Esuvaranathan K., Ho P.C., Chan E.C., Metabolic footprinting of tumorigenic and nontumorigenic uroepithelial cells using two-dimensional gas chromatography time-of-flight mass spectrometry. Anal. Bioanal. Chem. (2010) 398: 1285-1293.
(128) Hartonen M., Mattila I., Ruskeepää A.L., Orešič M., Hyötyläinen T., Characterization of cerebrospinal fluid by comprehensive two-dimensional gas chromatography coupled to time-of-flight mass spectrometry. J. Chromatogr. A. (2013) 1293: 142-149.
(129) Kim H.K., Choi Y.H., Verpoote R., NMR-based metabolomic analysis of plants. Nat. Protoc. (2010) 5: 536-549.
(130) Sitole L.J., Williams A.A., Meyer D., Metabonomic analysis of HIV-infected biofluids. Mol Biosyst. (2013) 9:18-28
(131) Duarte I.F., Gil A.M., Metabolic signatures of cancer unveiled by NMR spectroscopy of human biofluids. Prog Nucl Magn Reson Spectrosc. (2012) 62: 51-74
(132) Hassan-Smith G., Wallace G.R., Douglas M.R., Sinclair A.J., The role of metabolomics in neurological disease. J Neuroimmunol. (2012) 248: 48-52
(133) Griffin J.L., Atherton H., Shockcor J., Atzori L., Metabolomics as a tool for cardiac research. Nat Rev Cardiol. (2011) 8: 630-43.
(134) Atzei A., Atzori L., Moretti C., Barberini L., Noto A., Ottonello G., Pusceddu E., Fanos V., Metabolomics in paediatric respiratory diseases and bronchiolitis. J Matern Fetal Neonatal Med. (2011) 2: 59-62.
(135) Vijverberg S.J., Hilvering B., Raaijmakers J.A., Lammers J.W., Maitland-van der Zee A.H., Koenderman L., Clinical utility of asthma biomarkers: from bench to bedside (2013) 7:199-210.
(136) Murugan A., Prys-Picard C., Calhoun W.J., Biomarkers in Asthma. Curr. Opin. Pulm. Med. (2009) 15: 12-18.
(137) Dent A.G., Sutedja T.G., Zimmerman P.V., Exhaled breath analysis for lung cancer. J. Thorac. Dis. (2013) 5: S540-S550
(138) Thomas P.S., Lowe A.J., Samarasinghe P., Lodge C.J., Huang Y., Abramson M.J., Dharmage S.C., Jaffe A., Exhaled breath condensate in pediatric asthma: promising new advance or pouring cold water on a lot of hot air? a systematic review. Pediatr. Pulmonol. (2013) 48: 419-442.
(139) Murata K., Fujimoto K., Kitaguchi Y., Horiuchi T., Kubo K., Honda T., Hydrogen Peroxide Content and pH of Expired Breath Condensate from Patients with Asthma and COPD. COPD (2013) doi:10.3109/15412555.2013.830094

Chapter I - Introduction
63
(140) Caballero Balanzá S., Martorell Aragonés A., Cerdá Mir J.C., Belda Ramírez J., Navarro Iváñez R.,
Navarro Soriano A., Félix Toledo R., Escribano Montaner A., Leukotriene B4 and 8-isoprostane in exhaled breath condensate of children with episodic and persistent asthma. J. Investig .Allergol. Clin.Immunol. (2010) 20: 237-243.
(141) Rosias P., Methodological aspects of exhaled breath condensate collection and analysis. J. Breath Res.(2012) 6: 027102.
(142) van de Kant K.D., van der Sande L.J., Jöbsis Q., van Schayck O.C., Dompeling E . Clinical use of exhaled volatile organic compounds in pulmonary diseases: a systematic review. Resp. Res. (2012) 13: 117-140
(143) Dragonieri S., Schot R., Mertens B.J., Le Cessie S., Gauw S.A., Spanevello A., Resta O., Willard N.P., Vink T.J., Rabe K.F., Bel E.H., Sterk P.J., An electronic nose in the discrimination of patients with asthma and controls. J. Allergy Clin. Immunol (2007), 120: 856-862.
(144) Gahleitner F., Guallar-Hoyas C., Beardsmore C.S., Pandya H.C., Thomas C.P., Metabolomics pilot study to identify volatile organic compound markers of childhood asthma in exhaled breath. Bioanalysis (2013) 5: 2239-2247.
(145) Robroeks C.M., van Berkel J.J., Jöbsis Q., van Schooten F.J., Dallinga J.W., Wouters E.F., Dompeling E., Exhaled volatile organic compounds predict exacerbations of childhood asthma in a 1-year prospective study. Eur. Respir. J. (2013) 42: 98-106.
(146) Ibrahim B., Basanta M., Cadden P., Singh D., Douce D., Woodcock A., Fowler S.J., Non-invasive phenotyping using exhaled volatile organic compounds in asthma, Thorax (2011) 66: 804-809.
(147) Dallinga J.W., Robroeks C.M., van Berkel J.J., Moonen E.J., Godschalk R.W., Jöbsis Q., Dompeling E., Wouters E.F., van Schooten F.J., Volatile organic compounds in exhaled breath as a diagnostic tool for asthma in children. Clin. Exp. Allergy (2010) 40: 68-76.
(148) Misso N.L., Aggarwal S., Phelps S., Beard R., Thompson P.J., Urinary leukotriene E4 and 9 alpha, 11 beta-prostaglandin F concentrations in mild, moderate and severe asthma, and in healthy subjects. Clin. Exp. Allergy (2004) 34: 624-631.
(149) Balgoma D., Larsson J., Rokach J., Lawson J.A., Daham K., Dahlén B., Dahlén S.E., Wheelock C.E., Quantification of lipid mediator compounds in human urine from asthma patients by electrospray ionization mass spectrometry: controlling matrix effects, Anal. Chem. (2013) 85: 7866-7874.
(150) Mattarucchi E., Baraldi E., Guillou C., Metabolomics applied to urine samples in childhood asthma; differentiation between asthma phenotypes and identification of relevant compounds. Biomed. Chromatogr. (2012) 26: 89-94.
(151) Miekisch W., Schubert J.K., Noeldge-Schomburg G.F., Diagnostic potential of breath analysis--focus on volatile organic compounds. Clin. Chim. Acta (2004) 347: 25–39
(152) Marczin N., Yacoub M.H., Disease Markers in Exhaled Breath: Basic Mechanisms and Clinical Applications (2002), IOS Press, Amesterdam, Netherlands
(153) Pauling L., Robinson A.B., Teranishi R., Cary, P., Quantitative analysis of urine vapor and breath by gas-liquid partition chromatography. Proc. Nat. Acad. Sci. USA (1971) 68: 2374–2376
(154) Marczin N., Kharitonov S.A., Yacoub M.H., Barnes P.J., Disease markers in exhaled breath, (2005) 1st Edition, Taylor&Francis, New York, USA
(155) Gilchrist F.J., Razavi C., Webb A.K., Jones A.M., Spaněl P., Smith D., Lenney W., An investigation of suitable bag materials for the collection and storage of breath samples containing hydrogen cyanide. J. Breath Res. (2012) 6: 036004
(156) Thekedar B., Szymczak W., Höllriegl V., Hoeschen C., Oeh U., Investigations on the variability of breath gas sampling using PTR-MS. J. Breath Res. (2009) 3: 027007
(157) Horvath I., de Jongste J.C., European Respiratory Monograph: Exhaled Biomarkers (2010) Chapter 7, European Respiratory Society, Plymouth, UK
(158) Mochalski P., Wzorek B., Sliwka I., Amann A., Suitability of different polymer bags for storage of volatile sulphur compounds relevant to breath analysis. J. Chromatogr. B Analyt. Technol. Biomed. Life Sci. (2009) 877: 189-196.
(159) Mochalski, P., King, J., Unterkofler, K., Amann, A., Stability of selected volatile breath constituents in Tedlar, Kynar and Flexfilm sampling bags. Analyst (2013) 138: 1405-1418
(160) Spaněl P., Dryahina K., Rejšková A., Chippendale T.W., Smith D., Breath acetone concentration; biological variability and the influence of diet. Physiol. Meas., (2011) 32: 23-31.
(161) Folesani G., Corradi M., Goldoni M., Manini P., Acampa O., Andreoli R., Bertorelli G., David S., Franchini I., Urea in exhaled breath condensate of uraemics and patients with chronic airway diseases. Acta Biomed. (2008), 79: 79-86.

Chapter I - Introduction
64
(162) Waikar S.S., Sabbisetti V.S., Bonventre J.V., Normalization of urinary biomarkers to creatinine
during changes in glomerular filtration rate. Kidney Int., (2010) 78: 486-494. (163) Delanghe J., Speeckaert M., Preanalytical requirements of urinalysis. Biochem. Med. (2014) 24:89-
104. (164) Ryan D., Robards K., Prenzler P.D., Kendall M., Recent and potential developments in the analysis
of urine: a review. Anal. Chim. Acta. (2011) 684: 8-20. (165) Klein M., Preud’Homme H., Bueno M., Pannier F., Study of volatile selenium compounds stability
in normal urine: effects of sample handling and storage conditions, J. Anal. At. Spectrom. (2011) 26: 602-607.
(166) Kataoka H., Saito K., Recent advances in SPME techniques in biomedical analysis. J. Pharm. Biomed. Anal. (2011) 54: 926-950.
(167) http://socratic.org/questions/how-does-solid-phase-extraction-differ-from-solvent-extraction (reviewed on 12/07/2015)
(168) Ouyang G., Vuckovic D., Pawliszyn J., Nondestructive Sampling of Living Systems Using in Vivo Solid-Phase Microextraction. Chem. Rev. (2011) 111: 2784-2814.
(169) Arthur C.L., Pawliszyn J., Solid phase microextraction with thermal desorption using fused silica optical fibers. Anal. Chem., (1990) 62: 2145–2148
(170) Grote C., Pawliszyn J., Solid-phase microextraction for the analysis of human breath. Anal. Chem. (1997) 69: 587-596
(171) Lee X.P., Kumazawa T., Sato K., A simple analysis of 5 thinner components in human body fluids by headspace solid-phase microextraction (SPME). Int J Legal Med. (1995) 107: 310-313
(172) Silva C.L., Passos M., Câmara J.S., Solid phase microextraction, mass spectrometry and metabolomic approaches for detection of potential urinary cancer biomarkers--a powerful strategy for breast cancer diagnosis. Talanta (2012) 89: 360-368.
(173) Guadagni R., Miraglia N., Simonelli A., Silvestre A., Lamberti M., Feola D., Acampora A., Sannolo N., Solid-phase microextraction-gas chromatography-mass spectrometry method validation for the determination of endogenous substances: urinary hexanal and heptanal as lung tumor biomarkers. Anal Chim Acta. (2011) 701: 29-36.
(174) Monteleone M., Naccarato A., Sindona G., Tagarelli A., A reliable and simple method for the assay of neuroendocrine tumor markers in human urine by solid-phase microextraction-gas chromatography-triple quadrupole mass spectrometry. Anal. Chim. Acta. (2013) 759: 66-73.
(175) Zimmermann D., Hartmann M., Moyer M.P., Nolte J., Baumbach J.I., Determination of volatile products of human colon cell line metabolism by GC/MS analysis. Metabolomics (2007) 3: 13-17.
(176) Abaffy T., Möller M.G., Riemer D.D., Milikowski C., Defazio R.A., Comparative analysis of volatile metabolomics signals from melanoma and benign skin: a pilot study. Metabolomics (2013) 9: 998-1008.
(177) Ulanowska A, Trawińska E, Sawrycki P, Buszewski B., Chemotherapy control by breath profile with application of SPME-GC/MS method. J. Sep. Sci. (2012) 35: 2908-2913.
(178) Deng C., Zhang J., Yu X., Zhang W., Zhang X., Determination of acetone in human breath by gas chromatography-mass spectrometry and solid-phase microextraction with on-fiber derivatization. J. Chromatogr. B Analyt. Technol. Biomed. Life Sci. (2004) 810: 269-275.
(179) Doong R., Chang S., Sun Y., Solid-phase microextraction and headspace solid-phase microextraction for the determination of high molecular-weight polycyclic aromatic hydrocarbons in water and soil samples. J. Chromatogr. Sci., (2000) 38: 528-534.
(180) Pawliszyn J., Solid Phase Microextraction: Theory and Practice (1997) John Wiley & Sons, Inc., New Jersey, USA
(181) Koster E.H.M., Niemeijer I.S., de Jong G.J., Multiple Solid-Phase Microextraction of Drugs from Human Urine, Chromatographia (2002), 55: 69-73.
(182) Pawliszyn J., Handbook of solid phase microextraction (2009), Chemical Industry Press, Beijing, China
(183) Petronilho S., Coimbra M.A., Rocha S.M., A critical review on extraction techniques and gas chromatography based determination of grapevine derived sesquiterpenes. Anal. Chim. Acta (2014) 846: 8-35.
(184) Sneddon J., Masuram S., Richert J.C., Gas chromatography-mass spectrometry-basic principles, instrumentation and selected applications for detection of organic compounds. Analyt. Lett. (2007) 40: 1003-1012.
(185) Theodoridis G., Gika H.G., Wilson I.D., Mass spectrometry-based holistic analytical approaches for compound profiling in systems biology studies. Mass. Spectrom. Rev. (2011) 30: 884-906

Chapter I - Introduction
65
(186) Prado C., Marín P., Periago J.F., Application of solid-phase microextraction and gas
chromatography–mass spectrometry to the determination of volatile organic compounds in end-exhaled breath samples. J. Chromatogr. A (2003) 1011: 125–134
(187) Dent A.G., Sutedja T.G., Zimmerman P.V., Exhaled breath analysis for lung cancer. J. Thorac. Dis. (2013) 5: S540-S550
(188) Ligor T., Ligor M., Amann A., Ager C., Bachler M., Dzien A., Buszewski B., The analysis of healthy volunteers' exhaled breath by the use of solid-phase microextraction and GC-MS. J. Breath Res. (2008) 2: 046006
(189) Dang N.A., Janssen H.G., Kolk A.H., Rapid diagnosis of TB using GC-MS and chemometrics. Bioanalysis (2013) 5: 3079-3097
(190) Wahl H.G., Hoffmann A., Luft D., Liebich H.M., Analysis of volatile organic compounds in human urine by headspace gas chromatography-mass spectrometry with a multipurpose sampler. J. Chromatogr. A. (1999) 847 :117-125.
(191) Monteiro M., Carvalho M., Henrique R., Jerónimo C., Moreira N., de Lourdes Bastos M., de Pinho P.G., Analysis of volatile human urinary metabolome by solid-phase microextraction in combination with gas chromatography-mass spectrometry for biomarker discovery: application in a pilot study to discriminate patients with renal cell carcinoma. Eur. J. Cancer. (2014) 50: 1993-2002
(192) de Hoffmann, E., Stroobant V., Mass Spectrometry: Principles and Applications (2003) 2nd edition, John Wiley & Sons, Inc., New Jersey, USA
(193) Van Den Dool, H., Kratz, P.D., A generalization of the retention index system including linear temperature programmed gas—liquid partition chromatography J. Chromatography (1963) 11: 463-471.
(194) Mostafa A., Edwards M, Górecki T., Optimization aspects of comprehensive two-dimensional gas chromatography. J. Chromatogr. A (2012) 1255: 38-55.
(195) Chin S-T., Marriott P.J., Multidimensional gas chromatography beyond simple volatiles separation. Chem. Commun., (2014) 50: 8819-8833
(196) Liu Z., Phillips J.B., Comprehensive Two-Dimensional Gas Chromatography using an On-Column Thermal Modulator Interface. J. Chromatogr. Sci., (1991) 29: 227-231.
(197) Otles S., Handbook of Food Analysis Instruments (2009), CRC Press, Taylor&Francis Group, Boca Raton, Florida, USA
(198) Welke J.E., Zini C.A., Comprehensive Two-Dimensional Gas Chromatography for Analysis of Volatile Compounds in Foods and Beverages. J. Braz. Chem. Soc. (2011) 22: 609-622
(199) Cortes H.J., Winniford B., Luong J., Pursch M., Comprehensive two dimensional gas chromatography review. J. Sep. Sci. (2009) 32: 883-904.
(200) Bertsch W., Two-dimensional gas chromatography. Concepts, instrumentation, and applications - Part 1: Fundamentals, conventional two-dimensional gas chromatography, selected applications. J. High Resolut. Chromatogr. (1999) 22: 657-665.
(201) Cordero C., Rubiolo P., Sgorbini B., Galli M., Bicchi C., Comprehensive two-dimensional gas chromatography in the analysis of volatile samples of natural origin: a multidisciplinary approach to evaluate the influence of second dimension column coated with mixed stationary phases on system orthogonality. J. Chromatogr. A. (2006) 1132: 268-279.
(202) Dallüge J., Beens J., Brinkmann U.A.Th., C omprehensive two-dimensional gas chromatography: a powerful and versatile analytical tool., J. Chromatogr. A (2003) 1000:69-108.
(203) Ryan D., Morrison P., Marriott P., Orthogonality considerations in comprehensive two-dimensional gas chromatography. J. Chromatogr. A (2005) 1071: 47-53.
(204) Korytár P., Haglund P., de Boer J., Brinkamn U.A.Th., Comprehensive two-dimensional gas chromatography for the analysis of organohalogenated micro-contaminants. Trends Anal. Chem.(2006) 25: 373-396.
(205) Dallüge J., Vreuls R.J.J., Beens J., Brinkamn U.A.Th., Optimization and characterization of comprehensive two-dimensional gas chromatography with time-of-flight mass spectrometric detection (GC×GC–TOF MS). J. Sep. Sci. (2002) 25: 201-214.
(206) Guilhaus M., Principles and instrumentation in time-of-flight mass spectrometry. J. Mass Spec. (1995) 30: 1519-1532.
(207) Grob R.L., Barry E.B., Modern Practice of Gas Chromatography (2004), 4th Edition, John Wiley & Sons, Inc., New Jersey, USA
(208) Zrostlikova J., Binkley J., Wojtowicz P., Adam T., Application of Comprehensive Two-Dimensional Gas Chromatography with Time-of-Flight Mass Spectrometry in Human Metabolomic Studies. J. Anal. Chem. (2011) 66: 1333-1340.

Chapter I - Introduction
66
(209) Phillips M., Cataneo R.N., Chaturvedi A., Kaplan P.D., Libardoni M., Mundada M., Patel U.,
Zhang X., Detection of an Extended Human Volatome with Comprehensive Two-Dimensional Gas Chromatography Time-of-Flight Mass Spectrometry. Plos One (2013) 8: e75274
(210) Das M.K., Bishwal S.C., Das A., Dabral D., Varshney A., Badireddy V.K., Nanda R., Investigation of Gender-Specific Exhaled Breath Volatome in Humans by GCxGC-TOF-MS. Anal. Chem., (2014) 86: 1229-1237
(211) Kouremenos K.A., Pitt J., Marriott P.J., Metabolic profiling of infant urine using comprehensive two-dimensional gas chromatography: Application to the diagnosis of organic acidurias and biomarker discovery. J. Chromatogr. A (2010) 1217: 104-111.
(212) Pasikanti K.K., Esuvaranathan K., Hong Y., Ho P.C., Mahendran R., Mani L.R.N., Chiong E., Chan E.C.Y., Urinary metabotyping of bladder cancer using two-dimensional gas chromatography time-of-flight mass spectrometry. J. Proteome Res. (2013) 12: 3865–3873
(213) Mitrevski B.S., Wilairat P., Marriott P.J., Comprehensive two-dimensional gas chromatography improves separation and identification of anabolic agents in doping control. J. Chromatogr. A. (2010) 1217: 127-135.
(214) Beckonert O., Keun H.C., Ebbels T.M., Bundy J., Holmes E., Lindon J.C., Nicholson J.K., Metabolic profiling, metabolomic and metabonomic procedures for NMR spectroscopy of urine, plasma, serum and tissue extracts. Nat. Protoc. (2007) 2: 2692-2703.
(215) Pimenta L.P., Kim H.K., Verpoorte R., Choi Y.H., NMR-based metabolomics: a probe to utilize biodiversity. Methods Mol Biol. (2013) 1055: 117-27.
(216)Bertini I., McGreevy K.S., Parigi G., NMR of biomolecules (2012). Wiley-VHC Verlag&Co, Weinheim, Germany
(217) Zaragozá P., Ruiz-Cerdá J.L., Quintás G., Gil S., Costero A.M., León Z., Vivancos J-L., Martínez-Máñez R., Towards the potential use of H-1 NMR spectroscopy in urine samples for prostate cancer detection. Analyst (2014) 139: 3875-3878
(218) Rocha C.M., Barros A.S., Goodfellow B.J., Carreira I.M., Gomes A., Sousa V., Bernardo J., Carvalho L., Gil A.M., Duarte I.F., NMR metabolomics of human lung tumours reveals distinct metabolic signatures for adenocarcinoma and squamous cell carcinoma. Carcinogenesis (2014) doi: 10.1093/carcin/bgu226
(219) Moltu S.J., Sachse D., Blakstad E.W., Strømmen K., Nakstad B., Almaas A.N., Westerberg A.C., Rønnestad A., Brække K., Veierød M.B., Iversen P.O., Rise F., Berg J.P., Drevon C.A., Urinary Compound Profiles in Premature Infants Show Early Postnatal Metabolic Adaptation and Maturation. Nutrients (2014) 6: 1913-1930.
(220) Diaz S.O., Pinto J., Graça G., Duarte I.F., Barros A.S., Galhano E., Pita C., Almeida M. do C., Goodfellow B.J., Carreira I.M., Gil A.M., Metabolic biomarkers of prenatal disorders: an exploratory NMR metabonomics study of second trimester maternal urine and blood plasma. J. Proteome Res. (2011) 10: 3732-42.
(221) Heather L.C., Wang X., West J.A., Griffin J.L., A practical guide to metabolomic profiling as a discovery tool for human heart disease. J. Mol. Cell. Cardiol. (2013) 55: 2-11.
(222) Snowden S., Dahlén S.E., Wheelock C.E., Application of metabolomics approaches to the study of respiratory diseases. Bioanalysis. (2012) 4: 2265-90.
(223) Xu X.H., Huang Y., Wang G., Chen S.D., Metabolomics: a novel approach to identify potential diagnostic biomarkers and pathogenesis in Alzheimer's disease. Neurosci. Bull. (2012) 28: 641-8
(224) Weiss R.H., Kim K., Metabolomics in the study of kidney diseases. Nat. Rev. Nephrol.(2011) 8: 22-33.
(225) Worley B., Powers R., Multivariate Analysis in Metabolomics. Curr. Metabolomics (2013) 1: 92-107.
(226) Goodacre, R., Broadhurst, D., Smilde, A.K., Kristal, B.S., Baker, J.D., Beger, R., Bessant, C., Connor, S., Calmani, G., Craig, A., Ebbels, T., Kell, D.B., Manetti, C., Newton, J., Paternostro, G., Somorjai, R., Sjostrom, M., Trygg, J., Wulfert, F., Proposed minimum reporting standards for data analysis in metabolomics. Metabolomics (2007) 3: 231-241.
(227) Craig A., Cloarec O., Holmes E., Nicholson J.K., Lindon J.C., Scaling and Normalization Effects in NMR Spectroscopic Metabonomic Data Sets. Anal. Chem. (2006) 78: 2262-2267.
(228) Kohl S., Klein M., Hochrein J., Oefner P., Spang R., Gronwald W., State-of-the art data normalization methods improve NMR-based metabolomic analysis. Metabolomics (2012) 8: 146-160
(229) Wiklund S., Multivariate Data Analysis for Omics (2008) Umetrics, Umeå, Sweden (230) Boccard J., Veuthey J.L., Rudaz S., Knowledge discovery in metabolomics: An overview of MS
data handling. J. Sep. Sci. (2010) 33: 290-304.

Chapter I - Introduction
67
(231) Trygg J., Gullberg J., Johansson A.I., Jonsson P., Moritz T., Chemometrics in Metabolomics – An
Introduction. Plant Metabolomics (2006) 57: 117-128. (232) Jonsson, P., Bruce, S. J., Moritz, T., Trygg, J., Sjoestroem, M., Plumb, R., Granger, J., Maibaum,
E.,Nicholson, J. K., Holmes, E., Antti, H., Extraction, interpretation and validation of information for comparing samples in metabolic LC/MS data sets.Analyst (2005) 130: 701-707.
(233) Haenlein M., A Beginner’s Guide to Partial Least Squares Analysis. Understanding statistics (2004) 3: 283-297.
(234) Barker M., Rayens W., Partial least squares for discrimination. J. Chemometrics (2003) 17: 166-173.
(235) Szymańska E., Saccenti E., Smilde A.K., Westerhuis J.A., Double-check: validation of diagnostic statistics for PLS-DA models in metabolomics studies., Metabolomics (2012) 8: 3-16.
(236) Sahu A., Dalal K., Naglot S., Aggarwal P., Krishna C.M., Serum Based Diagnosis of Asthma Using Raman Spectroscopy: An Early Phase Pilot Study. Plos One (2013) 8: e78921.
(237) Xu X., Liang F., Asymptotic minimax risk of predictive density estimation for non-parametric regression. Bernoulli (2010), 16: 543-560.
(238) Picard R., Cook D., Cross-Validation of Regression Models. J. Amer. Statist. Assoc. (1984) 79: 575-583.
(239) Xu Q.-S., Liang Y.-Z, Monte Carlo cross validation, Chemometr. Intell. Lab. (2001) 56:1-11. (240) Dubitzky W., Granzow M., Berrar D.P., Fundamentals of Data Mining in Genomics and Proteomics
(2007), Springer Verlag Berlin, Heidelberg, Germany (241) Molinaro,A., Simon,R., Pfeiffer,R. M. Prediction error estimation: a comparison of resampling
methods, (2005) Bioinformatics,21: 3301–3307.

Chapter 2 - Exhaled breath analysis
68

69
CHAPTER 2 EXHALED BREATH AS A
SOURCE OF INFORMATION ON
ASTHMA
Chapter
2

Chapter 2 - Exhaled breath analysis
70

Chapter 2 - Exhaled breath analysis
71
2.1 Overview
The use of odor, namely in breath, remounts to ancient Greece where physicians
related odor of a patient’s breath and a pathology (e.g., sweet acetonic breath indicating
uncontrolled diabetes). Over the past years several reports in exhaled breath have surfaced in
the analysis of an array of pathologies that inclusively led to the development of specific
equipment for exhaled breath analysis. Exhaled breath is a rich source of information with
several compounds from different chemical families being identified. The focus of our study
in exhaled breath was ultimately develop a methodology able to differentiate asthmatic
children from healthy ones using the exhaled volatile organic compounds or “breath-print”
yielding insights into this heterogeneous pathology.
To acomplish this goal a HS-SPME/GC-MS method was developed. First an
experimental design was built to select the best conditions for HS-SPME using chemical
standards previously reported in exhaled breath, followed by the study of parameters related
to breath sampling (containers, cleaning procedures and intra-individual variability). The
optimized methodology was then sucessfully applied to a set of 35 asthmatic and 15 healthy
children and the first results showed that compounds such as the alkanes/aldehydes (linked to
lipid peroxidation) characterized the pathology. To improve the obtained results a high
throughput analytical technique, GC×GC–ToFMS was considered in a different set of 32
asthmatic and 27 healthy children. Several hundreds compounds were identified and the
model had high classification rate, sensitivity and specificity. A model with a set of 9
compounds was built and discriminated asthmatic from healthy children. The role that EB
may have in non-invasive diagnostic method and in monitoring the asthmatic therapy was
then accessed by applying the developed method on a new cohort of 49 asthmatic children.
The developed models were then tested to demonstrate the true value in the clinical practice in
following up the evolution of three children in exarcebation with the prescribed therapy
(during 3 months), as well, the follow the Omalizumab therapy effect on one patient with
severe asthma throughout 20 months.

Chapter 2 - Exhaled breath analysis
72

2.2 Profiling allergic asthma volatile metabolic patterns using a
headspacesolid phase microextraction/gas chromatography based
methodology
Chapter 2 - Exhaled breath analysis
Profiling allergic asthma volatile metabolic patterns using a
headspacesolid phase microextraction/gas chromatography based
Exhaled breath analysis
73
Profiling allergic asthma volatile metabolic patterns using a
headspacesolid phase microextraction/gas chromatography based

Chapter 2 - Exhaled breath analysis
74
2.2.1 Abstract
Allergic asthma represents an important public health issue with significant growth
over the years, especially in the paediatric population. Exhaled breath is a non-invasive, easily
performed and rapid method for obtaining samples from the lower respiratory tract. In the
present manuscript, the metabolic volatile profiles of allergic asthma and healthy children
were evaluated by HS-SPME/GC–qMS. The lack of studies in breath of allergic asthmatic
children by HS-SPME led to the development of an experimental design to optimize SPME
parameters. To fulfill this objective, three important HS-SPME experimental parameters that
influence the extraction efficiency, namely fibre coating, temperature and time extractions
were considered. The selected conditions that promoted higher extraction efficiency
corresponding to the higher GC peak areas and number of compounds were:
DVB/CAR/PDMS coating fibre, 22ºC and 60 min as the extraction temperature and time,
respectively. The suitability of two containers, 1 L Tedlar® bags and BIOVOC®, for breath
collection and intra-individual variability were also investigated. The developed methodology
was then applied to the analysis of children exhaled breath with allergic asthma (35), from
which 13 had also allergic rhinitis, and healthy children (15), allowing to identify 44 volatiles
distributed over the chemical families of alkanes (linear and ramified) ketones, aromatic
hydrocarbons, aldehydes, acids, among others. Multivariate studies were performed by PLS–
DA using a set of 28 selected compounds and discrimination between allergic asthma and
healthy children was attained with a classification rate of 88%. The allergic asthma paediatric
population was characterized mainly by the compounds linked to oxidative stress, such as
alkanes and aldehydes. Furthermore, more detailed information was achieved combining the
volatile metabolic data, suggested by PLS–DA model, and clinical data.

Chapter 2 - Exhaled breath analysis
75
2.2.2 Framework
As molecular diagnosis is the next generation of personalized medicine1 an objective
of the purposed work is to contribute for the interdisciplinary link between physicians and
biochemists, providing tools for a more efficient and precise diagnosis. Exhaled breath is a
rich source, as found out by Pauling in the 1970s, with the identification of 250 metabolites
beside nitrogen, oxygen and water vapour2. The development of new and more efficient
extraction methods, as well as, more sensitive and efficient separation techniques led to a
significant progress in this research area. The analysis and characterization of exhaled breath
became a new approach with potential to provide valuable information about respiratory and
systemic diseases that can lead to a deeper knowledge of human health status, in the
identification of disease-related marker compounds and consequently a potential information
source regarding the knowledge of these diseases metabolic pathways. Exhaled breath is a
non-invasive, easily performed and rapid sampling, either in the gaseous or condensed state.
The lack of a prominent HS-SPME study in allergic asthma exhaled breath led us to
develop an experimental design by combining HS-SPME with GC-MS to assess information
from allergic asthma metabolomic patterns. To fulfil these objectives three important HS-
SPME experimental parameters that influence the extraction efficiency, namely extraction
temperature and time, and coating fibre were considered. A full factorial design was applied
to determine the best extraction conditions using different chemical standards (hydrocarbons,
aldehydes, ketones, aromatic and aliphatic alcohols) reported in literature to be present in
exhaled breath3,4,5. Some exhaled breath sampling parameters were also optimized. Two
different breath sampling containers were tested, Tedlar® gas sampling bags and BIOVOCS®
and the washing procedure of the chosen container was optimized. Another important
parameter, the intra-individual variability, was checked over a period of three weeks with
sampling throughout a single day. After this optimization, the proposed methodology was
applied to the analysis of children exhaled breath with allergic asthma and healthy children,
used as control.

Chapter 2 - Exhaled breath analysis
76
2.2.3 Experimental
Standards and materials
The reagents used were of analytical grade and from different chemical families: linear
hydrocarbons (hexane (99.5%, Fluka, Madrid, Spain), undecane (99.8%, Fluka, Madrid,
Spain)), aldehydes (hexanal (98%, Sigma-Aldrich, Madrid, Spain), (E)-2-nonenal (95%,
Acros Organics, Geel Belgium)), ketones (acetone (99.5%, Fluka, Madrid, Spain), 3-
heptanone (97%, Sigma-Aldrich, Madrid, Spain)), and aromatic and aliphatic alcohols
(phenol (99%, Merck, New Jersey, USA), 1-hexanol (98%, Sigma-Aldrich, Madrid, Spain)).
Absolute ethanol was supplied by Panreac (99.5 %, analytical grade, Barcelone, Spain). Ultra
pure water was obtained from a Milli-Q system from Millipore (Milford, MA, USA). Four
different fibres from Supelco (Bellefonte, PA, USA) were used:
divinylbenzene/carboxen/polydimetylsiloxane (DVB/CAR/PDMS, 50/30 µm),
polydimetylsiloxane/divinylbenzene (PDMS/DVB, 65 µm), polydimetylsiloxane (PDMS, 100
µm) and polyacrilate (PA, 85 µm). SPME fibres and SPME manual holder was obtained from
Supelco (Bellenfonte, PA, USA). All the fibres were of the same length (1 cm) and
conditioned prior to use, as recommended by the manufacturer. 1 L Tedlar® bags (SKC Inc.,
Eighty Four, PA, USA) and BIOVOCS® (Markes International, Llanstrisant, UK) were used
for sampling.
Breath samples
A group of 35 children with allergic asthma, from which 13 had allergic rhinitis, and
15 healthy children volunteered for this study. All parents signed an informed consent for
participation in the study. The children with allergic asthma were recruited from the
outpatient clinic of the department of paediatric immunoalergology of Hospital D. Pedro
(Aveiro, Portugal) whilst the healthy children were recruited at the local facilities that
presented no asthma episodes or symptoms. Asthma diagnosis was made based on clinical
symptoms and exams (skin prick tests and IgE values). Appropriate therapy was prescribed by
the patient’s own physician. All allergic asthma population represented a controlled asthma
status. The characteristics of the patients and healthy children are presented in Table 2.1. No
restrictions were applied regarding drugs or diet and all allergic asthma subjects were sampled
in the same room at the local hospital. The study was approved by the local hospital ethics
committee.
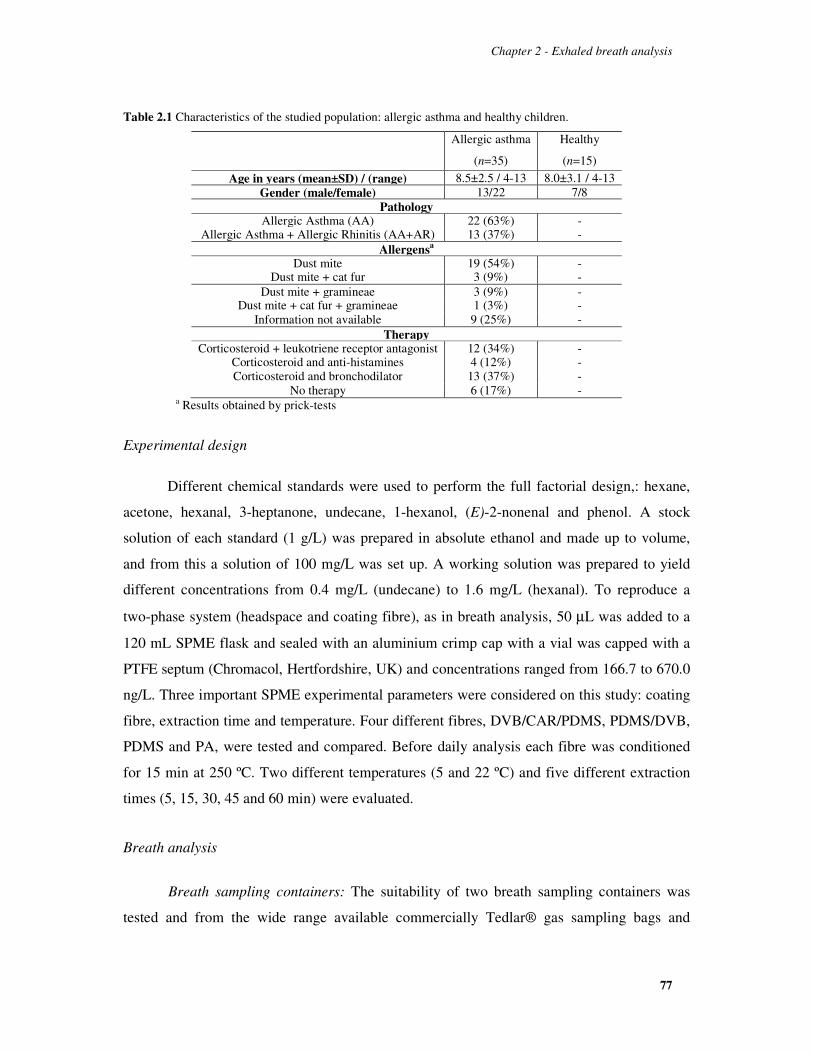
Chapter 2 - Exhaled breath analysis
77
Table 2.1 Characteristics of the studied population: allergic asthma and healthy children.
Allergic asthma
(n=35)
Healthy
(n=15)
Age in years (mean±SD) / (range) 8.5±2.5 / 4-13 8.0±3.1 / 4-13 Gender (male/female) 13/22 7/8
Pathology Allergic Asthma (AA) 22 (63%) -
Allergic Asthma + Allergic Rhinitis (AA+AR) 13 (37%) - Allergensa
Dust mite 19 (54%) - Dust mite + cat fur 3 (9%) -
Dust mite + gramineae 3 (9%) - Dust mite + cat fur + gramineae 1 (3%) -
Information not available 9 (25%) - Therapy
Corticosteroid + leukotriene receptor antagonist 12 (34%) - Corticosteroid and anti-histamines 4 (12%) - Corticosteroid and bronchodilator 13 (37%) -
No therapy 6 (17%) - a Results obtained by prick-tests
Experimental design
Different chemical standards were used to perform the full factorial design,: hexane,
acetone, hexanal, 3-heptanone, undecane, 1-hexanol, (E)-2-nonenal and phenol. A stock
solution of each standard (1 g/L) was prepared in absolute ethanol and made up to volume,
and from this a solution of 100 mg/L was set up. A working solution was prepared to yield
different concentrations from 0.4 mg/L (undecane) to 1.6 mg/L (hexanal). To reproduce a
two-phase system (headspace and coating fibre), as in breath analysis, 50 µL was added to a
120 mL SPME flask and sealed with an aluminium crimp cap with a vial was capped with a
PTFE septum (Chromacol, Hertfordshire, UK) and concentrations ranged from 166.7 to 670.0
ng/L. Three important SPME experimental parameters were considered on this study: coating
fibre, extraction time and temperature. Four different fibres, DVB/CAR/PDMS, PDMS/DVB,
PDMS and PA, were tested and compared. Before daily analysis each fibre was conditioned
for 15 min at 250 ºC. Two different temperatures (5 and 22 ºC) and five different extraction
times (5, 15, 30, 45 and 60 min) were evaluated.
Breath analysis
Breath sampling containers: The suitability of two breath sampling containers was
tested and from the wide range available commercially Tedlar® gas sampling bags and

Chapter 2 - Exhaled breath analysis
78
BIOVOC® were chosen. All tests were made using the exhaled breath of a child with allergic
asthma and using the method developed in the experimental design.
Tedlar® gas sampling bags were chosen and due to impurities, derived from the
manufacturing process, the washing procedure was verified as the manufacturer suggests.
Prior to this step, the purity of the compressed air/nitrogen available in the laboratory was
verified and the main conclusion is that the used gases are adequate for this procedure as there
is no further contamination by these washing agents (data not shown). The manufacturer
recommends that before using Tedlar® bags three nitrogen/compressed air flushes should
suffice, however the comparison was made between no flush, 3 and 10 flushes.
Breath sampling: Exhaled breath was collected in 1 L Tedlar® bags with parallel
ambient air extraction. Breath samples were obtained while children waited for consultation.
Children were asked to cleanse their mouth with water before sampling. Subsequently,
children were instructed to inhale and exhaled normally and then exhale deeply into the
Tedlar® bag previously holding their breath for 5 seconds. The collection method was
successfully done by all volunteers. Each subject provided one sample using a disposable
mouthpiece. Before collecting exhaled breath, all bags were thoroughly cleaned to remove
residual contaminants by flushing with high purity nitrogen gas allowing the re-use of the
Tedlar® bags. The bags were transported to the laboratory and the analysis was performed to
a maximum of six hours as recommended by Mochalski et al.6. On average, the analysis was
performed two to three hours after sampling. The bags were storage at 22 °C. Parallel room
air sampling was also performed using a large volume syringe to fill a Tedlar bag with room
air.
Intra-individual variability evaluation: There have been reports on the intra-individual
variation of exhaled breath over a period of time7. This is an important parameter to be
assessed for the developed methodology to verify if the individual profile is repeatable or
consistent over time. Hence, the exhaled breath of a child with allergic asthma was collected
over a period of three consecutive weeks, six replicates were performed and analysed in the
same day. All sampling was performed in the same room.
HS-SPME general procedure: Breath analysis was performed with the optimized
conditions using the DVB/CAR/PDMS fibre in a 22 ºC termostated room for 60 min.
Following the extraction procedure, the SPME fibre was retracted from the Tedlar® bag and

Chapter 2 - Exhaled breath analysis
79
inserted in the GC system injection port for 5 min where the compounds were thermally
desorbed and transferred to the GC column.
GC-MS analysis
The SPME coating fibre containing the volatile compounds from the standard working
solution and exhaled breath was manually introduced into the GC injection port at 250 ºC and
kept for 5 min for desorption. The injection port was lined with a 0.75 mm I.D. glass liner.
The desorbed volatile compounds were analyzed in an Agilent Technologies 6890N Network
gas chromatograph, equipped with a 60m×0.32mm I.D., 0.25 µm film thickness DB-FFAP
fused silica capillary column (J&W Scientific, Folsom, CA, USA), connected to an Agilent
5973 quadrupole mass selective detector. Splitless injections were used (5 min). The oven
temperature program was set initially to 50 ºC, with a temperature increase of 5 ºC/min to 220
ºC held (6 min). Helium carrier gas had a flow rate of 1.7 mL/min and the column head
pressure was 12 psi. The mass spectrometer was operated in the electron impact mode (EI) at
70 eV scanning the range 33–300 m/z in a 4.76-s cycle, in a full scan acquisition mode. The
identification of the chromatogram peaks was done comparing all mass spectra with the
library data system of the GC–MS equipment (NIST 05 MS Library). The spectra were also
compared with spectra found in the literature. The identification of each volatile compound
was confirmed by comparing its mass spectrum and retention time with those of the pure
standard compounds, when available. The GC peak area data were used as an indirect
approach to estimate the relative content of each volatile compound. All measurements
concerning the chemical standards were made with three replicates and the reproducibility
was expressed as Relative Standard Deviation (R.S.D., %). Each breath represents a single
sample, and was analysed once. To verify the absence of any carry over, blanks, corresponding
to the analysis of the coating fibre not submitted to any extraction procedure, were run between
sets of three analyses.
Statistical analysis
Single factor ANOVA was performed in the evaluation of the intra-individual
variability over a period of three weeks. A critical value of 0.05 was used as a criterion of
significance and all calculations were performed using the Excel® software (Microsoft). PLS
is a very important procedure for both regression and classification purposes. Concerning the
classification application of PLS, known as PLS-DA8, the most common approach is to use a

Chapter 2 - Exhaled breath analysis
80
Y matrix containing dummy variables which defines sample memberships to pre-defined
groups and allow extracting relevant information/variability that could describe the reasons
for the observed patterns (clusters). This methodology allows one to understand which
variables (metabolites) contribute the most for the observed separation. The PLS-DA was
applied to volatile metabolites compositional data (28) identified by HS-SPME/GC-qMS
present in all the cases (50) and for classification purposes were used two groups (healthy and
asthma). The classification model complexity (number of latent variables) and classification
rate were estimated by internal cross-validation (7 blocks splits).
2.2.4 Results and discussion
Experimental design: HS-SPME optimization
The first stage of this study addressed the HS-SPME parameters optimization that
influences the extraction process. Different chemical standards reported in literature3,9 to be
present in exhaled breath were used: hexane, acetone, hexanal, 3-heptanone, undecane, 1-
hexanol, (E)-2-nonenal and phenol. Experimental design allows estimating the effect of
several variables simultaneously and the complete factorial design enabled the evaluation of
three significant factors that greatly influences the vapour pressure and equilibrium of the
target compounds in the headspace, therefore affecting the extraction efficiency: fibre coating
(DVB/CAR/PDMS, PDMS/DVB, PDMS and PA), temperature (5 and 22ºC) and extraction
time (5, 15, 30, 45 and 60min) with a total of 120 runs being performed. The obtained results
can be seen in Figure 1, in which each bubble represents the total chromatographic area of the
eight standards under study inherent to three different variables (extraction temperature,
extraction time and SPME fibre coating). Through the bubble illustration, showed in Figure
2.1, it is easy to evaluate the overall extraction efficiency, since a larger bubble represents a
higher total chromatographic area.

Chapter 2 - Exhaled breath analysis
81
Figure 2.1 - Full factorial design of solid-phase microextraction conditions for GC-MS analysis of exhaled
breath.
The comparison was made in terms of total extraction efficiency and reproducibility.
The highest extraction efficiency was obtained using the DVB/CAR/PDMS fibre in all
studied extraction times and temperatures while PA (22ºC) and PDMS (5ºC) showed the
lowest sorptive capacity. The nature of the analytes influences the SPME fibre selection.
Previous reports10,11 on exhaled breath analysis used PDMS because these studies were
focused in alkanes and aromatic hydrocarbons. These compounds are non-polar, so it is
preferable a PDMS phase. The methodology optimized in the present manuscript is to be used
in a wide range of analytes, which explains that DVB/CAR/PDMS fibre obtained the best
results, as its stationary phase has a synergistic effect between adsorption and absorption. The
mutually synergetic effect of adsorption and absorption of the stationary phase promotes a
high retention capacity and, consequently, a higher sensitivity than fibres based on absorption
only. Therefore, as DVB/CAR/PDMS presents a wide range capacity of sorbing compounds
and it is recommended by the producers in the analysis of compounds with different
physicochemical properties within a molecular weight ranging from 40 to 275.
The extraction time was studied by increasing the fibre exposure time from 5 to 60
min. Higher extraction time promoted higher extraction efficiency for all the fibres under
0
10
20
30
0 15 30 45 60
Tem
pera
ture
(ºC
)
Time (min)
DVB/CAR/PDMS PDMS/DVB PDMS PA
5
PDMS bubble is not observable as it is behind PA bubble

Chapter 2 - Exhaled breath analysis
82
study. Sorption time for the selected standards indicated an extraction time of 60 min.
Although this is a long extraction time, maximum sensitivity is desirable, at this particular
stage, so that the knowledge of exhaled breath is maximized.
The SPME process is also influenced by temperature. Higher extraction temperature
usually increases the analytes release, therefore increasing their concentration in the
headspace, due to the enhanced mass transfer (kinetics). Two temperatures were studied: 5ºC
and 22ºC (room air temperature). Higher temperatures were avoided because heating these
containers could possibly release contaminants or produce artifacts to the headspace, therefore
influencing the results. For all fibres and extraction times under study, 22ºC allowed higher
extraction efficiency.
The extraction at 22ºC for 60min with the SPME coating fibre DVB/CAR/PDMS was
selected for further breath extractions. For the selected conditions, RSD was considered
acceptable (10%).
Breath analysis
Beside the HS-SPME optimization for breath analysis there are several factors that
have to be considered and optimized. Among the factors, we optimized the type of breath
sampling containers used, the cleaning procedure adopted to such containers as well as an
important parameter such as intra-individual variability. After these optimization steps, the
developed methodology was applied to a set of 50 children (35 with allergic asthma, among
these 13 had also allergic rhinitis and 15 healthy children).
Breath sampling containers
There are a wide range of methods for sampling exhaled breath, which can include
canisters, cold trapping, adsorbing agents, BIOVOC®, Teflon and Tedlar® gas sampling
bags. These containers should be easy to operate, easy to handle and be able to store a sample
for a prolonged period of time ( in breath sampling the storage time is a major drawback).
Cost, re-usability, durability, size and versatility are other important issues to take in
consideration when choosing the adequate container. As a result, Tedlar® gas sampling bags
and BIOVOC® were chosen for further studies.
The suitability of two sampling containers Tedlar® gas sampling bags and BIOVOC®
was investigated using the exhaled breath of a child with allergic asthma with the previously

Chapter 2 - Exhaled breath analysis
83
developed HS-SPME methodology. Taking into consideration the obtained results (Figure
2.2), Tedlar® bags are the best choice for sampling exhaled breath.
Figure 2.2 - Total peak area and number of compounds comparison between two breath collection containers
(Tedlar® gas sampling bags and BIOVOC®). a.u. – arbitrary units.
There was a great difference between both containers with the identification of forty-
four compounds for samples stored in Tedlar® bags, while for samples stored in BIOVOC®
twenty-two were identified In terms of total peak area, the difference between BIOVOC®
and Tedlar® bag was considerable as BIOVOC® total peak area only represented 10% of the
obtained by using the Tedlar® bag. For follow-up procedures, the Tedlar® bag was chosen.
Tedlar® bags are frequently used to collect exhaled breath12 as it fulfils the requisites
for sampling and storing this type of samples. Nevertheless, Tedlar® bags have two main
disadvantages: (1) impurities derived from the manufacturing process and (2) sample leakage
due to adsorption or diffusion through the walls. The manufacturer recommends flushing the
bag three times with compressed air or nitrogen before use so that the contaminants are
eliminated. The effectiveness of this routine on Tedlar® bags was evaluated from no flush,
flushing three and ten times using the previously HS-SPME/GC-MS developed methodology.
Blank runs were made, filling the Tedlar® gas sampling bags with compressed air and several
pollutants, a total of sixteen compounds, were identified (Table 2.2).
44
22
0
5
10
15
20
25
30
35
40
45
50
0.0E+00
2.0E+07
4.0E+07
6.0E+07
8.0E+07
Tedlar Biovoc
Num
ber
of C
ompo
unds
Tot
al P
eak
Are
a (a
.u.)

Chapter 2 - Exhaled breath analysis
84
Table 2.2 - Volatiles identified in Tedlar bags and cleansing procedure effects with rising number of nitrogen flushes
Retention time (min.) Compounds CAS number Volatiles identified in Tedlar bags
No nitrogen
flushes
3 nitrogen
flushes
10 nitrogen
flushes
Alkanes 6.34 hexane* 110-54-3 x x x 7.20 2,4-dimethyl-heptane 2213-23-2 x n.d. n.d. 7.65 4-methyl-octane 2216-34-4 x n.d. n.d. 11.40 undecane* 1120-21-4 x n.d. n.d.
Carbonyl Compounds 7.39 acetone* 67-64-1 x x n.d. 26.48 benzaldehyde* 100-52-7 x x x
21.10 acetic acid* 64-19-7 x x x
Aromatic Compounds 33.77 phenol* 108-95-2 x x x 13.56 dMethEthBenza 1075-38-3 x x x 14.32 m/z 105, 122, 91 - x x x
Miscellaneous 8.57 dichloromethane* 75-09-2 x x x 10.20 α-pinene* 80-56-8 x x x
10.10 chloroform* 67-66-3 x x n.d. 25.23 (N,N-dimethyl)-acetamide 127-19-5 x x x 35.18 diethyl phthalate 84-66-2 x x x 36.71 phthalate isobutyrate 103-28-6 x x x
n.d. – not detected *Compounds confirmed by chemical standards
a1-(1,1-dimethylethyl)-3-methyl-benzene – dMethEthBenz
Increasing the number of nitrogen flushes produces a positive result as the number of
compounds diminishes. Nevertheless, a more detailed overview of these results is
demonstrated taking into consideration two contaminants reported in literature12, (N,N-
dimethyl)acetamide and phenol. There is a significant reduction of the total peak areas with
the increase of number of flushes. For (N,N-dimethyl)acetamide, the total peak area
diminished 74% and 94% whereas for phenol the reductions were of 57% and 99% with three
and ten flushes respectively, relatively to the initial composition (no flush) (Figure 2.3). For
further analysis, Tedlar® bags were vacuumed and flushed ten times with nitrogen. With
these results a standard cleaning protocol for the Tedlar® bags was established for the present
study.
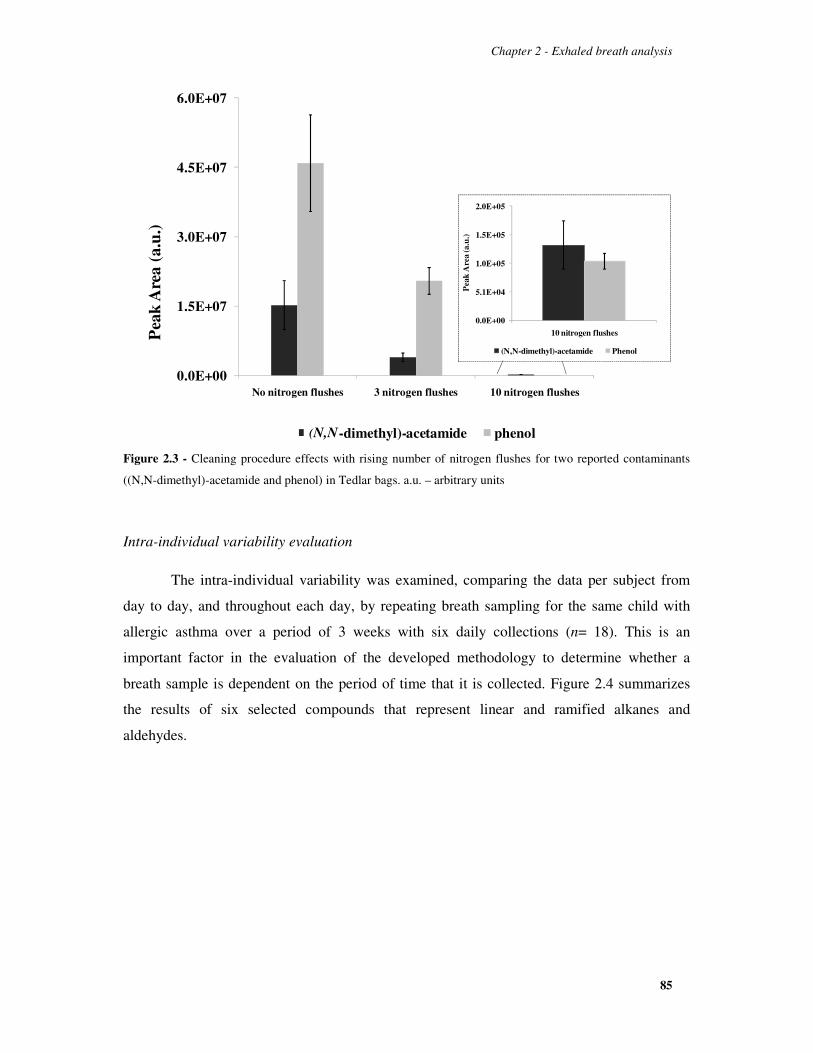
Chapter 2 - Exhaled breath analysis
85
Figure 2.3 - Cleaning procedure effects with rising number of nitrogen flushes for two reported contaminants
((N,N-dimethyl)-acetamide and phenol) in Tedlar bags. a.u. – arbitrary units
Intra-individual variability evaluation
The intra-individual variability was examined, comparing the data per subject from
day to day, and throughout each day, by repeating breath sampling for the same child with
allergic asthma over a period of 3 weeks with six daily collections (n= 18). This is an
important factor in the evaluation of the developed methodology to determine whether a
breath sample is dependent on the period of time that it is collected. Figure 2.4 summarizes
the results of six selected compounds that represent linear and ramified alkanes and
aldehydes.
0.0E+00
5.1E+04
1.0E+05
1.5E+05
2.0E+05
10 nitrogen flushes
Pea
k A
rea
(a.u
.)
(N,N-dimethyl)-acetamide Phenol
0.0E+00
1.5E+07
3.0E+07
4.5E+07
6.0E+07
No nitrogen flushes 3 nitrogen flushes 10 nitrogen flushes
Pea
k A
rea
(a.u
.)
(N,N-dimethyl)-acetamide phenol(N,N

Chapter 2 - Exhaled breath analysis
86
Figure 2.4 - Evaluation of the intra-individual variability over a period of three weeks for selected group of six
compounds. – arbitrary units
Single factor ANOVA was performed to evaluate data variability and there were no
significant differences between days, and throughout each day, represented by weeks 1, 2 and
3 (p < 0.05). However, accordingly to Figure 2.4, there are intra-individual variations between
samples over different days of the three weeks as well as in the same day that can be
explained by several factors, as for example the circadian rhythm, and diet (sampling were
performed throughout the day, before and after meals with different daily diets). It was
confirmed that the child asthma status was maintained during this experiment with no
occurrence of an asthma crisis. This study was performed with a single subject, and the results
obtained are similar to those reported in previous study that has used a larger number of
subjects13.
Exhaled breath analysis
The developed HS/SPME-GC-MS methodology was applied to exhaled children
breath samples. Forty-four volatile compounds were identified belonging to different
chemical families such as alkanes (linear and ramified), ketones, aromatic hydrocarbons,
aldehydes, acids, among others (Table 2.3). The predominant group identified in exhaled
breath were the alkanes (26 compounds). The identified compounds are also reported in other
studies performed using exhaled breath3,14, 15.
0.0E+00
3.0E+04
6.0E+04
9.0E+04
1.2E+05
Pea
k A
rea
(a.u
.)
Week 1 Week 2 Week 3

Chapter 2 - Exhaled breath analysis
87
Table 2.3 - Identified compounds in exhaled breath in both children with allergic asthma and healthy children
and obtained from ambient air parallel sampling
Peak
Number
R.T. (min.) Compounds CAS number m/z¥ Breath Ambient
air
Hydrocarbons Alkanes 1 6.34 hexane* 110-54-3 57a, 43,41 x x 3 7.20 2,4-dimethylheptane 2213-23-2 43,57,85 x - 5 7.65 4-methyloctane 2216-34-4 43,41,85 x x 6 8.94 2,2,4-trimethylhexane 16747-26-5 57,56,41 x x 7 9.57 decane* 124-18-5 43,57,41 x - 8 10.19 3,3-dimethylheptane 4032-86-4 43,57,71 x -
10 10.29 2,4-dimethyloctane 4032-94-4 57,71,85 x -
12 11.15 3-ethyl-3-methylheptane 17302-01-1 71,43,85 x - 13 11.27 2,3,7-trimethyldecane 62238-13-5 43,71,57 x - 14 11.40 undecane* 1120-21-4 71,43,57 x - 16 11.61 2,3-dimethyldecane 17312-44-6 71,43,85 x - 19 14.10 dodecane* 112-40-3 57,43,71 x x 21 15.15 3,9-dimethylundecane 17301-31-4 71,57,43 x -
25 16.56 3,6-dimethyldecane 13150-81-7 71,43,57 x - 26 16.57 tridecane* 629.50-5 57,43,71 x - 28 16.82 n.i. - 43,71,57 x -
29 17.11 n.i. - 71,57,43 x - 31 17.42 2,5,6-trimethyldecane 62108-23-0 71,57,43 x - 33 19.35 tetradecane* 629-59-4 57,43,71 x x
38 21.64 pentadecane* 629-62-9 71,43,85 x x 39 21.90 n.i. - 43,85,71 x - 41 22.50 n.i. - 57,71,85 x - 42 22.73 n.i. - 71,43,57 x x 47 24.30 hexadecane* 544-76-3 57,43,71 x - 48 25.08 2-methyl-tridecane 1560-96-9 57,43,71 x -
52 25.86 2,6,10-trimethyldodecane 3891-98-3 57,71,43 - x 53 26.24 2-methylpentadecane 1560-93-6 57,43,71 x x 59 28.26 n.i. - 57,71,85 - x
Aromatic
11 10.93 toluene* 108-88-3 91,92,65 x x
18 13.02 p-xylene* 106-42-3 91,106,65 x x 24 16.21 styrene 100-42-5 104,103,78 x - 60 28.72 napthalene* 91-20-3 128,120,102 - x 76 37.23 2,6bmethnapthb 24157-81-1 197,212,155 - x Ketones
4 7.39 acetone* 67-64-1 43,58,42 x x 30 17.27 cyclohexanone* 108-94-1 55,98,42 - x 32 18.08 6-methyl-5-hepten-2-one* 110-93-0 43,41,69 x x
54 26.48 acetophenone* 98-86-2 105,120,77 x x
Monoterpenic compounds
Hydrocarbon type 9 10.20 α-pinene* 80-56-8 93,92,91 - x
17 12.15 α-phellandrene* 99-83-2 93,77,79 - x 20 14.39 limonene* 138-86-3 68,67,93 - x
Alcohol type
51 25.61 menthol* 1490-04-6 71,95 - x
Ketone type

Chapter 2 - Exhaled breath analysis
88
Peak
Number
R.T. (min.) Compounds CAS number m/z¥ Breath Ambient
air
63 30.48 neryl acetone* 3879-26-3 43,69,107 - x
Aldehydes 15 11.51 hexanal* 66-25-1 44,56,41 - x 34 19.55 nonanal 124-19-6 43,57,57 x x
40 22.24 decanal* 112-31-2 41,43,57 x x 44 23.46 benzaldehyde* 100-52-7 77,105,106 x x
Acids 36 21.10 acetic acid* 64-19-7 43,45,60 x x 43 23.20 propanoic acid* 79-09-4 74,45,73 x - 57 27.83 pentanoic acid* 109-52-4 60,70,41 - x 62 30.18 hexanoic acid* 142-62-1 60,73,41 - x 66 32.24 2-ethylhexanoic acid 149-57-5 88,73,57 - x
67 32.40 heptanoic acid* 111-14-8 60,73,87 - x 72 34.49 octanoic acid* 124-07-2 60,73,43 - x
Miscellaneous 2 6.48 2-methyl-1,3-butadiene 78-79-5 67,68,53 x -
22 15.27 n.i. - 57,55,43 x x 23 15.71 n.i. - 105,120,43 x - 27 16.79 n.i. - 105,120,84 - x 35 19.68 2-butoxy-ethanol 111-76-2 57,45,41 x x 37 21.45 2,1meox2propc 20324-33-8 59,103,43 - x 45 23.82 n.i. - 73,43,59 - x 46 23.98 n.i. - 57,82,67 - x
49 25.19 2etoxethd 111-90-0 45,59,72 - x 50 25.50 phenylethyl acetate 103-45-7 94,43,136 x - 55 26.63 n.i. - 71,57,43 x x 56 26.77 4-tert-butylcyclohexyl acetate 32210-23-4 57,80,73 - x 58 28.00 benzyl acetate 140-11-4 108,91,90 - x 61 29.19 n.i. - 57,41,71 - x 64 31.19 benzyl alcohol* 100-51-6 79,108,107 - x
65 31.97 2-phenyldodecane 2719-61-1 91,73,122 - x 68 32.51 1-undecanol* 112-42-5 55,43,69 - x 69 33.19 2-methyl-1-undecanol 10522-26-6 58,43,69 - x
70 33.77 phenol* 87-66-1 94,66,65 x x 71 33.87 isopropyl tetradecanoate 110-27-0 228,102,229 - x 73 35.19 β-ionone* 14901-07-6 177,119,135 - x 74 35.66 2-methyl-β-ionone 127-43-5 191,121,105 - x 75 36.78 β-phenoxyethyl alcohol 9004-78-8 94,138,77 - x
n.i.: not identified *Compounds confirmed by chemical standards ¥ Identification of highest abundance m/z
aUsed fragment for area determination b 2,6bmethnapth: 2,6-bis(1-methylethyl)naphthalene c 2,1meox2prop: 2,1-(2-methoxy-1-methylethoxy)-2-propanol d 2etoxeth: 2-(2-ethoxyethoxy)ethanol
Parallel room air sampling was also performed by the reported fact that in the
environment there are a whole range of volatiles from several sources, which may influence
the obtained results. Room air analysis allowed the identification of fifty-three compounds
that belong to several different chemical families: alkanes (linear and ramified ketones,
terpenic compounds, aromatic hydrocarbons, aldehydes, acids, among others (Table 2.3).

Chapter 2 - Exhaled breath analysis
89
From these, twenty one compounds were common to children exhaled breath. Compounds
that were present in room air with higher areas than in breath were discarded for PLS-DA
analysis, as hexane for example, among others.
Multivariate analysis
Twenty-five from the forty-four volatiles were selected for multivariate analysis. This
selection was made taking account the compounds that were present in all children with
allergic asthma and by disregarding compounds that are known as solvents and
contaminations (for example, aromatic hydrocarbons).
Figure 2.5 – (A) PLS-DA LV1xLV2 scores scatter plot and (B) loading weights plot of exhaled breath for
allergic asthma (AA and AA+RA) and heatlhy children. Peak identification is presented in Table 2.3.
-0.5
-0.4
-0.3
-0.2
-0.1
0
0.1
0.2
0.3
0.4
3 5 6 7 8 10 12 13 14 16 19 21 25 26 28 29 31 33 38 41 42 47 48 53 34 44 4 2
Loa
din
gs W
Compound ID
LV1 LV2
-4
-3
-2
-1
0
1
2
3
4
5
-6 -4 -2 0 2 4 6 8LV
2 (1
1%)
LV1 (30%)
Healthy AA+RA AA **
*
*
*
**
***
**
Corticosteroid and leukotriene receptor antagonist combination
Alkanes
(B)
(A)

Chapter 2 - Exhaled breath analysis
90
PLS-DA was applied to the GC chromatographic unit variance scaled areas to
establish a preliminary classification model and assess the relationships between the
compounds and the children under study. Figure 2.5 A shows the scores scatter plot of the
first two Latent Variables (LV1xLV2), while Figure 2.5 B shows the corresponding loading
weights plot which establishes the contribution of each volatile compound that promotes the
observed discrimination. The classification model was assessed by internal cross-validation (7
blocks) giving a model with 4 LVs with a classification rate of 88%. A limited number of
compounds (28) were used to classify children with allergic asthma and healthy children
using discriminant analysis, with special highlight to compounds linked to oxidative stress
such as alkanes and aldehydes16. These compounds were not unique to children with allergic
asthma and were also observed in healthy children in greater or lesser abundance as normal
human metabolism generates a wide variety of compounds. Airway inflammation plays a
central role in the pathophysiology of asthma and during this process a degradation of
polyunsaturated fatty acids occurs due to the imbalance between oxidants and antioxidants.
This imbalance is explained by the continuous production of ROS caused by an influx of
leukocytes characteristic of lung inflammation in asthma. During this process volatile
compounds are formed by LPO of ω-3 and ω-6 polyunsaturated fatty acids17.
From Figure 2.5 A, there are two relatively defined clusters with a clear tendency for
the healthy group being associated with LV1 and LV2 negative values explained by 2,4-
dimethylheptane, 4-methyloctane and acetone, whereas the allergic asthma group is dispersed
most probably due to the distinct allergic asthma as well as different disease stages. There are
clusters for allergic asthma children for example in LVI and LV2 positive values that seems
to have contribution from decane, dodecane and tetradecane. Another region is LV1 negative
and LV2 positive values influenced by 2-methyl-1,3-butadiene whereas the allergic asthma
children that are clustered in LV1 positive region and LV2 negative values are mainly
influenced by 2,2-dimethylhexane, 2,4-dimethyloctane and 2,3,6-trimethyldecane among
others. C13 alkanes were previously used to discriminate asthma patients from children13,
being more intense in asthmatic ones.
Clinical data such as therapy, spirometry values, IgE values and prick test results were
also available. The PLS-DA scores scatter plot was tentatively explained using clinical data.
Allergic asthma is a condition associated to airspace inflammation with increasing evidence
that LPO may have an important part in the differentiating the composition of exhaled breath
between allergic asthma and healthy group. Compounds as the identified alkanes, and that

Chapter 2 - Exhaled breath analysis
91
exerted statistical differences between allergic asthma and healthy group, might be an end-
product of LPO but other pathways cannot be excluded. Allergic rhinitis is symptomatic
disorder of the nose induced after allergen exposure, an IgE mediated inflammation of the
membranes lining of the nose. Both allergic asthma and rhinitis are systemic inflammatory
conditions and usually over 80% of asthmatics have rhinitis and 10-40% of patients with
rhinitis have asthma. In the studied population, 63% were diagnosed with allergic asthma
(AA) whilst 37% with allergic asthma and allergic rhinitis (AA+AR) and from the PLS-DA
we denote that AA+AR cases are predominantly in LV1 negative LV2 positive whereas for
AA children there is a higher scattering throughout LV1 axis. Both diseases are inflammatory
diseases; however inflammation in rhinitis is concentrated in the nose while in allergic asthma
occurs in the airways modifying the volatile composition as observed in Figure 2.5 A.
Prick tests were also available with 54% of the studied cases being allergic to dust
mites, 9% dust mites and gramineae, 9% dust mites and cat fur and 3% to dust mite,
gramineae and car fur. Due to a higher number of cases the cases with positive prick tests to
dust mites are highlighted in the PLS-DA and from this data we observe a high dispersion
through LV1 axis. As for the other possible combinations, a higher number of cases are
necessary to exert any conclusions.
Several medication combinations are prescribed by clinicians to control allergic
asthma and rhinitis. Inhaled corticosteroids prevent asthma symptoms by blocking the late-
phase immune reaction to an allergen, reduce airway hyppersponsiveness and decreases
inflammation and inhibit inflammatory cells such as mast cells, eosinophils and basophils.
Leukotriene receptor antagonist or leukast are drugs that inhibit the leukotrienes receptors,
compounds that are produced by the immune system that cause inflammation in asthma and
that constrict airways whereas a histamine antagonist or antihistamine is an agent that inhibits
the action of histamine that is released in excess by an allergic reaction. Bronchodilators are
used to dilate the bronchi and bronchioles decreasing airway resistance and thereby
facilitating airflow. In our population, the three most frequent combinations were: inhaled
corticosteroids and leukotriene receptor antagonist, inhaled corticosteroids and anti-
histamines or inhaled corticosteroids and bronchodilator. As far as medication effects on
breath volatile composition that should reflect the inflammation, we observed in the PLS-DA
(highlighted with an asterisk in Figure 2.5 A differences between the exhaled breath of
children that used a combination between corticosteroid and leukotriene receptor antagonist
for asthma control as these individuals presented themselves closer to control subjects than
other subjects that were under corticosteroid and anti-histaminic or corticosteroid and

Chapter 2 - Exhaled breath analysis
92
bronchodilator therapy. This occurrence may be explained by the properties of the
combination of inhaled corticosteroids and leukotriene receptor antagonist as both decrease
inflammation consequently affecting the volatile composition of exhaled breath and thereby
inflammation compounds such as linear and ramified alkanes.
2.2.5 Concluding remarks
In this study, we report the development of HS-SPME/GC-MS methodology using a
full factorial design. Breath sampling related subjects such as breath sampling containers and
their cleaning, as well as an important parameter like intra-individual variability were also
determined. The optimization of SPME parameters was done with selected standards
representative of different chemical families previously reported in human breath3,9 and the
higher extraction efficiency was obtained with the mixed phase DVB/CAR/PDMS fibre with
an extraction of 60min and a temperature of 22ºC.
The comparison between 1 L Tedlar® gas sampling bags and BIOVOC®, for breath
collection, showed Tedlar® gas sampling bags to be the most adequate containers for
collecting breath samples. The cleaning protocol for the Tedlar® bags was also established
and consists of flushing the bag with nitrogen ten times, preceded by vacuum. As for intra-
individual variability, results show that there was no statistical difference between sampling
exhaled breath within the same day as well as sampling between different weeks, if the
asthma status is maintained.
The developed methodology was then successfully applied to breath samples of
allergic asthma children and healthy children, allowing the identification of forty-four
volatiles from different chemical families, namely: alkanes (linear and ramified) ketones,
aromatic hydrocarbons, aldehydes, acids, among others. Multivariate studies were performed
(PLS-DA) using a set of 28 selected compounds and the corresponding loadings suggested the
compounds that promoted the observed distinction between allergic asthma and healthy
children. The allergic asthma population was characterized mainly by the compounds possibly
linked to oxidative stress, such as alkanes and aldehydes, which is a characteristic of airway
inflammation. Furthermore, more detailed information can be achieved about the asthma
metabolic volatile profile by the proposed approach. The advantage of the developed method
was observed when the volatile metabolic data processed by PLS-DA was explained using the

Chapter 2 - Exhaled breath analysis
93
clinical data. Further studies are being performed increasing the number of allergic asthma
and healthy children.
Although the number of cases studied is relatively small (50), the obtained results
generated fundamental information which represents the scientific basis for the definition of a
rapid and non-invasive diagnostic tool. The results of this study provided a novel
methodological approach to characterize allergic asthma as a function of its metabolomic
patterns, which will open new strategies to early diagnosis, therapy monitoring, and
understanding the asthma pathogenesis that affects millions around the world.

Chapter 2 - Exhaled breath analysis
94

Chapter 2 - Exhaled breath analysis
95
2.3 Allergic asthma exhaled breath metabolome: A challenge for comprehensive two-dimensional gas chromatography

Chapter 2 - Exhaled breath analysis
96

Chapter 2 - Exhaled breath analysis
97
2.3.1 Abstract
Allergic asthma represents an important public health issue, most common in the
paediatric population, characterized by airway inflammation that may lead to changes in
volatiles secreted via the lungs. Thus, exhaled breath has potential to be a matrix with relevant
metabolomic information to characterize this disease. Progress in biochemistry, health
sciences and related areas depends on instrumental advances, and a high throughput and
sensitive equipment such as GC×GC–ToFMS was considered. GC×GC–ToFMS application
in the analysis of the exhaled breath of 32 children with allergic asthma, from which 10 had
also allergic rhinitis, and 27 healthy children allowed the identification of several hundreds of
compounds belonging to different chemical families. Multivariate analysis, using PLS-DA in
tandem with MCCV was performed to assess the predictive power and to help the
interpretation of recovered compounds possibly linked to oxidative stress, inflammation
processes or other cellular processes that may characterize asthma. The results suggest that
the model is robust, considering the high classification rate, sensitivity, and specificity. A
pattern of six compounds belonging to the alkanes characterized the asthmatic population:
nonane, 2,2,4,6,6-pentamethylheptane, decane, 2-methyldecane, dodecane, and tetradecane.
To explore future clinical applications, and considering the future role of molecular-based
methodologies, a compound set was established to rapid access of information from exhaled
breath, reducing the time of data processing, and thus, becoming more expedite method for
the clinical purposes.

Chapter 2 - Exhaled breath analysis
98
2.3.2 Framework
Hundreds of different volatiles are present in human breath, and their relative
concentrations may alter via the disease13. Exhaled breath has been studied using 1D-GC in
lung diseases, such as asthma13, cystic fibrosis18 and lung cancer10,19. Although such approach
often provides satisfying analytical results an in-depth chromatogram analysis frequently
indicates that some peaks are the result of two or more co-eluting compounds. GC×GC
employs two orthogonal mechanisms to separate the constituents of the sample within a single
analysis, based on the application of two GC columns coated with different stationary phases,
which increases peak capacity as a result of the product of the peak capacity of the two
dimensions. For example, a non-polar / polar phase combination (NP / P), connected in series
through a modulator interface achieves this goal. For instance, using a cryogenic modulator,
the interface samples small (several seconds) portions of the 1D eluate by cryofocusing, and
re-injects them into the second column (2D). Each 1D peak is modulated several times, largely
preservating the 1D separation. Co-eluting compounds from 1D undergo additional separation
on 2D20 Sensitivity and limits of detection are improved due to focusing of the peak in the
modulator and separation of analytes from chemical background21 compared to 1D-GC.
ToFMS brings several advantages such as full mass spectra acquisition at trace level
sensitivity and mass spectral continuity, which allows for deconvolution of spectra of co-
eluted peaks22.
Thus, this study aims to obtain a deeper knowledge of allergic asthma based on
exhaled breath analysis using a previously developed HS-SPME extraction technique, as well
as several other exhaled breath sampling parameters (Chapter 2.1), combined with GC×GC–
ToFMS system. The first step was to check the separation potential of GC×GC–ToFMS and
sensitivity issues, important parameters in exhaled breath analysis, a complex matrix with
several compounds in the micromolar to nanomolar range23. Secondly, PLS–DA and MCCV
were performed to assess both the predictive power and classification models robustness.
Moreover PLS-DA regression vectors were used to help understand metabolic variations
important to class discrimination.

Chapter 2 - Exhaled breath analysis
99
2.3.3 Experimental
Standards and materials
Several reagents were used to perform this study: linear alkanes (C8-C20) in hexane
(99.5%, Fluka, Madrid, Spain), linear alkenes (C8-C20) (98%, Sigma-Aldrich, Madrid, Spain),
aldehydes: hexanal (98%, Sigma-Aldrich, Madrid, Spain), (E)-2-nonenal (95%, Acros
Organics, Geel Belgium), decanal (98%, Sigma-Aldrich, Madrid, Spain), ketones: 3-
heptanone (97%, Sigma-Aldrich, Madrid, Spain), 5-methyl-3-heptanone (94%, Sigma-
Aldrich, Madrid, Spain), 3-octanone (98%, Sigma-Aldrich, Madrid, Spain), absolute ethanol
was supplied by Panreac (99.5 %, analytical grade, Barcelone, Spain). Ultra pure water was
obtained from a Milli-Q system from Millipore (Milford, MA, USA).
For the sensitivity studies, a stock solution of each standard (1 g/L) was prepared in
absolute ethanol and made up to volume, and from this a solution of 100 mg/L was set up. A
working solution was prepared to yield different concentrations and to reproduce a two-phase
system (headspace and coating fibre), as in breath analysis, 5 µL was added to a 120 mL
SPME flask and sealed with an aluminium crimp cap with a vial was capped with a PTFE
septum (Chromacol, Hertfordshire, UK), and concentrations ranged from 20 to 200 ×103 pg/L.
The SPME holder for manual sampling and fibre were purchased from Supelco
(Aldrich, Bellefonte, PA, USA). The SPME device included a fused silica fibre coating
partially cross-linked with 50/30µm divinylbenzene-carboxen-poly(dimethylsiloxane)
(DVB/CAR/PDMS). Prior to use, the SPME fibre was conditioned at 270 ºC for 60 min in the
GC injector, according to the manufacturer’s recommendations. Then, the fibre was daily
conditioned for 10 min at 250 ºC.
Samples
A group of 32 children with allergic asthma, from which 10 had allergic asthma and
allergic rhinitis, and 27 healthy children volunteered for this study (n=59). The characteristics
of the patients and children are presented in Table 2.4. A naive patient was also included in
this study. This patient was a 9 years old female child that had never taken an asthma drug
and was diagnosed by physicians with allergic asthma based on symptoms history and skin
prick tests were performed being positive for dust mites. After the first consult, this child was
prescribed a combination of anti-histamine and a leukotriene receptor antagonist. The 59
individuals correspond to a total of 69 exhaled breath samples. Usually, each individual

Chapter 2 - Exhaled breath analysis
100
corresponds to one breath sample, except for an allergic asthma child that was collected up to
6 times in different locations/time periods and for the naive exhaled breath was collected at
four different moments.
Table 2.4 Characteristics of the studied population: allergic asthma and healthy children.
Allergic asthma Healthy Age in years (range/median) 4-16/9 3-6/5
Gender (male/female) 18/14 15/12 Pathology
Allergic Asthma (AA) 22 (69%) - Allergic Asthma + Allergic Rhinitis (AA+AR) 10 (31%) -
Allergensa Dust mite 18 (56%) -
Dust mite + gramineae 5 (16%) - Gramineae 4 (13%) -
Dust mite + cat fur + gramineae 2 (6%) - Dust mite + cat fur 1 (3%) - Gramineae + cat fur 1 (3%) -
Dust mite + cockroach 1 (3%) - Therapy
Corticostero Leukotri Bronchodilato Anti- Nasal x x x - - 1 (3%) - x - x - - 9 (28%) - x x - - - 5 (16%) - - x - x x 2 (6%) - - - x x - 5 (16%) - - x x - - 1 (3%) - - - - x x 2 (6%) - - x - x - 1 (3%) -
No therapy 6 (19%) - a Results obtained by prick-tests
The allergic asthma population represented a controlled asthma status, with exception
of a naive child. No restrictions were applied regarding drugs or diet, and each allergic asthma
and healthy groups were sampled in two distinct locations (in a total of four collections sites).
The study was approved by the hospital ethics committee and the daycare administration.
Breath sampling
The breath sampling parameters were previously optimized (Chapter 2.1). Exhaled
breath was collected in 1 L Tedlar® bags. Children were asked to cleanse their mouth with
water before sampling. Subsequently, children were instructed to inhale and exhaled normally
and then exhale deeply into the Tedlar® bag previously holding their breath for 5s. The
collection method was successfully done by all volunteers. Each subject provided one sample
using a disposable mouthpiece. Before collecting exhaled breath, all bags were thoroughly
cleaned to remove residual contaminants by flushing with high purity nitrogen gas. The bags

Chapter 2 - Exhaled breath analysis
101
were transported to the laboratory and the analysis was performed to a maximum of six hours
as recommended by Mochalski et. al.24. On average, the analysis was performed after two to
three hours after sampling. The bags were stored at 22 °C.
HS-SPME methodology
The SPME coating fibre and the experimental parameters were adopted from a
methodology previously developed in our laboratory (Chapter 2.1): DVB/CAR/PDMS fibre,
and an extraction temperature and time of 22 ºC and 60 min, respectively. Following the
extraction procedure, the SPME fibre was retracted from the Tedlar® bag and inserted in the
GC system injection port. The HS-SPME methodology was also applied to selected standards
to verify the GC×GC sensitivity as previously described in standards and materials section.
Each breath represents a single sample, and was analysed once. To verify the absence of any
carry over, blanks (that corresponds to the analysis of the coating fibre not submitted to any
extraction procedure and Tedlar® bags) were performed.
GC×GC–ToFMS analysis
After the extraction/concentration step, the SPME coating fibre was manually
introduced into the GC×GC–ToFMS injection port at 250 °C. The injection port was lined
with a 0.75 mm I.D. splitless glass liner. Splitless injections were used (2 min). The LECO
Pegasus 4D (LECO, St. Joseph , MI , USA ) GC×GC-ToFMS system consisted of an Agilent
GC 7890A gas chromatograph (Agilent Technologies, Inc., Wilmington , DE ), with a dual
stage jet cryogenic modulator (licensed from Zoex) and a secondary oven, and mass
spectrometer equipped with a high resolution ToF analyzer. An HP-5 column (30 m × 0.32
mm I.D., 0.25 µm film thickness, 5% Phenyl-methylpolysiloxane, J&W Scientific Inc.,
Folsom, CA, USA) was used as 1D column and a DB-FFAP (0.79 m × 0.25 mm I.D., 0.25 µm
film thickness, nitroterephthalic acid modified polyethylene glycol, J&W Scientific Inc.,
Folsom, CA, USA) was used as 2D column. The carrier gas was helium at a constant flow rate
of 2.50 mL/min. The GC×GC–ToFMS injection port was at 250 °C. The primary oven
temperature program was: initial temperature 35 ºC (hold 1 min), raised to 40 ºC (1 ºC/min),
and finally rose to 220 ºC (7 ºC/min) and hold for 1 min. The secondary oven temperature
program was 15 ºC offset above the primary oven. The MS transfer line temperature was 250
ºC and the MS source temperature was 250 ºC. A 6 s modulation time with a 30 ºC secondary

Chapter 2 - Exhaled breath analysis
102
oven temperature offset (above primary oven) was chosen to be a suitable compromise as it
maintained the 1D separation, maximized the 2D resolution, and avoiding wrap-around effect
(the elution time of a pulsed solute exceeds the modulation period) for compounds that were
late to elute from the 2D. Ideally, all peaks must be detected before the subsequent re-injection
and, hence, 2tR must be equal or less than the modulation period25,26. The ToFMS was
operated at a spectrum storage rate of 125 spectra/s. The mass spectrometer was operated in
the EI mode at 70 eV using a range of m/z 35-350 and the detector voltage was -1695 V. Total
ion chromatograms (TIC) were processed using the automated data processing software
ChromaToF (LECO) at signal-to-noise threshold of 80. Contour plots were used to evaluate
the separation general quality and for manual peak identification. In order to identify the
different compounds, the mass spectrum of each compound detected was compared to those
in mass spectral libraries of one home-made (using standards) and two commercial databases
(Wiley 275 and US National Institute of Science and Technology (NIST) V. 2.0 - Mainlib and
Replib). The identification was also supported by experimentally determining the retention
index (RI) values that were compared, when available, with values reported in literature for
chromatographic columns similar to that used as the 1D column and whenever available
compared to RI values obtained by GC×GC27-62. For determination of RI values a C8-C20 n-
alkanes series was used, calculated according to the Van den Dool and Kratz equation63. The
majority (> 90%) of the identified compounds presented similarity matches > 850. The
GC×GC area data was used as an approach to estimate the relative content of each volatile
component of exhaled breath.
Multivariate Analysis
A full dataset comprises 134 metabolites belonging to selected chemical families. A
sub-set of 23 metabolites was also established by the compounds simultaneously identified by
GC×GC–ToFMS, and those previously reported in Chapter 2.1 (indicated in Table 2.5). PLS
is a widely used procedure for both regression and classification purposes. Concerning the
classification application of PLS, PLS-DA8, the most common approach is to use a Y matrix
containing dummy variables which defines sample memberships to pre-defined groups and
allow extracting relevant information/variability that could describe the reasons for the
observed patterns (clusters). This methodology allows one to understand which variables
(metabolites) contribute the most for the observed separation. Each sample was mean
normalized and UV (unit variance) scaled which is a data pre-treatment process that gives to

Chapter 2 - Exhaled breath analysis
103
variables the same weight. The PLS-DA was applied to volatile metabolites (both datasets: 23
and 134 metabolites) tentatively identified by HS-SPME/GC×GC-ToFMS in all exhaled
breath samples (69) and for classification purposes two groups were used (healthy and
asthma).The classification model complexity (number of latent variables) of the full dataset
(134 metabolites) was computed, as well as classification rate and Q2 were estimated by
cross-validation (7 blocks splits). Model robustness was assessed using MCCV with 1000
iterations. For each of the 1000 randomly generated classification models, the number of
Latent Variables (LV), the Q2 (expressing the cross-validated explained variability), and the
confusion matrix was computed. The selection of model complexity was based on the most
frequent list of model properties that maximizes the predictive power (i.e., lower LV and
higher Q2). The sensitivity and the specificity of the model were then depicted from the
confusion matrix resulting into a ROC map to further assess the results significance. Then, the
same procedure was applied using permuted class membership. Sensitivity is calculated from
the ratio between true positives (allergic asthma samples correctly predicted) and the total
number of modelled breath samples, whereas specificity is determined from the ratio between
true negatives (healthy samples correctly predicted) and the total number of modelled control
GC×GC data.
2.3.4 Results and Discussion
The previous study reported the development of an HS-SPME/GC–MS methodology,
as well as the optimization of important breath sampling parameters and its application to a
group of children with allergic asthma and children. To increase the information obtained on
exhaled breath, the HS-SPME technique was applied to exhaled breath of a different
population (n= 59) using a powerful tool such as the GC×GC–ToFMS, that relatively to 1D
GC analysis is more sensitive, has higher chromatographic resolution and a structured
chromatogram is obtained, three relevant advantages.
Structured chromatogram and sensitivity
GC×GC has proven to be a powerful technique in the analysis of complex samples and
to detect trace components64,65. Automated processing of HS-SPME/GC×GC–ToFMS data
was used to tentatively identify all peaks in the GC×GC chromatogram contour plots with
signal-to-noise threshold > 80. The peak finding routine based on deconvolution method

Chapter 2 - Exhaled breath analysis
104
allowed to identify ca. 350 compounds per sample comprising several chemical families:
linear and ramified alkanes, cycloalkanes, alkenes, aldehydes, ketones, aromatic compounds,
terpenoids and esters. One hundred and thirty four compounds belonging to linear, ramified
and cycloalkanes, alkenes, aldehydes, ketones and a group of miscellaneous compounds, were
selected for further studies. The remaining compounds were considered as possible
contaminants, as for example, aromatic compounds from environmental cumulative
exposure66, whereas terpenoids and esters can have its origin in ingested foods67. Otherwise,
the linear, ramified and cycloalkanes, alkenes, aldehydes and ketones have been reported to
be associated to several biochemical processes that may occur in humans68.
The total number of compounds detected in allergic asthma exhaled breath substantially
increased with the use of the GC×GC–ToFMS, approximately 8 times, when compared to the
obtained results by 1D GC-MS. By 1D GC-MS a total of 44 compounds were identified
whereas by GC×GC–ToFMS ca. 350 compounds were tentatively identified. For example,
considering the alkanes, alkenes, aldehydes and ketones, the number of detected compounds
increased by 66%, 96%, 67% and 56%, respectively.
The compounds included in the selected dataset were tentatively identified based on
comparison of their mass spectra to home-made and commercial databases, and by
comparison of the RIs calculated (RIcalc) with the values reported in the literature (RIlit) for
5% phenylpolysilphenylene-siloxane (or equivalent) column (Table 2.5). A range between 1
and 30 was obtained for RIcal compared to the RIlit reported in the literature (|RIcalc-RIlit|) for
1D-GC with 5%-phenyl-methylpolysiloxane GC column or equivalent. This difference in RI
is considered minimal (on average lower than 0.5%), and is well justified if one takes into
account that: (i) the literature data is obtained from a large range of GC stationary phases
(several commercial GC columns are composed of 5% phenylpolysilphenylene-siloxane or
equivalent stationary phases), and (ii) the literature values were determined in a 1D-GC
separation system, and the modulation causes some inaccuracy in first dimension retention
time65.
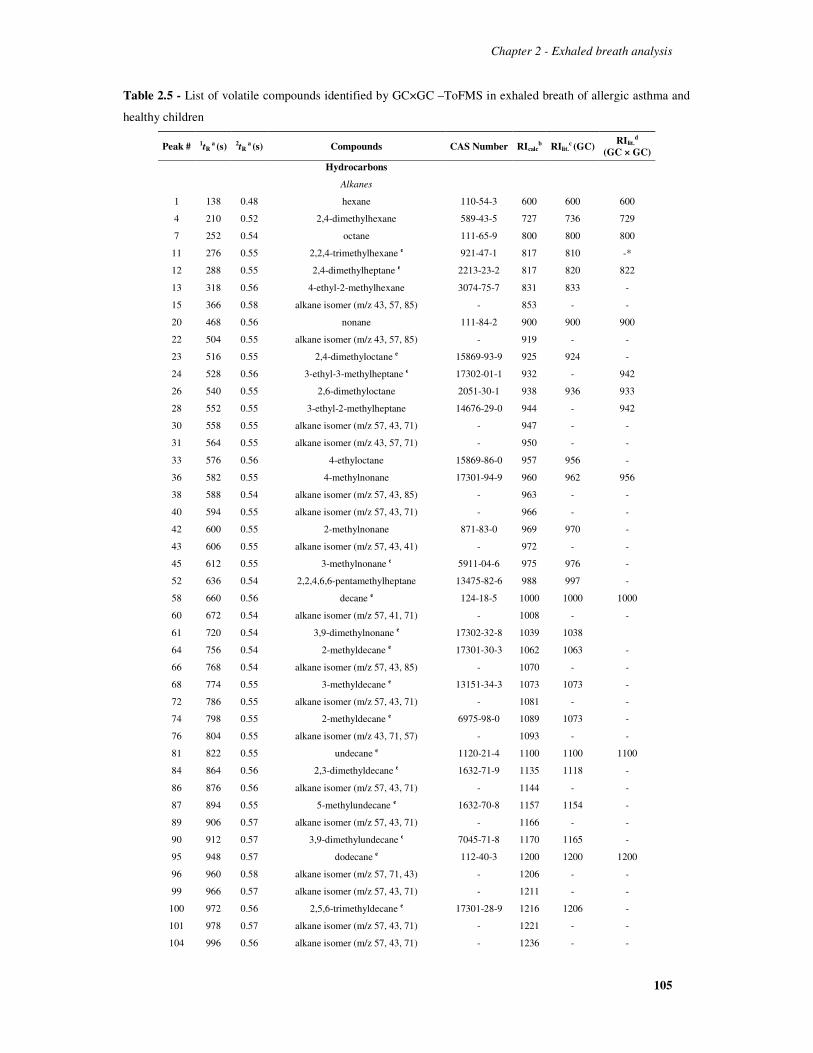
Chapter 2 - Exhaled breath analysis
105
Table 2.5 - List of volatile compounds identified by GC×GC –ToFMS in exhaled breath of allergic asthma and
healthy children
Peak # 1tR a (s) 2tR
a (s) Compounds CAS Number RIcalcb RIlit.
c (GC) RIlit.
d
(GC × GC)
Hydrocarbons
Alkanes
1 138 0.48 hexane 110-54-3 600 600 600
4 210 0.52 2,4-dimethylhexane 589-43-5 727 736 729
7 252 0.54 octane 111-65-9 800 800 800
11 276 0.55 2,2,4-trimethylhexane e 921-47-1 817 810 -*
12 288 0.55 2,4-dimethylheptane e 2213-23-2 817 820 822
13 318 0.56 4-ethyl-2-methylhexane 3074-75-7 831 833 -
15 366 0.58 alkane isomer (m/z 43, 57, 85) - 853 - -
20 468 0.56 nonane 111-84-2 900 900 900
22 504 0.55 alkane isomer (m/z 43, 57, 85) - 919 - -
23 516 0.55 2,4-dimethyloctane e 15869-93-9 925 924 -
24 528 0.56 3-ethyl-3-methylheptane e 17302-01-1 932 - 942
26 540 0.55 2,6-dimethyloctane 2051-30-1 938 936 933
28 552 0.55 3-ethyl-2-methylheptane 14676-29-0 944 - 942
30 558 0.55 alkane isomer (m/z 57, 43, 71) - 947 - -
31 564 0.55 alkane isomer (m/z 43, 57, 71) - 950 - -
33 576 0.56 4-ethyloctane 15869-86-0 957 956 -
36 582 0.55 4-methylnonane 17301-94-9 960 962 956
38 588 0.54 alkane isomer (m/z 57, 43, 85) - 963 - -
40 594 0.55 alkane isomer (m/z 57, 43, 71) - 966 - -
42 600 0.55 2-methylnonane 871-83-0 969 970 -
43 606 0.55 alkane isomer (m/z 57, 43, 41) - 972 - -
45 612 0.55 3-methylnonane e 5911-04-6 975 976 -
52 636 0.54 2,2,4,6,6-pentamethylheptane 13475-82-6 988 997 -
58 660 0.56 decane e 124-18-5 1000 1000 1000
60 672 0.54 alkane isomer (m/z 57, 41, 71) - 1008 - -
61 720 0.54 3,9-dimethylnonane e 17302-32-8 1039 1038
64 756 0.54 2-methyldecane e 17301-30-3 1062 1063 -
66 768 0.54 alkane isomer (m/z 57, 43, 85) - 1070 - -
68 774 0.55 3-methyldecane e 13151-34-3 1073 1073 -
72 786 0.55 alkane isomer (m/z 57, 43, 71) - 1081 - -
74 798 0.55 2-methyldecane e 6975-98-0 1089 1073 -
76 804 0.55 alkane isomer (m/z 43, 71, 57) - 1093 - -
81 822 0.55 undecane e 1120-21-4 1100 1100 1100
84 864 0.56 2,3-dimethyldecane e 1632-71-9 1135 1118 -
86 876 0.56 alkane isomer (m/z 57, 43, 71) - 1144 - -
87 894 0.55 5-methylundecane e 1632-70-8 1157 1154 -
89 906 0.57 alkane isomer (m/z 57, 43, 71) - 1166 - -
90 912 0.57 3,9-dimethylundecane e 7045-71-8 1170 1165 -
95 948 0.57 dodecane e 112-40-3 1200 1200 1200
96 960 0.58 alkane isomer (m/z 57, 71, 43) - 1206 - -
99 966 0.57 alkane isomer (m/z 57, 43, 71) - 1211 - -
100 972 0.56 2,5,6-trimethyldecane e 17301-28-9 1216 1206 -
101 978 0.57 alkane isomer (m/z 57, 43, 71) - 1221 - -
104 996 0.56 alkane isomer (m/z 57, 43, 71) - 1236 - -

Chapter 2 - Exhaled breath analysis
106
Peak # 1tR a (s) 2tR
a (s) Compounds CAS Number RIcalcb RIlit.
c (GC) RIlit.d
(GC × GC)
106 1002 0.57 alkane isomer (m/z 57, 43, 71) - 1241 - -
107 1008 0.57 6-methyldodecane 6044-71-9 1246 1253 -
108 1020 0.57 alkane isomer (m/z 43, 57, 71) - 1256 - -
110 1044 0.55 alkane isomer (m/z 57, 43, 71) - 1276 - -
111 1050 0.55 4-ethylundecane 17312-59-3 1281 - -
112 1056 0.57 alkane isomer (m/z 57, 43, 71) - 1286 - -
113 1062 0.55 alkane isomer (m/z 57, 71, 43) - 1291 - -
115 1068 0.56 alkane isomer (m/z 43, 57, 71) - 1296 - -
117 1074 0.57 tridecane e 629-50-5 1300 1300 1300
120 1092 0.57 2,2-dimethyldodecane 49598-54-1 1316 1315 -
121 1104 0.57 alkane isomer (m/z 57, 43, 71) - 1327 - -
122 1110 0.57 alkane isomer (m/z 57, 43, 71) - 1332 - -
123 1116 0.57 alkane isomer (m/z 57, 71, 43) - 1337 - -
124 1128 0.57 3-ethyl-3-methylundecane e - 1348 1347 -
125 1152 0.60 2-methyltridecane e 6418-41-3 1369 1371 -
126 1158 0.59 alkane isomer (m/z 57, 43, 71) - 1374 - -
127 1170 0.61 alkane isomer (m/z 57, 43, 71) - 1385 - -
128 1188 0.61 tetradecane e 629-59-4 1400 1400 1400
130 1284 0.58 alkane isomer (m/z 57, 43, 85) - 1489 - -
131 1290 0.58 6,6-diethyldodecane - 1495 1498 -
132 1296 0.64 pentadecane e 629-62-9 1500 1500 1500
133 1302 0.59 5-ethyl-5-methyltridecane - 1507 1511 -
134 1338 0.61 3-ethyl-3-methyltridecane - 1544 1549 -
Alkenes
10 252 0.60 3-octene 592-98-3 803 800 -
14 330 0.61 2,4-dimethyl-1-heptene 19549-87-2 836 842 -
17 450 0.61 1-nonene 124-11-8 892 889 -
27 546 0.57 alkene isomer (m/z 55, 41, 69) - 941 - -
29 552 0.57 3-methyl-1-nonene 2980-41-4 944 944 -
32 570 0.59 3,4-diethyl-2-hexene 19550-82-4 957 - -
37 582 0.59 alkene isomer (m/z 69,41,56) - 960 - -
44 606 0.59 alkene isomer (m/z 69,41,56) - 972 - -
46 612 059 7-methyl-1-nonene 2980-71-4 975 960 -
56 648 0.59 4-decene 19398-89-1 994 - 994
65 762 0.55 alkene isomer (m/z 55, 69, 41) - 1066 - -
67 768 0.56 alkene isomer (m/z 55, 69, 41) - 1070 - -
70 780 0.56 (Z)-2-decene 20348-51-0 1077 1072 -
75 798 0.56 alkene isomer (m/z 55, 69, 41) - 1089 - -
79 810 0.55 alkene isomer (m/z 69, 55, 41) - 1097 - -
83 828 0.57 alkene isomer (m/z 55, 69, 41) - 1109 - -
85 870 0.59 2-methyl-1-undecene 18516-37-5 1140 1144 -
92 918 0.60 (E)-5-methyl-4-undecene 41851-94-9 1174 - -
93 924 0.60 (Z)-5-methyl-5-undecene 57024-93-8 1179 - -
94 942 0.60 1-dodecene 112-41-4 1192 1192 -
97 960 0.62 alkene isomer (m/z 55, 69, 41) - 1206 - -
102 978 0.59 alkene isomer (m/z 55, 69, 43) - 1221 - -
114 1062 0.61 1-tridecene 2437-56-1 1291 1292 -

Chapter 2 - Exhaled breath analysis
107
Peak # 1tR a (s) 2tR
a (s) Compounds CAS Number RIcalcb RIlit.
c (GC) RIlit.
d
(GC × GC)
Cyclic
5 240 0.57 1,2,4-trimethylcyclopentane 930-57-4 780 779 -
8 252 0.58 1,4-dimethylcyclohexane 589-90-2 800 - 806
25 534 0.60 propylcyclohexane 2040-95-1 935 929 -
34 576 0.59 1,1,2,3-tetramethylcyclohexane 6783-92-2 953 958 -
47 618 0.60 2-ethyl-1,3-dimethylcyclohexane 7045-67-2 978 - -
48 624 0.59 1-methyl-3-propylcyclohexane 4291-80-9 982 - -
49 630 0.58 1-methyl-3-(2-methylpropyl)cyclopentane 29053-04-1 985 - -
53 642 0.59 ethylpropylcyclopentane 54111-97-6 991 - -
57 654 0.59 1-methyl-2-propylcyclohexane 4291-79-6 997 - -
63 732 0.57 hexylcyclopentane 1003-19-6 1047 - -
73 792 0.57 1,4-dimethylcycloctane 13151-98-9 1085 - -
77 804 0.59 1-ethyl-2-propycylohexane 62238-33-9 1093 - -
105 996 0.62 hexylcyclohexane 4292-75-5 1236 1237 -
116 1068 0.65 1-hexyl-3-methylcyclohexane 591-48-0 1296 - -
118 1080 0.60 1-butyl-2-propylcyclopentane 62199-50-2 1306 - -
Ketones
2 138 0.79 2-butanone 78-93-3 601 602 -
6 240 1.16 2-hexanone 591-78-6 781 790 -
16 438 1.19 3-heptanone 106-35-4 887 885 884
18 450 1.29 ketone isomer (m/z 43, 58, 71) - 892 - -
19 450 2.07 ciclohexanone 108-94-1 893 895 -
54 642 1.10 3-octanone 106-68-3 991 989 -
55 642 1.33 6-methyl-5-hepten-2-one 110-93-0 991 989 -
78 804 1.03 2-nonanone 821-55-6 1093 1093 -
80 810 1.02 ketone isomer (m/z 43, 58, 71) - 1097 - -
Miscellaneous
50 630 2.13 1-octen-3-ol 3391-86-4 985 986 -
62 720 1.78 2-ethyl-1-hexanol 104-46-7 1040 1026 -
69 774 0.99 2-nonen-1-ol 22104-79-6 1074 1105 -
71 780 1.86 1-octanol 111-87-5 1078 1068 -
91 912 0.97 2-decen-1-ol 22104-80-9 1170 - -
51 630 3.78 aniline 62-53-3 986 971 -
41 594 1.83 dimethyl trisulfide 58-80-8 967 972 -
103 978 3.73 benzothiazole 95-16-9 1223 1227 -
*–information not available a – Retention times in seconds (s) for first (1tR) and second (2tR ) dimensions. b – RI: retention index obtained through the modulated chromatogram. c– RI: retention index reported in the literature for one dimensional GC with a 5%-Phenyl-methylpolysiloxane GC column or equivalent17-19,21-46,48-52. d – RI: retention index reported in the literature for a comprehensive GC×GC system with Equity-5 for the first dimension20,47. e – Set of 23 compounds previously reported in the GC-MS study related to allergic asthma that was used in Figure 2.9.
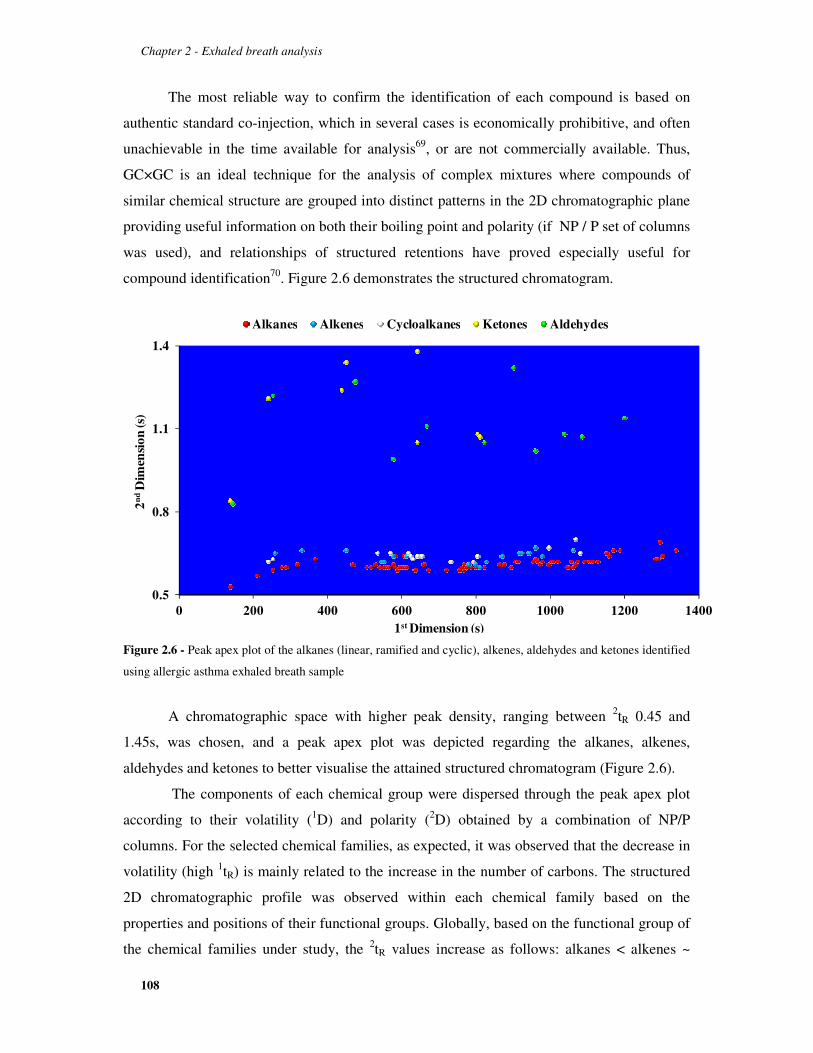
Chapter 2 - Exhaled breath analysis
108
The most reliable way to confirm the identification of each compound is based on
authentic standard co-injection, which in several cases is economically prohibitive, and often
unachievable in the time available for analysis69, or are not commercially available. Thus,
GC×GC is an ideal technique for the analysis of complex mixtures where compounds of
similar chemical structure are grouped into distinct patterns in the 2D chromatographic plane
providing useful information on both their boiling point and polarity (if NP / P set of columns
was used), and relationships of structured retentions have proved especially useful for
compound identification70. Figure 2.6 demonstrates the structured chromatogram.
Figure 2.6 - Peak apex plot of the alkanes (linear, ramified and cyclic), alkenes, aldehydes and ketones identified
using allergic asthma exhaled breath sample
A chromatographic space with higher peak density, ranging between 2tR 0.45 and
1.45s, was chosen, and a peak apex plot was depicted regarding the alkanes, alkenes,
aldehydes and ketones to better visualise the attained structured chromatogram (Figure 2.6).
The components of each chemical group were dispersed through the peak apex plot
according to their volatility (1D) and polarity (2D) obtained by a combination of NP/P
columns. For the selected chemical families, as expected, it was observed that the decrease in
volatility (high 1tR) is mainly related to the increase in the number of carbons. The structured
2D chromatographic profile was observed within each chemical family based on the
properties and positions of their functional groups. Globally, based on the functional group of
the chemical families under study, the 2tR values increase as follows: alkanes < alkenes ~
0.5
0.8
1.1
1.4
0 200 400 600 800 1000 1200 1400
2nd
Dim
ensi
on (s
)
1st Dimension (s)
Alkanes Alkenes Cycloalkanes Ketones Aldehydes

Chapter 2 - Exhaled breath analysis
109
cycloalkanes < ketones ~ aldehydes. This information can be also confirmed in Table 2.5.
Alkanes have the lowest polarity (2tR≅ 0.48−0.64 s), followed by alkenes (2tR2tR≅ 0.57−0.62s)
cycloalkanes (2tR≅ 0.57−0.65 s ), ketones (2tR≅0.79−1.33 s), and
aldehydes (2tR≅0.78−3.58 s). Τhis information is especially useful for classifying unidentified
compounds.
A further advantage of a comprehensive chromatographic system can be verified, as
compounds with similar boiling points that could co-elute in a 1D system, as for example 4-
ethyloctane (33), 1,1,2,3-tetramethylcyclohexane (34) and 2-ethylhexanal (35), are able to be
separated using the comprehensive chromatographic system (Figure 2.7). These compounds
have similar volatility, the same 1tR of 576 s but present different polarities, and as a
consequence they were separated by the second column (2tR of 0.56, 0.59 and 0.92 s,
respectively).
Figure 2.7 - Blow-up of a part of total ion GC×GC chromatogram contour plot obtained from an allergic asthma
exhaled breath showing the corresponding ramified alkane, cycloalkane and ramified aldehyde: 4-ethyloctane
(33), 1,1,2,3-tetramethylcyclohexane (34) and 2-ethylhexanal (35), respectively
Different concentrations, ranging from nmolar to µmolar have been reported for volatile
breath components71,72, so an important issue is the sensitivity of the used equipment.
Consequently, the GC×GC–ToFMS sensitivity was verified, and for this purpose a standard
solution comprising standards pertaining to the previously selected families (alkanes, alkenes,
aldehydes and ketones) was used, whose concentration, for instance, varied between 20 pg/L
to 200 ng/L. The standards from the tested compound families were detected at the level
under study. For demonstration purposes, 1-dodecene (94) and dodecane (95), showed in
Figure 2.8, were detected at pg/L and ng/L levels. The studied range was lower than the
reported values to verify that this equipment is able to detect compounds at this concentration
1st Dimension (s)1DtR – 576s
33
35
34
33
35
34
2ndD
imen
sion
(s)
0.8
0.9
0.5
O
0.6
0.7
1.0
0.8
0.9
0.5
0.6
0.7
1.0
574 584

Chapter 2 - Exhaled breath analysis
110
level, which could be relevant to identify target compounds that could be important for
asthma metabolomic studies.
Figure 2.8 - Total ion GC×GC chromatogram and corresponding contour plots of 1-dodecene (94) and dodecane
(95) varying the concentration from 20 (A) to 200×103 pg/L (B)
Multivariate analysis in the establishment of asthma “breath-print”
In the study performed with GC-MS, 28 compounds, from a total of 44, were selected
and distinction was achieved with two relatively defined clusters between the healthy and the
allergic asthma groups. As a first approach, using a different allergic asthma and healthy
children population, from the 28 compounds identified by GC-MS, 23 were also identified by
GC×GC–ToFMS and selected for multivariate analysis (indicated in Table 2.5) to verify the
results obtained in the previous study. PLS-DA was applied to the GC×GC chromatographic
unit variance scaled areas to establish a preliminary classification model and assess the
relationships between the compounds and the samples under study (Figure 2.9).
9594
(A)
2ndD
imen
sion
(s)
1st Dimension (s)
9594
9594
1st Dimension (s)
(B)
95
94
0.3
0.5
0.7
0.9
0.1
0.3
0.5
0.7
0.9
0.1
1.1
1.1
924 944 964 924 944 964
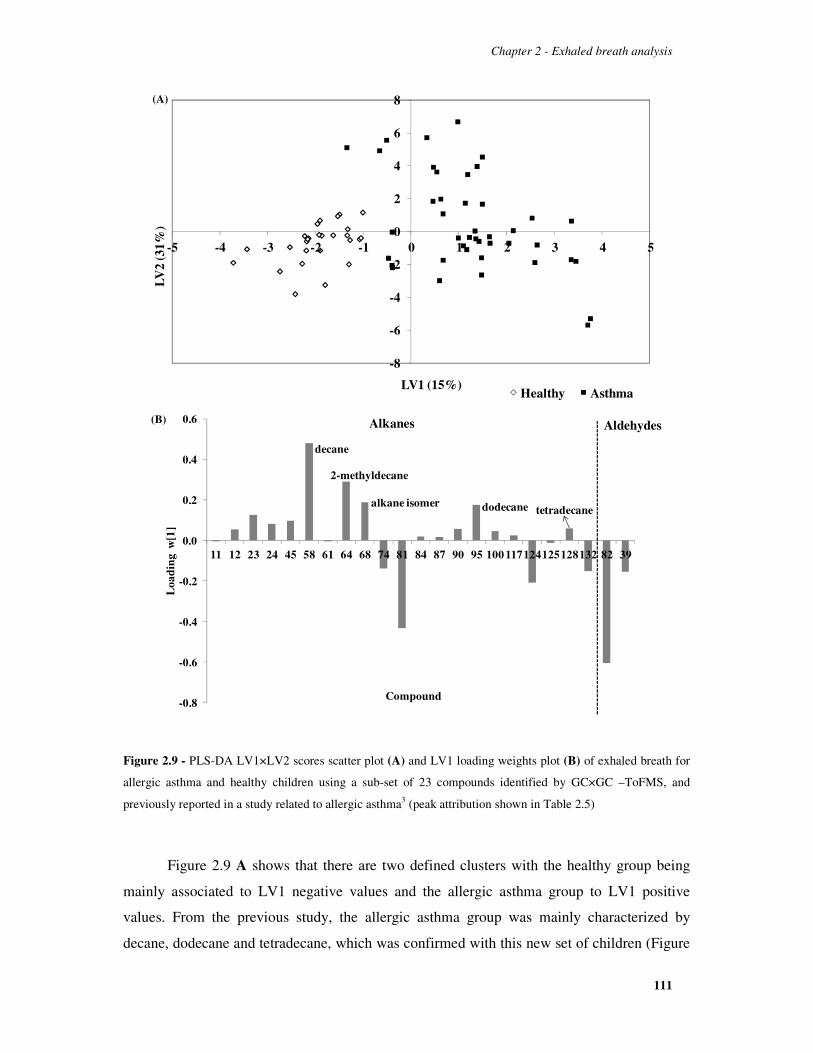
Chapter 2 - Exhaled breath analysis
111
Figure 2.9 - PLS-DA LV1×LV2 scores scatter plot (A) and LV1 loading weights plot (B) of exhaled breath for
allergic asthma and healthy children using a sub-set of 23 compounds identified by GC×GC –ToFMS, and
previously reported in a study related to allergic asthma3 (peak attribution shown in Table 2.5)
Figure 2.9 A shows that there are two defined clusters with the healthy group being
mainly associated to LV1 negative values and the allergic asthma group to LV1 positive
values. From the previous study, the allergic asthma group was mainly characterized by
decane, dodecane and tetradecane, which was confirmed with this new set of children (Figure
-8
-6
-4
-2
0
2
4
6
8
-5 -4 -3 -2 -1 0 1 2 3 4 5
LV
2 (3
1%)
LV1 (15%)Healthy Asthma
(A)
-0.8
-0.6
-0.4
-0.2
0.0
0.2
0.4
0.6
11 12 23 24 45 58 61 64 68 74 81 84 87 90 95 100 117124125128132 82 39
Loa
din
g w
[1]
Compound
Alkanes Aldehydes
decane
dodecane tetradecane
2-methyldecane
alkane isomer
(B)

Chapter 2 - Exhaled breath analysis
112
2.9 B). However a clear distinction was sought, thus PLS-DA was applied to the full dataset
of 134 compounds identified by GC×GC–ToFMS. The results obtained are shown in Figure
2.10.
Figure 2.10 - PLS-DA LV1×LV2 scores scatter plot (A) and LV1 loading weights plot (B) showing the
potentiality of exhaled breath using the full dataset of 134 compounds identified by GC×GC –ToFMS for
allergic asthma and healthy children discrimination..
Figure 2.10 A that presents the scores scatter plot of LV1×LV2, while Figure 2.10 B
(corresponding LV1 loading weights plot) establishes the contribution of each volatile
compound that promotes the observed distinction.
-20
-15
-10
-5
0
5
10
15
-15 -10 -5 0 5 10 15 20
LV
2 (1
4%)
LV1 (16%) Healthy Asthma
1st Exhaled Breath Sample
2nd Exhaled Breath Sample - 18 days
3rd Exhaled Breath Sample - 24 days
(A)
-0.6
-0.4
-0.2
0
0.2
0.4
0.6
Loa
ding
s w
[1]
Compound
Alkanes Cycloalkanes Alkenes
2,2,4,6,6-pentamethylheptane
decane3,6-dimethyldecane
dodecane
1-dodecenenonanal
decanal 6-methyl-5-hepten-2-one
tetradecane
nonane
dodecanal
(B)

Chapter 2 - Exhaled breath analysis
113
Scores scatter plot (Figure 2.10 A) shows that the healthy group is associated to LV1
negative values whereas the allergic asthma group is linked to positive LV1 values. As
observed in Figure 2.10 B, nonane, 2,2,4,6,6-pentamethylheptane, decane, 2-methyldecane,
dodecane, and tetradecane are related to the allergic asthma group. The healthy group is
mainly characterized by 6-methyl-5-hepten-2-one, 1-dodecene, nonanal, decanal, and
dodecanal. Comparing these results to the previous study, there was an increase in the number
of compounds that characterize allergic asthma and healthy samples. Interestingly the healthy
children are characterized mainly by aldehydes and the asthmatic children are characterized
by alkanes, namely those that arise from the corresponding aldehydes. Hence a pattern seems
to be noticeable that mainly involves these two chemical families. The behaviour shown in
the healthy group has also been reported by Corradi et al.73 as nonanal had lower values in
exhaled breath condensate of children with exacerbated asthma (before and after treatment)
when compared to healthy. The behaviour of the remaining aldehydes compounds that have
higher weight in the healthy group has not been previously described.
According to MCCV statistics, the PLS-DA model had a classification rate of 98%
and showed 96% sensitivity (≅4% allergic asthma children being misclassified as healthy
children) and 95% specificity (≅5% of false positives). The most frequent Q2 value was
around 0.9 (Figure 2.11), with a large prevalence of values in the range of 0.8-1. These results
suggest that confounding factors, such as, ambient air, gender or age seems to have no
significance in the distinction power.
Figure 2.11 - Q2 values distribution of the original and permuted Monte-Carlo Cross Validation for PLS-DA of
exhaled breath of full dataset (134 compounds)
0%
10%
20%
30%
40%
50%
60%
-1 -0.9 -0.8 -0.7 -0.6 -0.5 -0.4 -0.3 -0.2 -0.1 0 0.1 0.2 0.3 0.4 0.5 0.6 0.7 0.8 0.9 1
Fre
quen
cy (%
)
Q2 values
Original Permutation

Chapter 2 - Exhaled breath analysis
114
A relevant aspect brought by the results is that from the 67 identified alkanes 19 are
methylated, which corresponds to 28% of this chemical family and from these, two
methylated compounds, as for example 2,2,4,6,6-pentamethylheptane and 2-methyldecane
have a major contribution in the observed distinction. The methylated alkanes family have
also been previously reported as these may well be important in asthma characterization13,74.
These compounds also have an important role in diseases, in which oxidative stress
apparently may be involved, but to other extents, and with different consequences than
asthma, such as lung and breast cancer, as well as in lung cancer cell lines75,76,77. These
compounds have been reported in literature in other exhaled breath studies associated to
pathological states of the lungs, but as individual markers. For example, 2,2,4,6,6-
pentamethylheptane and decane were identified and compared by Poli et al.78 in exhaled
breath of patients with non-small lung cancer (NSLC), chronic obstructive pulmonary disease
(COPD), smokers and controls and their concentrations were higher for NSLC, COPD and
smokers when compared to controls. Dodecane has been proposed as lung cancer markers79,80.
These results evidence that overall, for the allergic asthma group, there is a greater
weight of the alkanes confirming the GC-MS study whereas aldehydes have a major
importance in the characterization of the healthy group. Alkanes, in the sequence of oxidation
reactions, are end-compounds that have been associated to oxidative stress and inflammation
processes81 and the hypothesis formed is that these compounds indicate that the oxidative
state is at a higher extent in asthmatics when compared to healthy children leading to the
obtained differences and consequently the alkanes can be associated to allergic asthma. These
particular compounds can be formed in the inflammatory response induced by the immune
system that leads to the production of activated leukocytes causing the cells to uptake oxygen
releasing reactive oxygen species which can damage lung tissue contributing to elevated
oxidative stress in asthma82 and there is evidence that alkanes can arise as products of LPO of
unsaturated fats83. Lipid metabolism and oxidative metabolism in the mitochondria have been
reported recently to be altered in urine of asthma patients84 and a conjecture could be made
that this alteration shown in urine can also be noticed in exhaled breath, considering the
alkanes as a measurement of lipid and oxidative metabolism that characterize the allergic
asthma group.
“Breath-print” exploration as a potential aid to the clinical practice
Therapy monitoring is one of the challenges of actual medicine as patients may or may
not follow treatment as prescribed by the physician. To test the hypothesis that a change

Chapter 2 - Exhaled breath analysis
115
would occur in the exhaled breath composition with the intake of the prescribed medication, a
naive patient (patient that had never taken an asthma drug) was recruited. This naive patient
was diagnosed by physician as having allergic asthma, and exhaled breath was collected
previous medication intake and three other moments after intake. The medication that was
prescribed was the combination of anti-histamine and a leukotriene receptor antagonist. Anti-
histamines are drugs that inhibit the action of histamine whereas leukotriene receptor
antagonist inhibits leukotrienes that are compounds produced by the immune system that
cause inflammation. This therapy combination directed to block the effects of histamine and
leukotriene mediators was performed as it is shown that it is better than stand-alone therapy85.
The behaviour of a naive child was monitored throughout 24 days (Figure 2.10 A, marked by
the path trajectory). Initially and after 18 days after the intake of the prescribed drugs, the
naive individual remains in LV1 positive values but far from the remaining controlled
subjects. There is an evolution throughout LV1 axis with treatment administration explained
by the area reduction of nonane, 2,2,4,6,6-pentamethylheptane, decane, 2-methyldecane, and
tetradecane. Considering that asthma crisis is mainly characterized by inflammation, which is
accompanied by oxidative stress and subsequently LPO, and that alkanes are evidence of
these biochemical processes, the observed decrease may be due to a lesser inflammation state
of this subject leading to lower areas of these compounds. Clinically, the child in the initial
stages was in a crisis situation almost in a daily basis and throughout the 24 days there was a
significant improvement of the asthma status control.
As verified, the obtained “breath-print” allowed the distinction between allergic
asthmatic and healthy children which could be helpful in understanding this pathology
through a better insight into the metabolic pathways that may be associated to this condition.
Nevertheless, for clinical purposes, and having in mind the future of molecular diagnosis, a
smaller set of compounds is necessary to allow a rapid use of exhaled breath for
complementary purposes in diagnosis, to follow the disease status and/or the medication
effect. For this intent, and taking into consideration the previous assertion that a pattern of
alkanes and aldehydes clearly defines both populations under study, just 9 compounds
(nonane, 2,2,4,6,6-pentamethylheptane, decane, 2-methyldecane, dodecane, tetradecane,
nonanal, decanal, and dodecanal) were selected for a new PLS-DA model. The results are
shown in Figure 2.12 and the chosen pattern was able to discriminate both groups showing the
exhaled breath testing is a tool that can be used as non-invasive diagnostic method for allergic
asthma.

Chapter 2 - Exhaled breath analysis
116
A remarkable result observed in Figure 2.12 is shown by the path of the naive child (a
through d - four breath sampling), which suggest the mitigation of asthma symptoms
following drug intake. This suggests the application of exhaled breath analysis, not only for
metabolomic profiling of allergic asthma, but also in clinical practice as a possible surrogate
to the invasive diagnosis tests performed actually.
Figure 2.12 - PLS-DA LV1×LV2 scores scatter plot (A) showing the potentiality of using a sub-set of 9
compounds of exhaled breath in discrminating allergic asthma and healthy children and the corresponding LV1
loading weights plot (B): nonane (20), 2,2,4,6,6-pentamethylheptane (52), decane (58), 2-methyldecane (64),
dodecane (95), tetradecane (128), nonanal (82), decanal (98), dodecanal (129). Path of the naive child - a
through d - four breath sampling
-5
-4
-3
-2
-1
0
1
2
3
-3 -2 -1 0 1 2 3
LV
2(21
%)
LV 1(35%) Healthy Asthma
a
bc
d
(A)
-0.8
-0.6
-0.4
-0.2
0.0
0.2
0.4
0.6
20 52 58 64 95 128 82 98 129
Loa
din
gs w
[1]
Compound
Alkanes Aldehydes(B)

Chapter 2 - Exhaled breath analysis
117
To assess both the predictive power and classification model robustness, MCCV was
also performed, using similar conditions to the previous test. According to MCCV statistics,
the PLS-DA model had a classification rate of 96% and showed 98% sensitivity (≅ 2%
allergic asthma children being misclassified as healthy) and 93% specificity (≅7% of false
positives). The most frequent Q2 value was around 0.8 (Figure 2.13), with a large prevalence
of values in the range of 0.7-0.9. Classification rate and specificity were slightly lower than
those obtain for the full dataset, but, still, remained high. The sensitivity was improved. These
results suggest that the model is robust, even using this set of 9 compounds, reducing the time
of data processing, and thus, becoming more expedite method for the clinical purposes.
.
Figure 2.13 - Q2 values distribution of the original and permuted Monte-Carlo Cross Validation for PLS-DA of
exhaled breath of sub-set of 9 compounds: nonane, 2,2,4,6,6-pentamethylheptane, decane, 2-methyldecane,
dodecane, tetradecane, nonanal, decanal, and dodecanal
2.3.5 Concluding remarks
In this study, the development of the first HS–SPME/GC×GC–ToFMS methodology
was reported for the analysis of exhaled breath of allergic asthma children and the advantages
of comprehensive chromatography was explored in issues such as the structured
chromatogram and sensitivity. The structured 2D chromatogram that arose from 1D volatility
and 2D polarity was shown and sensitivity was assessed. A well-defined chromatographic
space was obtained with the resulting structured chromatogram, which can aid posterior
0%
10%
20%
30%
40%
50%
-1 -0.9 -0.8 -0.7 -0.6 -0.5 -0.4 -0.3 -0.2 -0.1 0 0.1 0.2 0.3 0.4 0.5 0.6 0.7 0.8 0.9 1
Fre
quen
cy (
%)
Q2 values
Model Permutation

Chapter 2 - Exhaled breath analysis
118
exhaled breath analysis for example in the identification of otherwise unknown compounds.
Subsequently, the potentiality of the GC×GC–ToFMS was verified in exhaled breath samples
from allergic asthma and healthy children.
The methodology allowed the identification of several hundred compounds belonging
to different chemical families (linear and ramified alkanes, cycloalkanes, alkenes, aldehydes,
ketones, aromatic compounds, terpenoids and esters). Multivariate analysis was performed by
PLS-DA to a group of selected compounds pertaining to alkanes, alkenes, aldehydes, and
ketones and the GC×GC–ToFMS showed to be advantageous as distinction between both
groups was attained and a high classification rate was achieved. The obtained “breath-print”
allowed the discrimination between allergic asthmatic and healthy children, providing insights
into the metabolic pathways that may be associated to allergic asthma. In general, a pattern of
six compounds pertaining to the alkanes characterized the asthmatic population: 2-
methyldecane, nonane, 2,2,4,6,6-pentamethylheptane, decane, dodecane, and tetradecane.
Otherwise, a set of aldehydes (nonanal, decanal, and dodecanal) characterizes the healthy
population. Thus, a smaller set of 9 compounds comprising alkanes and aldehydes was chosen
to verify the potential clinical usefulness of exhaled breath for allergic asthma evaluation and
the obtained results are very satisfactory as, with this set, distinction was obtained. It was also
confirmed that it is also possible to follow through the effects of medication.
Exhaled breath metabolome presents itself as a challenge, and in our opinion,
GC×GC–ToFMS offers advantages that were verified in the present study that corresponded
to the challenge. This new methodological approach to characterize allergic asthma as a
function of its metabolomic patterns will enhance the possibility of further allergic asthma
pathways knowledge. It also provides with an easier methodology combined with a non-
invasive sampling for allergic respiratory disease assessment, regarding diagnostic, prognostic
and treatment follow-up. Further studies with a larger population are necessary to confirm
these findings.

Chapter 2 - Exhaled breath analysis
119
2.5 The unexplored potential of exhaled breath analysis in the aid of asthma clinical management
2.5.1 Abstract
Molecular diagnosis is the epitome of personalized medicine where physicians and
biochemists play a crucial role in the development of tools for a more rational and objective
disease monitoring and screening. The main goal of this research study was to use of
previously developed breath based metabolomic models in asthma disease control, diagnosis
and monitoring using a new cohort of children with asthma, attending on the secondary health
care consultations. The ability of using these exhaled breath models in a clinical scenario was
tentatively performed to monitor the clinical outcome of three children in an exacerbation
condition, and in addition, to follow the Omalizumab therapy effect on a patient with severe
asthma. SPME combined with GC×GC-ToFMS was used to recover the breath volatile
metabolomic signature. A supervised multivariate analysis technique was used to extract
signal features, to tentatively characterize the disease evolution and to predict the outcome.
MCCV was applied to the PLS-DA models to evaluate the sensitivity and specificity levels
and to assess classification model robustness. The prediction tool using the reported models
was successful based on classification rate, sensitivity and specificity values (≥ 93%).
Aldehydes and alkanes, end-products of lipid peroxidation, known to be involved in asthma
oxidative stress, seems to be increased in exacerbation state compared to stable state.
Furthermore, Omalizumab therapy promoted changes in the patient exhaled breath profile
over time, namely with the decrease of nonane, 2,2,4,6,6-pentamethylheptane, decane, 2-
methyldecane, dodecane, and tetradecane. Exhaled breath sampling combined with
comprehensive two-dimensional gas chromatography and multivariate feature extraction,
represents a non-invasive and rapid tool allowing the molecular data recovering, useful to
monitor the disease status as a part of the medical treatment or even its interruption, i.e., the
adherence to medication.

Chapter 2 - Exhaled breath analysis
120
2.5.2 Framework
Exhaled breath is a realistic matrix to be studied in asthma as it contains metabolites
whose relative concentrations may be altered by the disease81 echoing the metabolic activity
within the airways. The study of exhaled breath, known as breathomics, is an emerging
research field focused in health. Usually, method development is crucial and it finds a pattern
of metabolites related to the abnormal metabolic processes that occurs with the studied
disease86. The volatile analysis of exhaled breath analysis has captured interest in clinical
practice87, since it comprises thousands of volatile organic metabolites that are expelled with
each breath one exhale, making it a high potential non-invasive source for medical purposes
in lung related diseases, such as asthma, among others74. The exhaled breath volatile
composition has been relevant in this field shown by many studies that have been reported on
exhaled breath of asthmatic patients13.
The aim was to explore the potential of exhaled breath analysis in the aid of asthma
clinical management (diagnosis and monitoring) using non-invasive sampling methodologies
developed in our laboratory that combines the SPME with a high throughput technology such
as GC×GC-ToFMS in tandem with PLS-DA. Firstly, the applicability of the previous
developed breath metabolomics based models was done using a new cohort of asthmatic
children (n=49) attending on the secondary health care consultations. Also, the ability of
using these models of exhaled breath in a medical scenario was tentatively done to gauge the
clinical improvement of three children in an exacerbation condition, and to follow the
Omalizumab therapy effect on one patient with severe asthma. MCCV was applied to the
PLS-DA models to evaluate the sensitivity and specificity levels and to assess classification
model robustness.
2.5.3 Material and methods
Patients clinical history and samples collection schedule
A group of 49 children (4-18 years) with allergic asthma, from which 25 had allergic
asthma and allergic rhinitis, volunteered for this study. The 49 individuals correspond to a
total of 74 exhaled breath samples. The general traits of the patients are presented in Table
2.6.

Chapter 2 - Exhaled breath analysis
121
Table 2.6 - Traits of the allergic asthma population.
Allergic asthma (n=49)
Age and Gender
Age in years (range/median) 4-18/8
Gender (male/female) 28/21
Pathology
Allergic Asthma 24 (49%)
Allergic Asthma + Allergic Rhinitis 25 (51%)
Allergensa
Dust mite 26 (53%)
Dust mite + gramineae 11 (23%)
Gramineae 3 (6%)
Dust mite + cat fur + gramineae 2 (4%)
Dust mite + dog fur 1 (2%)
Dust mite + eucalyptus 1 (2%)
Dust mite + platan leaves 1 (2%)
Dust mite + olive tree pollen 1 (2%)
Gramineae + cat fur + dog fur 1 (2%)
Birch pollen 1 (2%)
Gramineae + weeds 1 (2%)
Therapy
CCS LTRA BRC ATH NCCS
x x x x x 1 (2%)
x x x - - 2 (4%)
x - x - - 5 (10%)
x x - - x 1 (2%)
x - x - x 1 (2%)
- x - - - 1 (2%)
x - - - - 4 (8%)
x x - - - 7 (15%)
x - - x - 1 (2%)
- - - x - 1 (2%)
- x - x x 4 (8%)
- - x - x 1 (2%)
- - - x x 8 (17%)
- x - x - 3 (6%)
- x - - x 3 (6%)
No therapy 6 (12%)
a Results obtained by prick-tests

Chapter 2 - Exhaled breath analysis
122
Usually, each individual corresponds to one breath sample; nevertheless, some
volunteers had some pertinent asthma conditions that were further studied, and hence, for that
reason were sampled in different moments: i) all patient were analysed in asthma stable state,
ii) three patients were analysed in stable state and in asthma exacerbation condition, and iii)
Omalizumab therapy adherence was follow-up just for one patient.
The group of three patients studied under stable and exacerbation condition included a
5 years old male Caucasian child that had never taken an asthma drug and was diagnosed by
physicians with allergic asthma and rhinitis based on symptoms history and skin prick tests
were performed being positive for dust mites and gramineae. After the first consult, this child
was prescribed a combination of corticosteroids anti-histamine, a nasal corticosteroid and a
bronchodilator (when in exacerbation). A 7 years old female Caucasian child diagnosed with
allergic asthma with skin prick tests positive for dust mites, cat and dog fur and using a
combination of corticosteroids and bronchodilator (when in exacerbation) was recruited to
follow the disease status throughout 3 months, from a exacerbation situation to a controlled
asthma status. For this patient the effect of nebulisation (salbutamol) was also verified with
two exhaled breath samples being collected before and after the nebulisation procedure. Also,
a child whose exhaled breath was collected over a three year period was a 12 years old female
Caucasian diagnosed with allergic asthma and rhinitis. The allergen, determined by skin prick
tests and confirmed by allergen-specific Immunoglobulin E blood test, that this child is
sensitized to are dust mites and the prescribed medication is a combination of leukotriene
receptor antagonist, corticosteroids and bronchodilator (when in exarcebation).
For the Omalizumab study, a recruited patient was an 18 years old female white
Caucasian diagnosed by physicians with severe persistent asthma and rhinitis. Skin prick tests
were performed and showed sensitization to dust mites (Dermatophagoides farinae), storage
mites (Lepidoglyphus destructor) and grass pollens (Dactylis glomerata, Festuca elatior,
Loliumperenne, Phleum pratense, Poa pratensis). Appropriate therapy was prescribed
associating inhaled fluticasone/salmeterol (500/100 µg/daily), and as rescue therapy
salbutamol (400 to 1200 µg/daily). To control rhinitis symptoms 5 mg desloratadine/daily
budesonide nasal spray and 64 µg/daily was prescribed. As the severe asthma symptoms
persisted, although subcutaneous specific immunotherapy and corticosteroids in higher doses
were performed, 600 mg of Omalizumab was initiated and administered fortnightly via
subcutaneous in the deltoid region of both arms and both anterior thighs. In this case, exhaled
breath collection (two samples each time) started 4 months after the Omalizumab therapy
initiation. Omalizumab therapy was performed in accordance to physician prescription, i.e.,

Chapter 2 - Exhaled breath analysis
123
twice a month, until the first six months and half. After that period until the last collection
(20th month), the therapy was performed intermittently due to the fact that the patient was not
compliant, and only performed 13 out of 26 treatments. Each child was doing their specific
therapy and was in different clinical conditions. Also, the time of day at which samples were
collected was variable (depending on the moment of the medical consultation) and there were
no dietary or pharmacologic restrictions, as these conditions are more representative of the
reality demonstrating the applicability of the developed methodologies in the clinical context.
Breath sampling and analysis
Exhaled breath was collected in 1 L Tedlar® bags. The breath sampling parameters
are reported in Chapter 2.1. At each sampling moment, the patient was asked to cleanse her
mouth with water before sampling. Subsequently, the patient was instructed to inhale and
exhaled normally and then exhale deeply using a disposable mouthpiece into the Tedlar® bag
previously holding her breath for ca. 5s. As breath samples were not CO2-controlled, each
breath represents a single mixed expiratory sample, and was analysed once. The SPME fibre
(DVB/CAR/PDMS) was introduced in the Tedlar® sampling bag for 60 min, at 22 ºC to
extract breath metabolites. Following the extraction procedure, the SPME fibre was retracted
from the bag and inserted into the GC×GC-ToFMS injection port. The instrumental details were
described in Chapter 2.2. Briefly, GC×GC–ToFMS LECO Pegasus 4D (LECO, St. Joseph, MI,
USA) consists of an Agilent GC 7890A gas chromatograph (Agilent Technologies, Inc.,
Wilmington, DE), with a dual stage jet cryogenic modulator (licensed from Zoex) and a
secondary oven, and mass spectrometer equipped with a high resolution ToF analyzer. An HP-5
column (30 m × 0.32 mm I.D., 0.25 µm film thickness, 5% Phenyl-methylpolysiloxane, J&W
Scientific Inc., Folsom, CA, USA) was used as 1D column (first dimension) and a DB-FFAP
(0.79 m × 0.25 mm I.D., 0.25 µm film thickness, nitroterephthalic acid modified polyethylene
glycol, J&W Scientific Inc., Folsom, CA, USA) was used as 2D column (second dimension).
The carrier gas was helium at a constant flow rate of 2.50 mL/min. The GC×GC–ToFMS
injection port was at 250 °C. The primary oven temperature program was: initial temperature 35
ºC (hold 1 min), raised to 40 ºC (1 ºC/min), and finally rose to 220 ºC (7 ºC/min) and hold for 1
min. The secondary oven temperature program was 15 ºC offset above the primary oven. The
MS transfer line temperature was 250 ºC and the MS source temperature was 250 ºC. A 6 s
modulation time with a 30 ºC secondary oven temperature offset (above secondary oven) was
chosen. The ToFMS was operated at a spectrum storage rate of 125 spectra/s. The mass

Chapter 2 - Exhaled breath analysis
124
spectrometer was operated in the EI mode at 70 eV using a range of m/z 35-350 and the detector
voltage was -1695 V. The GC×GC area data was used as an approach to estimate the relative
content of each volatile component of exhaled breath.
Multivariate Analysis
PLS-DA8 is a widely used procedure for classification purposes, where the MCCV
framework was used to assess the predictive power and classification models robustness. The
PLS-DA models previously developed (Chapter 2.2) for distinction between asthmatic and
healthy children were used as starting-point for prediction purposes in this study. The MCCV
had a classification rate of 96%, and showed 98% of sensitivity (∼ 2% allergic asthma
children being misclassified as controls) and 93% of specificity ∼7% of false positives). For
the projection purposes, a dataset comprising 130 metabolites (Table S1 in Appendix) and a
data set of 9 metabolites (nonane, 2,2,4,6,6-pentamethylheptane, decane, 2-methyldecane,
dodecane, tetradecane, nonanal, decanal, and dodecanal), previously established in Chapter
2.2 as relevant for asthma diagnosis were used. The projections were performed for both
datasets 130 and 9 metabolites tentatively identified by HS-SPME/GC×GC-ToFMS, using the
previously developed and validated PLS-DA models (Chapter 2.4), by applying the regression
models to new dataset of 62 asthmatic children breath samples (corresponding to 49
individuals) to obtain the response variable. Each sample was mean normalized and UV (unit
variance) scaled.
Model robustness was assessed using MCCV with 500 iterations. 60 % of the data
comprised the calibration set whilst the remaining 40% were the validation set. Then, each
iteration, with randomly changed composition of the calibration and validation sets,
performed internal cross validation of the calibration set using seven blocks and prediction of
class membership for samples in the validation set. For each of the 500 randomly generated
classification models, the number of LVs, the Q2 (expressing the cross-validated explained
variability), and the confusion matrix was computed. The selection of model complexity was
based on the most frequent list of model properties that maximizes the predictive power (i.e.,
lower LV and higher Q2). The sensitivity and the specificity of the model were then depicted
from the confusion matrix resulting into a ROC space to further assess the results
significance. Then, the same procedure was applied using permuted class membership.
Sensitivity is calculated from the ratio between true positives (asthma samples correctly

Chapter 2 - Exhaled breath analysis
125
predicted) and the total number of modelled breath samples, whereas specificity is determined
from the ratio between true negatives (control samples correctly predicted) and the total
number of modelled control GC×GC data.
2.5.4 Results and Discussion
PLS-DA model prediction: applicability of developed breath metabolomics based model
Taking into consideration the previous developed breath metabolomics based model in
chapter 2.4, a new group of children with asthma (coded as Asthma Projection) was studied
and the robustness of the developed classification model was confirmed (Figure 2.14 A).
Figure 2.14 – (A) Projection of new exhaled breath dataset using the breath metabolomics based model of chapter 2.4 for asthmatic and healthy children and (B) validation of the obtained results Q2 values distribution of the original and permuted MCCV (1000 permutations).
0%
5%
10%
15%
20%
25%
30%
35%
40%
45%
-1 -0.9 -0.8 -0.7 -0.6 -0.5 -0.4 -0.3 -0.2 -0.1 0 0.1 0.2 0.3 0.4 0.5 0.6 0.7 0.8 0.9 1
Freq
uenc
y (%
)
Q2 valuesModel Permutation
(A)
(B)
-20
-15
-10
-5
0
5
10
15
-15 -10 -5 0 5 10 15 20
LV2
(16%
)
LV1 (18%)Asthma Control Asthma Projection

Chapter 2 - Exhaled breath analysis
126
Using a full dataset, scores scatter plot (Figure 2.14 A) shows that the healthy group is
associated to LV1 negative values whereas the asthma group is mainly linked to positive LV1
values. The new set of 49 asthmatic children were projected mainly along the LV1 positive
values, close to model asthma children population.
The validation of PLS-DA models has been thoroughly studied to verify the quality of
the obtained discrimination models88. Due to the large number of variables, the chance of
false correlations and the risk of overfit are high89. Several diagnostic tools have been
developed, among them cross validation, such as MCCV, first reported by Cook90 and tested
for chemometric purposes by Xu and Liang91. MCCV can avoid an unnecessary large model
and therefore decreases the risk of over-fitting for the calibration model. MCCV splits the
data into a learning set or a test set and the model developed on the learning set and the error
evaluated in the test set. The test set estimates are averaged over the learning-testing random
splits and each case only appears in the learning set or the test set, but not in both92. MCCV is
used in assessing the robustness and accuracy of PLS-DA models being used in different
fields93,94,95. It has been reported that MCCV is a valuable and effective tool in estimating
model complexity91. According to MCCV statistics for projection analysis (figure 1b), the
PLS-DA model had a classification rate of 98%, showed 100% sensitivity (no asthmatic
children being misclassified as controls) 93% specificity (∼7% of false positives) The
prediction error measure Q2 is based on the evaluation of the error between the predicted
categorical variable ŷ and the known y. It focuses on how well the class label can be predicted
from new data depending on class separation but also on within class variability88. The most
frequent Q2 value in MCCV statistics was around 0.9 whilst the model Q2 was 0.8. In spite the
addition of new asthmatic exhaled breath samples, the classification rate and most frequent Q2
values were the same and the sensitivity increased by 4%. However, the specificity decreased
by 2% when compared with the previously developed model. Despite these asthmatic children
presented a stable asthma status, this group is relatively heterogeneous since it contains
patients with severe and non-severe asthma, also different therapies were considered, which
may explain the dispersion of the data along LV1.
Using the sub-set of 9 compounds reported in chapter 2.4 as relevant for asthma
diagnosis, it was observed that the asthmatic children were projected mainly in LV1 positive
(Figure 2.15 A), close to model asthma children population. According to MCCV statistics for
projection analysis (Figure 2.15 B), the PLS-DA model had a classification rate of 96% and
showed 96% sensitivity (∼ 4% allergic asthma children being misclassified as controls) and

Chapter 2 - Exhaled breath analysis
127
96% specificity (∼4% of false positives). The most frequent Q2 value was around 0.7 with a
large prevalence of values in the range of 0.6-0.8 whilst the model Q2 was 0.7. Comparing
these results with the previously reported method we observed that the classification rate was
identical, a decrease in sensitivity by 2% and an increase of 3% in specificity. The most
frequent Q2 value decreased as the previously reported value was 0.8. The high predictive
power and robustness of these results and those obtained for the previous data projection
(Figure 2.15 B) suggest that confounding factors, such as, ambient air, gender or age seems to
have a low or even no influence in the discrimination power.
Figure 2.15 – (A) Projection of new exhaled breath dataset using the breath metabolomics based model of chapter 2.4 using a sub-set of 9 compounds (nonane, 2,2,4,6,6-pentamethylheptane, decane, 2-methyldecane, dodecane, tetradecane, nonanal, decanal, and dodecanal) and (B) validation of the obtained results Q
2 values distribution of the original and permuted MCCV (1000 permutations).
0%
5%
10%
15%
20%
25%
30%
35%
40%
-1 -0.9 -0.8 -0.7 -0.6 -0.5 -0.4 -0.3 -0.2 -0.1 0 0.1 0.2 0.3 0.4 0.5 0.6 0.7 0.8 0.9 1
Fre
quen
cy (%
)
Q2 valuesModel Permutation
(A)
(B)
-5
-4
-3
-2
-1
0
1
2
3
-3 -2 -1 0 1 2 3
LV2
(25%
)
LV1 (27%)Asthma Control Asthma Projection

Chapter 2 - Exhaled breath analysis
128
Also, Figures 2.16 A and 2.16 B show that the main factor that explains the classes
discrimination is the disease versus healthy condition, and within each class, individuals with
different age or breath collected at different location are represented, indicating that these
possible confounding factors seem not be relevant.
Figure 2.16- PLS-DA LV1×LV2 scores scatter plot of exhaled breath for asthmatic and healthy children using a data set with 130 compounds coloured according to (A) age range (3 to 5 years old, 6 to 9 years old and 10 to 16 years old) and (B) according to exhaled breath collection site demonstrating no influence on the discrimination. Figures based on metabolomic PLS-DA based models previously developed.
-20
-15
-10
-5
0
5
10
15
-15 -10 -5 0 5 10 15 20LV
2 (1
4%)
LV1(16%)
Control3-5 Control 6-9 Asthma 3-5 Asthma 6-9 Asthma 10-16
The samples were colored according to different age range
-20
-15
-10
-5
0
5
10
15
-15 -10 -5 0 5 10 15 20LV
2 (1
4%)
LV1(16%)
Control location 1 Control location 2 Asthma location 1 Asthma location 2
(A)
(B)

Chapter 2 - Exhaled breath analysis
129
Asthma clinical management through breath analysis: exacerbation condition
The ability of the developed models was tested regarding a relevant condition for the
asthma clinical management, i.e., the disease state evaluation (stable state versus exacerbation
condition). Exacerbation condition may promote several lung damages, and the evaluation
and understanding of the alterations associated represent a significant improvement in the
asthma management. Breath from an asthmatic child (IND) was collected throughout three
years, corresponding to 10 breath samples, and Figure 2.17 A represents the volatile
composition of six alkanes, that characterize asthma population, on those 10 sampling
moments. These data were normalized against the median of the corresponding data of the
healthy group. Figure 2.17 B depicts the plot of the predict Y-value (data from model plus 10
breath samples projection) obtained from built PLS-DA model, against the reference Y-value
(group classification, 0 for healthy and 1 for asthmatic population).
According to Figure 2.17 A, slight variations were observed throughout this period of
time. Relevant changes may be noticed when the child was in exacerbation, highlighting
mainly the alterations on the relative content of nonane, decane and 2-methyldecane.
Nevertheless when observing the predicted Y values from figure 2.17 B we can verify that
these breath samples are still included in the asthma group, suggesting that despite the intra-
individual variability observed, the asthma pathology superimposes the intra-individual
variability that might occur due to all external factors that cannot be controlled. These results
also showed that alkane levels increased in exacerbation condition compared to control state,
indicating the inflammation and lipid peroxidation are associated to this condition, as
previously reported by Loureiro et al. 96.

Chapter 2 - Exhaled breath analysis
130
Figure 2.17 – (A) Alkane variations for 10 breath samples collected for three years in the same asthmatic child based on the built PLS-DA model with two LVs and (B) predicted Y value against reference Y value behavior. a.u. arbitrary units.
To verify the usefulness of the methodology under study, two other case-studies were
evaluated. Breath samples of two children in exacerbation (E1 and E2) were sampled in
different sampling moments. Stable state (S1 and S2) exhaled breaths were also collected. As
verified in Figure 2.18, both patients showed an evolution along LV1 axis from an asthmatic
volatile profile toward the healthy group.
-0.4
-0.2
0.0
0.2
0.4
0.6
0.8
1.0
1.2
1.4
0 1
Pre
dict
ed Y
Reference Y
Asthma Control IND
(B)7th to 10th
collecting moments
0.0
5.0
10.0
15.0
20.0
25.0
30.0
Nor
mal
ized
Pea
k A
reas
(a.
u.)
Sampling moments
Nonane 2,2,4,6,6-Pentamethylheptane Decane 2-Methyldecane Dodecane Tetradecane
exarcebation statestable state
(A)

Chapter 2 - Exhaled breath analysis
131
Figure 2.18 - PLS-DA LV1×LV2 scores scatter plot of exhaled breath for asthmatic and healthy children using the 9 compounds subset and projection of new exhaled breath dataset (state sate and exacerbation conditions for two patients). The path of two children in exacerbation condition (E) and stable state (S) is shown, through different sampling times. E1 and E2 are the initial exhaled breath samples: S1 exhaled breath was collected twice: 1 month and half and 3 months and nine days after the initial samples. S2 was collected 3 months and half later after the initial sampling
The volatile composition behaviour was accompanied by the clinical improvement of
both patients with treatment administration. Considering the breath profile, it was observed a
relative area reduction of the alkanes. E1 exhaled breath was collected twice (separated by an
hour from each other) in the first consult as a nebulisation procedure (only using salbutamol)
was performed. It was found that, although from a clinical stand-point there was a slight
improvement, the breath samples had similar composition leading to the conclusion that
although the improvement of the patient clinical status, the biochemical processes inherent to
asthma change slowly and herein there are no differences in the exhaled breath composition
that was collected.
Omalizumab therapy adherence: Evaluation of breath sampling relation and patient’s clinical
status
Patients with severe persistent asthma are at high risk of serious exacerbations and
asthma-related mortality and treatment with Omalizumab has shown a significant reduction of
-5
-4
-3
-2
-1
0
1
2
3
-3 -2 -1 0 1 2 3
LV1 27%)
LV
2 (2
5%)
AsthmaControlPatient path from exacerbation to stable state
E1
E2
S1
S1S2

Chapter 2 - Exhaled breath analysis
132
asthma exacerbations and emergency visits97. The recruited patient was an 18 years old white
Caucasian female diagnosed by physicians with severe persistent asthma and rhinitis.
Omalizumab therapy was proposed, as the patient severe asthma status was persistent and
respiratory function deterioration was observed. The response to this therapy was assessed by
symptoms severity and frequency, such as exacerbations, emergency room visit/unscheduled
consultations, medication increase and school absenteeism. Figure 2.19 A shows the
Omalizumab therapy monthly frequency monitoring and Figure 2.19 B represents the PLS-
DA LV1×LV2 scores scatter plot of exhaled breath for asthmatic and healthy children
highlighting the path of the severe asthma patient throughout the therapy.
Figure 2.19 - (A) Omalizumab therapy monthly frequency monitoring and (B) PLS-DA LV1×LV2 scores scatter plot of exhaled breath for asthmatic and healthy children using a sub-set of 9 compounds. Path of the severe asthma patient is highlighted - A through F sampling moments: 4 months (a), 4 months and half (b), 6 months (c), 6 months and half (d), 17 months (e), and 20 months (f) after Omalizumab initial treatment
-5
-4
-3
-2
-1
0
1
2
3
-3 -2 -1 0 1 2 3
LV
2 (2
5%)
LV1 (27%)
Asthma Control Severe asthma patient
ab
c
d
e
f
(B)
0
1
2
1 2 3 4 5 6 7 8 9 10 11 12 13 14 15 16 17 18 19 20
Mon
thly
ther
apy
freq
uen
cy
Therapy time (months)
a,b c,d e
f
Dispnea, emergency room visit & higher dosage
prescribed medication
(A)
*
*
*-
Prescribed Omalizumab intake frequency

Chapter 2 - Exhaled breath analysis
133
There was a significant improvement in the clinical status of the patient by the second
month of Omalizumab therapy and there was no need to use the prescribed corticosteroid
medication, β−2-agonist, and the patient did not attend the emergency room. However, there
was an irregular adherence to Omalizumab therapy from the sixth month and half, and for the
subsequent two months whilst between the tenth and twelfth month no therapy was performed
(Figure 2.19 A). During this period, there was a progressive deterioration of health status with
daily episodes of breathlessness, and the prescribed medication had to be used in higher
dosages (preventive β−2-agonist and an inhaled corticosteroid). Also, during this period the
patient had to go to the emergency room for treatment. The same behaviour was observed in
the nineteenth month, with the patient not adhering to treatment and this reflected in a
deterioration of the health status and an emergency room visit on the twentieth month (Figure
2.19 A.
The patient was in the twentieth month of Omalizumab therapy, and the irregularity in
which therapy is performed, affects the outcome with progressive deterioration of the patient
health status with subsequent aggravation in symptoms severity and frequency. In the periods
that the patient adhered to medication there was clinical improvement without nocturnal
exacerbation or effort dyspnea, an improvement of rhinitis symptoms and from the respiratory
point of view there is a slight functional improvement.
The hypothesis was to verify if the effect of the therapy on the clinical status could be
followed through exhaled breath analysis. Using the developed model reported in Chapter 2.4
that included the screening of 9 compounds associated to oxidative stress, a prediction was
made and a interesting result is observed by the path of the patient (Figure 2.19 B, a through f
– six breath sampling), in which Omalizumab intake can be followed throughout LV1 axis.
For the first four and half months, this patient had an asthmatic volatile profile and then after
six months of therapy her volatile profile converged towards a control volatile signature. This
behaviour was also accompanied by a clinical improvement throughout this period. The
tendency along LV1 axis with treatment administration can be explained by the relative area
reduction of all alkanes, with a higher prevalence for nonane, decane and 2-methyldecane.
These alkanes are an indication of oxidative stress and subsequently lipid peroxidation and
the decrease may be due to a reduced inflammation state of this subject leading to lower
relative amount of these compounds. After seventeen and twenty months of treatment (Figure
2.19 B, e and f), a pathway relapse was observed in the patient behaviour (irregular adherence
to Omalizumab therapy). The patient missed several treatments; however it was possible to
confirm this behaviour based on the exhaled breath composition. The alkanes signal

Chapter 2 - Exhaled breath analysis
134
increased, mostly by dodecane. According to LV1, the patient distanced herself from the
healthy group (Figure 2.19 B) and from a clinical point-of-view the patient health status
deteriorated. These results show the potential applicability of exhaled breath in the clinical
practice for drug follow-up and health status monitoring showing inflammatory changes that
current physiologic or functional tests might not always reflect.
2.5.5 Concluding remarks
Multivariate analysis of exhaled breath sampling combined with two-dimensional gas
chromatography based methodology represents a non-invasive and rapid (ca. 2 hours) tool
allowing the recovery of molecular data, useful for diagnosis and monitoring asthma. The
results obtained using the breath metabolomics based models reported in Chapter 2.4
confirmed the usefulness of this methodology. Breath metabolic composition was highly
altered in asthmatic population compared to healthy ones used as control. Also, relevant
changes may be noticed in the exacerbation condition compared to the stable state, and the
Omalizumab therapy also promoted modifications on breath metabolomics. Indeed, the
alkanes and aldehydes profile indicate an oxidative state and have been found consistently
altered in asthmatic population. Within this population, in the exacerbated state compared to
the stable condition the behaviour is similar. The prospect to follow-up the individual
response was very interesting, as it unlocks potentialities as the therapy evaluation and
adjusting. For instance, it was observed for the child with severe asthma that only the
fortnightly Omalizumab therapy intake promoted the decrease of inflammation and oxidative
stress level. The clinical observations are in accordance to the breath alkane pattern.
Although requiring validation using a much larger sample cohort, these results clearly
show the potential of this methodology for future clinical assessments, allowing timely
therapeutic approaches and/or future antioxidant therapies to prevent the broad damaging
effects associated to asthma. The obtained results support the up-rising issue of personalized
medicine and the implementation of this methodology in a hospital laboratory, as well as, the
use of exhaled breath in clinical settings could be easily achieved.

Chapter 2 - Exhaled breath analysis
135
2.6 References (1) Lim M. D., Dickherber A., Before you analyze a human specimen, think quality, variability, and bias. Anal.
Chem. (2011) 83 8-13. (2) Pauling L., Robinson A.B., Teranishi R., Cary P., Quantitative analysis of urine vapor and breath by gas-
liquid partition chromatography. Proc. Natl. Acad. Sci. (1971) 68: 2374-2376. (3) Ligor T., Ligor M., Amann A., Ager C., Bachler M., Dzien A., Buszewski B., The analysis of healthy
volunteers' exhaled breath by the use of solid-phase microextraction and GC-MS. J. Breath Res. (2008) 2: 046006.
(4) Schwarz K., Filipaik W., Amann A., J. Breath Res., Determining concentration patterns of volatile compounds in exhaled breath by PTR-MS. (2009) 3: 027002.
(5) Mashir A., Dweik R.A., Exhaled breath analysis: The new interface between medicine and engineering. Adv. Powder Technol. (2009) 20: 420-425.
(6) Mochalski P., Wzorek B., Sliwka I., Amann A., Suitability of different polymer bags for storage of volatile sulphur compounds relevant to breath analysis. J. Chromatogr. B, (2009) 877: 189-196.
(7) Van Berkel J.J., Dallinga J.W., Moller G-M., Godschalk R.W.L., Moonen E., Wouters E.F.M., Van Schooten F.J., Development of accurate classification method based on the analysis of volatile organic compounds from human exhaled air. J. Chromatogr. B. (2008) 861: 101-107.
(8) Eriksson, L., Johansson, E., Kettaneh, N., Wold, N., Wold, S., Multi and Megavariate Data Analysis, Principles and Applications (2001) Umetrics AB Umea, Sweden.
(9) Song G., Qin T., Liu H., Xu G.B., Pan Y.P., Xiong F.X., Gu K.S., Sun G.P., Chen Z.D., Quantitative breath analysis of volatile organic compounds of lung cancer patients. (2010) Lung Cancer 67: 227-231
(10) Gaspar E.M., Lucena A.F., da Costa J. D., das Neves H. C., Organic metabolites in exhaled human breath--a multivariate approach for identification of biomarkers in lung disorders. J. Chromatogr. A, (2009) 1216: 2749-2756.
(11) Yu H., Xu L., Wang P., Solid phase microextraction for analysis of alkanes and aromatic hydrocarbons in human breath. J. Chromatogr. B, (2005) 826: 69 -74.
(12) Steeghs M., Cristescu S., Harren F.J., The suitability of Tedlar bags for breath sampling in medical diagnostic research. Physiol. Meas. (2007) 28: 73-84.
(13) Dallinga J.W., Robroeks C.M., Van Berkel J.J., Moonen E. J.C., Godschalk R.W.L., Jobsis Q., Dompeling E., Wouters E.F.M., Van Schooten F.J., Volatile organic compounds in exhaled breath as a diagnostic tool for asthma in children. Clin. Exp. Allergy., (2009) 40: 68-76
(14) Filipiak W., Sponring A., Filipiak A., Ager C., Schubert J., Miekisch W., Amann A., Troppmair J., TD-GC-MS analysis of volatile compounds of human lung cancer and normal cells in vitro. Cancer Epidemiol Biomarkers Prev. (2010) 19: 182-195.
(15) Bajtarevic A., Ager C., Pienz M., Klieber M., Schwarz K., Ligor M., Ligor T., Filipiak W., Denz H., Fiegl M., Hilbe W., Weiss W., Lukas P., Jamnig H., Hackl M., Haidenberger A., Buszewski B., Miekisch W., Schubert J., Amann A., Noninvasive detection of lung cancer by analysis of exhaled breath. BMC Cancer(2009) 9: 348
(16) Phillips M., Cataneo R.N., Ditkoff B.A., Fisher P., Greenberg J., Gunawardena R., Kwon C.S., Rahbari-Oskoui F., Wong C., Volatile markers of breast cancer in the breath. The Breast Journal (2003) 9: 184-191.
(17) Roebroeks C.M., van Berkel J.J., Dallinga J., Jobsis Q., Zimmermann L., Hendriks H., Wouters M., Grinten C., Kant K., Schooten F., Dompeling E., Metabolomics Of Volatile Organic Compounds In Cystic Fibrosis Patients and Controls. Ped. Res. (2010) 68: 75-80
(18) Barker M., Hengst M., Schmid J., Buers H-J., Mittermaier B., Klemp D., Koppmann R., Volatile organic compounds in the exhaled breath of young patients with cystic fibrosis. Eur. Respir. J. (2006) 27: 929-936.
(19) Horváth I., Lázár Z., Gyulai N., Kollai M., Losonczy G., Exhaled biomarkers in lung cancer Eur. Respir. J. (2009) 34: 261-275.
(20) Górecki T., Panić O., Oldridge N., Recent advances in comprehensive two-dimensional gas chromatography (GC × GC). J. Liq. Chromatogr. Rel. Tech. (2006) 29: 1077-1104.
(21) Marriott P., Shellie R., Principles and applications of comprehensive two-dimensional gas chromatography. Trend. Anal. Chem. (2002) 21: 573-583.
(22) Shellie R., Marriott P.J., Morrison P., Concepts and preliminary observations on the triple-dimensional analysis of complex volatile samples by using GC× GC-TOFMS. Anal. Chem. (2001) 73: 336-1344.
(23) Marczin N., Kharitonov S.A., Yacoub M.H., Barnes P.J., Disease Markers in Exhaled Breath. (2005) Taylor&Francis, New York, pp 220.

Chapter 2 - Exhaled breath analysis
136
(24) Mochalski P., Wzorek B., Sliwka I., Amann A., Suitability of different polymer bags for storage of volatile
sulphur compounds relevant to breath analysis. J. Chromatogr. B (2009) 877: 189-196. (25) Dallüge J., Beens J., Brinkman U.A.T., Comprehensive two-dimensional gas chromatography: a powerful
and versatile analytical tool. J. Chromatogr. A 1000 (2003) 69-108. (26) Mondello L., Tranchida P.Q., Dugo P., Dugo G., Comprehensive two-dimensional gas chromatography-
mass spectrometry: a review. Mass Spectrom. Rev. (2008) 27: 101-124. (27) Engel E., Baty C., LeCorre D., Souchon I., Martin N., Flavor-active compounds potentially implicated in
cooked cauliflower acceptance. J. Agric. Food Chem. (2002) 50: 6459-6467. (28) Ciccioli P., Brancaleoni E., Cecinato A., Sparapani R., Frattoni M., Identification and determination of
biogenic and anthropogenic volatile organic compounds in forest areas of northern and southern Europe and a remote site of the Himalaya region by high-resolution gas chromatography-mass spectrometry J. Chromatogr. A (1993) 643: 55-69.
(29) Wu S., Zorn H., Krings U., Berger R.G., Volatiles from submerged and surface-cultured beefsteak fungus, Fistulina hepatica. Flavour Fragr. J. (2007) 22: 53-60.
(30) Xu X., van Stee L.L.P., Williams J., Beens J., Adahchour M., Vreuls R.J.J., Brinkman U.A.T., Comprehensive two-dimensional gas chromatography (GC × GC) measurements of volatile organic compounds in the atmosphere. Atmos. Chem. Phys. (2003) 3: 665-682.
(31) Quijano C.E., Salamanca G., Pino J.A., Aroma volatile constituents of Colombian varieties of mango (Mangifera indica L.). Flavour Fragr. J. (2007) 22: 401-406
(32) Courtois E.A., Paine C.E., Blandinieres P.A., Stien D., Bessiere J., Houel E., Baraloto C., Chave J., Diversity of the volatile organic compounds emitted by 55 species of tropical trees: a survey in French Guiana. J. Chem. Ecol. (2009) 35: 1349-1362.
(33) Ramarathnam N., Rubin L.J., Diosady L.L., Studies on meat flavor. 3. A novel method for trapping volatile components from uncured and cured pork, J. Agric Food Chem. (1993) 41: 933-938.
(34) Ramarathnam N., Rubin L.J., Diosady L.L., Studies on meat flavor. 4. Fractionation, characterization, and quantitation of volatiles from uncured and cured beef and chicken. J. Agric. Food Chem. (1993) 41: 939-945.
(35) Alissandrakis E., Kibaris A.C., Tarantilis P.A., Polissiou P.C., Flavour compounds of Greek cotton honey. J. Sci. Food Agric. (2005) 85: 1444-1452.
(36) Zaikin V.G., Borisov R.S., Chromatographic-mass spectrometric analysis of Fischer-Tropsch synthesis products J. Anal. Chem. (2002) 57: 544-551.
(37) Pino J.A., Mesa J., Muñoz Y., Martí M.P., Marbot R., Volatile components from mango (Mangifera indica L.) cultivars. J. Agric. Food Chem. (2005) 53: 2213-2223.
(38) Flamini G., Tebano M., Cioni P.L., Bagci Y., Dural H., Ertugrul K., Savran A., A multivariate statistical approach to Centaurea classification using essential oil composition data of some species from Turkey Pl. Syst. Evol. (2006) 261: 217-228.
(39) Wang Z., Fingas M., Li K., Fractionation of a Light Crude Oil and Identification and Quantitation of Aliphatic, Aromatic, and Biomarker Compounds by GC-FID and GC-MS, Part II J. Chromatogr. Sci (1994) 32: 361-382.
(40) Macku C., Shibamoto T., Volatile sulfur-containing compounds generated from the thermal interaction of corn oil and cysteine. J. Agric. Food Chem. (1991) 11: 1987-1989.
(41) Zhang X., Ding L., Sun Z., Song L., Sun T., Study on quantitative structure-retention relationships for hydrocarbons in FCC gasoline. Chromatographia (2009) 70: 511-518.
(42) Jarunrattanasri A., Theerakulkait C., Cadwallader K.R., Aroma components of acid-hydrolyzed vegetable protein made by partial hydrolysis of rice bran protein. J. Agric. Food Chem. (2007) 55: 3044-3050.
(43) Hazzit M., Baaliouamer A., Faleiro M.L., Miguel M.G., Composition of the essential oils of Thymus and Origanum species from Algeria and their antioxidant and antimicrobial activities. J. Agric. Food Chem. (2006) 54: 6314-6321.
(44) Rostad C.E., Pereira W.E., Kovats and Lee retention indices determined by gas chromatography/mass spectrometry for organic compounds of environmental interest. J. Hi. Res. Chromatogra. & Chromatogr. Comm. (1986) 9: 328-334.
(45) Insausti K., Goñi V., Petri E., Gorraiz C., Beriain M.J., Effect of weight at slaughter on the volatile compounds of cooked beef from Spanish cattle breeds. Meat Sci. (2005) 70: 83-90.
(46) Flamini G., Cioni L., Morelli I., Essential oils of Galeopsis pubescens and G. tetrahit from Tuscany (Italy) Flavour Fragr. J. (2004) 19: 327-329.
(47) Singer R.B., Flach A., Koehler S., Marsaioli A.J., Amaral M.C.E., Sexual Mimicry in Mormolyca ringens (Lindl.) Schltr. (Orchidaceae: Maxillariinae). Ann. Bot. Rome (2004) 93: 755-762.

Chapter 2 - Exhaled breath analysis
137
(48) Maccioni S., Baldini R., Cioni P., Tebano M., Flamini G., In vivo volatiles emission and essential oils from
different organs and pollen of Cistus albidus from Caprione (Eastern Liguria, Italy). Flavour Fragr. J. (2007) 22: 61-65.
(49) Gómez E., Ledbetter C.A., Hartsell P.L., Volatile compounds in apricot, plum, and their interspecific hybrids. J. Agric. Food. Chem. (1993) 41: 1669-1676.
(50) Zeng Y.X., Zhao C.X., Liang Y.Z., Yang H., Fang H.Z., Yi L.Z., Zeng Z.D., Comparative analysis of volatile components from Clematis species growing in China. Anal. Chim. Acta (2007) 595: 328-339.
(51) Berdague J.L., Denoyer C., Wuéré J.L., Sermon E., Volatile compounds of dry-cured ham. J. Agric. Food Chem. (1991) 39: 1257-1261.
(52) Asuming W.A., Beauchamp P.S., Descalzo J.T., Dev B.C., Dev V., Frost S., Ma C.W., Essential oil composition of four Lomatium Raf. species and their chemotaxonomy. Biochem. Syst. Ecol. (2005) 33: 17-26.
(53) Celik S., Gokturk R.S., Flamini G., Cioni P.L., Morelli I., Essential oils of Phlomis leucophracta, Phlomis chimerae and Phlomis grandiflora var. grandiflora from Turkey. Biochem. Syst. Ecol. (2005) 33: 617-623.
(54) Flamini G., Tebano M., Cioni P.L., Volatile emission patterns of different plant organs and pollen of citrus limon. Anal. Chim. Acta (2007) 589: 120-124.
(55) Widmer H., Gas chromatographic identification of hydrocarbons using retention indices. J. Gas Chromatogr. (1967) 5: 506-510.
(56) Quijano C.E., Salamanca G., Pino J.A., Aroma volatile constituents of Colombian varieties of mango (Mangifera indica L.). Flavour Fragr. J. (2007) 22: 401-406.
(57) Kallio M., Jussila M., Rissanen T., Antilla P., Hartonen K., Reissel A., Vreuis R., Adahchour M., Hyotylainen T., Comprehensive two-dimensional gas chromatography coupled to time-of-flight mass spectrometry in the identification of organic compounds in atmospheric aerosols from coniferous forest. J. Chromatogr. A (2006) 1125: 234-243.
(58) Lai W.C., Song C., Temperature-programmed retention indices for gc and gc-ms analysis of coal-and petroleum-derived liquid fuels. Fuel (1995) 37: 1436-1451.
(59) Rembold H., Wallner P., Nitz S., Kollmannsberger H., Drawert F., Volatile components of chickpea (Cicer arietinum L.) seed. J. Agric. Food Chem. (1989) 37: 659-662.
(60) Alissandrakis E., Tarantilis P.A., Harizanis P.C., Polissiou M., Comparison of the volatile composition in thyme honeys from several origins in Greece. J. Agric. Food Chem. (2007) 55: 8152-8157.
(61) Flamini G., Cioni P., Morelli I., Composition of the essential oils and in vivo emission of volatiles of four Lamium species from Italy: L. purpureum, L. hybridum, L. bifidum and L. amplexicaule, Food Chem. (2005) 91: 63-68.
(62) Kenig F., Simons D.J.H., Crich D., Cowen J.P., Ventura G.T., Rehbein-Khalily T., Structure and distribution of branched aliphatic alkanes with quaternary carbon atoms in Cenomanian and Turonian black shales of Pasquia Hills (Saskatchewan, Canada). Org. Geochem. (2005) 36: 117-138.
(63) Van den Dool H., Kratz P.D., J. Chromatogr. A generalization of the retention index system including linear temperature programmed gas—liquid partition chromatography (1963) 11: 463-471.
(64) Perestrelo R., Barros A.S., Câmara J.S., Rocha S.M., In-depth search focused on furans, lactones, volatile phenols, and acetals as potential age markers of Madeira wines by comprehensive two-dimensional gas chromatography with time-of-flight mass spectrometry combined with solid phase microextraction. J. Agric. Food Chem. (2011) 59: 3186-3204.
(65) Silva I., Rocha S. M., Coimbra M.A., J. Marriott, Headspace solid-phase microextraction combined with comprehensive two-dimensional gas chromatography time-of-flight mass spectrometry for the determination of volatile compounds from marine salt. Chromatogr. A (2010) 1217: 5511-5521.
(66) Pleil J.D., Stigiel M.A., Sobus J.R., Tabucchi S., Ghio A.J., Madden M.C., Cumulative exposure assessment for trace-level polycyclic aromatic hydrocarbons (PAHs) using human blood and plasma analysis. J. Chromatogr. B (2010) 878: 1753–1760.
(67) Beauchamp J., Kirsch F., Buettner A., Real-time breath gas analysis for pharmacokinetics: monitoring exhaled breath by on-line proton-transfer-reaction mass spectrometry after ingestion of eucalyptol-containing capsules J. Breath Res. (2010) 4: 026006.
(68) Miekisch W., Schubert J., Noeldge-Schomburg G., Diagnostic potential of breath analysis--focus on volatile organic compounds. Anal Chim. Acta (2004) 347: 25–39.
(69) von Mühlen C., Marriott P.J., Retention indices in comprehensive two-dimensional gas chromatography. Anal Bioanal. Chem. (2011) 401: 2351–2360.
(70) Tran T.C., Logan G.A., Grosjean E., Ryan D., Marriott P.J., Use of comprehensive two-dimensional gas chromatography/time-of-flight mass spectrometry for the characterization of biodegradation and unresolved complex mixtures in petroleum. Geochim. Cosmochim. Ac. (2010) 74: 6468–6484.

Chapter 2 - Exhaled breath analysis
138
(71) Marczin N., Kharitonov S.A., Yacoub M.H., Barnes P.J., Disease Markers in Exhaled Breath. (2005)
Taylor&Francis, New York, pp 220. (72) Rudnicka J., Kowalkowski T., Ligor T., Buszewski B., Determination of volatile organic compounds as
biomarkers of lung cancer by SPME-GC-TOF/MS and chemometrics. J. Chromatogr. B (2011) 879: 3360–3366.
(73) Corradi M., Folesani G., Andreoli R., Manini P., Bodini A., Piacentini G., Carraro S., Zanconato S., Baraldi E., Aldehydes in exhaled breath condensate of patients with chronic obstructive pulmonary disease. Am. J. Respir. Crit. Care Med. (2003) 167: 395–399.
(74) Ibrahim B., Basanta M., Cadden P., Singh D., Douce D. Woodcock A. , Fowler S.J., Non-invasive phenotyping using exhaled volatile organic compounds in asthma. Thorax (2011) 66: 804–809.
(75) Ligor M., Ligor T., Bajtarevic A., Ager C., Pienz M., Klieber M., Denz H., Fiegl M., Hilbe W., Weiss W., Lukas P., Jamnig H., Hackl M., Buszewski B., Miekisch W., Schubert J., Amann A., Determination of volatile organic compounds appearing in exhaled breath of lung cancer patients by solid phase microextraction and gas chromatography mass spectrometry. Clin. Chem. Lab. Med. (2009) 47: 550–560.
(76) Filipiak W., Sponring A., Filipiak A., Ager C., Schubert J. Miekisch W., Amann A., Troppmair J., TD-GC-MS Analysis of Volatile Compounds of Human Lung Cancer and Normal Cells In vitro Cancer Epidemiol. Biomarkers Prev. (2010) 19: 182–195.
(77) Bajtarevic A., Ager C., Pienz M., Klieber M., Schwarz K., Ligor M., Ligor T., Filipiak W., Denz H., Fiegl M., Hilbe W., Weiss W., Lukas P., Jamnig H., Hackl M., Haidenberger A., Buszewski B., Miekisch W., Schubert J., Amann A., Noninvasive detection of lung cancer by analysis of exhaled breath BMC Cancer (2009) 9: 348–364.
(78) Poli D., Carbognani P., Corradi M., Goldoni M., Acampa O., Balbi B., Bianchi L., Rusca M., Mutti A., Exhaled volatile organic compounds in patients with non-small cell lung cancer: cross sectional and nested short-term follow-up study. Resp. Res. (2005) 6: 71–81.
(79) Chen X., Xu F., Wang Y., Pan Y., Lu D., Wang P., Ying K., Chen E., Zhang W., A study of the volatile organic compounds exhaled by lung cancer cells in vitro for breath diagnosis. Cancer (2007) 110: 835–844.
(80) Yu H., Xu L., Wang P., Solid phase microextraction for analysis of alkanes and aromatic hydrocarbons in human breath. J. Chromatogr. B (2005) 826: 69–74.
(81) Kharitonov S.A., Barnes P.J., Exhaled markers of pulmonary disease. Am. J. Respir. Crit. Care Med. (2001) 163: 1693–1722.
(82) MacNee W., Oxidative stress and lung inflammation in airways disease. Eur. J. Pharmacol. (2001) 429: 195–207.
(83) Aghdassi E., Allard J., Breath alkanes as a marker of oxidative stress in different clinical conditions. Free Radical Biol. Med. (2000) 28: 880–888.
(84) Saude E., Skappak C., Regush S., Cook K., Ben-Zvi A., Becker A., Moqbel R., Skyes B., Rowe B., Adamko D., Metabolomic profiling of asthma: Diagnostic utility of urine nuclear magnetic resonance spectroscopy. J. Allergy Clin. Immunol. (2011) 127: 757–764.
(85) Roquet A., Dahlen B., Kumlin M., Ihre E., Anstren G., Binks S., Dahlen S.E., Combined antagonism of leukotriene and histamine produces a predominant inhibition of allergen-induced early and late phase airway obstruction in asthmatics. Am. J. Respir. Crit. Care Med. (1997) 155: 1856–1863.
(86) Smolinska A., Hauschild A.-C., Fijten R.R.R., Dallinga J.W., Baumbach J., Schooten F.J.V., Current breathomics—a review on data pre-processing techniques and machine learning in metabolomics breath analysis. (2014) J. Breath Res. 8: 027105-
(87) van de Kant K.D., van der Sande L.J., Jöbsis Q., van Schayck O.C., Dompeling E . Clinical use of exhaled volatile organic compounds in pulmonary diseases: a systematic review. Resp. Res. (2012) 13:117-140.
(88) Westerhuis J.A., Hoefsloot H.C.J., Smit S., Vis D.J., Smilde A.K., van Velzen E.J.J., van Duijnhoven J.P.M., van Dorsten F.A., Assessment of PLSDA cross validation. Metabolomics (2008) 4: 81-89.
(89) Rubingh C.M., Bijlsma S., Derks E.P., Bobeldijk I., Verheij R., Kochhar S., Smilde A.K., Assessing the performance of statistical validation tools for megavariate metabolomics data. Metabolomics (2006) 2: 53-61.
(90) Picard R., Cook D., Cross-Validation of Regression Models. J Amer Statist Assoc (1984) 79: 575-583. (91) Xu Q-S., Liang Y.-Z., Monte Carlo cross validation. Chemometr. Intell. Lab. (2001) 56 1-11. (92) Dubitzky W., Granzow M., Berrar D.P., Fundamentals of Data Mining in Genomics and Proteomics. (2007)
Springer Verlag Berlin, Heidelberg, Germany. (93) Rocha C.M., Carrola J, Barros AS, Gil AM, Goodfellow BJ, Carreira IM, Bernardo J, Gomes A, Sousa V,
Carvalho L, Duarte IF Metabolic signatures of lung cancer in biofluids: NMR-based metabonomics of blood plasma J Proteome Res (2011) 10: 4314-4324.

Chapter 2 - Exhaled breath analysis
139
(94) Pereira A.C., Reis M.S., Saraiva P.M., Marques J.C., Analysis and assessment of Madeira wine ageing over
an extended time period through GC-MS and chemometric analysis. Anal Chim Acta (2010) 660: 8-21 (95) Graca G. , Moreira A.S. , Correia A.J.V., Goodfellow B.J., Barros A.S., Duarte I.F., Carreira I.M., Galhano
E., Pita C., Almeida M.D., Gil A.M., Mid-infrared (MIR) metabolic fingerprinting of amniotic fluid: A possible avenue for early diagnosis of prenatal disorders? Anal. Chim. Acta (2013) 764: 24-31.
(96) Loureiro C.C, Gomes J., Barros A.S., Gil A.M., Carrola J., Duarte I.F., Bousquet J., Bom A.T., Rocha S.M., Urine metabolomics applied to characterize exacerbation in asthmatic patients. J. Allergy Clin. Immunol. (2014) 133: 261-263.
(97) Bousquet J., Cabrera P., Berkman N., Buhl R., Holgate S., Wenzel S., Fox H., Hedgecock S., Blogg M., Cioppa G.D., The effect of treatment with Omalizumab, an anti-IgE antibody on asthma exacerbations and emergency medical visits in patients with severe persistent asthma. Allergy (2005) 60: 302-308.

140

Chapter 3 – Urine analysis
141
CHAPTER 3
EXPLORATION OF
ASTHMA URINE
METABOLOME
Chapter
3

Chapter 3 – Urine analysis
142

Chapter 3 – Urine analysis
143
3.1 Overview
Urine is an easily obtained matrix in large volumes when compared to other biofluids
and in the last years this matrix has been increasingly studied. The identified compounds may
be end products of normal and pathological cellular processes or compounds of environmental
exposure. Urinary metabolomics is still in a developmental phase moving from discovey
towards a method validation phase that will lead this matrix to be a considerable part of
diagnosis, treatment evaluation and prognosis. The goal of our study was to ascertain the
volatile and non-volatile urinary metabolomic changes caused by the asthma pathology.
With this in mind, in-lab developed and reported method GC×GC-ToFMS was used to
ascertain the overall urine volatile metabolome. The volatile urinary of 26 asthma patients and
10 healthy children was obtained with c.a. 200 compounds being identified. From these
compounds, 78 belonging to the alcohols, aldehydes, alkanes, alkenes and ketones were
selected as these metabolites have been linked to lipid peroxidation, consequently connected
to oxidative stress that has been related to asthma. A heat map, a quick and simple
visualization tool, of the selected compounds was built and it was possible to verify that the
levels of the 78 compounds in the urine of the asthmatic children were higher in the majority
of the selected compounds. MVA analysis was then performed, namely the supervised
method PLS-DA, and discrimination was attained. The developed models were also validated
using MCCV. It was possible to verify that, with the exception of 9 metabolites, most of
metabolited characterized the asthma population.
The use of 1H NMR in analysing urine of asthmatics has been already proven and
reported in literature1. Nevertheless, and to complement the volatile metabolome results, urine
analysis of 92 asthmatic children and 50 healthy children by 1H NMR was performed. The
goal was to ascertain the urinary metabolomic changes thus revealing the compounds
involved in central metabolic pathways affected by the asthma pathology and in addition
develop a method that could be used in the clinical practice. Before performing the analysis
three normalization procedures and metabolite selections were tested. It was possible to
sucessfully differentiate asthma patients from heatlhy children with compounds that are
involved in fulcral metabolic pathways such as tricarboxylic acid (TCA) cycle, histidine
metabolism, lactic acidosis, modification of free tyrosine residues after eosinophil stimulation
and DNA damage.

Chapter 3 – Urine analysis
144

Chapter 3 – Urine analysis
145
3.2 Asthma volatile urinary metabolome uncovered by comprehensive two-dimensional gas chromatography-time of flight mass spectrometry
3.2.1 Abstract
The use of a powerful and high throughput analytical technique, such as GC×GC–ToFMS, in
the evaluation of a biological system provides an array of bicohemical information otherwise
unobtainable. This tool combined with SPME was considered to explore the urinary volatile
metabolomic profile of asthma yielding c.a. 200 compounds that belonged to different
chemical families. A targeted analysis was then performed to assess the impact provoked,
comparing asthma individuals with healthy ones, on lipid peroxidation due to the oxidative
stress levels. Five biochemically relevant families used as a lipid peroxidation index
(alcohols, aldehydes, alkanes, alkenes and ketones), in a total of 78 compounds, were
carefully selected. A heat map was built to quickly compare the urine volatile metabolome of
the asthmatics versus the healthy and it was possible to verify that the levels of urine volatile
compounds of the asthmatics was higher in the majority (88%) of the selected compounds.
MVA tools were applied and it was found out that from the 78 compounds only 9 compounds
(octane, tridecane, 3-methylhexane, 2,2,4,6,6-pentamethylheptane, 6-methyldodecane, 3-
ethyl-3-methylundecane, 3-methy-1-heptene and 2,4-dimethyl-1-heptene) characterized the
healthy population whilst the remaining characterized the asthmatic population. MCCV was
performed to assess the predictive power. The results suggest that the model is robust,
considering the high classification rate (97.3%), sensitivity (98.7%), and specificity (93.9%).
Beside the development of statistical models that were able to discriminate asthmatic children
from healthy ones, urine analysis by GC×GC–ToFMS allowed to use compounds that are
reportedly linked to lipid peroxidation, thus revealing the impact of oxidative stress on
asthma. These results showed the possibility to obtain this knowledge as the compound levels
related to lipid peroxidation were predominantly increased for the asthma population.

Chapter 3 – Urine analysis
146
3.2.2 Framework
Metabolomics is the global unbiased analysis of all the small-molecule metabolites
within a biological system under a given set of conditions. These methods offer the potential
for a holistic approach to clinical medicine, as well as improving disease diagnosis and
understanding of pathological mechanisms2. It is an emerging field useful in the detection of
metabolic profiles of the pathologies under study and pathology exploration by metabolomics
has evolved throughout the years driven by the technological advances in instrumentation,
data analysis software and in the development of metabolite databases. Asthma diagnosis
metabolomic studies have been carried out to provide new tools for diagnosis purposes,
disease management and knowledge on molecular alterations.
When compared with other biofluids, urine has several advantages as it can be
obtained in large quantities non-invasively and usually less pre-treatment is required. Urine
metabolome is potentially vast including all endogenous and exogenous metabolites that
might be established in a wide dynamic concentration range. Asthma is a lung condition, that
could alter the metabolism of cells outside the lung leading to a different metabolome that
could be potentially measured in urine. Several cellular pathways can be studied through this
matrix, assuming that there is no significant renal disease, making urine as an accurate
reflection of a person’s metabolic health and disease3.
The metabolomic urinary profile of 26 children with allergic asthma (from which 12
with allergic rhinitis) and 10 healthy children was explored using the SPME/GC×GC–ToFMS
methodology developed by Rocha et al.4. Urine volatile metabolome in asthma, to the best of
our knowledge, has not been previously described. Relevant biochemical families (alcohols,
aldehydes, alkanes, alkenes and ketones) were selected as these metabolites are generated
though the interaction of ROS with fatty acids (in a known series of reactions known as lipid
peroxidation) measuring the increased oxidative stress in asthma5,6. PLS-DA was performed
in order to obtain the metabolites responsible for class discrimination. MCCV was applied to
the PLS-DA models to evaluate the sensitivity and specificity levels and to assess
classification model robustness.

Chapter 3 – Urine analysis
147
3.2.3 Material and Methods
Subjects
Twenty-six patients with allergic asthma (from which 12 with allergic rhinitis) and 10 healthy
control subjects were enrolled in this study following informed consent and approval of the
study protocol by the Hospital Infante D. Pedro E.P.E (Aveiro, Portugal) and the healthy
population consisted of children of the faculty staff. The characteristics of the patients and
controls are presented in Table 3.1.
Table 3.1 - Characteristics of the studied population: allergic asthma patients and healthy controls.
Allergic asthma (n=26)
Control (n=10)
Age (mean±SD) 8.8±3.4 9.7±3.3 Gender (male/female) 16/10 5/5
Pathology Allergic Asthma 14 (54%) -
Allergic Asthma + Allergic Rhinitis 12 (46%) - Allergensa
Dust mite 10 (38%) - Dust mite + gramineae 7 (27%) -
Gramineae 4 (15%) - Dust mite + cat fur 2 (8%) -
Dust mite + cat fur + dog fur 2 (8%) - Dust mite + olive tree 1(4%) -
Therapy Corticosteroid + bronchodilator 6 (22%) -
Corticosteroid + leukotriene receptor antagonist + bronchodilator 4 (15%) - Leukotriene receptor antagonist + bronchodilator + nasal
corticosteroid 4 (15%) -
Nasal corticosteroid and antihistamine 3 (12%) -
Leukotriene receptor antagonist + bronchodilator 3 (12%) - Corticosteroid + leukotriene receptor antagonist 2 (8%) -
Nasal corticosteroid and bronchodilator 1 (4%) - Corticosteroid 1 (4%) -
No therapy 2 (8%) - a Results obtained by prick-tests
All parents signed an informed consent for participation in the study. The children
with allergic asthma were recruited from the outpatient clinic of the Immunoalergology
Department of the Hospital Infante D. Pedro E.P.E (Aveiro, Portugal). Asthma diagnosis was
made based on clinical symptoms and exams (skin prick tests and IgE values, among other
specific tests). Appropriate therapy was prescribed by the patient’s own physician. The
allergic asthma population represented a controlled asthma status. No restrictions were
applied regarding drugs or diet. Each individual (either patient or healthy volunteer) provided

Chapter 3 – Urine analysis
148
a urine sample in a sterile cup. Then, aliquots of approximately 1 mL were transferred into
vials, frozen and stored at -80 °C, until analysis.
Urine analysis using SPME/GC×GC–ToFMS
The SPME experimental parameters and the GC×GC–ToFMS conditions have been
previously reported by Rocha et al.4. Briefly, 500 µL of urine (pH adjusted to 2.0), 0.1g NaCl
and a stirring bar (0.5×0.1 mm) were placed into a 5 mL glass vial and the vial was capped
with a PTFE septum and a screw cap (Chromacol, Hertfordshire, UK). The DVB/CAR/PDMS
fibre was used with an extraction temperature and time of 40.0±0.1 ºC and 30 min,
respectively, with constant stirring of 500 rpm. Three independent replicates of each sample
were performed. After the extraction/concentration step, the SPME coating fibre was
manually introduced into the GC×GC–ToFMS LECO Pegasus 4D (LECO, St. Joseph, MI,
USA), consisted of an Agilent GC 7890A gas chromatograph equipped with a dual stage jet
cryogenic modulator (licensed from Zoex) a secondary oven and an high-speed time-of-flight
mass spectrometer detector. Most (> 90%) of the identified compounds presented similarity
matches > 850. The DTIC (Deconvoluted Total Ion Current) GC×GC area data was used as
an approach to estimate the relative content of each volatile metabolite of urine.
Data Processing
The dataset comprised 78 metabolites belonging to selected chemical families:
alcohols, aldehydes, alkanes, alkenes and ketones. Scaling procedures divide each variable by
a factor removing the dependence on concentration and magnitude of the metabolites7. Each
sample was range-scaled between 0 and 1, as this scaling procedure proved to be the most
adequate in urine analysis as Weber et al.8 and Van den Berg7 demonstrated. Mean
normalization procedure was then applied to the 78 selected metabolites, by dividing each
row of data matrix by its average. A heat map was then built to visualise the quantitative data
on two axes using R statistical software9. On the x-axis the samples are represented whereas
in the y-axis the normalized areas of the 78 metabolites of the selected chemical families. The
colours are coded to reflect quantitation with higher levels corresponding to red whilst lower
levels are blue.
Partial Least Squares (PLS) is a widely used procedure for both regression and
classification purposes. PLS-DA10, commonly uses a Y matrix containing dummy variables
which defines sample memberships to pre-defined groups and this allows to extract relevant

Chapter 3 – Urine analysis
149
information/variability that could describe the reasons for the observed patterns (clusters)
allowing to verify which metabolites contribute for the observed separation.
Then, PLS-DA was applied to the selected 78 volatile scaled and normalized
metabolites tentatively identified by GC×GC-ToFMS in all urine samples.
For classification purposes two groups were used, healthy subjects and asthma
patients. A random internal cross validation method has been computed with 20 segments and
6 samples per segment. The data is divided into the calibration set containing all samples used
to compute the model components, using X- and Y-values. The test set that contains the
remaining samples for which X-values are fed into the model once a new component has been
computed. Their predicted Y-values are then compared to the observed Y-values, yielding a
prediction residual. MCCV was first reported by Picard and Cook11 and has proven to be
assymptotically consistent and is characterized by leaving out a major part of samples at a
time for validation instead of leaving out one sample at a time12. Model robustness was
assessed using MCCV with 500 iterations. The classification model complexity (number of
LVs) of the dataset (78 metabolites) was computed, as well as classification rate and Q2 were
estimated by cross-validation (7 blocks splits). For each of the 500 randomly generated
classification models, the number of LV, the Q2 and the confusion matrix were computed.
The selection of model complexity was based on the most frequent list of model properties
that maximizes the predictive power (i.e., lower LV and higher Q2). The sensitivity and the
specificity of the model were then depicted from the confusion matrix resulting into a ROC
map to further assess the results significance. Then, the same procedure was applied using
permuted class membership. Sensitivity is calculated from the ratio between true positives
(allergic asthma samples correctly predicted) and the total number of modelled breath
samples, whereas specificity is determined from the ratio between true negatives (control
samples correctly predicted) and the total number of modelled control GC×GC data.
3.2.4 Results and discussion
Urine volatile composition provided by HS-SPME/GC×GC–ToFMS
The urinary volatile metabolome was attained using a high throughput and powerful
technique, GC×GC-ToFMS that is an established technique in the analysis of complex
samples due to its enhanced separation capacity, sensitivity, peak resolution and
reproducibility13,14,15. A non-polar/polar (NP/P) column combination was used and the HS-

Chapter 3 – Urine analysis
150
SPME/GC×GC–ToFMS data was automatically processed using in the identification of all
peaks in the GC×GC chromatogram contour plots with signal-to-noise threshold > 50. The
peak finding routine based on deconvolution method allowed to identify several hundred
compounds. A manual inspection of the mass spectra was performed combined with the use
of retention index and compared with literature values for similar chromatographic columns.
Table 3.2 shows a list of ca. 200 volatile compounds belonging to different chemical families
including acids, alcohols, aldehydes, alkanes, alkenes, esters, furan compounds, ketones,
lactones, norisoprenoids, sulphur compounds and terpenic compounds.
Table 3.2 - Urinary compounds dataset tentatively identified by GC×GC–ToFMS from allergic asthma and healthy children
Peak # 1tR a (s) 2tR
a (s) Compounds CAS Number RIcalcb RIlit.
c (GC) RIlit.
d
(GC × GC)
Acids
1 678 5.81 hexanoic acid 142-62-1 1000 990 -
2 876 5.91 ethylhexanoic acid 149-57-5 1132 1128 -
3 1062 5.46 nonanoic acid 112-05-0 1276 1280 -
4 1176 4.56 decanoic acid 334-48-5 1372 1380 -
5 1380 3.52 dodecanoic acid 143-07-7 1568 1571 -
6 1566 2.90 tetradecanoic acid 544-63-8 1763 1780 -
7 1656 2.62 pentadecanoic acid 1002-84-2 1867 1866 -
8 1740 2.43 hexadecanoic acid 57-10-3 1967 1964 -
Alcohols
15 186 2.34 3-methyl-3-buten-1-ol 763-32-6 655 667 -
12 192 1.85 2-methyl-1-butanol 137-32-6 677 677 -
9 234 2.33 1-pentanol 71-41-0 741 741 760
13 402 1.27 2-methyl-2-propanol 78-93-1 853 853 -
14 744 1.47 2-ethyl-1-hexanol 104-46-7 1040 1026 -
16 792 0.76 2-octen-1-ol 22104-79-6 1074 1060 -
10 798 1.56 1-octanol 111-87-5 1078 1068 1069
17 936 0.79 2-nonen-1-ol 22104-80-9 1170 1171 -
11 942 1.37 1-nonanol 143-08-8 1170 1175 1171
Aldehydes
12 126 0.55 pentanal 110-62-3 685 697 690
13 192 1.06 2-methyl-2-butenal 497-03-0 697 753 -
14 276 0.96 hexanal 66-25-1 801 802 800
15 396 1.60 (E)-2-hexenal 6728-26-3 872 857 851
16 504 0.98 heptanal 111-71-7 904 904 -
17 600 0.92 2-ethylhexanal 123-05-7 957 955 954
18 690 0.86 octanal 124-13-0 1005 1003 1003
19 774 1.10 (E)-2-octenal 2548-87-0 1074 1056 1058
20 846 0.81 nonanal 124-19-6 1105 1106 1103
21 918 1.04 (E)-2-nonenal 18829-56-6 1162 1164 1168

Chapter 3 – Urine analysis
151
Peak # 1tR a (s) 2tR
a (s) Compounds CAS Number RIcalcb RIlit.
c (GC) RIlit.d (GC ×
GC)
23 1104 0.85 undecanal 112-44-7 1311 1310 1309
24 1218 0.81 dodecanal 112-54-9 1412 1410 -
25 1326 0.85 tridecanal 10486-19-8 1513 1511 -
26 1428 0.82 tetradecanal 124-25-4 1613 1611 -
27 1524 0.80 pentadecanal 09/11/2765 1714 1711 -
28 1614 0.85 hexadecanal 629-80-1 1815 1819 -
Hydrocarbons
Alkanes
29 90 0.37 3-methylpentane 107-83-5 560 558
30 150 0.40 3-methylhexane 589-34-4 640 671 672
31 222 0.43 C7 isomer (m/z 57, 43, 71) - 759 - -
32 276 0.40 octane 111-65-9 800 800 800
33 318 0.46 4-ethyl-2-methylhexane 3074-75-7 831 833 -
34 498 0.42 nonane 111-84-2 900 900 900
35 624 0.45 3-methylnonane 06/04/5911 975 976 971
36 666 0.44 2,2,4,6,6-pentamethylheptane 13475-82-6 988 997 997
37 684 0.42 decane 124-18-5 1000 1000 1000
38 720 0.45 3,9-dimethylnonane 17302-32-8 1039 1038 -
39 840 0.42 undecane 1120-21-4 1100 1100 1100
40 876 0.45 C11 isomer (m/z 57, 43, 71) - 1144 - -
41 930 0.46 2-methylundecane 7045-71-8 1193 1164 1165
42 972 0.43 dodecane 112-40-3 1200 1200 1200
43 1020 0.45 6-methyldodecane 6044-71-9 1256 1253 -
44 1098 0.44 tridecane 629-50-5 1300 1300 1300
45 1128 0.46 3-ethyl-3-methylundecane - 1348 1347 -
46 1212 0.45 tetradecane 629-59-4 1400 1400 1400
47 1314 0.45 pentadecane 629-62-9 1500 1500 -
48 1416 0.46 hexadecane 544-76-3 1600 1600 -
49 1512 0.47 heptadecane 629-78-7 1700 1700 -
50 1608 0.46 octadecane 593-45-3 1800 1800 -
Alkenes
94 210 0.44 3-methyl-1-heptene 3769-23-1 727 743 748
89 258 0.47 1-octene 592-98-3 803 800 790
90 366 0.50 2,4-dimethyl-1-heptene 19549-87-2 853 855 -
92 672 0.49 4-decene 19398-89-1 1008 991 993
93 756 0.48 4-methyl-2-decene 74630-30-1 1062 - -
94 810 0.47 C11 isomer (m/z 69, 55, 41) - 1097 - -
95 966 0.49 1-dodecene 112-41-4 1211 1192 -
96 1116 0.48 7-methyl-1-undecene 74630-42-5 1337 - -
97 1200 0.53 1-tetradecene 1120-36-1 1412 1392 -
98 1308 0.56 1-pentadecene 13360-61-7 1511 1481 -
Cyclic

Chapter 3 – Urine analysis
152
Peak # 1tR a (s) 2tR
a (s) Compounds CAS Number RIcalcb RIlit.
c (GC) RIlit.d (GC ×
GC)
51 594 0.48 1,1,2,3-tetramethylcyclohexane 6783-92-2 966 958 -
52 828 0.48 1-hexyl-3-methylcyclopentane 61142-68-5 1109 - -
Aromatics
53 126 0.59 benzene 71-43-2 628 648 660
54 222 0.82 toluene 108-88-3 768 762 770
55 402 1.03 ethylbenzene 100-41-4 857 858 868
56 420 1.04 p-xylene 106-42-3 865 864 -
57 474 1.07 o-xylene 95-47-6 890 893 -
58 540 0.86 isopropylbenzene 98-82-8 923 922 -
59 594 0.86 propylbenzene 103-65-1 952 952 959
60 642 0.91 o-ethyltoluene 611-14-3 978 973 -
62 666 0.92 1,2,4-trimethylbenzene 9563-6 991 988 -
63 702 0.87 1-allyl-4-methylbenzene 3333-13-9 1012 1033 -
64 714 0.98 1,2,3-trimethylbenzene 526-73-8 1020 1020 -
65 762 0.78 m-propyltoluene 1074-17-5 1051 1058 -
66 786 0.82 (1-methylpropyl)-benzene 135-98-8 1066 1014 -
67 612 0.87 m-ethyltoluene 620-14-4 962 959 -
68 624 0.90 p-ethyltoluene 622-96-8 968 960 -
69 774 0.82 1-ethyl-2,3-dimethylbenzene 933-98-2 1058 1094 -
70 798 0.84 1-ethyl-2,4-dimethylbenzene 847-41-9 1078 1087 -
71 948 1.83 naphthalene 91-20-3 1183 1183 -
72 1356 0.65 (1-butylhexyl)-benzene 4537-11-5 1542 - -
73 1416 0.70 (1-methylnonyl)-benzene 4537-13-7 1601 - -
74 1482 0.67 (1-ethyloctyl)-benzene 4621-36-7 1669 - -
75 1512 0.70 (1-methyldecyl)-benzene 4536-88-3 1701 - -
76 1542 0.65 (1-butyloctyl)-benzene 2719-63-3 1734 - -
77 1554 0.66 (1-propylnonyl)-benzene 2719-64-4 1747 - -
78 1572 0.67 (1-ethyldecyl)-benzene 2400-00-2 1767 - -
79 1608 0.70 (1-methylundecyl)-benzene 2719-61-1 1808 - -
80 1632 0.66 (1-butylnonyl)-benzene 4534-50-3 1837 - -
81 1644 0.66 (1-propyldecyl)-benzene 4534-51-4 1851 - -
82 1698 0.70 (1-methyldecyl)-benzene 4536-88-3 1915 - -
Chlorinated compounds
100 588 1.23 o-chlorotoluene 95-49-8 949 955 -
101 600 1.26 p-chlorotoluene 106-43-4 956 956 -
102 780 0.65 1-chlorooctane 111-85-3 1062 1064 -
103 924 0.64 1-chlorononane 2473-01-0 1164 1167 -
104 1056 0.64 1-chlorodecane 1002-69-3 1267 1256 -
Esters
105 108 0.52 ethyl acetate 141-78-6 607 608 609
107 450 1.39 1-methoxy-2-propyl acetate - 879 - -
108 876 0.76 methyl octanoate 111-11-5 1128 1126 -

Chapter 3 – Urine analysis
153
Peak # 1tR a (s) 2tR
a (s) Compounds CAS Number RIcalcb RIlit.
c (GC) RIlit.d (GC ×
GC)
109 972 0.70 ethyl octanoate 106-32-1 1201 1202 -
110 1122 0.74 methyl decanoate 110-42-9 1322 1326 -
111 1206 0.69 ethyl decanoate 110-38-3 1395 1397 -
112 1338 0.73 methyl dodecanoate 111-82-0 1524 1526 -
113 1344 1.66 ethyl-4-ethoxybenzoate 23676-09-7 1531 1522 -
114 1422 0.59 2-ethylhexyl 2-ethylhexanoate 7245-14-1 1607 - -
115 1536 0.73 methyl tetradecanoate 124-10-7 1728 1727 -
116 1710 0.73 methyl hexadecanoate 112-39-0 1929 1928 -
Furan compounds
117 102 0.50 2-methylfuran 534-22-5 601 603 -
118 120 0.48 tetrahydrofuran 109-99-9 621 620 634
119 156 0.62 2,5-dimethylfuran 625-86-5 663 701 -
120 276 0.79 2-ethyl-5-methylfuran 1703-52-2 800 800 -
121 306 0.85 2,3,5-trimethylfuran 10504-04-8 814 817 -
122 432 2.28 2-(methylthio)-furan 13768-59-6 871 - -
123 480 0.77 2,5-diethylfuran 10504-06-0 892 888 -
124 564 1.07 2-methyl-5-isopropenylfuran - 936 - -
125 672 0.76 2-pentylfuran 994 992 995
126 924 0.90 menthofuran 3777-69-3 1164 1164 -
127 990 1.42 4,7-dimethyl-1-benzofuran 28715-26-6 1215 1220 -
Ketones
128 150 0.92 2-pentanone 107-87-9 595 636 681
129 192 0.74 2-methyl-pentan-2-one 108-10-1 - 733 748
130 204 0.74 3-methylpentan-2-one 565-61-7 746 - 750
131 246 1.42 4-methyl-3-penten-2-one 123-54-6 790 798 -
132 252 0.86 2-hexanone 591-78-6 800 790 788
133 258 0.97 C6 isomer (m/z 43, 58, 71) - 808 - -
134 258 1.46 1-hexen-3-one 1629-58-9 808 775 -
135 264 0.68 2,3-dimethyl-3-pentanone 565-80-0 810 806 -
136 354 0.89 4-methylhexan-2-one 17042-16-9 837 846 850
137 438 0.95 4-heptanone 123-19-3 873 895 884
138 636 0.80 3-octanone 106-68-3 991 989 989
139 660 1.10 6-methyl-5-hepten-2-one 110-93-0 991 989 985
140 828 0.84 2-nonanone 821-55-6 1093 1093 1089
141 894 1.02 1-nonen-3-one 24415-26-7 1142 1077 -
142 1086 0.82 2-undecanone 112-12-9 1296 1296 1293
143 1206 0.82 2-dodecanone 6175-49-1 1396 1396 -
144 1314 0.86 2-tridecanone 593-08-8 1501 1500 -
Lactones
146 828 3.53 δ-hexanolactone 823-22-3 1095 1084 1060
148 1632 0.97 Muskolactone 106-02-5 1837 1839 1841
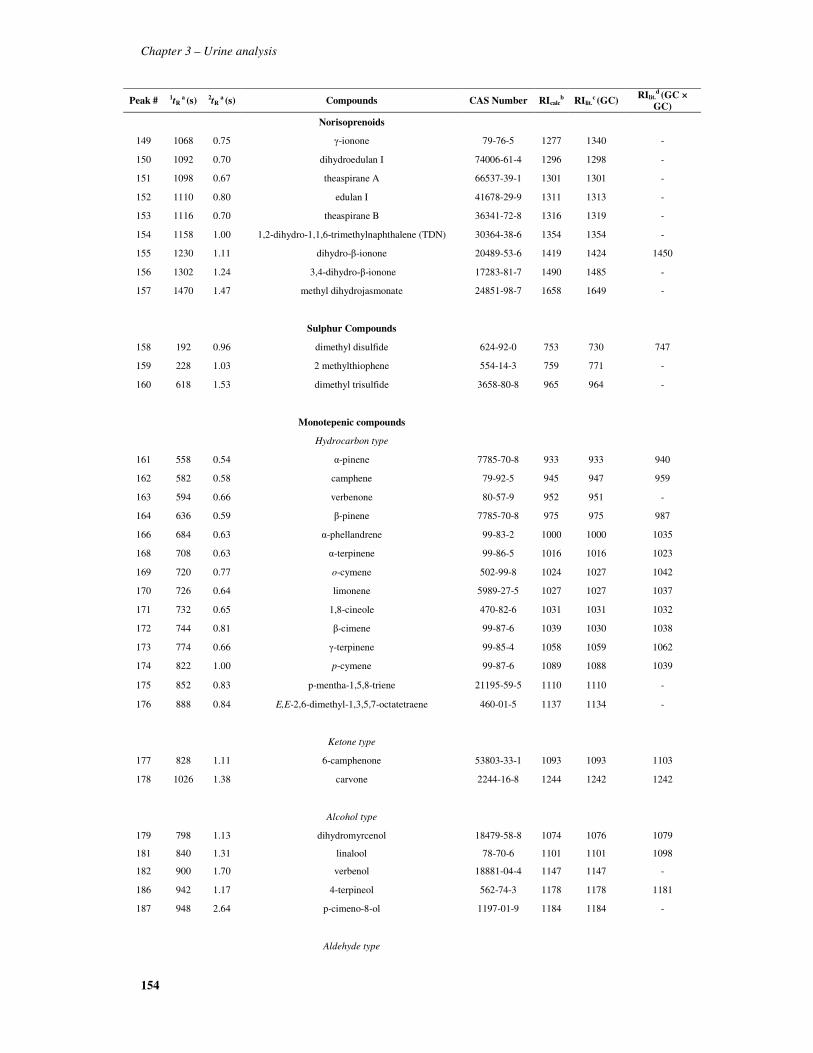
Chapter 3 – Urine analysis
154
Peak # 1tR a (s) 2tR
a (s) Compounds CAS Number RIcalcb RIlit.
c (GC) RIlit.d (GC ×
GC)
Norisoprenoids
149 1068 0.75 γ-ionone 79-76-5 1277 1340 -
150 1092 0.70 dihydroedulan I 74006-61-4 1296 1298 -
151 1098 0.67 theaspirane A 66537-39-1 1301 1301 -
152 1110 0.80 edulan I 41678-29-9 1311 1313 -
153 1116 0.70 theaspirane B 36341-72-8 1316 1319 -
154 1158 1.00 1,2-dihydro-1,1,6-trimethylnaphthalene (TDN) 30364-38-6 1354 1354 -
155 1230 1.11 dihydro-β-ionone 20489-53-6 1419 1424 1450
156 1302 1.24 3,4-dihydro-β-ionone 17283-81-7 1490 1485 -
157 1470 1.47 methyl dihydrojasmonate 24851-98-7 1658 1649 -
Sulphur Compounds
158 192 0.96 dimethyl disulfide 624-92-0 753 730 747
159 228 1.03 2 methylthiophene 554-14-3 759 771 -
160 618 1.53 dimethyl trisulfide 3658-80-8 965 964 -
Monotepenic compounds
Hydrocarbon type
161 558 0.54 α-pinene 7785-70-8 933 933 940
162 582 0.58 camphene 79-92-5 945 947 959
163 594 0.66 verbenone 80-57-9 952 951 -
164 636 0.59 β-pinene 7785-70-8 975 975 987
166 684 0.63 α-phellandrene 99-83-2 1000 1000 1035
168 708 0.63 α-terpinene 99-86-5 1016 1016 1023
169 720 0.77 o-cymene 502-99-8 1024 1027 1042
170 726 0.64 limonene 5989-27-5 1027 1027 1037
171 732 0.65 1,8-cineole 470-82-6 1031 1031 1032
172 744 0.81 β-cimene 99-87-6 1039 1030 1038
173 774 0.66 γ-terpinene 99-85-4 1058 1059 1062
174 822 1.00 p-cymene 99-87-6 1089 1088 1039
175 852 0.83 p-mentha-1,5,8-triene 21195-59-5 1110 1110 -
176 888 0.84 E,E-2,6-dimethyl-1,3,5,7-octatetraene 460-01-5 1137 1134 -
Ketone type
177 828 1.11 6-camphenone 53803-33-1 1093 1093 1103
178 1026 1.38 carvone 2244-16-8 1244 1242 1242
Alcohol type
179 798 1.13 dihydromyrcenol 18479-58-8 1074 1076 1079
181 840 1.31 linalool 78-70-6 1101 1101 1098
182 900 1.70 verbenol 18881-04-4 1147 1147 -
186 942 1.17 4-terpineol 562-74-3 1178 1178 1181
187 948 2.64 p-cimeno-8-ol 1197-01-9 1184 1184 -
Aldehyde type

Chapter 3 – Urine analysis
155
Peak # 1tR a (s) 2tR
a (s) Compounds CAS Number RIcalcb RIlit.
c (GC) RIlit.d (GC ×
GC)
188 870 1.04 α-canfolenal - 1124 1127 -
189 966 1.22 myrtenal 18486-69-6 1196 1195 -
Ester type
190 1080 0.82 bornyl acetate 76-49-3 1286 1285 -
Sesquiterpenic compounds
Hydrocarbon type
191 1224 0.63 α-cedrene 469-61-4 1412 1409 -
192 1296 0.66 aromadendrene 489-39-4 1483 1447 1496
193 1344 0.70 δ-cadinene 483-76-1 1530 1530 -
194 1362 0.91 α-calacorene 21391-99-1 1548 1546 -
Alcohol type
195 1344 0.79 spathulenol 6750-60-3 1530 1548 -
196 1380 1.06 nerolidol 7212-44-4 1566 1565 -
197 1440 1.16 γ-eudesmol 1209-71-8 1626 1629 -
198 1638 0.94 farnesol 4602-84-0 1844 1749 -
Miscellaneous
147 960 2.19 3-methyl-4-propyl-2,5-furandione 16493-20-2 1193 - -
165 666 0.70 monoterpene m/z (91, 77, 119, 39, 134) - 991 - -
167 690 0.71 monoterpene m/z (91, 77, 119, 39, 134) - 1004 - -
183 906 1.58 monoterpene m/z (91, 77, 119, 39, 134) - 1151 - -
184 918 1.85 monoterpene m/z (91, 77, 119, 39, 134) - 1161 - -
185 930 1.85 monoterpene m/z (91, 77, 119, 39, 134) - 1170 - -
*- information not available a- Retention times in seconds (s) for first (1tR) and second (2tR ) dimensions. b- RI: retention index obtained through the modulated chromatogram. c- RI: retention index reported in the literature for one dimensional GC with a 5%-Phenyl-methylpolysiloxane GC column or equivalent. d- RI: retention index reported in the literature for a comprehensive GC×GC system with Equity-5 for the first dimension.
The most reliable way to confirm the identification of each compound is based on
authentic standard co-injection, which in several cases is economically prohibitive and often
unachievable in the time available for analysis, or commercially unavailable standard16. With
the use of NP/P columns chemically related compounds are grouped forming ordered patterns
facilitating group-type analysis and conditional classification of unknown compounds17.With
this column combination, the chemical families are grouped based on the boiling point (1D)
and polarity (2D) offering a clear visual separation between compound classes as shown in
several reports4,18. The identification was also supported by experimentally determining the
retention index (RI) values that were compared, when available, with values reported in
literature for chromatographic columns similar to that used as the 1D column and whenever
available compared to RI values obtained by GC×GC.

Chapter 3 – Urine analysis
156
Figure 3.1 - Peak apex plot of the compounds identified in urine depicting all the chemical families present in
Table 3.2.
In Figure 3.1, a peak apex plot can be visualized depicting all chemical families
identified in urine. The increase in the number of carbons leads to an increase in the first
retention time (1tR) due to the decrease in volatility. In the second retention time (2
tR) the
compounds are dispersed by polarity. The alkanes are the least polar compounds (2tR 0.370s)
and the acids the most polar compounds (2tR 5.910s). It is also possible to clearly verify, for
the acids family, that the increase of the carbon chain leads to a decrease in the 2tR.
The alkanes and alkenes behave in quasi linear fashion and the separation is based on
volatility. The ramified alkanes and alkenes presented a slight higher 2tR when compared to
the linear alkanes and alkenes (Table 3.2). The aromatics are depicted in Figure 3.1 in the
rounded rectangle varying in 1tR between 126s to 948s and 1356s to 1698s and 2tR between
0.590s and 0.890s and. The exceptions were 2-phenylpropene and naphthalene that have a 2tR
of 1.140s and 1.830s, respectively. This behavior is explained by the presence of the double
bond in the substituted benzene for the former and the presence of another benzene ring for
the latter. The introduction of a methyl group led to a significant increase in 2tR as it can be
exemplified for benzene (0.590s) and p-xylene (1.040). However, when additional groups are
present 2tR decrease is observed (0.820s for 1-ethyl-2,3-dimethylbenzene). It was also possible
to identify clusters with monoterpenes (C10H16) found between 1tR 558 and 774s, monoterpene
alcohols between 1tR 798 and 1026s and the sesquiterpenes from 1tR 1224 to 1638s (Table
C6 C8 C9 C10 C11 C12 C13 C14 C15 C16 C17 C18 C190.0
1.0
2.0
3.0
4.0
5.0
6.0
0 200 400 600 800 1000 1200 1400 1600 1800
2nd
Dim
ensi
on (
s)
1st Dimension (s)Acids Alcohols Aldehydes Aliphatic Alkanes AlkenesEsters Furan compounds Ketones Lactones NorisoprenoidsSulphur Compounds Monoterpenic Compounds Sesquiterpenic compounds Aromatics
Acids
Alkanes and Alkenes
Aldehydes, Esters, Ketones
Monoterpenic compounds
Aromatics
Norisoprenoids

Chapter 3 – Urine analysis
157
3.2). As for the furan compounds, the presence of additional methyl groups led to a slight
increase effect on 2tR (1.420s for 4,7-dimethyl-1-benzofuran) and a bigger increase is
observed when the compound had sulphur in its composition (2.280s for 2-(methylthio)-
furan). The norisoprenoids varied between 1068 and 1470s for 1tR and 0.670 and 1.470s for 2tR, as depicted in Figure 3.1. The sulphur compounds have increased polarity with the
addition of a sulphur atom in its structure, 0.960s for dimethyl sulfide and 1.530s for dimethyl
trisulfide. As for the chlorinated compounds, it can be observed from Table 3.2 that there is
an increase in 2tR in the presence of a chlorinated toluene when compared with the substituted
chloroalcane due to the increase in polarity of the former.
The general behavior of compounds with a carbonyl group can be observed in Figure
3.1 depicted by dashed line. Initially, for the ketones and aldehydes, there was an increase in
polarity (consequently increase in 2tR) with the increase of carbons until C8. After, there is a
decrease and stabilization of 2tR due to the increase of hydrophobicity, and 2tR remains
constant throughout the chromatogram. It was possible to verify the increase on 2tR when the
compound has a double bond, as for example 4-methyl-3-penten-2-one and 1-hexen-3-one,
with 1.460s and 1.020s respectively (Table 3.2). The presence of a benzene ring (ethyl-4-
ethoxybenzoate) and even the presence of a metoxy group (1-methoxy-2-propyl acetate)
promoted the increase on 2tR in these chemical families. In the linear alcohols, it was possible
to confirm that the increase of the carbon chain led to a decrease in the 2tR. However, the
ramified alcohols have a lower 2tR when compared to the correspondent linear alcohols. The
same behavior is noted for the unsaturated alcohols, with the exception of 3-methyl-3-buten-
1-ol mainly due to the presence of the double bond. The 2tR generally follows: alkanes <
alkenes ≈ cyclic hydrocarbons <aromatic hydrocarbons ≈ esters ≈ terpenoids ≈ norisoprenoids
< ketones ≈ aldehydes < sulphur compounds < alcohols < lactones < acids.
However, not all identified compounds are endogenous, i.e. there are compounds that
are contaminants, not an internal metabolic product. For example, organochlorides or
aromatic hydrocarbons from environmental cumulative exposure19 or can have its origin from
ingested foods as for example esters, furan compounds, lactones, norisoprenoids and
terpenoids20,21. The metabolic pathways yielding sulphur compounds are regarded as
detoxification routes22. Seventy eight compounds belonging to aldehydes, ketones, alkanes,
alkenes and alcohols were selected. These metabolites are linked to the oxidative degradation
of lipids (lipid peroxidation) due to increased oxidative stress that has been reported in
asthma30 and this study assessed the impact at the oxidative stress level on the fatty acids in
individuals with asthma when compared to healthy individuals23.

Chapter 3 – Urine analysis
158
Targeting urinary asthma metabolomics toward oxidative stress impact
Figure 3.2 depicts the differences between the asthmatic and healthy individuals scaled
chromatographic peak areas of the five selected families. It clearly shows differences in the
selected dataset, with a highly altered chromatographic pattern for the asthmatic group as a
whole.
Figure 3.2 - Peak apex plots depicting five biochemically relevant selected families: alcohols, aldehydes,
alkanes, alkenes and ketones. Comparison between the asthma and healthy groups scaled peak areas
However, the visualization of complex data through heat maps is a more suitable tool
for a rapid inspection of the obtained data24. Mieth and co-authors25 reported it in the analysis
of exhaled breath and Rocha et al.4 in urine. This approach was adapted to the scaled 78
0
0.5
1
1.5
2
2.5
0 200 400 600 800 1000 1200 1400 1600
2ndD
imen
sion
(s)
1st Dimension (s)
Asthma
Aliphatic Aldehydes & Ketones
Alkanes & Alkenes
Aliphatic Alcohols
0
0.5
1
1.5
2
2.5
0 200 400 600 800 1000 1200 1400 1600
2ndD
imen
sion
(s)
1st Dimension (s)Alcohols Aldehydes Alkanes Alkenes Ketones
Healthy
Aliphatic Aldehydes & Ketones
Alkanes & Alkenes
Aliphatic Alcohols

Chapter 3 – Urine analysis
159
compounds to quickly visualize the differences among asthma and healthy groups (Figure
3.3).
Figure 3.3 – Heat map representation of biochemically relevant selected families, aldehydes, ketones, alkanes,
alkenes and alcohols. Each line represent a range- scaled and mean normalized volatile compound (organized by
chemical families) and each column represents a subject (organized by healthy and asthma children). For peak
assignment see Table 3.1.
At a first glance, it is confirmed that the urinary metabolomic composition is that the
levels of urine volatile compounds of the asthmatics was higher in the majority (88%) of the
selected compounds.
0.0 0.2 0.4 0.6 0.8 1.0
Aldehydes
Ketones
Alkanes
Alkenes
Alcohols
Healthy Asthma12345678910111213141516171819202122232425262728293031323334353637383940414243444546474849505152535455565758596061
78
62636465666768
7776
69707172737475

Chapter 3 – Urine analysis
160
Methods of correction, i.e. normalization, are a crucial pre-processing step normally
applied to urine samples to account for the different sample dilutions before applying
multivariate tools to the dataset. Post sample analysis normalization allows investigating urine
samples without full volume 24-h collection simplifying the overall process26. For this
purpose, the mean normalization procedure was performed to the scaled chromatographic
areas. After, PLS-DA was apllied to the selected dataset. Scores plot for the first two LV of
PLS-DA model for volatile compounds are shown in Figure 3.4 A, while Figure 3.4 B
(corresponding LV1 and LV2 loading weights plot) establishes the contribution of each
volatile compound that promotes the observed distinction.
Figure 3.4 A shows that the healthy group is associated with LV1 and LV2 negative
values whilst the asthma group is more dispersed by the remaining three quadrants. The
healthy group is mainly characterized by octane, tridecane, 3-methylhexane, 2,2,4,6,6-
pentamethylheptane, 6-methyldodecane, 3-ethyl-3-methylundecane, 3-methy-1-heptene and
2,4-dimethyl-1-heptene (Figure 3.4 B). The remaining compounds described the asthma
group, however among these, the aldehydes, the heavier alkanes (from tetradecane to
octadecane) and alcohols, have a bigger weight in discriminating the asthma group taking into
account LV1 positive values. Comparing these results to the result in the heat map,
differences are observed in the compounds that characterize the populations under study.
From Figure 3.3, 4-methyl-3-penten-2-one had higher chromatographic areas in the healthy
population (in the PLS-DA this compound characterized the asthma population) and from
loading analysis (Figure 3.4 B) there were other compounds that characterized the healthy
population such as 2,4,6,6-pentamethylheptane, 3-ethyl-3-methylundecane and 3-methy-1-
heptene. These differences could be attributed to the normalization procedure adopted before
applying MVA analysis due to the accounting for dilution factors in urine samples bringing
all the compounds into proportion with one another.

Chapter 3 – Urine analysis
161
Figure 3.4 – (A) PLS-DA scores scatter plot showing a clear discrimination between allergic asthma and healthy children, (B) LV1 loading weights plot of the selected 78 metabolites with the identification of main compounds related to the healthy group.
As for validation purposes, an internal cross validation and MCCV described in the
multivariate analysis section, were applied. In the performed internal cross validation, the R2
was 0.907 whilst the validation results had a R2 of 0.814. Therefore, to assess the predictive
-2
-1.5
-1
-0.5
0
0.5
1
-1.5 -1 -0.5 0 0.5 1 1.5 2
LV2
(12%
)
LV1 (27%) Healthy Asthma
(A)
-0.5
-0.4
-0.3
-0.2
-0.1
0
0.1
0.2
0.3
0.4
Loa
din
g w
[1]
LV1 LV2
Aldehydes Ketones Alkanes Alkenes Alcohols
Octane
Tridecane
3-methylhexane 2,4-dimethyl-heptene
3-methyl-1-heptene
3-ethyl-3-methylundecane
(B)

Chapter 3 – Urine analysis
162
ability of the classification model and evaluate the robustness of the developed models,
MCCV was applied to add confidence to the obtained results.
Figure 3.5 - ROC space (A) where each point represents a prediction result (sensitivity and 1-specificity) of the confusion matrices obtained from MCCV (500 iterations) of the PLS-DA model for the different data normalization techniques employed and Q
2 values distribution (B) of the original and permuted Monte-Carlo Cross Validation for PLS-DA of exhaled breath of full dataset.
The average Q2 for the 500 runs was 0.9, with a large prevalence of values within the
range 0.8-1.0. According to the resulting confusion matrix, the PLS-DA model showed 98.7%
sensitivity, with approximately 1.3% of asthma patients being misclassified as controls, and
93.9% specificity, with 6.1% false positives. The classification rate (total number of samples
correctly classified) was 97.3% .
0
0.2
0.4
0.6
0.8
1
0 0.2 0.4 0.6 0.8 1
TP
R (s
ensi
tivi
ty)
FPR (1-specificity)
True classes Permuted classes(A)
0%
10%
20%
30%
40%
50%
60%
-1 -0.9-0.8-0.7-0.6-0.5-0.4-0.3-0.2-0.1 0 0.1 0.2 0.3 0.4 0.5 0.6 0.7 0.8 0.9 1
Fre
qu
ency
Q2 values
True Classes Permuted Classes(B)

Chapter 3 – Urine analysis
163
The metabolic activity of children with asthma is different from those without asthma
revealed by their urine volatile composition. Several metabolic pathways may be associated to
asthma, nevertheless this study focused on the fatty acid oxidation that is summarized in
Figure 3.6. Airway inflammation is closely linked to asthma27,28 and studies have shown that
ROS are mediators in the inflammatory process becoming clear that oxidative stress increases
this process29. ROS alters key enzymatic and non-enzymatic antioxidants that lead to an
oxidant-antioxidant imbalance in airways and this imbalance leads to known
pathophysiological effects associated with asthma30. ROS are common initiators in living
cells of the fatty acid oxidation process30 and alcohols, aldehydes, alkanes, alkenes and
ketones are commonly associated to lipid peroxidation that is linked to fatty acid oxidation5,6.
Alcohols, aldehydes, alkanes and alkenes are linked to oxidative stress and inflammation23.
The main mechanism that affects the release of these chemical families in the body is
oxidative stress and is essentially formed via lipid peroxidation by ROS of polyunsaturated
fatty acids (PUFA)23. PUFA, found in cellular and subcellular membranes in the body,
undergo lipid peroxidation due to the existence of multiple double bonds, in particular the
methylene groups that have especially reactive hydrogen, forming aldehydes, alkanes and
alkenes. Heavier ketones, under metabolic conditions, can also be associated with the β-
oxidation of branched fatty acids, a high oxidation rate of fatty acids20,31. Branched ketones
may arise from branched aldehydes and can partially arise from bacterial action in the gut,
probably by decarboxylation from the corresponding oxo-acids20 Therefore, this study was
focused on identification of these metabolites in urine of an asthmatic population and
compared them to the healthy population. Taking into account the results where the majority
of the selected compounds pertaining to the aldehydes, alkanes, and alkenes are increased
(Figure 3.3) and characterized the asthma group (Figure 3.4 B) The alcohol levels are no
exception to this behavior and are generally increased in the urine of the asthmatic patients
characterizing the asthmatic population (Figure 3.3 B). Accordingly to Figure 3.4 B, ketones
levels in urine are increased in the asthmatic population, . These results suggest the possibility
of assessing lipid peroxidation through the measurement of these urinary volatile compounds
linked to lipid peroxidation and consequently fatty acid oxidation.

Chapter 3 – Urine analysis
164
3.2.5 Concluding remarks
In this study, GC×GC–ToFMS combined with SPME was applied, for the first time to
the best of our knowledge, in the uncovering the urinary metabolome of a paediatric asthmatic
population. The use of a powerful technique such as GC×GC–ToFMS allowed the
identification of c.a. 200 compounds, common in all samples, belonging to 10 different
chemical families. A targeted analysis was performed to assess the impact that asthma has in
oxidative stress on fatty acids and for that purpose five biochemically relevant families linked
to these processes were selected. A set of 78 compounds belonging to aldehydes, ketones,
alkanes, alkenes and alcohols was used. A heat map, a quick visualization tool, was built and
it was possible to verifyt that the urine of asthmatics was highly altered when compared to the
urine of the healthy population. MVA tools were then applied and discrimination between the
asthmatic and healthy populations was attained. Loading analysis enabled gathering
metabolomic information through the identified compounds, therefore demonstrating that the
levels of oxidative stress related to lipid peroxidation processes on asthma individuals was
higher than in healthy individuals. Although the initial set of children is small (n=36), the
achieved results led to the successful unravelling the asthma urinary volatile metabolome and
led to the successful development of validated statistical models. The use of high throughput
technology (GC×GC–ToFMS) in the analysis of urine from a pediatric asthmatic population
yielded an easy and novel strategy for asthma assessment, which may be a valuable tool in
assessing lipid peroxidation levels in a population affected by asthma.

Chapter 3 – Urine analysis
165
3.3 Exploring the urinary metabolomic profile of children with asthma by 1H Nuclear Magnetic Resonance
3.3.1 Abstract
Recently non-invasive sampling strategies have emerged as an attractive and useful
approach combined to high throughput techniques such as 1H NMR. Therefore, this study
focused on the establishment of the urinary metabolomic pattern of asthmatic and healthy
children using 1H NMR in tandem with partial least squares discriminant analysis. Data pre-
treatment is an important step in metabolomics previous to multivariate analysis. Thus, three
methods were applied: normalization to creatinine signal, to total spectral area and
probabilistic quotient normalization (PQN). PQN yielded the most positive impact when
compared to the remaining studied methods. To further improve the obtain results variable
selection was studied taking into account the compounds with variable importance in
projection (VIP) higher than 1 and specific 1H NMR spectral areas. The results showed that
selecting VIP higher than 1 and for the spectral region between 0.5-3.0 and 6.0-9.5ppm was
the best alternative. MCCV was also performed to assess both, the predictive power and
classification models robustness of the developed models. The previously mentioned
conditions yielded a classification rate of 83.9%, sensitivity of 90.3% and specificity of
72.1%.
Upon loading analysis, the compounds that characterized the healthy children were
trimethylamine-N-oxide and trigonelline whilst a broader set of compounds characterized the
asthma children β-aminoisobutyrate, lactate + threonine, histidine, phenylacetylglutamine,
acetate, p-cresol, succinate, citrate, tyrosine and indoxyl sulphate. This metabolomic pattern
allowed to obtain hypothesize on possible affected metabolic pathways by asthma such as
TCA cycle, histidine metabolism, lactic acidosis, modification of free tyrosine residues after
eosinophil stimulation, and DNA damage. The study led to a methodology able to monitor
asthma patients allowing to ascertain urinary metabolomic changes providing the compounds
involved in central metabolic pathways. The 1H NMR urine analysis yielded a metabolomic
pattern for asthma, and the identified compounds allowed a comprehensive study of asthma
metabolic related pathways.
Chapter 3 – Urine analysis
166
3.2.2 Framework
NMR is non-destructive technique enabling, highly reproducible, both qualitative and
quantitative measurements while studying a number of metabolites in a biological fluid32,33.
There has been a recent surge in the application of 1H NMR in biofluids research, with
metabolic profiles being used to characterize, diagnose, and predict pathological states34,35.
The application of 1H NMR spectroscopy to urine and plasma samples has been
extensively used36,37,38. Saude et al.1, developed statistical models with 70 metabolites using
urine of asthmatics analyzed by 1H NMR proving the potential of this tecnique in asthma
research. The study allowed the identification of biochemical pathways that are possibly
influenced by asthma such as the TCA, stress on energy metabolism, the protein and amino
acid metabolism and inflammation. These authors proposed other possible pathways that are
related to the modification of free tyrosine residues by eosinophil activity and lactic acidosis.
Recently, Loureiro et al.39 analyzed urine by 1H NMR to evaluate the changes in
urinary metabolites associated to asthma exarcebation and verified that lipid peroxidation
associated to oxidative stress and TCA are the main altered metabolic pathways. Jung and co-
authors40 analyzed serum from patients with asthma using 1H NMR and compared to healthy
children. The metabolites responsible for the attained discrimination are reportedly involved
in hypermethylation, response to hypoxia, immune reaction and lipid metabolism.
In this research study, the metabolomic urinary profile of an asthmatic childhood and
healthy populations was explored using a 1H NMR methodology in order to extract relevant
information that can be used further on asthma management. Firstly, three normalization
statistical techniques were tested to normalize the urine 1H NMR spectra namely, total area
normalization, normalization to creatinine reported in literature in studies related to asthma
and PQN41. PLS-DA and Orthogonal Projections to Latent Structures (OPLS-DA) models
were developed. MCCV was applied and loading analysis was performed to reveal the
modifications on 1H NMR urinary metabolome of childhood promoted by asthma condition.
3.2.3 Experimental
Subjects
Ninety-two patients with allergic asthma (from which 34 with also present allergic
rhinitis) and 50 healthy subjects were enrolled in this study following informed consent and

Chapter 3 – Urine analysis
167
approval of the study protocol by Hospital Infante D. Pedro E.P.E (Aveiro, Portugal) and the
healthy population consisted of children of the faculty staff. The characteristics of the
asthmatics and healthy population are presented in Table 3.3.
Table 3.3 - Characteristics of the studied population: allergic asthma patients and healthy children.
Allergic asthma
(n=92)
Healthy
Children
Age (mean±SD) 9.5±3.2 8.8±3.5 Gender (male/female) 44/48 22/28
Pathology Allergic Asthma 58 (63%) -
Allergic Asthma + Allergic Rhinitis 34 (37%) - Allergensa Dust mite 47 (51%) -
Dust mite + gramineae 22 (23%) - Gramineae 10 (10%) -
Dust mite + cat fur 5 (5%) - Dust mite + cat fur + dog fur 4 (4%) -
Dust mite + gramineae + gat fur 2 (2%) - Gramineae + cat fur 2 (2%) -
Gramineae + cat fur + dog fur 1 (1%) - Dust mite + dog fur 1 (1%) -
Dust mite + olive tree 1 (1%) - Therapy
Corticosteroid + bronchodilator 14 (15%) - Corticosteroid + leukotriene receptor antagonist + bronchodilator 12 (13%) -
Corticosteroid + leukotriene receptor antagonist 9 (10%) - Nasal corticosteroid and bronchodilator 8 (9%) -
Leukotriene receptor antagonist + bronchodilator 8 (9%) - Nasal corticosteroid and antihistamine 7 (8%) -
Leukotriene receptor antagonist + bronchodilator + nasal 7 (8%) - Bronchodilator 5 (5%) - Antihistamine 5 (5%) -
Leukotriene receptor antagonist + nasal corticosteroid 4 (4%) - Corticosteroid 4 (4%) -
Corticosteroid + bronchodilator + antihistamine 2 (2%) - Corticosteroid + antihistamine 1 (1%) -
No therapy 6 (7%) - a Results obtained by prick-tests
Asthma diagnosis was made based on characteristic clinical symptoms and exams
(skin prick tests, lung function evaluation based on spirometry tests and IgE values).
Appropriate therapy was prescribed by the patient’s own physician and the allergic asthma
population represented a controlled asthma status. No restrictions were applied regarding
drugs or diet. The study was approved by the Hospital Ethics Committee. Each individual
(either patient or healthy volunteer) provided a urine sample in a sterile cup. Then, aliquots of
approximately 1 mL were transferred into vials, and stored at -80 °C (in average one month)
until analysis being each sample thawed once only for analysis.

Chapter 3 – Urine analysis
168
Sample Preparation and 1H NMR analysis
For 1H NMR analysis, urine samples were thawed and prepared as described by
Carrola et. al.42 Briefly, fine pH adjustment to 7.00 was performed by adding a few drops of 4
M solutions of KOD (98% atom D, Sigma-Aldrich, Madrid, Spain) or DCl (99% atom D,
Sigma-Aldrich, Madrid, Spain). After, the samples were centrifuged (8000 rpm for 5 min) and
transferred to a 5 mm NMR tube. 1H NMR spectra were acquired on a Bruker Avance DRX-500 spectrometer operating
at 500.13 MHz for 1H observation, at 300 K based on the developed method by Carrola et
al.42 for urine analysis. For each sample, a standard 1D 1H NMR spectrum was acquired,
using a water suppression pulse sequence.
Data processing
All spectra were processed with a line broadening of 0.3 and a zero filling factor of 2
manually phased and baseline corrected. The chemical shifts were referenced internally to the
sodium trimethlysilyl propionate-d4 (TSP) (98% atom D, Sigma-Aldrich, Madrid, Spain)
signal at δ 0.00. The obtained data was matched to reference spectra in the BBIOREFCODE-
2-0-0 database (Bruker Biospin, Rheinstetten, Germany), as well as other existing
databases43,44.
A total of 142 spectra corresponding to 92 allergic asthma patients and 50 healthy
children have been considered for multivariate analysis. To build the data matrix, variable
sized bucketing was performed in the δ 10.00-0.40 region of the standard 1D spectra,
excluding the sub-region δ 4.55-6.05 to remove variability arising from water suppression and
from possible cross-relaxation effect on the urea signal via solvent exchanging protons. The
bucketing procedure, carried out in Amix version 3.9 (Bruker BioSpin, Rheinstetten,
Germany), consisted of dividing the spectra into small regions (buckets) of 0.005 ppm42.
These buckets were then integrated and normalized by: i) adjusting the total area to unity, ii)
by creatinine signal and iii) through PQN. In the total area normalization, each observation is
set to have total unit intensity, dividing each data point by the total spectral area45.
Normalization by creatinine signal consists in the ratio of each data point to urinary creatinine
signal at 4.06ppm46 whilst PQN scales spectra, is estimated by analyzing the distribution of
quotients of the amplitudes of the spectrum to be normalized with those of a reference
spectrum47. PQN assumes that a majority of metabolites keep their concentrations unchanged
across the samples. Therefore, normalization is carried out based on the maximum probability

Chapter 3 – Urine analysis
169
of dilutions, which is estimated by the calculation of the most probable quotient between a
target spectrum and a reference spectrum. The PQN method takes the median of many
estimates rather than a single sum as the standard of normalization, and this makes it less
susceptible to outliers48. Data normalization takes into account the inevitable variation in
sample concentration and the efficiency of sample preparation procedure making data from all
samples directly comparable with each other49. This step is necessary, especially with urine
samples due to the variable nature of urinary concentration50.
Then, after data normalizing, PLS-DA, and OPLS-DA were performed in SIMCA-
P11.5 (Umetrics, Umeå, Sweden), employing a default 7-fold internal cross validation, from
which Q2 and R2 values, representing, respectively, the predictive capability and the explained
variance, were extracted. VIP is a summary of the importance of an X variable for both Y and
X. It is weighted sum of squares of the PLS-weights calculated from the amount of Y-
variance of each PLS component51.
Model robustness was assessed by MCCV with 500 iterations. For each of the 500
randomly generated classification models, the number of LV, the Q2 (expressing the cross
validated explained variability), and the classification rate (percentage of samples correctly
classified) were recovered. The selection of model complexity was based on the most frequent
list of model properties that maximizes the classification rate (i.e., lower LV and higher Q2).
The sensitivity and the specificity of the model were then depicted from the confusion matrix
resulting into a ROC map to further assess the results significance. Further validation was
performed by permutation analysis, consisting of randomly permuting class membership and
running 500 MCCV iterations. Sensitivity is calculated from the ratio between true positives
(asthma samples correctly predicted) and the total number of modelled urine samples,
whereas specificity is determined from the ratio between true negatives (control samples
correctly predicted) and the total number of modelled control RMN data.

Chapter 3 – Urine analysis
170
3.2.4 Results and discussion
Normalization of urinary compounds
Appropriate pre-treatment of metabolomic data is an essential step before the
application of multivariate statistical methods as it takes into account the inevitable variation
in sample concentration and the efficiency of sample preparation procedure52. In asthma
related NMR studies, different normalization methods were applied. For example, Saude et
al.1 referenced the identified metabolites in urine to creatinine levels whilst Jung et al.53
normalized the identified serum metabolites to the total spectral area. However, PQN has
been increasingly used in metabolomics as shown by Dieterle47 and Kohl52, among others. In
this study, a comparison of the performance of the data pre-treatment, previously reported in
asthma NMR studies, (creatinine signal and to total spectral area) and the increasingly used
PQN was performed and the reliability of data pre-treatment was evaluated using PLS-DA
models.
Scores plot for the first two latent variables of PLS-DA models for 1H NMR data are
shown in Figure 3 comparing different normalization procedures, total area normalization
(Figure 3.6 A), creatinine normalization (Figure 3.6 B) and PQN (Figure 3.6 C). As observed,
PQN transformation has a positive impact in the discrimination power and the models,
consisting of two components, had R2, which is the cumulative sum of squares of all the X’s
explained by all extracted components, for total area normalization of 0.03, creatinine
normalization of 0.11 and using PQN 0.22. The application of PQN resulted in an improved
R2 when compared with the remaining two normalization procedures. Normalizing samples
through creatinine has shown some disadvantages as this compound is not constant and may
be related to muscle mass particularly in children46. PQN has shown that performs adequately
in compensating for different urine dilutions and is more accurate even with low metabolic
variations47. For further studies, the model that used PQN was chosen as it was demonstrated
that the PQN normalization provided the best results in terms of group discrimination.

Chapter 3 – Urine analysis
171
Figure 3.6 - Partial Least Squares Discriminant Analysis (PLS-DA) applied to 1H NMR urine spectra (δ0.50 to
10.0, excluding 4.55-6.05) using different data normalization techniques: (A) normalized to total area, (B)
normalized to creatinine signal and (C) by probabilistic quotient normalization (PQN). The R2 for the total area,
creatinine normalizations and PQN was 0.03, 0.11 and 0.22, respectively. The healthy subjects are in full
symbols whilst the asthma patients are represented by open symbols.
-400
-300
-200
-100
0
100
200
300
-100 -50 0 50 100
LV
2 (4
%)
LV1 (12%)
-200
-150
-100
-50
0
50
100
150
200
-300 -200 -100 0 100 200 300LV
2 (2
%)
LV1 (21%)
Healthy Asthma
-80
-60
-40
-20
0
20
40
60
80
100
-100 -50 0 50 100
LV2
(4%
)
LV1 (4%)
(A)
(B)
(C)

Chapter 3 – Urine analysis
172
PLS-DA is often used in the metabolomics field and this tool is known to overfit the
data specially when a smaller number of samples is used whe compared to the number of
varibales. Therefore, validating the obtained models is necessary and cross validation is often
performed with the analysis of several parameters such as Q2 value, true positives, true
negatives, false positives, misclassifications and receiver operating characteristic curves54.
MCCV statistics was applied to the PQN-PLS-DA model (Figure 3.6 C) to assess the
predictive ability of the classification model.
Figure 3.7 – ROC space, where each point represents a prediction result (sensitivity and 1-specificity) of the
confusion matrices obtained from MCCV of the PLS-DA model with PQN; full symbols, prediction results in
the original model (class membership, healthy or asthma, correctly assigned); open symbols, prediction results in
the permuted model (class membership randomly permuted)
0
0.1
0.2
0.3
0.4
0.5
0.6
0.7
0.8
0.9
1
0 0.2 0.4 0.6 0.8 1
TPR
(sen
siti
vity
)
FPR (1-specificity)
True classes Permuted classes
0%
5%
10%
15%
20%
25%
30%
35%
40%
-1
-0.9
-0.8
-0.7
-0.6
-0.5
-0.4
-0.3
-0.2
-0.1 0
0.1
0.2
0.3
0.4
0.5
0.6
0.7
0.8
0.9 1
Fre
qu
ency
Q2 values
True Classes Permuted Classes

Chapter 3 – Urine analysis
173
The average Q2 for the 500 runs was 0.5, with a large prevalence of values in the range
0.4-0.6. According to the resulting confusion matrix, the PQN-PLS-DA model (Figure 3.7)
showed approximately 85% sensitivity, with 15% of asthma patients being misclassified as
healthy, and 72% specificity, with 18% false positives. The classification rate (total number of
samples correctly classified) was 80%.
Improving metabolomic data through variable selection
The PLS-DA LV1 loadings were colored according to VIP and carefully inspected
(Figure 3.8). The identification of compounds with VIP>1 was performed and 12 compounds
were responsible for the attained discrimination.
Figure 3.8 – PLS-DA LV1 loadings plot of all compounds colored as a function of VIP. Blue represents VIP
starting from 0 and red represents the highest obtained VIP value
Positive signals with high VIP values (>1.0), corresponding to compounds with
increased levels in healthy children, were found for trimethylamine-N-oxide and trigonelline.
On the other hand, the signals showing negative intensity and high VIP values were from β-
aminoisobutyrate, lactate + threonine, histidine, phenylacetylglutamine, acetate, p-cresol,
ppm8 6 4 2
ppm
9.5 9.0 8.5 8.0 7.5 7.0 6.5
-150
00-1
000
0-5
000
05
000
100
00
ppm
o-LV
1 lo
adin
gs
3.0 2.5 2.0 1.5 1.0 0.5
-400
00
-200
000
2000
040
000
ppm
o-LV
1 lo
adin
gs
Trigollenine
Histidine
Indoxylsulfate
Phenylacetylglutamine
p-cresol
Tyrosine
ββββ-aminoisobutyrateLactate +Threonine
TMAO
Trigollenine
Succinate
p-cresol
Citrate
2468
0
1.72
3.43
1.72
3.43
0.00
05.
0e4
1.0e
51.
5e5
2.0e
52.
5e5
LV1
load
ings
0.51.01.52.02.53.06.57.07.58.08.59.5 8.5
ppm ppm
Healthy
Asthma
Asthma
Healthy
Asthma
Healthy
LV1
load
ings
-1.5
e4-1
.0e4
-5.0
e30
5.0e
31.
0e4
-4.0
e4-2
.0e4
02.
0e4
4.0e
4

Chapter 3 – Urine analysis
174
succinate, citrate, tyrosine and indoxyl sulphate meaning that these compounds were
consistently elevated in the urine of asthma patients relatively to healthy children (Table 3.4).
Table 3.4 – Compounds (variables) contributing for the discrimination between healthy subjects and asthma
patients (VIP>1; highest VIP and corresponding chemical shift highlighted) and comparison between the data
available in the literature for each compound and the obtained results in this study.
Compounds δδδδ 1H(ppm)
VIP Possible biochemical origin(s) ↑↑↑↑
Comparison to literature results
Phenylacetylglutamine
1.93 2.70 Increased in syndromes of
phospholipidosis impaired
amino acid absorption; gut microflora
Asthma - 2.11 2.00 2.27 2.30 7.36 2.50
7.43 2.97
Succinate 2.41 2.89 TCA cycle Asthma Saude et al.1
Asthma↑↑↑↑
Acetate 1.93 2.70 TCA cycle Asthma Jung et al.
53 Control↑↑↑↑
Tyrosine 6.91 2.65
Modification of free tyrosine residues by eosinophil activity
in the airways of humans with asthma; Amino acid oxidation
Asthma Saude et al.
1 Asthma↑↑↑↑
Indoxyl sulphate 7.51 2.42
Oxidative stress Asthma - 7.70 2.19
p-Cresol
2.35 1.60 End-product of protein breakdown; compound
of the amino acid tyrosine (gut microflora)
Asthma - 7.21 2.16
7.28 2.18
Histidine 3.74 2.07
Histamine metabolism Asthma Saude et al.
1 Control↑↑↑↑
3.75 2.08 7.97 2.12
Lactate + threonine 1.33 1.95 Lactic acidosis Asthma
Saude et al.1
Asthma vs. Emergency Department
Asthma↑↑↑↑
Citrate 2.54 1.91 TCA cycle Asthma - 2.68 1.77
β-Aminoisobutyrate 1.20 1.70 Thymine catabolism/metabolism
Asthma -
Trigonelline
4.44 3.28 Diet; Impairment of nicotinate and nicotinamide metabolism
Healthy Saude et al.
1 Asthma↑↑↑↑
8.83 3.11 8.85 3.12 9.12 3.25
Trimethylamine-N-oxide
3.27 1.89 Diet Healthy Saude et al.
1 Control ↑↑↑↑

Chapter 3 – Urine analysis
175
Metabolomic studies benefit from variable selection methods, based on VIP or even
from selecting specific chemical shifts creating new datasets improving the developed
models55. The VIP assesses the significance of each variable in the projection, summarizing
the contribution that a variable makes to the model and usually an appropriate threshold is
1.056,57. The yielded R2 values of PQN-PLS-DA model were low for studies in metabolomic
field for complex sample analysis. With this in mind, VIP and spectrum region selection
variable selection were performed. A new model was constructed using only the variables
with VIP>1 and the results are shown in Figure 3.9 A. An improvement of Q2 was observed
from 0.221 to 0.558.
Figure 3.9 – Scores plot for the first two latent variables of PLS-DA models from 1H NMR spectra of urine
using PQN using two possible variable selection: (A) Variable Importance in Projection (VIP) higher than 1 and
(B) by selecting regions between 0.5-3 ppm and 6-9.5ppm combined with VIP>1
-80
-60
-40
-20
0
20
40
60
80
100
-100 -50 0 50 100
LV
2 (8
%)
LV1 (10%)
Healthy Asthma(A)
-60
-40
-20
0
20
40
60
80
-100 -50 0 50 100
LV
2 (9
%)
LV1 (13%)
(B)

Chapter 3 – Urine analysis
176
Another variable selection tested was to select regions between 0.5-3 ppm and 6-9.5
ppm and choosing the signals with VIP>1 (Figure 3.9 B). With this selection, Q2 improved
but to a lesser extent of 0.539 and MCCV was also performed for the regions models and the
results are shown in Table 3.5. Table 3.5 summarizes the results obtained in MCCV. These
results show that variable selection (VIP>1 and δ 0.5-3+6-9.5 combined with VIP>1), in
which subsets are created from the original dataset, improved predictive power and MCCV
performance, which allowed to filter the information and focus on the significant compounds.
Table 3.5 – Prediction Results Obtained by MCCV (500 Iterations) of PLS-DA Models Built for the Classes:
Healthy vs Asthma (n=142).Comparison between the PLS-DA using PQN, and a selection of variables with VIP
higher than 1 (VIP>1) and by selecting regions between 0.5-3ppm and 6-9.5ppm combined with VIP>1 (regions)
Model Q2
Classification
Rate (%) Sensitivity (%) Specificity (%)
PLS-DA PQN 0.221 80.3 85.2 71.8
PLS-DA PQN VIP>1 0.558 83.3 89.3 72.3
PLS-DA PQN regions 0.539 83.9 90.3 72.1
MCCV was performed to the two variable selections performed and as seen on Table
3.5 all parameters improved: classification rate of 83.3%, and method sensitivity of 89.3%,
whilst the specificity remained at 72.3% (Figure 3.10). Another possibility to improve the
developed statistical models and to reduce the number of variables is to choose specific 1H
NMR spectral regions. This was performed by choosing regions PQN δ0.5-3 and 6-9.5ppm
selecting the compounds with VIP>1.

Chapter 3 – Urine analysis
177
Figure 3.10 - ROC space, where each point represents a prediction result (sensitivity and 1-specificity) of the
confusion matrices obtained from MCCV (500 iterations) of the (A) PLS-DA model with PQN and selecting
variables VIP >1 and (B) model with PQN and selecting regions between 0.5-3ppm and 6-9.5ppm combined
with VIP>1. Full symbols, prediction results in the original model (class membership, healthy or asthma,
correctly assigned); open symbols, prediction results in the permuted model (class membership randomly
permuted)
Asthma urinary asthma metabolomics based on 1H NMR
From Table 3.4, it was possible to identify the compounds that discriminate asthma
and healthy groups, where trimethylamine-N-oxide and trigonelline characterizes the healthy
population and β-aminoisobutyrate, lactate + threonine, histidine, phenylacetylglutamine,
acetate, p-cresol, succinate, citrate, tyrosine and indoxyl sulphate the asthmatics. The possible
biochemical origins of the compounds are shown in Table 3.3 and a closer look into the
metabolic pathways that might be affected by asthma will be made.
Succinate and citrate58 are known compounds related to the TCA cycle, which have
been reported to be increased in the asthma patients1 show similar behavior in the results
obtained in urina of the asthma population (Table 3.4), confirming that this biochemical
pathway is affected by the asthma pathology. Citrate has been reported by Loureiro et al.59 to
be increased in asthmatic patients with a stable condition, relating this compound with the
disturbance of the TCA cycle. Acetate, which is oxidized in TCA cycle, was found to be
0
0.1
0.2
0.3
0.4
0.5
0.6
0.7
0.8
0.9
1
0 0.2 0.4 0.6 0.8 1
TPR
(sen
siti
vity
)
FPR (1-specificity)
True classes Permuted classes
0
0.1
0.2
0.3
0.4
0.5
0.6
0.7
0.8
0.9
1
0 0.2 0.4 0.6 0.8 1
TPR
(sen
siti
vity
)
FPR (1-specificity)
True classes Permuted classes(A) (B)
0%
5%
10%
15%
20%
25%
30%
35%
40%
-1
-0.9
-0.8
-0.7
-0.6
-0.5
-0.4
-0.3
-0.2
-0.1 0
0.1
0.2
0.3
0.4
0.5
0.6
0.7
0.8
0.9 1
Fre
quen
cy
Q2 values
True Classes Permuted Classes
0%
5%
10%
15%
20%
25%
30%
35%
40%
-1
-0.9
-0.8
-0.7
-0.6
-0.5
-0.4
-0.3
-0.2
-0.1 0
0.1
0.2
0.3
0.4
0.5
0.6
0.7
0.8
0.9 1
Fre
quen
cy
Q2 values
True Classes Permuted Classes

Chapter 3 – Urine analysis
178
elevated in urine of the asthma population (Table 3.4). Jung et al.53 detected it in the sera of
asthma patients, nevertheless exihibiting an opposite behavior from the one observed in our
study. As urine is an excretion fluid, we may conjecture that the higher levels obtained in
urine are due to kidneys activity. The decreased levels of these compounds may lead to
conclude that the energy metabolism may be affected in asthmatics because hypoxia is known
to affect all processes from the TCA cycle and it is a well known fact that asthmatics have
decreased lung capacities and thus affecting the TCA cycle. Wang et al.60 have found this
compound to be elevated in COPD patients and associated it to an accelerated lipid
catabolism to satisfy energy requirements. TCA cycle anomalies have been known to cause
several diseases61, as it is a crucial process for the cell basal metabolism.
Another biochemical pathway that might be affected by asthma pathology is lactic
acidosis, which is a physiological condition characterized by low pH in body tissues
accompanied by lactate build-up and which is indicative of hypoxia. This leads to metabolize
glucose anaerobically and by this way lactate is formed58. Our results show that lactate +
threonine are elevated in the asthma population under study (Table 3.4). Saude et al.1,
reported that the level of this compound was elevated when comparing stable asthma patients,
emergency department asthma patients and healthy children. According to Loureiro et al59
.,
its content seems to be higher in exarbeated condition when compared to patients with an
asthma stable condition.
Histidine is a precursor for histamine biosynthesis and the compound histidine is
increased in the asthmatic urine profile (Table 3.4). This behavior allowed to infer that the
metabolic pathway that involves histidine may be affected by the asthma pathology as Jung et
al.53 demonstrated in their study. The hypothesis that can be formed by the elevated levels of
histidine in asthmatics is that the higher bioavailability of this compound can lead to a higher
rate in histidine decarboxylation to yield histamine. Histamine is a inflammatory mediator
always present and associated to the asthma pathology as potent constrictor of airway smooth
muscle62.
Eosinophils promote tissue injury contributing to asthma pathogenesis and it has been
verified that tyrosine is a part of the modification of free tyrosine residues after eosinophil
stimulation and degranulation that occurs in the airways of humans with asthma63. This
compound is also formed by amino acids oxidation induced directly by reactive oxygen
species or indirectly by secondary by-products of oxidative stress reactions64. According to
the results obtained (Table 3.4), this compound is also responsible for the discrimination

Chapter 3 – Urine analysis
179
attained between the asthmatic and healthy population, being elevated in the former, which
leads to confirm that this biochemical pathways may be affected by the asthma pathology.
The levels of phenylacetylglutamine are elevated in the asthma population, and
observing the VIP of this compound in Table 3.4, we can verify that from all compounds it
has the highest VIP (2.97) correspondent to the peak at 7.43ppm. This compound has shown
to be increased in syndromes of phospholipidosis impaired amino acid absorption, states of
increased gut absorption of phenylacetate65, and the development of atopy and asthma may be
influenced by gut permeability and gut microflora66. Asthma and gut permeability has been
previously linked67, as asthma is a T lymphocyte mediated inflammatory disease. It has been
suggested that the whole mucosal system might be involved, with activated T lymphocytes
migrating from one mucosal site to another68. The link between gut microflora and asthma is
related to the “hygiene hypothesis”. The “hygiene hypothesis” for allergies and asthma states
that a lack of microbial stimulation results in aberrant immune responses to innocuous
antigens later in life69. Evidence that sustains this hypothesis directs to the “microbiota
hypothesis” where changes in the gastrointestional microbiota composition (specially in the
Western geographical areas) change the mechanisms of mucosal immunologic tolerance
owing to antibiotic use, dietary changes and other lifestyle variations. Epidemiologic and
clinical data supporting this information includes, for example, a positive association between
increasing risk for asthma/allergies and the increase use of antibiotics and the intake of oral
probiotics and/or dietary changes in some individuals prevented/reduced allergies70. p-Cresol
is also a compound generated from tyrosine by gut microflora71. As previously shown, the
asthmatic gut microflora might be affected by asthma and elevated levels of p-cresol might
show this effect.
β-Aminoisobutyrate is the product of the catabolism of the pyrimidine bases uracil
and thymine in what constitutes the first step of pyrimidine degradation pathway62. This
compound was found to be increased in urine of asthmatics (Table 3.4) and to the best of our
knowledge this pathway has not been associated to asthma . Oxidative stress related to asthma
is a studied phenomena72. This phenomenon damages several biomolecules as lipids, proteins
and DNA. ROS react with DNA adding to the DNA double bond. By abstraction of an
hydrogen atom from methyl group of thymine several pyrimidine radicals are formed73.
Hasbal and co-authors74 documented an increase in DNA strand breaks in children with
asthma that can be formed by direct interaction with ROS and as β-aminoisobutyrate is
related to the catabolism of pyrimidine bases this compound identified in our study may
indicate the DNA damage that asthma causes.

Chapter 3 – Urine analysis
180
Indoxyl sulphate is increased in urine of asthma patients (Table 3.4). Indoxyl sulphate,
beside being a compound of the common amino acid tryptophan75, induces oxidative stress in
vascular endothelial cells76 and strongly decreases the levels of glutathione, one of the most
active antioxidant systems of the cells77.
3.2.5 Concluding remarks
In this study, metabolomic urinary profile of an asthma pediatric population was
explored by 1H NMR. 1H NMR technology in the analysis of urine combined with
multivariate tools can be used to differentiate allergic asthma children from a healthy
population.
The pre-treatment of metabolomic data is a ubitiquous step before the application of
multivariate statistical tools. In this study three normalization methods were tested and PQN
yielded the best results when compared to normalization to total area and creatinine signal.
Variable (VIP >1) and spectrum region (0.5-3ppm and 6-9.5ppm) selection was also tested.
The results showed that a combination between these selection gave the same results. MCCV
was performed for all developed models. The improvement by the aforementioned selections
was also observed by the validation results where all parameters from Q2, classification rate,
sensitivity and specificity improved. Analysing the obtained loadings, the compounds
responsible for the discrimination of the asthma and healthy groups were identified. These
were trimethylamine-N-oxide and trigonelline for the healthy population and β-
aminoisobutyrate, lactate + threonine, histidine, phenylacetylglutamine, acetate, p-cresol,
succinate, citrate, tyrosine and indoxyl sulphate for the asthmatics.
A metabolic signature comprising an array of biochemical pathways altered in asthma
patients was obtained. Overall, TCA cycle, lactic acidosis, histidine metabolism, modification
of free tyrosine residues after eosinophil stimulation, alterations in intestinal microflora, DNA
damage and oxidative stress were the possible identified biochemical pathways. It was also
possible to obtain information on DNA damage produced by ROS probably derived from
hypoxia state.
Urine analysis by 1H NMR can be used as a diagnostic tool as it is easily applied in a
clinical setting and can be incorporated into a laboratory, as other technology has been in the
past. Moreover, urinary metabolomic profiles related to asthma can be made using 1H NMR,
bringing information on asthma-related changes in several biochemical pathways.

Chapter 3 – Urine analysis
181
3.4 References
(1) Saude E.J., Skappak C.D., Regush S., Cook K., Ben-Zvi A., Becker A., Moqbel R., Skyes B.D., Howe B.H.,
Adamko D.J., Metabolomic profiling of asthma: diagnostic utility of urine nuclear magnetic resonance spectroscopy. J. Allergy Clin. Immunol. (2011)127: 757-764.
(2) Snowden S., Dahlén S.E., Wheelock C.E., Application of metabolomics approaches to the study of respiratory diseases. Bioanalysis (2012) 4: 2265-2960.
(3) Admako D.J., Skyes B.D., Rowe B.H., The metabolomics of asthma: novel diagnostic potential. Chest (2012) 141: 1295-1302.
(4) Rocha S.M., Caldeira M., Carrola J., Santos M., Cruz N., Duarte I.F., Exploring the human urine metabolomic potentialities by comprehensive two-dimensional gas chromatography coupled to time of flight mass spectrometry. J. Chromatogr. A (2012) 1252: 155-163.
(5) Kalluri U., Naiker M., Myers M.A., Cell culture metabolomics in the diagnosis of lung cancer—the influence of cell culture conditions., J. Breath Res. (2014) 8: 027109.
(6) Meager E.A., Fitzgerald G.A., Indices of lipid peroxidation in vivo: strengths and limitations. Free Radic. Biol. Med. (2000) 28: 1745-1750.
(7) van den Berg R.A., Hoefsloot H.C., Westerhuis J.A., Smilde A.K., van der Werf M.J., Centering, scaling, and transformations: improving the biological information content of metabolomics data. BMC Genomics (2006) 7: 142-157.
(8) Weber C.M., Cauchi M., Patel M., Bessant C., Turner C., Britton L.E., Willis C.M., Evaluation of a gas sensor array and pattern recognition for the identification of bladder cancer from urine headspace. Analyst (2011) 136: 359-364.
(9) R Development Core Team. R: A Language and Environment for Statistical Computing, 2.9.2 ; R Foundation for Statistical Computing: Vienna, Austria, 2010.
(10) Eriksson, L., Johansson, E., Kettaneh, N., Wold, N., Wold, S., Multi and Megavariate Data Analysis, Principles and Applications (2001) Umetrics AB Umea, Sweden.
(11) Picard, R.R., Cook, R.D., Cross-validation of regression-models. J. Am. Stat. Assoc. (1984) 79: 575-583. (12) Xu Q.-S., Liang Y.-L., Du Y.-P., Monte Carlo cross-validation for selecting a model and estimating the
prediction error in multivariate calibration. J. Chemometrics (2004)18: 112-120. (13) Almstetter M.F., Oefner P.J., Dettmer K., Comprehensive two-dimensional gas chromatography in
metabolomics. Anal. Bioanal. Chem. (2012) 402: 1993-2013. (14) Zushi Y., Hashimoto S., Fushimi A., Takazawa Y., Tanabe K., Shibata Y., Rapid automatic identification
and quantification of compounds in complex matrices using comprehensive two-dimensional gas chromatography coupled to high resolution time-of-flight mass spectrometry with a peak sentinel tool. Anal. Chim. Acta. (2013) 778:54-62.
(15) Silva B.J., Tranchida P.Q., Purcaro G., Queiroz M.E., Mondello L., Lanças F.M., Evaluation of comprehensive two-dimensional gas chromatography coupled to rapid scanning quadrupole mass spectrometry for quantitative analysis. J. Chromatogr. A. (2012) 1255: 177-183.
(16) von Mühlen C., Marriott P.J., Retention indices in comprehensive two-dimensional gas chromatography. Anal. Bioanal. Chem. (2011) 401: 2351-2360.
(17) Dallüge J., Beens J., Brinkman U.A., Comprehensive two-dimensional gas chromatography: a powerful and versatile analytical tool. J. Chromatogr. A. (2003) 1000: 69-108.
(18) Rocha S.M., Freitas R., Cardoso P., Santos M., Martins R., Figueira E., xploring the potentialities of comprehensive two-dimensional gas chromatography coupled to time of flight mass spectrometry to distinguish bivalve species: comparison of two clam species (Venerupis decussata and Venerupis philippinarum). J. Chromatogr. A, (2013) 1315: 152-161.
(19) Polkowska Z., Kozłowska K., Mazerska Z., Górecki T., Namieśnik J., Volatile organohalogen compounds in human urine: the effect of environmental exposure. Chemosphere (2006) 62: 626-640.
(20) Mills G.A., Walker V., Headspace solid-phase microextraction profiling of volatile compounds in urine: application to metabolic investigations. J. Chromatogr. B Biomed. Sci. Appl. (2001) 753: 259-268.
(21) Bouatra S., Aziat F., Mandal R., Guo A.C., Wilson M.R., Knox C., Bjorndahl T.C., Krishnamurthy R., Saleem F., Liu P., Dame Z.T., Poelzer J., Huynh J., Yallou F.S., Psychogios N., Dong E., Bogumil R., Roehring C., Wishart D.S., The human urine metabolome PLoS One (2013) 4: e73076.
(22) Tangerman A., Measurement and biological significance of the volatile sulfur compounds hydrogen sulfide, methanethiol and dimethyl sulfide in various biological matrices. J. Chromatogr. B (2009) 877: 3366-3377.

Chapter 3 – Urine analysis
182
(23) Hakim M., Broza Y.Y., Barash O., Peled N., Phillips M., Amann A., Haick H., Volatile organic compounds
of lung cancer and possible biochemical pathways. Chem. Rev. (2012):112 5949-5966. (24) Auman J.T., Boorman G.A., Wilson R.E., Travlos G.S., Paules R.S., Heat map visualization of high-density
clinical chemistry data. Physiol. Genomics 31 (2007) 352-356. (25) Mieth M., Schubert J.K., Gröger T., Sabel B., Kischkel S., Fuchs P., Hein D., Zimmermann R., Miekisch
W., Automated needle trap heart-cut GC/MS and needle trap comprehensive two-dimensional GC/TOF-MS for breath gas analysis in the clinical environment. Anal. Chem. (2010) 82: 2541-2551.
(26) Warrack B.M., Hnatyshyn S., Ott K.-H., Reily M.D., Sanders M., Zhang H., Drexler D.M., Normalization strategies for metabonomic analysis of urine samples. J. Chromatogr. B (2009) 877: 547-552.
(27) Nadeem A., Chhabra S.K., Masood A., Raj H.G., Increased oxidative stress and altered levels of antioxidants in asthma. J. Allergy Clin. Immunol. (2003) 111: 72-78.
(28) Celik M., Tuncer A., Soyer O.U., Saçkesen C., Tanju Besler H., Kalayci O., xidative stress in the airways of children with asthma and allergic rhinitis. Pediatr. Allergy Immunol. (2012) 23: 556-561.
(29) Henricks P.A.J., Nijkamp F.P., Reactive oxygen species as mediators in asthma. Pulm. Pharmacol. Ther. (2001) 14: 409-421.
(30) Nadeem A., Masood A., Siddiqui N., Oxidant--antioxidant imbalance in asthma: scientific evidence, epidemiological data and possible therapeutic options. Ther. Adv. Respir. Dis. (2008) 2: 215-235.
(31) Murray R., Granner D., Mayes P., Rodwell V., Harper’s Illustrated Biochemistry, 27th ed.. (2006) McGraw-Hill Medical: New York, USA.
(32) Kolokolova T.N., Savel’ev O.Y., Sergeev N.M., Metabolic analysis of human biological fluids by 1H NMR spectroscopy. J. Anal. Chem. (2008) 63:104-120.
(33) Barding Jr G.A., Salditos R., Larive J.K., Quantitative NMR for bioanalysis and metabolomics. Anal. Bioanal. Chem. (2012) 404: 1165-1179.
(34) Duarte I.F., Gil A.M., Metabolic signatures of cancer unveiled by NMR spectroscopy of human biofluids. Prog. Nucl. Mag. Res. Sp. (2012) 62: 51-74.
(35) Malet-Martino M., Holzgrabe U., NMR techniques in biomedical and pharmaceutical analysis. J. Pharmaceut. Biomed. (2011) 55: 1-15.
(36) Keun H.C., Ebberls T.M., Antti H., Bollard M.E., Beckonert O., Schlotterbeck G., Senn H., Niederhauser U., Holmes E., Lindon J., Nicholson J., Analytical reproducibility in 1H NMR-based metabonomic urinalysis. Chem. Res. Toxicol. (2002) 15: 1380-1386.
(37) Dumas M.E., Malbaum E.C., Teague C., Ueshima H., Zhou B., Lindon J., Nicholson J., Stamler J., Elliot P., Chan Q., Holmes E., Assessment of analytical reproducibility of 1H NMR spectroscopy based metabonomics for large-scale epidemiological research: the INTERMAP study. Anal. Chem. (2006) 78: 2199-2208.
(38) Maher A.D., Zirah S., Holmes E., Nicholson J., Experimental and analytical variation in human urine in 1H NMR spectroscopy-based metabolic phenotyping studies. Anal. Chem. (2007) 79: 5204-5211.
(39) Loureiro C.C., Duarte I.F., Gomes J., Carrola J., Barros A.S., Gil A.M., Bousquet J., Bom A.T., Rocha S.M., Urinary metabolomic changes as a predictive biomarker of asthma exacerbation. J. Allergy Clin. Immunol. (2014) 133: 261-263.e5.
(40) Jung J., Kim S.H., Lee H.S., Choi G.S., Jung Y.S., Ryu D.H., Park H.S., Hwang G.S., Serum metabolomics reveals pathways and biomarkers associated with asthma pathogenesis. Clin. Exp. Allergy (2013) 43: 425-433.
(41) Kohl S., Klein M., Hochrein J., Oefner P., Spang R., Gronwald W., State-of-the art data normalization methods improve NMR-based metabolomic analysis. Metabolomics (2012) 8: 146-160.
(42) Carrola J., Rocha C.M., Barros A.S., Gil A.M., Goodfellow B.J., Carreira I.M., Bernardo J., Gomes A., Sousa V., Carvalho L., Duarte I.F., Metabolic Signatures of Lung Cancer in Biofluids: NMR-Based Metabonomics of Urine. J. Proteome Res. (2011) 10: 221-230.
(43) Wishart D.S., Tzur D., Knox C., Eisner R., Guo A.C., Young N., Cheng D., Jewell K., Arndt D., Sawhney S., Fung C., Nikolai L., Lewis M., Coutouly M.A., Forsythe I., Tang P., Shrivastava S., Jeroncic K., Stothard P., Amegbey G., Block D., Hau D.D., Wagner J., Miniaci J., Clements M., Gebremedhin M., Guo N., Zhang Y., Duggan G.E., Macinnis G.D., Weljie A.M., Dowlatabadi R., Bamforth F., Clive D., Greiner R., Li L., Marrie T., Sykes B.D., Vogel H.J., Querengesser L., HMDB: the human metabolome database. Nucleic Acids Res. (2007) 35: 521-526.
(44) Psychogios N N., Hau D.D., Peng J., Guo A.C., Mandal R., Bouatra S., Sinelnikov I., Krishnamurthy R., Eisner R., Gautam B., Young N., Xia J., Knox C., Dong E., Huang P., Hollander Z., Pedersen T.L., Smith S.R., Bamforth F., Greiner R., McManus B., Newman J.W., Goodfriend T., Wishart D.S., The human serum metabolome. Plos One (2011) 6: e16957.
(45) Craig A., Cloarec O., Holmes E., Nicholson J.K., Lindon J.C., Scaling and Normalization Effects in NMR Spectroscopic Metabonomic Data Sets. Anal. Chem. (2006) 78: 2262-2267.

Chapter 3 – Urine analysis
183
(46) Prevot A., Martini S., Guignard J.P., Glomerular filtration markers in paediatrics. Rev. Med. Suisse
Romande (2002) 122: 625-630. (47) Dieterle F., Ross A., Schlotterbeck G., Seen H., Probabilistic Quotient normalization as robust method to
account for dilution of complex biological mixtures. Application in 1H NMR metabonomics. Anal. Chem. (2006) 78: 4281-4290.
(48) Torgrip R.J.O., Åberg K.M., Alm E., Schuppe-Koistinen I., Lindberg J., A note on normalization of biofluid 1D 1H-NMR data. Metabolomics (2008) 4: 114-121.
(49) Dong J., Cheng K.H., Xu J., Chen Z., Griffin J., Group aggregating normalization method for the preprocessing of NMR-based metabolomic data. Chem. Intell. Lab Syst. (2011) 108: 123-132.
(50) Wright C.A., Howles S., Trudgian D.C., Kessler B.M., Reynard J.M., Noble J.G., Hamdy F.C.,. Turney B.W, Label-free Quantitative Proteomics Reveals Differentially Regulated Proteins Influencing Urolithiasis. Mol. Cell. Proteomic (2011) 10: M110.005686.
(51) Wold S., Sjöström M., Eriksson L., PLS-regression: a basic tool of chemometrics. Chemometr. Intell. Lab. (2001) 58: 109-130.
(52) Kohl S., Klein M., Hochrein J., Oefner P., Spang R., Gronwald W., State-of-the art data normalization methods improve NMR-based metabolomic analysis. Metabolomics (2012) 8: 146-160.
(53) Jung J., Kim S.H., Lee H.S., Choi G.S., Jung Y.S., Ryu D.H., Park H.S., Hwang G.S., Serum metabolomics reveals pathways and biomarkers associated with asthma pathogenesis. Clin Exp Allergy (2013) 43:425-433.
(54) Westerhuis J.A., Hoefsloot H.C.J., Smit S., Vis D.J., Smilde A.K., van Velzen E.J.J., van Duijnhoven J.P.M., van Dorsten F.A., Assessment of PLSDA cross validation. Metabolomics (2008) 4: 81-89.
(55) Diaz S.O., Barros A.S, Goodfellow B.J., Duarte I.F., Galhano E., Pita C., Almeida M., Carreira I.S., Gil A.M., Second Trimester Maternal Urine for the Diagnosis of Trisomy 21 and Prediction of Poor Pregnancy Outcomes. J. Proteome Res. (2013) 12: 2946-2957.
(56) Bryan K. , Brennan L., Cunningham P., MetaFIND: A feature analysis tool for metabolomics data. BMC Bioinformatics (2008) 9: 470-483.
(57) Maraschin M., Somensi-Zeggio A., Oliveira S.K., Kuhnen S., Tomazzoli M.M., Zeri A.C.M., Carreira R., Rocha M., A Machine Learning and Chemometrics Assisted Interpretation of Spectroscopic Data – A NMR-Based Metabolomics Platform for the Assessment of Brazilian Propolis. Lect. Notes Comput. Sc. (2012) 7632: 129-140.
(58) Murray R.K., Granner D.K., Mayes P.A., Rodwell V.W., Harper’s Illustrated Biochemistry. (2003) McGraw-Hill, New York, USA
(59) Loureiro C.C., Duarte I.F., Gomes J., Carrola J., Barros A.S., Gil A.M., Bousquet J., Bom A.T., Rocha S.M., Urinary metabolomic changes as a predictive biomarker of asthma exacerbation. J. Allergy Clin. Immunol. (2014) 133: 261-263.e5.
(60) Wang L., Tang Y., Liu S., Mao S., Ling Y., Liu D., He X., Wang X., Metabonomic Profiling of Serum and Urine by 1H NMR-Based Spectroscopy Discriminates Patients with Chronic Obstructive Pulmonary Disease and Healthy Individuals. Plos One (2013) 8: e65675.
(61) Brière J.J., Favier J., Gimenez-Roqueplo A.P., Rustin P., Tricarboxylic acid cycle dysfunction as a cause of human diseases and tumor formation. Am. J. Physiol. Cell Physiol. (2006) 291: 1114-1120.
(62) Dunford P.J., Holgate S.T., Histamine in Inflammation, The role of histamine in asthma (2010) Springer, New York, USA.
(63) Wu W., Samoszuk M.K., Comhair S.A., Thomassen M.J., Farver C.F., Dweik R.A., Kavuru M.S., Erzurum S.C., Hazen S.L., Eosinophils generate brominating oxidants in allergen-induced asthma. J. Clin. Invest. (2000) 105: 1455–1463.
(64) Dalle-Donne I., Giustarini D., Colombo R., Rossi R., Milzani A., Protein carbonylation in human diseases. Trend. Mol. Med. (2003) 9: 169-176.
(65) Delaney J., Neville W.A., Swain A., Miles A., Leonard M.S., Waterfield C.J., Phenylacetylglycine, a putative biomarker of phospholipidosis: its origins and relevance to phospholipid accumulation using amiodarone treated rats as a model. Biomarkers (2004) 9: 271–290.
(66) Hörmannsperger G., Clavel T., Haller D., Gut matters: Microbe-host interactions in allergic diseases. J. Allergy Clin. Immunol. (2012) 129: 1452-1459.
(67) Benard A., Desreumeaux P., Huglo D., Hoorelbeke A., Tonnel A.B., Wallaert B., Increased intestinal permeability in bronchial asthma. J Allergy Clin. Immunol. (1996) 97: 1173-1178.
(68) Hijazi Z., Molla A.M., Al-Habashi H., Muawad W.M., Molla A.M., Sharma P.N., Intestinal permeability is increased in bronchial asthma. Arch. Dis. Child. (2004) 89: 227-229.
(69) Wills-Karp M., Santeliz J., Karp C.L., The germless theory of allergic disease: revisiting the hygiene hypothesis. Nat. Rev. Immunol. (2001) 1: 69-75.
(70) Huffnagle G.B., The Microbiota and Allergies/Asthma. PLoS Pathog. (2010) 6: e1000549.

Chapter 3 – Urine analysis
184
(71) Smith E.A., Macfarlane G.T., Studies on Amine Production in the Human Colon: Enumeration of Amine
forming Bacteria and Physiological Effects of Carbohydrate and pH. J. Appl. Bacteriol. (1996) 81: 288-297.
(72) Araneda O. F., Tuesta M., Lung Oxidative Damage by Hypoxia. Oxid. Med. Cell. Longev. (2012) 2012: 1-18.
(73) Cooke M.S., Evans M.D., Dizdaroglu M., Lunec J., Oxidative DNA damage: mechanisms, mutation, and disease. FASEB J. (2003) 17: 1195-1214.
(74) Hasbal C., Aksu B.Y., Himmetoglu S., Dincer Y., Koc E.E., Hatipoglu S., Akcay T., DNA damage and glutathione level in children with asthma bronchiale: effect of antiasthmatic therapy. Pediatr. Allergy Immunol. 21 (2010) e674.
(75) Niwa T., Uremic toxicity of indoxyl sulphate. Nagoya J. Med. Sci. (2010) 72: 1-11. (76) Tumur Z., Niwa T., Indoxyl sulfate inhibits nitric oxide production and cell viability by inducing oxidative
stress in vascular endothelial cells. Am. J. Nephrol., (2009) 29: 551-557. (77) Dou L., Jourde-Chiche N., Faure V., Cerini C., Berland Y., Dignat-George F., Brunet P., The uremic solute
indoxyl sulfate induces oxidative stress in endothelial cells. J. Thromb. Haemost. (2007) 5: 1302-1308.

CHAPTER
CONCLUSIONS AND
FUTURE
PERSPECTIVES
Chapter 4 – Conclusions
CHAPTER 4
CONCLUSIONS AND
FUTURE
PERSPECTIVES
Chapter
4
Conclusions
185
CONCLUSIONS AND
Chapter
4

Chapter 4 – Conclusions
186

Chapter 4 – Conclusions
187
4.1 Conclusions
The challenges proposed for this PhD thesis were addressed and methodologies
using high throughput techniques in the analysis of biological examples obtained in a
non-invasive manner were developed. Nowadays, certain gold standards, such as
spirometry, are routinely used to assess the asthma disease status, but do not provide
sufficient information. The feasibility of sampling exhaled breath and urine in an
effortlessly manner, namely in children, must also be a purpose to take into account.
The use of exhaled breath and/or urine yields additional information that could change
the current hallmark on diagnosis, prognosis, in following a prescribed therapy for a
single patient or even verify the disease status.
The initial step in the analysis of exhaled breath volatile composition was the
development of a HS-SPME method and then combine it with GC-MS. It was possible
to verify the richness of the volatile composition of this matrix with the identification of
several compounds belonging to different chemical families. The use of MVA tools was
fundamental to verify that a pattern of compounds, belonging to the alkanes and
aldehydes, was formed. It was observed that the asthmatic population was characterized
by ramified alkanes and these compounds are connected to lipid peroxidation from the
degradation of fatty acids that occurs due to the oxidant and antioxidant imbalance
characteristic in asthma. Due to the advantages presented by the GC×GC-ToFMS, this
analytical technique was used to obtain more information on exhaled breath. A more
complete metabolomic profile was obtained and from the hundreds of identified
compounds, an alkane/aldehyde pattern was obtained and this pattern characterized the
asthmatic and healthy populations, respectively. This outcome, combined with the
previous GC-MS results, links oxidative stress (measured in the lipid peroxidation
products) to asthma. Complementarily, urine volatile analysis by HS-SPME/ GC×GC-
ToFMS also revealed this information and it allowed to assess lipid peroxidation
measuring compounds belonging to the alcohols, aldehydes, alkanes, alkenes and
ketones. These compounds are associated to lipid peroxidation, and consequently to
oxidative stress on fatty acids. Additionaly, the urine non-volatile metabolomic pattern
was also obtained using 1H NMR to supplement the information attained from the urine
volatile analysis. It was possible to identify several other biochemical pathways affected
by asthma namely TCA cycle, histidine metabolism, lactic acidosis, changes in gut

Chapter 4 – Conclusions
188
microflora, modification of free tyrosine residues by eosinophil activity in the airways
of humans with asthma and oxidation of amino acids.
The use of the developed methodologies for clinical purposes was also tested,
namely in exhaled breath. The first step was to reduce the GC×GC-ToFMS dataset (134
compounds) and still have a method with a high classification rate, specificity and
sensitivity. This was obtained with 9 compounds within the alkane/aldehyde pattern.
The applicability of using the exhaled breath metabolomic pattern was then tested
through the follow-up: of a naive patient over 24 days, of a patient with severe asthma
treated with Omalizumab® over 20 months, of a patient thoughout 3 years and of
patients in exarcebation and stable conditions. A new cohort of asthmatic children was
also tested in the verification of the developed metabolomic based models in diagnosis
and monitoring the disease status through exhaled breath. The metabolite pattern
obtained by GC×GC-ToFMS and the developed models were successful as there was a
clinical positive evolution accompanied by exhaled breath change in composition
towards the healthy group. A noteworthy result was obtained in the severe asthma case
as this patient failed several treatments in the 20 month period and this reflected
clinicaly as well as it could be observed in the exhaled breath volatile composition.
In conclusion, the analysis of two matrices obtained non-invasively using two
high throughput techniques yielded a myriad of information, beside the successful
development of statistical models with excellent results in terms of classification rate,
sensitivity and sensibility. The information obtained from studying exhaled breath and
urine, from a volatile point of view, was complementary and allowed to measure
oxidation products that reflect lipid peroxidation in asthma. The non-volatile
characterization of urine added information to that obtained in the volatile counterpart
with several biochemical pathways being connected to asthma. The use of both matrices
and both techniques was a paramount aspect in the work developed for this PhD thesis
that allowed obtaining a more complete and complementary information on the
metabolic changes in asthma.
The results presented demonstrate the potential of volatile and/or non-volatile
exhaled breath and urine metabolomic profiling in asthma. This PhD thesis lays the
foundations for future studies in asthma through the use of this matrices combined with
the high throughput techniques.
Chapter 4 – Conclusions
189
4.2 Future Work
Exhaled breath and urine analysis are promising biofluids in monitoring asthma,
being easily implemented in asthma management. These matrices produce an unique
print and this can result in a new healthcare paradigm that intends more efficient drug
uses, earlier/more accurate diagnosis resulting in a better medical outcome.
Nevertheless there are still issues that can be studied from the results presented in this
PhD thesis and that could be considered for the future endeavors:
• Enlarge the sample numbers to strengten the results and applying the
developed methodologies to other locations in the country or even abroad;
• Use of other high throughput methodologies such as liquid
chromatography coupled to mass spectrometry to attain more information
of the studied matrices;
• Study the possiblity of characterizing different asthma phenotypes;
• Complementing the metabolomic information by performing proteomic
and genomic studies;
• Deepening the biochemical origin of the found compounds analysing
human bronchial cells;
• Clinical orientied studies for diagnosis, therapy follow-up and disease
monitoring performing longitudinal studies and randomized controlled
trials.
• Development of point-of-care platform to be implemented in medical
practice as an aid to diagnosis, follow-up therapy and disease monitoring.

190

Appendix
191
APPENDIX

Appendix
192
QUESTIONÁRIO
Código do Voluntário: Idade: Idade de início da doença:
Peso (Kg): Altura (cm): Crises (estimativa):
Motivo da consulta: Asma Rinite Alérgenos:
Medicação:
A criança teve algum episódio de pieira ou chieira nos últimos doze meses? Sim
Não
Nos últimos doze meses a criança fez tratamento imunoterapêutico ,ou seja, vacina
para alergia? Sim Não
Nos últimos doze meses a criança teve crise asmática? Sim Não
Nos últimos doze meses a criança espirrou ou teve rinorreia sem que estivesse
constipada? Sim Não
Nos últimos doze meses a criança quando fez exercício teve episódios de pieira ou
chieira? Sim Não
HABITAÇÃO (Assinale as opções adequadas
Cidade Apartamento Nova Ar condicionado Aquecimento:
Campo Vivenda Velha Desumidificador Nenhum
Outro: Arejada Óleo
Poeirenta Eléctrico
Húmida Lareira
Zona Poluída Braseira
Central
Outro:
QUARTO (Assinale as opções adequadas

[FICHA DO VOLUNTÁRIO] Appendix
193
Tipo de Pavimento: Alcatifa Tapete de lã Outro:
Colchão: Molas Espuma Palha Outro:
Almofada: Não Usa Espuma Fibra Sintética
Outros: Peluches Livros Expostos Material dos cortinados:
Cuidados Especiais com o colchão: Aspira de semana a semana Lava os lençóis a 60ºC
AMBIENTE (Assinale as opções adequadas
Tem animais domésticos: Canário Cão Gato Coelho Cavalo
Periquito Hamster Outros:
Há Fumadores em casa: Não Pai Mãe Outros:
PROBLEMAS (Assinale as opções adequadas
Época do ano em que passa pior: Primavera Outono Qualquer altura Verão Inverno
Meses Piores:
A criança tem problemas: Tosse Urticária
Expectoração Inchaço
Farfalheira Dorme de boca aberta
Pieira Faz barulho a dormir
Falta de ar Mau hálito de manhã
Comichão nos Olhos Otites
Olhos a chorar Amigdalites
Comichão no nariz Adenodites
Perda do cheiro Diarreia

Appendix
194
Espirros frequentes Vómitos
Borbulhas na cara Outros:
Comichão na cara
Aparecimento dos sintomas: Dia Noite Madrugada Indiferente
Os sintomas são: Leves Moderados Graves Sempre Muitas Vezes Poucas
vezes Raramente
Os sintomas interferem no dia-a-dia da criança? Não Pouco Moderamente Muito
Alguns factores podem ser a causa dos sintomas ou podem agravar:
Dentro de casa Zonas húmidas Cosméticos Leite e derivados
Fora de casa Poluição do ar Insecticidas Ovos
Tempo seco Poeiras Celeiros Frutas
Tempo húmido Ar condicionado Feno Chocolate
Dias quentes Fumo do cigarro Trigo Nozes, amêndoas
Dias Frios Papéis Cheiro de comida Amendoins
Dias ventosos Perfumes Peixe Legumes
Mudanças de tempo Medicamentos Carne Vegetais verdes:
Mais informações (familiares com doenças alérgicas e/ou outras doenças da criança):
Quem respondeu a este questionário:
Pai
Mãe
Outra pessoa
Data do Inquérito: / / 201__
Contactos (telemóvel/email):
[FICHA DO VOLUNTÁRIO] Appendix
195
Obrigado pela sua participação! Qualquer dúvida não hesite em contactar-nos!
Dados clínicos:
IgE:
Prick tests:
Espirometria (Fev1; Fev25-75; Peak Flow):


Appendix
197

Appendix
198

Appendix
199
Table S1 -Dataset of volatile compounds identified by GC×GC–ToFMS in exhaled breath used for projection purposes in Chapter 2.5
1tR a (s) 2tR
a (s) Compounds
Hydrocarbons S1 S2 S3 S4 S5 S6 S7 S8 S9 S10 S11 S12 S13 S14 S15 S16 S17 S18 S19 S20 S21 S22 S23 S24 S25 S26 S27 S28
Alkanes
138 0.48 hexane 0.3 0.4 0.1 0.4 1.7 2.0 1.3 0.2 1.4 0.2 0.4 0.5 1.1 0.3 0.2 0.6 0.6 0.2 0.7 0.6 0.5 0.4 0.8 0.6 4.3 1.0 0.5 0.5
210 0.52 2,4-dimethylhexane 0.2 0.2 0.7 0.3 0.5 0.1 4.3 0.1 1.0 0.1 0.3 0.1 1.1 0.4 0.1 1.1 4.5 0.4 1.1 0.6 0.2 0.0 2.1 0.8 0.9 1.7 0.4 0.6
252 0.54 octane 1.4 0.7 4.0 1.0 0.9 1.2 2.1 0.5 1.7 0.3 0.6 0.6 1.9 0.8 0.4 0.5 1.9 0.7 2.0 1.1 0.6 0.3 0.4 1.5 2.0 2.8 1.1 1.4
276 0.55 2,2,4-trimethylhexane 0.1 0.1 0.2 0.6 2.3 1.7 3.7 1.7 2.9 0.5 0.9 1.0 3.6 1.1 0.0 4.2 3.9 1.3 1.5 1.6 0.1 0.1 2.7 3.1 2.4 3.6 0.2 0.3
288 0.55 2,4-dimethylheptane 1.0 1.0 0.7 0.6 0.3 0.8 0.2 0.3 1.5 0.0 0.2 0.4 0.5 0.0 1.0 0.2 0.8 0.2 0.6 0.6 0.9 0.7 0.1 0.4 1.2 1.6 3.1 2.6
318 0.56 4-ethyl-2-methylhexane 0.2 0.2 1.0 0.2 1.2 0.8 0.9 0.3 1.2 0.2 0.3 0.2 1.0 0.4 0.2 1.1 2.6 0.4 1.4 0.5 0.1 0.1 1.3 1.0 0.7 1.4 0.3 0.5
366 0.58 alkane isomer (m/z 43, 57, 85) 0.0 0.0 2.6 0.3 0.7 1.1 0.4 0.1 1.2 0.3 0.2 0.2 0.9 1.8 0.0 0.0 0.0 2.1 3.0 1.6 0.3 0.2 0.9 1.5 0.5 0.8 1.0 1.2
468 0.56 nonane 3.1 3.0 4.9 3.5 3.4 3.3 3.3 2.1 3.6 2.1 1.3 1.3 4.2 0.7 2.5 3.3 2.6 2.8 2.8 3.0 2.1 2.3 3.4 3.0 3.8 3.4 4.5 5.5
504 0.55 alkane isomer (m/z 43, 57, 85) 0.3 0.2 2.0 0.2 0.8 0.5 0.9 0.3 0.8 0.6 1.2 1.0 0.5 1.7 0.1 1.8 1.1 0.5 1.1 0.6 0.2 0.2 1.0 0.7 0.7 0.9 0.5 0.7
516 0.55 2,4-dimethyloctane 0.2 0.1 0.0 0.1 0.1 0.2 0.2 0.0 0.2 0.0 0.1 0.1 0.2 0.0 0.2 0.1 0.1 0.1 0.1 0.1 0.1 0.0 0.1 0.1 0.2 0.2 0.3 0.5
528 0.56 3-ethyl-3-methylheptane 0.2 0.1 2.2 0.2 0.3 0.3 0.2 0.1 0.3 0.1 0.2 0.1 0.2 0.1 0.2 0.2 0.5 0.1 0.1 0.1 0.1 0.1 0.2 0.2 0.3 0.7 0.3 0.5
540 0.55 2,6-dimethyloctane 0.0 0.9 7.1 1.0 0.7 0.7 1.0 0.4 1.6 0.5 0.3 0.2 1.4 0.7 0.5 0.7 0.8 0.6 0.7 0.6 0.4 0.6 0.7 0.6 0.8 0.9 1.4 1.7
552 0.55 3-ethyl-2-methylheptane 0.4 0.4 0.8 0.6 0.2 0.4 0.4 0.2 0.5 0.3 0.1 0.0 0.2 0.2 0.7 0.4 0.4 0.2 0.3 0.3 0.3 0.2 0.4 0.3 0.5 0.7 1.0 1.3
558 0.55 alkane isomer (m/z 57, 43, 71) 0.1 0.2 0.6 0.1 0.3 0.4 2.1 0.2 0.2 0.2 0.6 0.4 0.2 0.1 0.0 0.4 0.4 0.2 0.2 0.1 0.1 0.1 0.3 0.2 0.2 0.4 0.2 0.2
564 0.55 alkane isomer (m/z 43, 57, 71) 0.4 0.3 3.0 0.3 0.3 0.3 0.2 0.1 0.4 0.1 0.1 0.1 0.3 0.1 0.0 0.2 0.3 0.1 0.2 0.2 0.3 0.1 0.3 0.2 0.4 0.3 0.5 0.9
576 0.56 4-ethyloctane 0.1 0.1 1.5 0.2 0.2 0.2 0.2 0.1 0.8 0.2 0.2 0.2 0.2 0.3 0.0 0.4 0.3 0.2 0.2 0.2 0.1 0.1 0.3 0.2 0.3 0.2 0.2 0.3
582 0.55 4-methylnonane 0.2 0.2 1.1 0.4 0.4 0.4 0.5 0.2 0.6 0.4 0.2 0.2 0.3 0.2 0.1 0.3 0.6 0.2 0.2 0.5 0.1 0.2 0.4 0.4 0.5 1.2 0.2 0.4
588 0.54 alkane isomer (m/z 57, 43, 85) 0.6 0.2 3.5 0.4 0.2 0.3 0.4 0.3 0.5 0.1 0.1 0.1 0.2 0.0 0.4 0.1 0.1 0.3 0.1 0.2 0.3 0.2 0.4 0.2 0.5 0.4 0.6 1.1
594 0.55 alkane isomer (m/z 57, 43, 71) 1.1 0.7 3.7 1.3 0.8 0.8 0.6 1.7 1.1 0.5 0.4 0.4 0.8 0.6 5.8 0.9 1.1 0.5 1.2 0.6 0.8 0.5 0.7 0.5 1.0 1.0 1.4 2.5
600 0.55 2-methylnonane 0.5 0.4 3.4 1.0 0.8 0.7 0.6 0.4 0.8 0.4 0.1 0.1 0.6 0.5 0.8 0.6 0.7 0.5 0.6 0.6 0.5 0.4 0.7 0.6 0.8 0.9 0.9 1.3
606 0.55 alkane isomer (m/z 57, 43, 41) 0.7 0.2 4.3 0.6 0.3 0.4 0.2 0.2 0.5 0.1 0.5 0.4 0.4 0.5 2.4 0.2 0.3 0.5 0.2 0.6 0.4 0.2 0.3 0.6 0.5 0.4 0.7 1.5
612 0.55 3-methylnonane 0.5 0.4 2.9 0.8 0.7 0.5 0.7 0.4 0.7 0.4 0.1 0.1 0.4 0.6 0.5 0.7 0.6 0.7 0.6 0.0 0.4 0.4 0.7 1.0 0.7 1.1 0.7 1.0
636 0.54 2,2,4,6,6-pentamethylheptane 12.9 6.0 1.7 2.2 5.4 7.6 1.4 1.3 1.5 2.4 2.2 3.5 2.1 1.0 4.5 1.7 2.9 1.9 2.8 2.0 3.2 0.0 1.5 2.3 1.5 1.8 5.3 3.3
660 0.56 decane 6.3 4.0 6.2 11.0 3.9 3.8 3.8 3.4 5.9 4.3 3.0 3.1 4.9 1.1 4.6 4.2 3.4 3.4 4.2 5.2 3.7 4.1 4.3 3.5 3.9 3.5 4.8 5.2
672 0.54 alkane isomer (m/z 57, 41, 71) 1.1 1.2 1.1 0.0 0.4 0.6 0.1 0.1 0.2 0.2 1.2 2.7 0.3 0.3 4.6 0.1 0.1 0.2 0.0 0.1 0.2 0.1 0.5 0.1 0.4 2.4 0.2 0.8
720 0.54 3,9-dimethylnonane 0.8 0.2 2.3 0.4 1.5 1.3 0.1 0.4 0.8 0.4 6.8 5.1 1.2 2.7 0.9 0.5 5.5 0.2 4.6 0.8 0.6 0.8 0.6 0.2 1.0 0.1 0.5 0.6
756 0.54 2-methyldecane 6.5 4.0 2.7 3.2 2.5 5.4 1.4 3.3 3.1 3.8 0.7 2.6 2.3 1.5 10.1 3.2 1.4 1.7 1.5 1.5 10.0 3.1 1.9 2.3 2.7 3.6 12.3 10.7
768 0.54 alkane isomer (m/z 57, 43, 85) 0.7 0.3 1.6 0.3 0.7 0.8 0.5 0.3 1.0 0.4 0.4 0.3 1.1 0.5 6.4 0.4 0.5 0.4 0.7 0.5 0.6 0.4 0.5 0.5 0.5 0.9 0.6 0.6
774 0.55 3-methyldecane 1.2 0.0 3.3 1.2 0.5 0.5 0.4 0.3 0.5 0.3 0.3 0.3 0.5 0.6 1.2 0.2 0.6 1.0 0.7 0.8 1.0 0.3 0.4 0.9 0.5 0.5 1.1 1.2

Appendix
200
1tR a (s) 2tR
a (s) Compounds
S1 S2 S3 S4 S5 S6 S7 S8 S9 S10 S11 S12 S13 S14 S15 S16 S17 S18 S19 S20 S21 S22 S23 S24 S25 S26 S27 S28
864 0.56 2,3-dimethyldecane 0.5 0.5 0.8 0.0 0.5 0.6 0.1 0.0 0.2 0.1 0.9 0.3 0.2 0.9 0.7 0.9 0.1 1.1 0.7 0.1 0.4 0.5 0.3 0.4 1.1 0.2 0.9 0.5
876 0.56 alkane isomer (m/z 57, 43, 71) 0.3 0.3 0.3 0.3 1.9 1.8 1.1 1.3 1.4 1.2 1.7 1.3 1.7 1.1 0.2 1.5 1.3 1.7 1.2 1.2 0.2 2.0 2.3 1.6 2.0 1.2 0.3 0.1
894 0.55 5-methylundecane 0.0 0.6 1.3 0.8 0.7 0.9 0.3 0.1 0.3 0.1 0.3 0.4 0.6 0.5 1.1 0.2 0.3 1.0 0.3 0.0 0.7 0.8 0.9 0.7 0.6 0.9 0.7 0.8
906 0.57 alkane isomer (m/z 57, 43, 71) 0.7 0.8 1.3 1.0 0.5 1.0 0.4 1.0 2.6 0.4 0.6 0.3 0.4 0.7 0.5 0.4 0.5 0.5 0.5 0.5 0.7 0.7 0.6 0.6 0.5 1.2 0.7 0.6
912 0.57 3,9-dimethylundecane 0.6 0.6 1.1 0.9 3.8 0.7 0.7 1.9 0.8 1.0 2.2 1.4 0.8 1.0 0.4 0.1 1.1 0.9 0.4 0.9 0.5 0.5 1.0 0.9 1.0 0.5 0.5 0.5
948 0.57 dodecane 10.3 7.9 3.8 6.6 2.9 2.9 2.7 2.8 2.7 2.8 2.9 2.9 2.8 3.8 6.9 2.2 1.9 3.7 2.8 4.0 8.3 3.4 3.7 3.0 2.7 2.1 8.5 6.4
960 0.58 alkane isomer (m/z 57, 71, 43) 0.3 0.3 0.5 0.4 0.1 0.1 0.3 0.1 0.1 0.1 1.9 1.5 0.2 2.6 0.1 0.3 0.3 3.2 0.2 2.3 0.3 0.5 0.2 2.6 0.1 0.1 0.2 0.2
966 0.57 alkane isomer (m/z 57, 43, 71) 0.4 0.6 0.5 0.8 2.1 2.5 2.0 2.6 1.9 2.6 0.3 0.0 2.5 1.9 0.4 2.4 1.4 3.2 1.5 2.3 0.6 2.8 2.4 2.6 1.2 2.2 0.4 0.4
972 0.56 2,5,6-trimethyldecane 0.6 0.6 0.5 1.0 0.2 0.2 4.3 1.1 0.7 0.5 1.6 2.1 0.2 0.1 0.4 1.1 4.1 0.3 0.2 0.3 0.9 0.2 0.3 0.3 0.2 0.2 0.6 0.6
978 0.57 alkane isomer (m/z 57, 43, 71) 0.2 0.3 0.4 0.4 0.9 0.8 0.7 1.2 0.7 1.0 2.2 0.3 0.8 1.2 0.2 0.9 4.1 1.5 6.2 1.3 0.4 0.4 1.0 2.2 0.3 0.4 0.2 0.2
996 0.56 alkane isomer (m/z 57, 43, 71) 0.1 0.2 0.1 0.1 0.5 0.6 0.4 0.2 0.6 0.2 0.1 0.2 0.6 0.2 0.1 1.0 0.5 0.4 0.5 0.2 0.2 0.7 0.8 0.2 0.7 0.5 0.1 0.2
1002 0.57 alkane isomer (m/z 57, 43, 71) 0.2 0.3 0.1 0.2 0.8 1.3 0.8 0.9 0.6 0.7 1.4 1.2 0.6 0.9 0.1 0.4 0.7 0.5 0.5 0.6 0.2 1.4 1.6 0.5 0.7 0.5 0.1 0.1
1008 0.57 6-methyldodecane 0.3 0.4 0.1 0.3 2.0 2.0 1.5 1.8 2.2 1.8 1.9 1.5 1.7 1.9 0.2 1.7 1.4 2.2 1.4 0.7 0.4 2.0 2.3 1.8 2.0 2.1 0.2 0.2
1020 0.57 alkane isomer (m/z 43, 57, 71) 0.2 0.7 0.1 0.6 0.4 0.4 0.2 0.2 0.4 0.3 0.2 0.1 0.4 0.3 0.2 0.1 0.3 0.1 0.4 0.2 0.3 0.2 0.4 0.2 0.2 0.3 0.2 0.5
1044 0.55 alkane isomer (m/z 57, 43, 71) 0.7 1.3 0.3 0.9 1.8 1.7 1.4 2.1 0.7 2.1 0.8 0.3 0.7 0.6 0.7 1.8 0.6 0.7 0.6 0.7 1.7 0.7 2.1 0.6 1.7 0.5 1.0 1.0
1050 0.55 4-ethylundecane 3.3 3.9 1.4 2.7 3.0 2.3 2.3 3.7 2.0 3.3 1.3 1.7 2.5 1.9 3.6 2.0 1.5 2.1 1.9 2.1 6.0 2.3 0.5 3.8 2.6 1.4 3.8 3.8
1056 0.57 alkane isomer (m/z 57, 43, 71) 0.2 0.6 0.1 0.3 0.4 0.2 0.2 0.0 0.3 0.9 0.1 0.1 0.5 0.3 0.1 0.3 0.7 1.5 0.7 1.7 0.3 0.0 0.5 1.2 0.6 0.2 0.2 0.2
1062 0.55 alkane isomer (m/z 57, 71, 43) 0.9 1.2 0.3 1.1 0.3 0.3 1.1 1.1 0.3 0.4 1.3 0.6 0.4 1.0 1.4 0.3 0.4 0.3 0.5 0.5 1.2 0.6 0.8 0.5 0.3 0.4 0.9 1.0
1068 0.56 alkane isomer (m/z 43, 57, 71) 0.8 2.3 0.3 1.0 0.4 0.5 1.1 0.4 0.7 0.4 0.8 0.7 0.8 0.6 0.7 0.3 0.4 0.3 0.5 0.2 1.2 0.7 0.5 0.4 0.3 1.7 0.9 0.8
1074 0.57 tridecane 1.6 2.5 0.7 1.9 1.9 2.0 3.2 1.7 2.9 0.8 2.9 2.3 3.5 1.6 1.9 0.9 2.3 1.9 3.4 2.4 3.3 3.3 2.2 1.3 1.7 1.2 1.8 1.9
1092 0.57 2,2-dimethyldodecane 0.7 3.1 0.2 0.6 0.4 0.6 0.5 0.5 0.5 1.2 0.7 0.6 0.6 0.5 0.3 0.7 0.4 0.4 0.6 0.7 0.6 1.1 0.7 1.1 0.6 0.4 0.4 0.4
1104 0.57 alkane isomer (m/z 57, 43, 71) 3.9 4.8 1.5 3.4 3.3 3.3 3.4 4.5 4.3 6.5 1.5 2.8 4.8 2.8 6.6 3.5 3.2 3.8 2.5 3.9 6.5 4.1 2.6 3.9 3.0 2.9 4.3 4.0
1110 0.57 alkane isomer (m/z 57, 43, 71) 0.4 0.5 0.2 0.5 0.6 0.6 0.4 0.5 0.5 0.5 1.1 1.0 0.4 0.2 0.3 0.2 0.3 0.3 0.5 0.6 0.4 0.2 0.6 1.3 0.5 0.3 0.3 0.3
1116 0.57 alkane isomer (m/z 57, 71, 43) 1.8 2.5 0.8 1.7 1.6 1.3 2.1 2.4 2.0 1.4 1.1 1.1 2.4 2.1 1.5 1.1 1.9 2.3 2.0 2.5 3.2 2.6 1.5 2.3 1.6 0.8 3.2 3.7
1128 0.57 3-ethyl-3-methylundecane 1.0 1.5 0.4 1.2 2.1 1.9 3.2 3.0 2.3 4.2 2.0 1.9 3.7 2.0 1.6 2.6 2.3 2.5 6.4 0.5 1.6 3.7 2.1 0.8 1.6 2.7 1.1 1.2
1152 0.60 2-methyltridecane 0.4 0.0 0.2 0.6 1.3 1.3 1.0 1.5 1.4 1.8 1.7 1.6 1.0 1.1 0.3 1.8 0.7 2.3 1.1 2.5 0.6 1.2 1.6 1.5 1.0 1.5 0.3 0.4
1158 0.59 alkane isomer (m/z 57, 43, 71) 0.4 3.5 0.4 0.6 0.8 0.7 1.2 0.8 1.1 0.9 1.7 1.1 1.3 0.7 0.6 0.7 0.5 1.1 1.6 1.3 0.6 0.8 0.8 0.8 0.9 0.5 0.4 0.4
1170 0.61 alkane isomer (m/z 57, 43, 71) 0.2 0.4 0.1 1.2 2.0 1.0 0.4 1.6 0.4 1.2 2.7 1.1 0.5 1.1 0.1 0.7 0.2 1.5 0.5 1.7 0.3 0.4 1.4 1.1 1.4 1.4 0.2 0.2
1188 0.61 tetradecane 2.7 4.2 0.8 3.2 2.3 2.6 3.7 3.7 2.9 3.9 4.1 3.9 3.5 3.9 2.1 2.5 2.1 3.3 2.9 4.4 3.3 1.7 2.7 3.7 1.9 2.3 2.3 1.9
1284 0.58 alkane isomer (m/z 57, 43, 85) 0.2 0.4 0.1 0.3 0.2 0.3 0.4 0.3 0.3 0.4 0.3 0.5 0.3 0.5 0.3 0.4 0.2 0.5 0.3 0.6 0.5 0.5 0.5 0.4 0.4 0.2 0.4 0.3
1290 0.58 6,6-diethyldodecane 1.0 1.5 0.5 1.6 1.9 1.9 2.1 2.1 1.1 1.7 0.7 0.6 1.1 2.5 1.5 1.4 1.0 2.5 1.6 1.7 2.6 1.9 1.4 2.5 1.1 0.8 1.8 1.7

Appendix
201
1tR a (s) 2tR
a (s) Compounds
S1 S2 S3 S4 S5 S6 S7 S8 S9 S10 S11 S12 S13 S14 S15 S16 S17 S18 S19 S20 S21 S22 S23 S24 S25 S26 S27 S28
Cyclic
240 0.57 1,2,4-trimethylcyclopentane 0.3 0.4 0.2 0.3 0.1 0.3 0.2 0.0 0.3 0.1 0.1 0.1 0.2 0.1 0.0 0.2 0.6 0.1 0.5 0.2 0.3 0.1 0.3 0.1 0.7 0.5 0.2 0.2
534 0.60 propylcyclohexane 0.2 0.3 0.7 0.3 0.9 0.7 1.6 0.5 2.4 1.0 0.4 0.3 1.3 0.9 0.3 1.1 1.4 0.9 0.8 1.0 0.1 0.8 1.0 1.4 1.7 2.8 0.2 0.3
576 0.59 1,1,2,3-tetramethylcyclohexane 0.1 0.3 0.2 0.8 0.5 0.4 0.9 0.5 0.8 0.5 0.6 0.3 0.4 0.5 0.1 1.3 0.9 0.5 0.6 0.6 0.1 0.5 0.0 0.7 0.7 0.7 0.2 0.3
618 0.60 2-ethyl-1,3-dimethylcyclohexane 0.1 0.1 0.1 0.2 0.4 0.3 0.7 0.1 0.5 0.2 0.2 0.2 0.2 0.2 0.3 0.4 0.4 0.3 0.2 0.3 0.0 0.1 0.4 0.4 0.5 0.4 0.1 0.1
624 0.59 1-methyl-3-propylcyclohexane 0.5 0.3 3.0 0.9 0.5 0.5 0.3 0.2 0.7 0.2 0.4 0.4 0.4 0.2 0.5 0.3 0.5 0.2 0.3 0.2 0.2 0.3 0.4 0.2 0.7 0.6 0.5 1.1
630 0.58 1-methyl-3-(2-methylpropyl)cyclopentane 0.5 0.8 3.8 1.2 0.6 0.5 0.5 0.3 1.2 0.6 0.2 0.2 0.5 0.4 0.8 0.5 0.6 0.5 0.5 0.8 0.4 0.6 0.6 0.4 0.7 1.2 0.7 1.2
642 0.59 ethylpropylcyclopentane 0.2 0.1 1.4 0.3 0.2 0.3 0.2 0.1 0.2 0.1 0.1 0.0 0.3 0.2 0.1 0.3 0.1 0.1 0.1 0.1 0.1 0.2 0.2 0.1 0.2 0.2 0.2 0.3
654 0.59 1-methyl-2-propylcyclohexane 0.4 0.3 0.5 0.5 0.4 0.4 0.3 0.2 0.5 0.2 0.1 0.1 0.3 0.2 0.1 0.3 0.4 0.1 0.3 0.2 0.3 1.1 0.3 0.1 0.5 0.4 0.4 0.5
732 0.57 hexylcyclopentane 0.3 0.3 0.8 0.4 0.6 1.0 0.6 0.4 0.9 0.4 0.8 0.7 0.9 0.4 0.4 0.4 1.5 0.6 0.9 0.6 0.3 0.5 0.7 0.7 1.1 2.6 0.3 0.4
792 0.57 1,4-dimethylcycloctane 0.5 0.7 1.8 0.5 0.9 0.8 0.8 0.6 0.9 0.6 0.8 0.9 1.0 0.7 0.7 0.7 3.7 0.7 1.4 0.5 0.7 0.7 0.9 0.7 0.9 0.9 0.8 1.0
804 0.59 1-ethyl-2-propycylohexane 0.3 1.1 0.4 0.3 1.0 1.4 0.9 0.8 1.6 0.8 0.3 0.3 2.6 1.4 0.2 1.1 1.1 1.0 1.4 0.9 0.3 2.2 1.5 1.9 1.1 1.0 0.4 0.3
996 0.62 hexylcyclohexane 0.1 0.1 0.1 0.2 0.6 0.5 0.2 0.9 0.4 0.9 0.3 0.8 0.4 0.3 0.1 0.2 0.6 0.9 0.4 1.2 0.2 0.5 1.0 0.9 0.6 0.3 0.1 0.2
1068 0.65 1-hexyl-3-methylcyclohexane 0.2 0.5 0.1 0.4 1.8 1.5 0.9 1.9 0.2 2.2 0.8 0.9 1.3 1.7 0.2 1.7 1.1 2.2 1.3 2.5 0.5 0.3 2.4 1.3 1.5 1.0 0.3 0.3
1080 0.60 1-butyl-2-propylcyclopentane 0.3 0.5 0.1 0.4 2.1 1.8 2.3 0.6 1.9 1.0 2.9 1.5 2.1 0.6 0.2 1.8 1.1 0.4 2.6 3.2 0.6 1.8 2.5 1.0 2.2 1.1 0.3 0.4
Alkenes
252 0.60 3-octene 0.1 0.1 0.0 0.2 0.3 0.3 0.1 0.0 0.4 0.0 1.0 1.4 0.5 0.1 0.0 0.1 0.3 0.2 0.2 0.1 0.0 0.0 0.2 0.1 0.4 0.1 0.1 0.2
330 0.61 2,4-dimethyl-1-heptene 0.3 0.2 0.2 0.3 0.1 0.1 0.3 0.1 0.1 0.1 0.1 0.1 0.1 0.1 0.2 0.1 0.4 0.1 0.4 0.1 0.2 0.1 0.2 0.1 0.1 0.1 0.4 0.3
450 0.61 1-nonene 0.2 0.2 0.2 0.1 0.4 0.4 0.2 0.1 0.2 0.1 0.1 0.1 0.2 0.1 0.2 0.2 0.2 0.1 0.2 0.1 0.2 0.1 0.6 0.2 0.9 0.2 0.2 0.3
546 0.57 alkene isomer (m/z 55, 41, 69) 0.2 0.2 0.8 0.2 0.4 0.4 0.4 0.2 0.5 0.2 0.3 0.2 0.7 0.2 0.3 0.4 0.4 0.2 0.2 0.3 0.1 0.1 0.4 0.4 0.7 0.6 0.3 0.8
552 0.57 3-methyl-1-nonene 0.4 0.3 2.0 0.5 0.5 0.7 0.4 0.5 0.7 0.5 1.2 0.9 0.6 0.3 0.3 0.6 1.1 0.3 0.5 0.4 0.2 0.3 0.5 0.6 1.0 1.0 0.2 0.8
570 0.59 3,4-diethyl-2-hexene 0.1 0.1 0.4 0.1 0.5 0.4 0.7 0.3 0.6 0.4 0.6 0.5 0.6 0.6 0.5 0.8 0.5 0.6 0.4 0.6 0.1 0.2 0.7 0.6 0.5 0.7 0.1 0.1
582 0.59 alkene isomer (m/z 69,41,56) 0.2 0.1 0.8 0.4 0.2 0.2 0.3 0.1 0.2 0.1 0.0 0.0 0.4 0.1 0.0 0.2 0.1 0.1 0.1 0.1 0.1 0.3 0.2 0.1 0.2 0.4 0.1 0.3
606 0.59 alkene isomer (m/z 69,41,56) 0.5 0.6 1.7 0.6 0.5 0.5 0.4 0.3 0.3 0.3 0.3 0.2 0.4 0.1 0.4 0.4 0.5 0.1 0.4 0.2 0.2 0.2 0.5 0.3 0.7 0.6 0.5 0.3
612 0.59 7-methyl-1-nonene 0.1 0.2 0.4 0.3 0.4 0.3 0.3 0.2 0.4 0.3 0.2 0.1 0.3 0.2 0.1 0.3 0.4 0.3 0.2 0.6 0.1 0.1 0.3 0.3 0.4 0.5 0.1 0.1
648 0.59 4-decene 0.3 0.4 0.9 0.4 0.4 0.4 0.3 0.2 1.5 0.3 0.3 0.3 0.3 0.2 0.6 0.3 0.3 0.3 0.3 0.3 0.3 0.2 0.4 0.3 0.5 0.3 0.3 0.4
762 0.55 alkene isomer (m/z 55, 69, 41) 0.1 0.0 0.2 0.2 1.5 1.4 0.8 2.0 1.5 2.2 0.6 0.9 1.8 1.0 3.7 2.4 0.8 0.9 1.0 0.9 0.2 1.2 1.1 2.5 1.5 2.9 0.2 0.2
768 0.56 alkene isomer (m/z 55, 69, 41) 0.5 0.3 0.4 0.3 0.6 0.3 0.4 1.3 0.5 0.4 0.3 0.4 1.0 0.3 0.5 0.4 0.5 0.9 0.3 0.5 0.4 0.4 0.5 0.8 0.1 0.4 0.4 0.3
780 0.56 (Z)-2-decene 0.4 0.3 0.4 0.2 0.8 0.8 0.8 0.5 2.8 1.0 0.7 1.0 0.8 0.5 0.3 0.6 0.7 0.6 0.5 0.6 0.4 0.5 0.8 0.7 2.3 0.9 0.4 0.4
798 0.56 alkene isomer (m/z 55, 69, 41) 0.7 0.8 1.6 0.9 1.6 1.6 1.5 1.2 1.6 1.2 2.2 4.0 2.6 1.0 0.7 1.3 3.7 1.3 1.4 1.4 0.6 3.1 1.7 0.4 1.6 1.7 0.7 0.7

Appendix
202
1tR a (s) 2tR
a (s) Compounds
S1 S2 S3 S4 S5 S6 S7 S8 S9 S10 S11 S12 S13 S14 S15 S16 S17 S18 S19 S20 S21 S22 S23 S24 S25 S26 S27 S28
924 0.60 (Z)-5-methyl-5-undecene 0.2 0.3 0.2 0.4 0.2 0.2 0.8 0.8 0.8 0.6 0.7 0.5 0.9 0.7 0.2 0.7 0.8 0.8 0.7 0.8 0.4 0.8 0.2 0.7 1.0 0.9 0.2 0.2
942 0.60 1-dodecene 0.3 0.5 0.4 0.9 2.0 1.7 1.1 1.4 1.3 0.9 1.3 1.3 2.3 2.2 0.8 0.7 1.3 1.6 0.9 2.6 1.2 3.4 2.4 1.6 1.7 0.8 1.1 1.1
960 0.62 alkene isomer (m/z 55, 69, 41) 0.3 0.5 0.2 0.4 2.7 2.6 1.8 2.0 3.4 1.6 1.2 0.7 2.1 6.6 0.3 1.1 1.0 1.0 1.3 1.8 0.4 1.7 2.3 1.6 2.0 2.4 0.3 0.4
978 0.59 alkene isomer (m/z 55, 69, 43) 0.2 0.4 0.1 0.2 0.5 0.4 0.7 0.8 1.2 0.9 5.3 1.5 0.4 1.2 0.1 1.0 1.1 1.5 3.2 1.5 0.3 1.1 0.5 2.3 0.5 1.0 0.2 0.2
1062 0.61 1-tridecene 0.3 0.9 0.1 0.8 2.3 2.9 2.9 2.6 4.4 2.7 3.2 2.4 2.5 2.9 0.3 2.1 2.4 3.6 2.9 3.8 1.1 4.9 2.9 2.6 2.5 2.7 0.4 0.8
Aldehydes
144 0.78 butanal 0.1 0.2 0.0 0.2 0.2 0.2 0.5 0.2 0.4 0.7 0.3 0.3 0.2 0.5 0.2 0.3 0.1 0.2 0.2 0.2 0.0 0.5 0.1 0.2 0.1 0.2 0.0 0.0
252 1.17 hexanal 1.2 0.3 0.3 2.2 0.7 0.6 0.8 1.6 0.4 1.2 0.1 0.0 0.4 3.6 0.9 1.3 0.6 1.4 0.3 1.1 0.9 1.7 1.2 1.3 0.8 0.3 0.6 2.5
474 1.22 heptanal 0.6 1.1 0.2 1.3 0.4 0.5 0.5 0.5 0.4 1.0 0.4 0.8 0.4 0.3 0.4 0.6 0.3 0.5 0.3 0.3 0.4 0.7 0.5 0.4 0.5 0.3 0.3 1.2
576 0.92 2-ethylhexanal 0.1 0.1 0.0 0.1 0.1 0.1 0.1 0.0 0.1 0.1 0.1 0.1 0.1 0.0 0.1 0.1 0.1 0.0 0.1 0.0 0.1 0.1 0.1 0.1 0.1 0.0 0.1 0.2
588 3.58 benzaldehyde 1.0 1.3 0.3 1.1 1.1 1.3 0.9 1.0 0.9 1.5 1.0 1.4 1.0 1.4 0.8 1.1 0.7 1.3 1.1 1.1 1.3 0.8 1.4 0.9 1.1 0.6 1.1 0.9
666 1.06 octanal 1.6 2.4 0.4 2.1 1.0 1.0 1.5 1.5 0.8 1.7 1.1 1.4 0.8 2.0 0.9 1.9 0.6 1.5 0.8 0.8 0.7 1.6 1.1 1.0 1.0 0.7 0.6 1.5
822 1.00 nonanal 12.5 7.8 1.7 8.7 2.3 2.6 3.7 6.5 2.7 5.5 4.9 6.3 2.0 8.7 3.4 5.9 1.8 4.8 1.6 3.3 2.8 4.8 2.7 3.9 2.4 1.7 2.2 5.3
900 1.28 (E)-2-nonenal 0.2 0.5 0.1 0.5 0.1 0.1 0.2 0.3 0.1 0.2 0.2 0.3 0.1 0.7 0.2 0.2 0.1 0.3 0.1 0.2 0.0 0.4 0.2 0.2 0.2 0.1 0.1 0.2
960 0.97 decanal 5.9 6.6 1.4 7.4 1.8 1.7 4.7 6.4 1.4 5.1 3.6 4.9 1.6 5.8 2.4 6.3 1.2 5.2 1.4 3.7 3.2 5.1 2.3 4.2 1.9 1.5 2.0 3.1
1038 1.03 aldehyde isomer (m/z 41, 55, 71) 0.2 0.3 0.1 0.2 0.5 0.4 0.5 1.1 0.4 1.1 0.6 1.0 0.4 0.8 0.2 0.8 0.3 0.9 0.4 0.9 0.0 0.9 0.3 0.9 0.4 0.3 0.0 0.0
1086 1.02 undecanal 0.2 0.2 0.0 0.3 0.1 0.1 0.3 0.5 0.1 0.3 0.3 0.4 0.1 0.3 0.1 0.5 0.0 0.3 0.0 0.3 0.3 2.2 0.1 0.3 0.1 0.3 0.1 0.1
1200 1.09 dodecanal 0.2 0.3 0.1 0.5 0.1 0.1 0.4 0.5 0.1 0.5 0.6 0.5 0.1 0.3 0.2 0.5 0.1 0.6 0.1 0.5 0.3 0.3 0.1 0.4 0.1 0.1 0.2 0.2
Ketones
138 0.79 2-butanone 2.7 1.8 0.1 0.4 0.4 0.6 0.1 0.1 0.2 0.4 0.5 0.5 0.3 0.2 0.2 0.2 0.1 0.3 0.2 0.2 0.2 0.3 0.1 0.3 0.4 0.2 0.2 0.4
240 1.16 2-hexanone 0.1 0.1 0.0 0.1 0.0 0.0 0.0 0.0 0.0 0.0 0.1 0.1 0.0 0.0 0.0 0.0 0.0 0.0 0.0 0.0 0.1 0.0 1.0 0.0 0.1 0.0 0.0 0.1
438 1.19 3-heptanone 0.2 0.0 0.0 0.0 0.0 0.1 0.1 0.0 0.1 1.4 0.1 0.2 0.1 0.8 0.1 0.1 0.1 0.2 0.1 0.6 0.1 0.2 0.0 0.2 0.1 0.1 0.1 0.3
450 1.29 ketone isomer (m/z 43, 58, 71) 0.4 0.6 0.1 0.3 0.0 0.0 0.1 0.2 0.1 0.2 0.2 0.3 0.1 0.1 0.3 0.1 0.2 0.2 0.1 0.1 0.2 0.1 0.1 0.2 0.0 0.1 0.3 0.2
642 1.10 3-octanone 0.0 0.1 0.0 0.2 0.1 0.1 0.1 0.1 0.1 0.1 0.1 0.1 0.1 0.1 0.1 0.1 0.0 0.1 0.0 0.1 0.7 0.1 0.1 0.1 0.1 0.0 0.0 0.0
642 1.33 6-methyl-5-hepten-2-one 3.4 5.9 0.9 5.5 2.4 2.5 1.9 5.1 0.3 5.5 1.2 3.2 0.2 3.0 1.8 5.4 0.1 3.0 0.2 2.4 1.3 3.8 3.6 2.3 3.8 1.3 1.0 1.5
804 1.03 2-nonanone 0.1 0.1 0.1 0.1 0.0 0.0 0.0 0.0 0.1 0.0 0.1 0.1 0.1 0.1 0.1 0.0 0.1 0.1 0.1 0.1 0.1 0.0 0.0 0.1 0.0 0.1 0.1 0.1

Appendix
203
1tR a (s) 2tR
a (s) Compounds
S1 S2 S3 S4 S5 S6 S7 S8 S9 S10 S11 S12 S13 S14 S15 S16 S17 S18 S19 S20 S21 S22 S23 S24 S25 S26 S27 S28
Miscellaneous
630 2.13 1-octen-3-ol 0.2 0.4 0.1 0.4 0.1 0.2 0.2 0.3 0.1 0.1 0.0 0.0 0.1 0.3 0.2 0.2 0.1 0.3 0.1 0.3 0.9 0.3 0.1 0.4 0.2 0.0 0.2 0.1
720 1.78 2-ethyl-1-hexanol 0.4 0.5 1.5 0.5 5.2 5.1 0.3 7.4 0.3 5.6 4.0 6.8 0.4 1.0 0.4 5.3 5.3 0.4 4.9 0.3 0.4 0.4 4.4 0.3 4.8 3.6 0.4 0.3
774 0.99 2-nonen-1-ol 0.1 0.2 0.0 0.2 0.1 0.1 0.2 0.2 0.1 0.2 1.9 2.0 0.1 0.2 0.2 0.3 0.1 0.2 0.1 0.1 0.1 0.2 0.1 0.1 0.1 0.1 0.1 0.1
780 1.86 1-octanol 0.2 0.2 0.0 0.2 0.1 0.1 0.1 0.2 0.1 0.2 0.0 0.1 0.1 0.2 0.2 0.2 0.1 1.0 0.1 0.2 0.6 0.2 0.1 0.2 0.1 0.1 0.1 0.1
912 0.97 2-decen-1-ol 0.3 0.3 0.1 0.3 0.3 0.1 0.4 0.5 0.3 0.5 0.5 0.6 0.3 0.4 0.1 0.6 0.3 0.5 0.2 0.1 0.2 0.5 0.4 0.1 0.1 0.3 0.1 0.2
Table S1 continued
1tR a (s) 2tR
a (s) Compounds
S29 S30 S31 S32 S33 S34 S35 S36 S37 S38 S39 S40 S41 S42 S43 S44 S45 S46 S47 S48 S49 S50 S51 S52 S53 S54 S55
Hydrocarbons
Alkanes
138 0.48 hexane 0.8 2.1 0.5 0.7 0.8 0.5 0.5 0.5 0.5 0.2 0.3 0.8 0.8 0.6 0.9 1.9 1.1 1.0 0.4 0.7 0.6 0.8 0.9 1.0 0.6 0.6 0.7
210 0.52 2,4-dimethylhexane 0.6 1.1 0.2 0.4 0.3 0.5 0.4 0.4 0.2 0.1 0.1 1.3 0.6 1.5 0.4 0.5 0.4 0.2 0.7 1.2 0.5 0.2 4.9 0.2 0.1 0.4 0.7
252 0.54 octane 1.0 1.4 0.6 1.1 1.1 1.4 1.4 0.6 0.7 0.4 0.5 0.6 0.8 2.3 1.6 1.1 1.1 1.3 0.6 1.4 1.3 1.5 2.6 1.8 0.3 0.4 0.9
276 0.55 2,2,4-trimethylhexane 0.2 0.3 0.1 0.1 0.8 0.3 0.2 0.1 0.1 0.0 0.1 3.5 2.4 3.9 3.3 0.7 1.4 1.9 3.1 1.4 1.9 1.7 4.1 3.3 0.1 1.8 1.7
288 0.55 2,4-dimethylheptane 1.2 2.7 0.4 0.9 0.8 3.0 1.5 0.5 0.9 0.7 1.1 0.1 0.9 0.6 1.7 0.7 1.0 1.1 0.2 0.5 1.0 1.1 1.6 0.8 0.3 0.5 0.1
318 0.56 4-ethyl-2-methylhexane 0.2 0.5 0.1 0.2 0.2 0.4 0.4 0.1 0.1 0.1 0.2 1.0 0.6 2.1 2.0 1.7 2.0 2.0 1.4 1.7 0.8 0.5 0.8 1.1 0.0 0.6 0.6
366 0.58 alkane isomer (m/z 43, 57, 85) 0.5 0.9 0.3 0.5 0.3 1.1 1.1 0.0 0.0 0.0 0.0 0.7 0.4 0.7 0.6 1.3 1.2 1.3 0.9 0.4 0.3 0.4 0.0 1.2 0.2 0.4 0.4
468 0.56 nonane 1.9 1.5 4.2 3.2 1.9 4.8 7.8 3.7 3.4 3.0 3.0 4.0 7.0 2.5 6.9 3.7 3.0 9.1 3.4 8.7 3.5 4.5 3.2 4.9 2.2 2.1 2.4
504 0.55 alkane isomer (m/z 43, 57, 85) 0.2 0.2 0.3 0.3 0.1 0.6 0.8 0.3 0.1 0.1 0.1 2.0 0.5 0.6 0.5 1.3 1.6 1.0 1.2 0.5 0.3 0.7 0.5 2.0 0.1 0.5 2.8
516 0.55 2,4-dimethyloctane 0.1 0.1 1.8 0.1 0.1 0.3 1.7 0.6 0.2 0.2 0.2 0.1 0.1 0.2 0.4 0.1 0.3 0.3 0.1 0.3 0.2 0.2 0.1 0.2 0.0 0.1 0.0
528 0.56 3-ethyl-3-methylheptane 0.2 0.1 0.4 0.2 0.1 0.2 0.8 0.3 0.3 0.3 0.3 0.2 0.2 0.3 0.2 0.6 0.7 0.6 0.2 0.4 0.4 0.4 0.3 0.3 0.1 0.1 0.1
540 0.55 2,6-dimethyloctane 0.6 0.3 1.0 0.9 0.4 1.5 2.0 0.3 0.5 0.5 3.1 0.9 0.8 0.7 0.7 1.3 1.3 0.6 0.9 0.6 0.5 1.6 1.0 1.1 0.6 0.8 0.7
552 0.55 3-ethyl-2-methylheptane 0.5 0.2 0.8 0.6 0.2 1.1 1.6 0.7 1.3 0.7 2.1 0.4 0.4 0.3 0.4 0.3 0.3 0.3 0.2 0.1 0.5 0.5 0.4 0.3 0.1 0.2 0.3
558 0.55 alkane isomer (m/z 57, 43, 71) 0.1 0.1 0.1 0.1 0.7 0.1 0.1 0.1 0.4 0.3 0.3 0.4 0.1 0.6 0.2 0.2 0.2 0.4 0.4 0.3 0.4 0.4 0.2 3.0 0.1 0.1 0.1
564 0.55 alkane isomer (m/z 43, 57, 71) 0.3 0.1 0.6 0.4 0.2 0.6 1.1 0.1 0.1 0.1 0.1 0.2 0.3 0.2 0.2 0.3 0.2 0.3 0.3 0.2 0.3 0.5 0.3 0.4 0.1 0.3 0.1

Appendix
204
1tR a (s) 2tR
a (s) Compounds
S29 S30 S31 S32 S33 S34 S35 S36 S37 S38 S39 S40 S41 S42 S43 S44 S45 S46 S47 S48 S49 S50 S51 S52 S53 S54 S55
576 0.56 4-ethyloctane 0.2 0.1 0.3 0.2 0.1 0.3 0.4 0.2 0.0 0.0 0.0 0.3 0.2 0.2 0.2 0.3 0.4 0.3 0.3 0.2 0.2 0.3 0.2 0.4 0.1 0.3 0.3
582 0.55 4-methylnonane 0.2 0.1 0.3 0.3 0.2 0.3 0.3 0.2 0.1 0.0 0.1 0.6 0.3 0.3 1.2 0.7 0.8 0.6 0.5 0.4 0.4 1.5 0.6 0.9 0.2 0.3 0.2
588 0.54 alkane isomer (m/z 57, 43, 85) 0.4 0.2 1.2 0.2 0.1 0.8 1.8 1.1 0.5 0.4 0.4 0.4 0.1 0.7 0.1 0.5 0.3 0.5 0.5 0.7 0.1 0.4 0.4 0.4 0.1 0.1 0.1
594 0.55 alkane isomer (m/z 57, 43, 71) 0.9 0.4 2.5 1.1 0.6 1.7 3.5 2.2 8.9 8.2 4.8 1.0 1.4 0.7 1.3 3.3 0.3 0.7 0.9 0.6 1.1 1.2 0.8 1.1 0.4 0.4 0.5
600 0.55 2-methylnonane 0.6 0.3 1.1 0.8 0.4 1.0 1.5 0.9 1.1 0.9 0.9 0.9 2.4 0.7 0.6 2.9 1.0 1.5 0.9 0.6 0.6 1.0 0.6 0.9 0.4 1.5 0.5
606 0.55 alkane isomer (m/z 57, 43, 41) 0.5 0.2 2.3 0.5 0.3 0.9 2.2 2.2 3.7 4.1 3.5 0.2 0.2 0.2 0.2 1.2 0.4 0.3 0.3 0.2 0.4 0.6 0.4 0.0 0.1 0.2 0.5
612 0.55 3-methylnonane 0.5 0.2 0.2 0.7 0.3 0.8 0.8 0.6 0.7 2.4 0.6 1.1 0.9 0.6 0.7 1.2 1.3 1.0 0.9 0.7 0.5 0.9 0.8 0.8 0.4 0.5 0.7
636 0.54 2,2,4,6,6-pentamethylheptane 6.6 3.0 4.6 19.3 9.4 3.8 7.4 3.4 4.5 3.6 3.9 2.6 3.7 3.9 3.0 2.9 3.9 2.8 0.9 2.8 3.8 1.3 2.3 1.4 0.2 0.6 2.7
660 0.56 decane 4.6 3.3 6.8 7.2 3.9 5.0 8.6 6.9 5.5 3.6 5.4 3.4 5.2 3.3 3.2 7.6 6.1 6.9 4.0 3.4 4.1 4.5 3.4 4.4 3.5 2.9 3.4
672 0.54 alkane isomer (m/z 57, 41, 71) 0.5 0.1 1.4 0.3 1.7 0.2 0.4 6.9 5.5 3.6 5.4 0.1 0.2 0.1 0.1 0.2 0.4 0.2 0.4 1.7 1.7 1.5 0.7 0.1 0.1 0.1 0.3
720 0.54 3,9-dimethylnonane 0.5 0.1 1.3 1.2 0.3 0.5 0.7 1.2 0.6 0.5 0.5 7.0 6.5 6.3 9.7 0.5 0.7 1.1 0.5 0.1 0.1 0.1 0.1 0.1 0.7 7.9 0.1
756 0.54 2-methyldecane 9.0 7.9 2.8 3.2 5.5 11.7 4.0 5.1 8.6 8.4 10.3 1.6 1.6 1.8 2.2 3.1 2.7 2.4 2.1 2.1 3.4 4.1 4.2 2.2 4.4 5.4 1.7
768 0.54 alkane isomer (m/z 57, 43, 85) 0.5 0.4 3.0 0.9 0.6 0.6 0.7 5.1 5.4 5.4 6.3 1.5 0.4 0.5 0.5 1.1 1.3 1.5 0.6 0.3 1.0 0.5 0.3 0.4 0.3 0.9 0.4
774 0.55 3-methyldecane 0.9 0.5 3.0 1.8 0.8 1.1 2.5 1.9 1.5 1.4 1.3 0.7 0.8 0.7 0.8 0.5 0.5 0.4 0.4 0.4 0.7 0.5 0.4 0.3 0.3 0.5 0.6
786 0.55 alkane isomer (m/z 57, 43, 71) 0.9 0.2 1.4 1.0 1.0 0.9 1.0 0.5 0.5 0.4 0.6 0.2 0.2 0.2 0.3 0.2 0.2 0.2 0.1 0.2 0.1 0.2 0.2 0.1 0.1 0.1 0.2
798 0.55 alkane isomer (m/z 57, 43, 71) 0.9 0.4 0.7 1.1 0.6 1.0 1.1 0.6 0.9 0.6 0.5 1.0 0.2 0.2 0.2 1.1 0.2 0.1 0.8 0.2 0.2 0.2 0.3 0.4 0.3 0.1 0.2
804 0.55 alkane isomer (m/z 43, 71, 57) 0.8 0.4 0.5 1.0 0.4 0.9 0.9 0.5 0.4 0.5 0.4 0.1 0.1 0.2 0.5 0.4 0.2 0.2 0.1 0.1 0.2 0.2 0.2 0.1 0.2 0.1 0.1
822 0.55 undecane 13.8 20.9 5.9 7.6 3.4 19.0 6.2 1.9 2.6 7.7 4.0 3.0 2.6 3.5 4.5 5.7 5.2 5.4 3.7 6.1 4.7 3.7 4.4 5.4 7.6 6.5 4.4
864 0.56 2,3-dimethyldecane 0.4 0.3 0.7 0.7 0.4 0.4 0.4 1.0 0.4 0.4 0.0 0.2 0.6 0.2 0.0 0.4 0.2 0.1 1.6 0.2 0.2 0.2 0.2 0.3 0.6 0.4 0.4
876 0.56 alkane isomer (m/z 57, 43, 71) 0.3 0.4 0.3 0.4 0.4 0.2 0.2 0.8 0.4 0.2 0.4 1.6 1.3 1.3 1.3 1.7 1.6 1.3 2.2 1.4 1.5 1.4 1.3 1.6 1.3 1.2 1.5
894 0.55 5-methylundecane 0.7 0.5 0.7 1.1 0.0 0.7 0.6 1.2 1.3 1.0 1.4 1.0 0.8 0.4 0.4 0.4 0.4 0.9 0.7 0.5 0.4 0.2 0.7 0.3 0.5 0.6 0.7
906 0.57 alkane isomer (m/z 57, 43, 71) 0.7 0.5 0.9 0.8 0.8 0.7 0.7 0.8 0.6 0.5 0.6 0.7 5.0 0.6 1.3 0.0 0.7 1.5 0.4 0.9 1.7 0.6 1.6 0.4 0.4 0.5 1.2
912 0.57 3,9-dimethylundecane 0.5 0.3 0.7 0.6 0.5 0.6 0.5 0.6 0.5 0.5 0.5 0.5 0.6 0.7 0.5 0.7 0.8 0.7 1.0 0.8 0.6 0.8 0.4 0.9 0.8 1.0 0.9
948 0.57 dodecane 10.6 9.2 3.7 6.3 6.6 8.7 7.7 3.2 5.2 3.6 7.6 2.4 2.6 2.5 2.5 2.7 3.0 2.7 2.9 2.3 2.8 2.5 2.4 2.8 2.9 2.8 3.1
960 0.58 alkane isomer (m/z 57, 71, 43) 0.2 9.2 0.1 0.4 0.3 0.2 0.2 0.1 0.2 0.1 0.2 0.2 0.6 0.2 0.2 1.1 0.1 0.1 0.2 0.1 0.2 0.1 0.1 0.2 0.1 0.3 2.6
966 0.57 alkane isomer (m/z 57, 43, 71) 0.4 0.3 0.4 0.4 0.5 0.4 0.3 0.3 0.3 0.3 0.3 2.2 1.9 1.5 1.5 2.4 0.9 1.1 1.2 1.6 2.2 1.9 2.0 2.4 1.8 2.1 2.6
972 0.56 2,5,6-trimethyldecane 0.5 0.3 0.6 0.7 0.8 0.6 0.4 0.5 0.5 0.4 0.5 0.2 0.2 0.1 0.2 0.2 0.2 0.2 0.3 2.1 5.9 5.7 4.5 1.9 0.2 0.2 0.7
978 0.57 alkane isomer (m/z 57, 43, 71) 0.3 0.1 0.2 0.1 0.4 0.2 0.2 0.6 0.2 0.5 0.2 1.0 0.4 0.7 0.7 0.4 2.9 0.4 3.3 0.4 0.4 0.7 0.3 0.7 0.0 0.7 0.2
996 0.56 alkane isomer (m/z 57, 43, 71) 0.2 0.2 0.1 0.2 0.3 0.1 0.2 0.1 0.3 0.1 0.3 0.5 0.7 0.6 0.6 0.5 0.7 0.5 0.8 0.5 0.9 0.5 0.3 0.2 0.8 0.4 0.5
1002 0.57 alkane isomer (m/z 57, 43, 71) 0.2 0.1 0.1 0.2 0.3 0.1 0.1 0.1 0.1 0.1 0.1 0.6 0.5 0.6 0.5 0.6 0.9 0.9 1.5 1.0 0.7 0.9 0.5 1.0 1.1 0.5 1.2
1008 0.57 6-methyldodecane 0.2 0.2 0.2 0.2 0.4 0.2 0.0 0.1 0.2 0.1 0.2 2.6 0.7 2.6 0.5 1.5 2.4 1.5 2.2 1.4 0.6 1.8 1.4 1.5 1.6 1.5 1.9

Appendix
205
1tR a (s) 2tR
a (s) Compounds
S29 S30 S31 S32 S33 S34 S35 S36 S37 S38 S39 S40 S41 S42 S43 S44 S45 S46 S47 S48 S49 S50 S51 S52 S53 S54 S55
1056 0.57 alkane isomer (m/z 57, 43, 71) 0.2 0.1 0.1 0.2 0.5 0.2 0.2 0.1 0.1 0.1 0.1 0.1 0.9 0.8 0.8 0.3 0.6 0.5 0.4 0.4 0.6 0.5 0.4 0.3 0.8 0.6 0.3
1062 0.55 alkane isomer (m/z 57, 71, 43) 1.0 0.8 0.4 0.6 1.1 1.0 0.8 0.4 1.0 1.2 0.7 0.3 0.2 0.3 0.4 0.5 0.3 0.5 0.4 0.5 0.5 0.4 0.3 0.4 0.6 0.6 0.3
1068 0.56 alkane isomer (m/z 43, 57, 71) 0.9 0.6 0.3 0.7 1.4 0.9 0.7 0.3 1.0 0.5 0.4 0.4 0.5 0.4 0.3 0.8 0.4 0.5 0.1 0.5 0.4 0.5 0.8 0.4 0.5 0.8 0.3
1074 0.57 tridecane 2.5 1.5 1.7 1.3 2.5 2.1 2.1 1.5 1.3 1.3 2.2 2.0 1.4 2.5 1.6 1.4 3.5 3.0 2.0 1.5 2.9 1.4 2.8 2.7 1.5 1.2 1.5
1092 0.57 2,2-dimethyldodecane 0.3 0.3 0.8 0.3 1.0 0.3 0.3 0.9 0.8 0.3 0.3 0.4 0.3 0.8 0.5 0.5 0.6 0.5 1.1 0.4 0.4 0.4 0.4 0.4 0.9 0.8 0.5
1104 0.57 alkane isomer (m/z 57, 43, 71) 4.9 5.0 1.4 3.6 5.0 4.3 3.4 1.8 3.8 6.4 6.0 1.9 2.3 1.6 1.7 7.3 4.0 4.6 2.8 3.9 2.4 2.9 3.7 4.0 5.3 4.7 4.7
1110 0.57 alkane isomer (m/z 57, 43, 71) 0.4 0.5 0.2 0.4 0.9 0.3 0.3 0.2 0.2 0.2 0.3 0.4 0.4 0.5 0.4 0.5 0.4 0.4 0.4 0.5 0.4 0.4 0.4 0.3 0.4 0.4 0.2
1116 0.57 alkane isomer (m/z 57, 71, 43) 3.6 2.2 1.1 3.6 4.9 3.3 1.8 0.9 1.8 2.0 1.4 1.8 3.4 1.9 1.0 2.1 2.0 2.3 1.4 2.0 1.8 1.6 1.2 2.2 4.9 5.6 2.4
1128 0.57 3-ethyl-3-methylundecane 1.2 1.4 0.6 0.0 0.0 1.1 0.0 0.5 0.6 0.7 0.7 2.6 1.0 4.7 4.8 2.2 1.3 2.7 1.8 3.2 2.8 1.1 0.7 2.6 1.8 2.6 2.0
1152 0.60 2-methyltridecane 0.5 0.3 0.5 0.6 0.0 0.4 0.4 0.5 0.4 0.3 0.3 0.8 0.7 1.0 0.9 1.4 2.3 1.5 1.6 0.8 0.9 0.9 0.6 0.8 1.2 1.1 1.1
1158 0.59 alkane isomer (m/z 57, 43, 71) 0.5 0.3 0.6 0.8 0.6 0.4 0.7 0.5 0.4 0.4 0.3 1.1 0.6 0.7 0.7 1.0 1.1 1.1 0.8 1.0 1.2 0.6 1.0 0.6 1.2 0.8 0.8
1170 0.61 alkane isomer (m/z 57, 43, 71) 0.2 0.2 0.3 0.2 0.5 0.2 0.2 0.2 0.2 0.2 0.1 0.8 0.5 1.8 0.6 0.6 1.2 0.5 0.8 0.3 0.5 0.2 1.4 1.0 1.0 0.3 1.0
1188 0.61 tetradecane 3.5 3.2 3.0 2.6 4.3 2.2 3.2 2.6 2.3 1.6 1.9 3.9 1.8 2.5 2.6 2.2 3.4 3.1 2.4 1.9 3.1 2.6 3.4 2.6 3.3 3.8 5.5
1284 0.58 alkane isomer (m/z 57, 43, 85) 0.4 0.3 0.3 0.3 0.3 0.4 0.4 0.3 0.3 0.2 0.2 0.3 0.3 0.3 0.2 0.3 0.3 0.3 0.5 0.3 0.3 0.3 0.3 0.3 0.6 0.4 0.5
1290 0.58 6,6-diethyldodecane 1.7 1.8 1.2 1.8 1.6 1.8 1.5 1.1 1.3 1.3 1.1 1.2 1.6 0.9 1.1 1.2 1.1 1.2 0.6 1.2 1.5 1.2 1.1 1.8 2.4 0.4 1.6
1296 0.64 pentadecane 0.7 0.6 1.0 0.9 1.0 0.6 0.7 0.9 0.7 0.4 0.5 0.2 0.4 0.3 1.0 0.3 0.3 0.3 0.5 1.1 1.1 0.3 0.6 0.4 2.9 1.9 0.5
1302 0.59 5-ethyl-5-methyltridecane 0.4 2.5 0.3 0.2 0.5 0.2 0.2 0.3 0.2 0.1 0.2 0.9 0.9 0.7 0.7 0.5 0.2 0.3 0.4 0.7 0.7 0.3 0.3 0.8 0.3 1.7 0.6
1338 0.61 3-ethyl-3-methyltridecane 2.6 2.3 2.0 2.5 2.0 3.0 2.4 1.9 1.5 1.5 1.7 1.2 0.3 1.5 0.5 0.3 0.4 0.4 0.5 0.9 0.9 1.1 1.0 0.5 0.8 0.8 1.8
Cyclic
240 0.57 1,2,4-trimethylcyclopentane 0.5 0.5 0.4 0.3 0.4 0.2 0.2 0.2 0.1 0.0 0.0 0.2 0.2 0.5 0.6 0.4 0.5 0.4 0.7 0.3 0.3 0.5 0.5 0.3 0.1 0.2 0.1
534 0.60 propylcyclohexane 0.1 0.3 0.3 0.2 0.3 0.2 0.4 0.1 0.3 0.3 0.2 1.6 1.2 0.7 1.7 1.9 2.7 1.7 1.3 1.0 1.0 2.2 1.6 2.5 0.5 0.8 0.7
576 0.59 1,1,2,3-tetramethylcyclohexane 0.3 0.1 0.5 0.5 0.3 0.4 0.3 0.2 0.1 0.1 0.1 1.1 0.7 0.7 0.3 0.2 0.4 0.6 1.3 0.7 0.8 0.5 0.5 1.9 0.2 0.4 0.6
618 0.60 2-ethyl-1,3-dimethylcyclohexane 0.1 0.1 0.1 0.2 0.1 0.1 0.1 0.1 0.4 0.1 0.3 0.4 0.3 0.3 0.3 0.5 0.7 0.4 0.5 0.3 0.3 0.5 0.3 0.5 0.1 0.2 0.2
624 0.59 1-methyl-3-propylcyclohexane 0.4 0.2 0.3 0.7 0.3 0.6 1.2 1.0 0.7 0.8 0.6 0.5 0.4 0.4 0.4 0.5 0.8 0.6 0.6 0.4 0.5 1.6 0.5 0.5 0.3 0.2 0.2
630 0.58 1-methyl-3-(2-methylpropyl)cyclopentane 0.6 0.5 1.1 1.0 0.7 0.5 1.3 1.4 1.1 1.2 0.9 1.7 0.7 0.9 0.6 0.7 1.0 0.8 0.8 0.5 1.1 2.6 0.5 0.7 0.4 0.6 0.4
642 0.59 ethylpropylcyclopentane 0.1 0.1 0.4 0.2 0.1 0.2 0.4 0.3 0.2 0.3 0.2 0.3 0.4 0.2 0.4 0.2 0.6 0.8 0.5 0.2 0.2 0.5 0.2 0.3 0.1 0.1 0.1
654 0.59 1-methyl-2-propylcyclohexane 0.4 0.2 0.6 0.6 0.4 0.4 0.7 0.3 0.2 0.3 0.2 0.4 0.4 0.3 0.3 0.3 0.5 0.4 0.4 0.3 0.3 0.8 0.3 0.3 1.4 0.3 0.2
732 0.57 hexylcyclopentane 0.4 0.2 0.6 0.5 0.4 0.3 0.5 1.0 0.8 0.4 0.6 1.3 2.5 2.4 1.2 1.1 0.6 0.4 0.9 0.6 0.7 1.0 1.8 0.6 0.4 0.4 0.5
792 0.57 1,4-dimethylcycloctane 0.6 0.5 2.9 1.3 0.6 0.5 0.9 3.5 2.2 2.6 0.8 1.6 2.4 2.9 3.0 0.7 0.7 0.7 1.0 1.4 0.9 0.6 0.7 0.9 0.7 0.7 0.8
804 0.59 1-ethyl-2-propycylohexane 0.2 0.4 0.9 0.8 0.7 0.3 0.2 0.9 0.7 0.2 0.3 1.1 2.4 1.3 1.2 1.4 1.0 0.7 0.9 1.4 1.2 0.9 0.5 2.3 2.2 1.6 1.4
996 0.62 hexylcyclohexane 0.2 0.1 0.2 0.2 0.3 0.2 0.1 0.2 0.1 0.1 0.1 0.6 0.6 0.7 0.7 0.4 0.5 0.3 0.7 0.6 0.6 0.3 0.2 0.9 0.4 0.3 0.8

Appendix
206
1tR a (s) 2tR
a (s) Compounds
S29 S30 S31 S32 S33 S34 S35 S36 S37 S38 S39 S40 S41 S42 S43 S44 S45 S46 S47 S48 S49 S50 S51 S52 S53 S54 S55
1068 0.65 1-hexyl-3-methylcyclohexane 0.4 0.2 0.3 0.2 1.3 0.3 0.2 0.3 0.2 0.2 0.2 1.3 1.2 1.3 1.3 1.0 1.8 1.2 1.8 1.2 1.1 1.2 0.9 1.1 0.2 0.3 1.8
1080 0.60 1-butyl-2-propylcyclopentane 0.4 0.2 0.3 0.2 0.5 0.3 0.2 0.2 0.2 0.2 0.3 1.7 1.2 2.5 1.5 1.3 1.6 1.5 3.1 1.7 1.3 2.1 1.5 1.4 1.6 0.5 0.5
Alkenes
252 0.60 3-octene 0.2 0.4 0.1 0.2 0.2 0.1 0.1 0.1 0.1 0.1 0.1 0.1 0.1 0.2 0.2 0.0 0.2 0.5 0.2 0.1 0.1 0.1 0.1 0.1 0.0 0.1 0.1
330 0.61 2,4-dimethyl-1-heptene 0.3 0.5 0.3 0.3 0.3 0.4 0.2 0.2 0.2 0.1 0.2 0.2 0.2 1.1 0.7 0.3 0.1 0.2 0.1 0.1 0.2 0.1 0.2 0.2 0.2 0.1 0.2
450 0.61 1-nonene 0.2 0.2 0.2 0.1 0.3 0.2 0.1 0.2 0.2 0.1 0.2 0.3 0.2 0.2 0.2 0.2 0.2 0.2 0.5 0.2 0.1 0.2 0.1 0.2 0.1 0.2 0.1
546 0.57 alkene isomer (m/z 55, 41, 69) 0.1 0.1 0.4 0.3 0.1 0.4 0.8 0.4 0.2 0.1 0.5 0.4 0.3 0.3 0.3 0.5 0.7 0.8 0.5 0.0 0.3 0.7 0.4 0.6 0.1 0.2 0.2
552 0.57 3-methyl-1-nonene 0.3 0.1 0.5 0.4 0.3 0.1 0.8 0.4 1.3 0.5 0.6 1.5 0.7 0.7 0.7 0.8 0.7 0.6 0.6 0.5 0.7 1.1 0.9 0.3 0.2 0.3 0.3
570 0.59 3,4-diethyl-2-hexene 0.1 0.1 0.1 0.2 0.1 0.2 0.2 0.1 0.5 1.6 0.6 0.7 0.4 0.4 0.4 0.3 0.4 0.4 0.8 0.4 0.3 0.4 0.4 0.9 0.1 0.4 0.6
582 0.59 alkene isomer (m/z 69,41,56) 1.4 0.1 0.2 0.3 0.2 0.2 0.3 0.3 0.0 0.2 0.2 0.3 0.1 0.1 0.2 0.2 0.4 0.2 0.3 0.2 0.2 0.4 0.3 0.3 1.2 0.1 0.1
606 0.59 alkene isomer (m/z 69,41,56) 0.4 0.1 0.4 0.7 0.4 0.4 0.7 0.6 0.5 0.4 0.4 0.5 0.5 1.4 0.4 0.1 0.1 0.1 0.7 0.4 0.5 1.1 0.8 0.7 0.1 0.1 0.1
612 0.59 7-methyl-1-nonene 0.2 0.2 0.1 0.2 0.2 0.1 0.1 0.1 0.1 0.1 0.1 0.4 0.3 0.3 0.3 0.4 0.7 0.5 0.5 0.3 0.2 0.4 0.3 0.5 0.2 0.2 0.3
648 0.59 4-decene 0.4 0.4 0.4 0.4 0.4 0.3 0.3 0.4 0.3 0.3 0.6 0.4 0.7 0.3 0.4 0.5 0.7 0.8 0.5 0.3 0.3 0.5 0.2 0.5 0.2 0.3 0.2
762 0.55 alkene isomer (m/z 55, 69, 41) 0.0 0.0 0.2 0.3 0.1 0.2 0.2 2.9 3.2 3.0 4.0 0.9 1.1 1.1 0.9 1.4 1.8 1.8 1.3 1.1 1.6 2.4 1.6 1.3 1.5 1.5 0.9
768 0.56 alkene isomer (m/z 55, 69, 41) 0.5 0.2 0.3 0.5 0.0 0.6 0.6 0.2 0.2 0.1 0.6 0.5 0.4 0.4 0.4 0.4 0.4 0.4 0.6 0.2 0.3 0.5 0.3 0.1 0.3 0.5 0.4
780 0.56 (Z)-2-decene 0.5 0.2 0.6 0.5 0.3 0.4 0.4 0.8 1.4 0.4 0.4 2.4 1.0 0.6 0.8 0.7 0.6 0.6 1.0 0.6 1.0 0.6 0.6 2.6 0.4 0.5 0.6
798 0.56 alkene isomer (m/z 55, 69, 41) 1.0 0.3 2.9 1.6 0.6 0.7 0.8 1.2 0.8 0.8 0.8 1.6 2.4 2.9 3.0 1.3 1.5 1.2 2.2 1.3 1.3 1.4 1.8 1.6 4.7 0.9 3.2
810 0.55 alkene isomer (m/z 69, 55, 41) 0.7 0.3 0.8 0.6 0.3 0.6 0.4 0.7 0.5 0.6 0.5 0.8 0.6 0.8 0.7 0.8 0.7 0.8 1.2 1.6 3.0 2.3 1.9 0.8 0.6 0.7 0.7
828 0.57 alkene isomer (m/z 55, 69, 41) 0.6 0.2 0.6 1.0 0.4 0.4 0.4 2.4 0.9 0.6 0.3 3.6 2.9 2.9 0.2 1.1 2.9 1.9 2.0 3.2 1.3 1.4 1.4 1.2 1.9 1.9 3.8
870 0.59 2-methyl-1-undecene 0.2 0.2 0.5 0.7 0.3 0.4 0.3 0.2 2.3 0.6 1.5 1.4 1.2 1.4 1.7 2.3 1.3 1.2 1.9 1.1 2.2 1.2 1.7 1.3 1.3 1.3 1.3
918 0.60 (E)-5-methyl-4-undecene 0.5 0.3 0.5 0.2 0.2 0.1 0.1 0.2 0.2 0.1 0.2 0.9 0.7 0.8 0.8 0.8 0.7 0.6 1.1 0.6 0.7 0.8 0.6 0.8 0.7 0.6 0.4
924 0.60 (Z)-5-methyl-5-undecene 0.3 0.1 0.5 0.3 0.2 0.2 0.2 0.4 0.2 0.2 0.2 0.9 0.8 0.7 0.7 0.8 0.7 0.7 1.1 0.8 0.8 0.9 0.7 0.8 0.6 0.5 0.7
942 0.60 1-dodecene 1.1 1.1 0.7 0.4 0.4 1.0 0.8 0.6 1.0 1.0 1.1 1.6 1.2 0.8 1.0 2.0 2.5 1.3 2.7 1.3 1.3 3.2 0.9 1.3 2.9 1.4 1.9
960 0.62 alkene isomer (m/z 55, 69, 41) 0.4 0.4 0.3 0.4 0.4 0.4 0.3 0.3 0.3 0.2 0.3 1.6 0.7 1.5 1.4 2.3 3.0 2.9 2.3 4.7 1.9 1.6 2.0 1.9 1.8 0.3 2.3
978 0.59 alkene isomer (m/z 55, 69, 43) 0.2 0.1 0.2 0.1 0.3 0.2 0.1 0.1 0.1 0.1 0.1 0.4 1.2 0.4 0.4 0.9 0.8 2.1 0.5 0.7 1.2 1.8 0.8 0.3 0.8 0.3 1.3
1062 0.61 1-tridecene 0.4 0.4 0.3 0.3 0.7 0.7 0.3 0.5 0.6 0.5 0.8 2.8 2.5 3.1 2.8 2.4 3.9 3.3 3.2 3.1 2.6 2.1 2.4 2.0 4.3 3.5 2.6
Aldehydes
144 0.78 butanal 0.2 0.3 0.1 0.1 0.3 0.0 0.0 0.1 0.3 0.1 0.3 0.2 0.2 0.8 0.5 0.9 0.2 0.2 0.1 0.4 0.2 0.2 0.4 0.2 0.3 0.3 0.2
252 1.17 hexanal 1.3 1.8 5.6 1.2 1.6 0.6 1.0 5.1 1.0 3.3 1.0 0.6 0.7 0.4 0.5 0.7 0.4 0.6 0.8 0.8 0.7 0.5 0.4 0.5 1.5 1.8 2.1

Appendix
207
1tR a (s) 2tR
a (s) Compounds
S29 S30 S31 S32 S33 S34 S35 S36 S37 S38 S39 S40 S41 S42 S43 S44 S45 S46 S47 S48 S49 S50 S51 S52 S53 S54 S55
474 1.22 heptanal 0.6 0.8 2.1 1.1 1.0 0.4 0.5 1.8 0.5 1.3 0.5 0.3 0.4 0.3 0.4 0.3 0.3 0.4 0.4 0.5 0.4 0.3 0.4 0.4 0.7 0.5 0.4
576 0.92 2-ethylhexanal 0.1 0.1 0.2 0.1 0.1 0.1 0.1 0.2 0.1 0.2 0.1 0.1 0.1 0.1 0.1 0.1 0.1 0.1 0.1 0.1 0.1 0.1 0.1 0.1 0.1 0.1 0.0
588 3.58 benzaldehyde 1.3 1.8 1.1 1.4 1.5 1.0 0.8 0.9 0.8 0.7 0.9 1.1 1.1 1.0 1.2 1.1 0.9 1.1 1.1 1.0 0.9 0.7 0.9 0.8 1.1 1.2 1.1
666 1.06 octanal 1.0 1.1 3.0 1.1 2.0 0.6 1.1 2.7 1.1 2.0 1.0 0.8 0.6 0.6 0.7 0.6 0.7 0.9 0.6 0.8 0.8 0.7 0.7 1.0 1.6 1.7 1.4
822 1.00 nonanal 3.7 2.7 8.6 3.5 7.7 1.9 3.2 7.4 3.7 5.9 3.5 2.1 2.0 1.5 2.3 2.1 1.8 2.0 2.5 2.5 2.3 1.8 2.2 2.4 4.8 4.3 5.1
900 1.28 (E)-2-nonenal 0.5 0.1 0.3 0.3 0.3 0.1 0.1 0.5 0.2 0.2 0.2 0.1 0.1 0.1 0.1 0.1 0.1 0.1 0.2 0.1 0.1 0.1 0.1 0.1 0.2 0.2 0.2
960 0.97 decanal 3.2 3.4 5.3 3.8 7.4 1.8 3.1 4.6 2.9 3.4 2.5 1.7 1.6 1.1 2.3 1.7 1.5 1.8 2.0 2.4 1.9 1.8 1.9 2.9 5.9 5.0 4.9
1038 1.03 aldehyde isomer (m/z 41, 55, 71) 0.2 0.1 0.1 0.2 0.3 0.0 0.2 0.1 0.2 0.1 0.1 0.3 0.3 0.4 0.4 0.3 0.3 0.5 0.4 0.3 0.3 0.3 0.5 0.7 1.0 1.1 0.7
1086 1.02 undecanal 0.2 0.2 0.2 0.1 0.2 0.1 0.1 0.3 0.1 0.1 0.1 0.1 0.0 0.0 0.1 0.1 0.1 0.1 0.1 0.1 0.1 0.7 0.1 0.2 0.3 0.3 0.2
1200 1.09 dodecanal 0.3 0.2 0.4 0.4 0.3 0.1 0.2 1.1 0.3 0.2 0.2 0.1 0.1 0.1 0.1 0.2 0.1 0.1 0.1 0.2 0.1 0.1 0.1 0.3 0.4 0.5 0.2
Ketones
138 0.79 2-butanone 0.5 0.7 0.2 0.8 1.3 0.2 0.5 0.8 0.3 0.3 0.3 0.2 0.1 0.1 0.2 0.2 0.1 0.4 0.4 0.5 0.3 0.2 0.4 0.1 0.3 0.2 0.2
240 1.16 2-hexanone 0.1 0.1 0.2 0.1 0.1 0.1 0.1 0.1 0.1 0.1 0.0 0.0 0.0 0.0 0.0 0.0 0.0 0.0 0.0 0.0 0.0 0.0 0.0 0.0 0.0 0.0 0.0
438 1.19 3-heptanone 0.1 0.1 0.4 0.0 0.0 0.1 0.2 0.3 0.1 0.3 0.1 0.3 0.2 0.1 0.1 0.1 0.1 0.1 0.0 0.1 0.1 0.1 0.1 0.1 0.2 0.0 2.3
450 1.29 ketone isomer (m/z 43, 58, 71) 0.5 0.4 0.4 0.1 0.5 0.2 0.3 0.3 0.6 0.2 0.3 0.1 0.2 0.2 0.0 0.2 0.2 0.2 0.2 0.4 0.3 0.1 0.2 0.1 0.2 0.2 0.1
450 2.07 ciclohexanone 1.6 1.1 0.1 0.0 0.3 0.2 0.1 1.3 0.9 1.0 0.9 0.7 0.3 0.2 0.2 0.4 0.3 0.2 0.5 1.1 1.3 0.7 1.2 0.7 0.2 0.2 0.4
642 1.10 3-octanone 0.0 0.2 0.0 0.2 0.1 0.0 0.0 0.0 0.1 0.0 0.1 0.1 0.1 0.0 0.0 0.1 0.1 0.1 0.1 0.1 0.1 0.1 0.0 0.1 0.1 0.1 0.1
642 1.33 6-methyl-5-hepten-2-one 2.3 2.9 2.4 2.7 7.1 1.0 2.1 2.1 1.8 2.0 2.8 0.2 0.2 0.2 0.2 0.2 0.1 0.2 2.7 1.5 1.8 1.5 2.3 2.0 5.2 5.5 3.0
804 1.03 2-nonanone 0.1 0.1 0.1 0.1 0.2 0.1 0.1 0.1 0.1 0.1 0.2 0.1 0.1 0.1 0.1 0.0 0.1 0.1 0.0 0.1 0.1 0.1 0.1 0.0 0.0 0.0 0.1
810 1.02 ketone isomer (m/z 43, 58, 71) 0.0 0.0 0.0 0.1 0.1 0.0 0.0 0.0 0.0 0.0 0.0 0.1 0.1 0.1 0.1 0.0 0.1 0.1 0.1 1.7 1.7 1.8 1.6 0.1 0.1 0.1 0.1
Miscellaneous
630 2.13 1-octen-3-ol 0.2 1.1 0.1 0.2 0.6 0.2 0.2 0.1 0.3 0.1 0.2 0.3 0.1 0.1 0.2 0.1 0.1 0.2 0.1 0.1 0.2 0.2 0.2 0.2 0.3 0.4 0.2
720 1.78 2-ethyl-1-hexanol 0.6 0.1 0.9 0.3 0.5 0.4 0.3 0.4 0.6 0.4 0.4 3.9 6.3 5.4 5.2 0.3 0.3 0.4 3.5 4.9 4.5 3.1 4.1 0.3 0.4 0.4 0.5
774 0.99 2-nonen-1-ol 0.1 0.1 0.1 0.1 0.2 0.0 0.1 0.3 0.1 0.1 0.2 0.1 0.1 0.1 0.1 0.1 0.1 0.1 0.1 0.1 0.1 0.1 0.1 0.1 0.2 0.2 0.2
780 1.86 1-octanol 0.1 0.1 0.1 0.1 0.2 0.1 0.1 0.1 0.2 0.1 0.2 0.1 0.1 0.1 0.1 0.1 0.1 0.1 0.1 0.1 0.1 0.1 0.1 0.1 0.3 0.2 0.2
912 0.97 2-decen-1-ol 0.2 0.1 0.3 0.3 0.3 0.1 0.1 0.2 0.1 0.2 0.1 0.3 0.3 0.3 0.3 0.3 0.3 0.3 0.4 0.3 0.3 0.3 0.3 0.4 0.5 0.5 0.2

Appendix
208
Table S1 continued
1tR a (s) 2tR
a (s) Compounds
S56 S57 S58 S59 S60 S61 S62
Hydrocarbons
Alkanes
138 0.48 hexane 0.7 0.7 1.2 0.4 0.3 0.4 0.6
210 0.52 2,4-dimethylhexane 0.2 0.8 0.5 0.1 0.1 0.1 1.0
252 0.54 octane 0.2 0.2 0.7 0.2 0.4 0.9 1.4
276 0.55 2,2,4-trimethylhexane 2.4 2.7 1.1 0.7 0.2 1.2 2.7
288 0.55 2,4-dimethylheptane 0.0 0.1 0.1 0.0 0.1 0.0 0.3
318 0.56 4-ethyl-2-methylhexane 0.7 0.9 0.5 0.3 0.2 0.4 0.8
366 0.58 alkane isomer (m/z 43, 57, 85) 1.8 1.6 2.3 1.7 1.3 1.5 0.8
468 0.56 nonane 2.9 3.5 2.1 4.4 2.7 2.9 2.7
504 0.55 alkane isomer (m/z 43, 57, 85) 3.6 4.2 0.5 0.8 0.6 1.1 0.9
516 0.55 2,4-dimethyloctane 0.1 0.1 0.0 0.0 0.0 0.0 0.0
528 0.56 3-ethyl-3-methylheptane 0.7 0.1 0.6 0.0 0.0 0.0 0.1
540 0.55 2,6-dimethyloctane 0.6 0.7 0.5 0.4 0.5 0.5 0.5
552 0.55 3-ethyl-2-methylheptane 0.2 0.4 0.2 0.2 0.2 0.2 0.3
558 0.55 alkane isomer (m/z 57, 43, 71) 0.3 0.3 0.1 0.3 0.0 0.3 0.3
564 0.55 alkane isomer (m/z 43, 57, 71) 0.1 0.1 0.1 0.0 0.1 0.0 0.1
576 0.56 4-ethyloctane 0.3 0.4 0.1 0.2 0.2 0.2 0.2
582 0.55 4-methylnonane 0.2 0.0 0.2 0.2 0.3 0.4 0.3
588 0.54 alkane isomer (m/z 57, 43, 85) 0.2 0.1 0.2 0.0 0.0 0.0 0.1
594 0.55 alkane isomer (m/z 57, 43, 71) 0.5 0.7 0.4 1.4 1.3 1.4 0.5
600 0.55 2-methylnonane 0.5 0.6 0.4 0.4 0.4 0.5 0.5
606 0.55 alkane isomer (m/z 57, 43, 41) 0.5 0.6 0.4 0.1 0.1 0.1 0.1
612 0.55 3-methylnonane 1.7 0.7 2.0 0.4 0.4 0.5 0.5
636 0.54 2,2,4,6,6-pentamethylheptane 5.6 1.1 0.6 1.0 0.6 2.1 1.0
660 0.56 decane 2.7 5.1 4.6 4.5 5.1 4.1 4.7
672 0.54 alkane isomer (m/z 57, 41, 71) 0.2 0.2 0.3 0.1 0.2 0.1 0.2
720 0.54 3,9-dimethylnonane 0.0 0.1 0.1 0.3 0.2 0.2 0.4
756 0.54 2-methyldecane 2.1 2.3 1.3 1.8 2.7 1.6 2.2
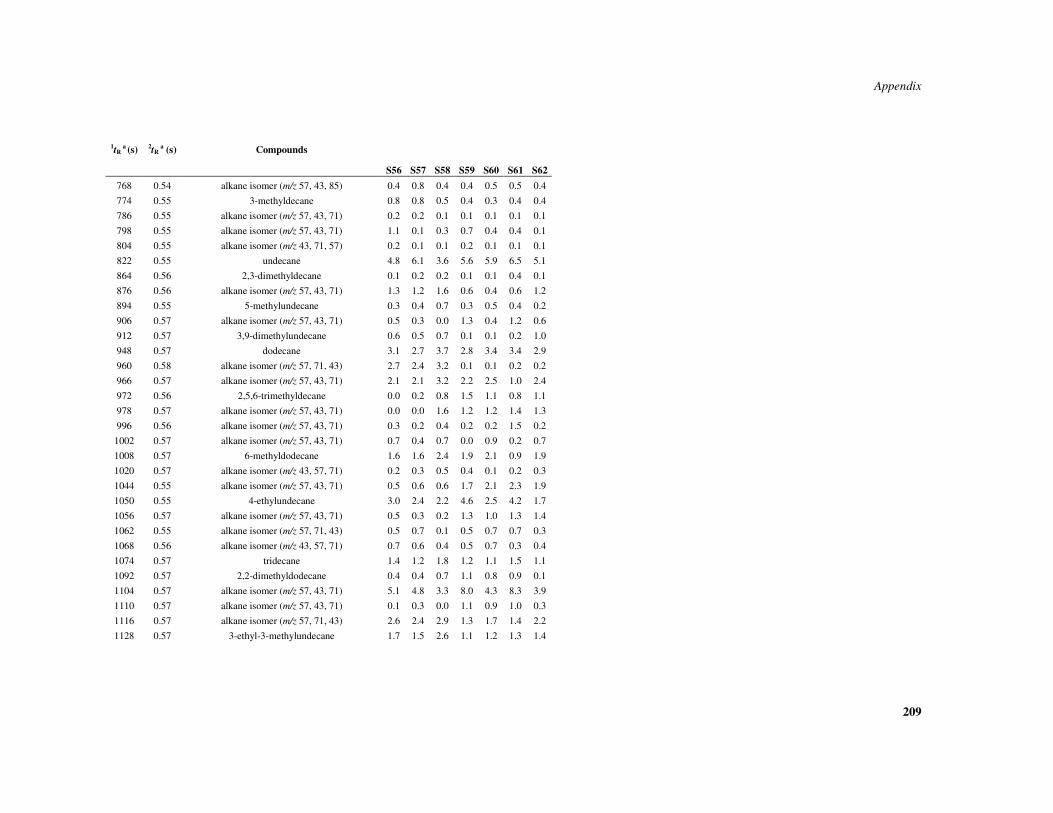
Appendix
209
1tR a (s) 2tR
a (s) Compounds
S56 S57 S58 S59 S60 S61 S62
768 0.54 alkane isomer (m/z 57, 43, 85) 0.4 0.8 0.4 0.4 0.5 0.5 0.4
774 0.55 3-methyldecane 0.8 0.8 0.5 0.4 0.3 0.4 0.4
786 0.55 alkane isomer (m/z 57, 43, 71) 0.2 0.2 0.1 0.1 0.1 0.1 0.1
798 0.55 alkane isomer (m/z 57, 43, 71) 1.1 0.1 0.3 0.7 0.4 0.4 0.1
804 0.55 alkane isomer (m/z 43, 71, 57) 0.2 0.1 0.1 0.2 0.1 0.1 0.1
822 0.55 undecane 4.8 6.1 3.6 5.6 5.9 6.5 5.1
864 0.56 2,3-dimethyldecane 0.1 0.2 0.2 0.1 0.1 0.4 0.1
876 0.56 alkane isomer (m/z 57, 43, 71) 1.3 1.2 1.6 0.6 0.4 0.6 1.2
894 0.55 5-methylundecane 0.3 0.4 0.7 0.3 0.5 0.4 0.2
906 0.57 alkane isomer (m/z 57, 43, 71) 0.5 0.3 0.0 1.3 0.4 1.2 0.6
912 0.57 3,9-dimethylundecane 0.6 0.5 0.7 0.1 0.1 0.2 1.0
948 0.57 dodecane 3.1 2.7 3.7 2.8 3.4 3.4 2.9
960 0.58 alkane isomer (m/z 57, 71, 43) 2.7 2.4 3.2 0.1 0.1 0.2 0.2
966 0.57 alkane isomer (m/z 57, 43, 71) 2.1 2.1 3.2 2.2 2.5 1.0 2.4
972 0.56 2,5,6-trimethyldecane 0.0 0.2 0.8 1.5 1.1 0.8 1.1
978 0.57 alkane isomer (m/z 57, 43, 71) 0.0 0.0 1.6 1.2 1.2 1.4 1.3
996 0.56 alkane isomer (m/z 57, 43, 71) 0.3 0.2 0.4 0.2 0.2 1.5 0.2
1002 0.57 alkane isomer (m/z 57, 43, 71) 0.7 0.4 0.7 0.0 0.9 0.2 0.7
1008 0.57 6-methyldodecane 1.6 1.6 2.4 1.9 2.1 0.9 1.9
1020 0.57 alkane isomer (m/z 43, 57, 71) 0.2 0.3 0.5 0.4 0.1 0.2 0.3
1044 0.55 alkane isomer (m/z 57, 43, 71) 0.5 0.6 0.6 1.7 2.1 2.3 1.9
1050 0.55 4-ethylundecane 3.0 2.4 2.2 4.6 2.5 4.2 1.7
1056 0.57 alkane isomer (m/z 57, 43, 71) 0.5 0.3 0.2 1.3 1.0 1.3 1.4
1062 0.55 alkane isomer (m/z 57, 71, 43) 0.5 0.7 0.1 0.5 0.7 0.7 0.3
1068 0.56 alkane isomer (m/z 43, 57, 71) 0.7 0.6 0.4 0.5 0.7 0.3 0.4
1074 0.57 tridecane 1.4 1.2 1.8 1.2 1.1 1.5 1.1
1092 0.57 2,2-dimethyldodecane 0.4 0.4 0.7 1.1 0.8 0.9 0.1
1104 0.57 alkane isomer (m/z 57, 43, 71) 5.1 4.8 3.3 8.0 4.3 8.3 3.9
1110 0.57 alkane isomer (m/z 57, 43, 71) 0.1 0.3 0.0 1.1 0.9 1.0 0.3
1116 0.57 alkane isomer (m/z 57, 71, 43) 2.6 2.4 2.9 1.3 1.7 1.4 2.2
1128 0.57 3-ethyl-3-methylundecane 1.7 1.5 2.6 1.1 1.2 1.3 1.4

Appendix
210
1tR a (s) 2tR
a (s) Compounds
S56 S57 S58 S59 S60 S61 S62
1152 0.60 2-methyltridecane 2.1 0.7 1.6 0.8 0.8 1.0 2.7
1158 0.59 alkane isomer (m/z 57, 43, 71) 0.6 0.6 1.0 1.3 1.0 1.3 0.9
1170 0.61 alkane isomer (m/z 57, 43, 71) 0.4 0.7 0.8 0.5 1.5 0.7 1.0
1188 0.61 tetradecane 3.0 2.6 4.3 3.7 3.2 3.4 2.9
1284 0.58 alkane isomer (m/z 57, 43, 85) 0.4 0.3 0.5 0.5 0.4 0.4 0.4
1290 0.58 6,6-diethyldodecane 1.8 1.2 2.9 1.6 2.1 1.9 1.4
1296 0.64 pentadecane 0.6 1.1 1.4 0.8 0.7 1.3 1.8
1302 0.59 5-ethyl-5-methyltridecane 0.5 0.3 0.5 0.7 0.5 0.6 0.4
1338 0.61 3-ethyl-3-methyltridecane 1.9 1.2 2.4 2.3 4.7 2.7 1.0
Cyclic
240 0.57 1,2,4-trimethylcyclopentane 0.1 0.2 0.1 0.1 0.1 0.1 0.1
534 0.60 propylcyclohexane 0.9 1.5 0.8 0.5 0.5 0.3 0.8
576 0.59 1,1,2,3-tetramethylcyclohexane 0.7 0.7 0.4 0.7 0.6 0.7 0.7
618 0.60 2-ethyl-1,3-dimethylcyclohexane 0.3 0.3 0.2 0.2 0.2 0.2 0.2
624 0.59 1-methyl-3-propylcyclohexane 0.2 0.3 0.2 0.2 0.2 0.2 0.2
630 0.58 1-methyl-3-(2-methylpropyl)cyclopentane 0.4 0.5 0.4 0.3 0.4 0.4 0.5
642 0.59 ethylpropylcyclopentane 0.1 0.3 0.1 0.2 0.3 0.2 0.2
654 0.59 1-methyl-2-propylcyclohexane 0.2 0.3 0.2 0.2 0.2 0.3 0.2
732 0.57 hexylcyclopentane 0.4 0.4 0.4 0.1 0.3 0.0 0.1
792 0.57 1,4-dimethylcycloctane 0.7 1.0 0.8 0.7 0.7 0.7 0.8
804 0.59 1-ethyl-2-propycylohexane 1.5 1.8 1.6 0.9 0.8 0.8 0.4
996 0.62 hexylcyclohexane 0.8 0.6 1.1 0.8 1.0 0.7 0.9
1068 0.65 1-hexyl-3-methylcyclohexane 1.5 1.5 2.4 2.2 2.4 3.1 2.2
1080 0.60 1-butyl-2-propylcyclopentane 0.4 0.3 0.3 0.8 0.5 0.2 0.5
Alkenes
252 0.60 3-octene 0.0 0.1 0.0 0.1 0.0 0.0 0.1
330 0.61 2,4-dimethyl-1-heptene 0.6 0.0 0.0 0.0 0.3 0.1 0.1
450 0.61 1-nonene 0.1 0.2 0.1 0.1 0.2 0.1 0.2
546 0.57 alkene isomer (m/z 55, 41, 69) 0.4 0.3 0.2 0.2 0.2 0.2 0.2
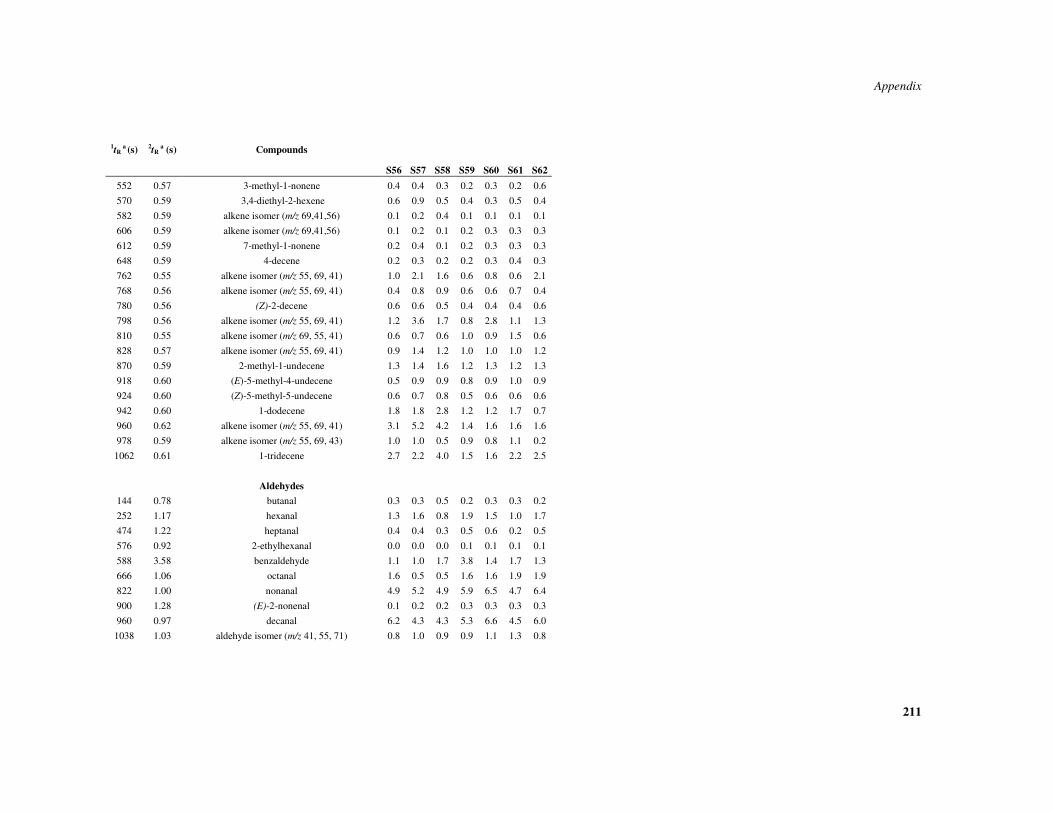
Appendix
211
1tR a (s) 2tR
a (s) Compounds
S56 S57 S58 S59 S60 S61 S62
552 0.57 3-methyl-1-nonene 0.4 0.4 0.3 0.2 0.3 0.2 0.6
570 0.59 3,4-diethyl-2-hexene 0.6 0.9 0.5 0.4 0.3 0.5 0.4
582 0.59 alkene isomer (m/z 69,41,56) 0.1 0.2 0.4 0.1 0.1 0.1 0.1
606 0.59 alkene isomer (m/z 69,41,56) 0.1 0.2 0.1 0.2 0.3 0.3 0.3
612 0.59 7-methyl-1-nonene 0.2 0.4 0.1 0.2 0.3 0.3 0.3
648 0.59 4-decene 0.2 0.3 0.2 0.2 0.3 0.4 0.3
762 0.55 alkene isomer (m/z 55, 69, 41) 1.0 2.1 1.6 0.6 0.8 0.6 2.1
768 0.56 alkene isomer (m/z 55, 69, 41) 0.4 0.8 0.9 0.6 0.6 0.7 0.4
780 0.56 (Z)-2-decene 0.6 0.6 0.5 0.4 0.4 0.4 0.6
798 0.56 alkene isomer (m/z 55, 69, 41) 1.2 3.6 1.7 0.8 2.8 1.1 1.3
810 0.55 alkene isomer (m/z 69, 55, 41) 0.6 0.7 0.6 1.0 0.9 1.5 0.6
828 0.57 alkene isomer (m/z 55, 69, 41) 0.9 1.4 1.2 1.0 1.0 1.0 1.2
870 0.59 2-methyl-1-undecene 1.3 1.4 1.6 1.2 1.3 1.2 1.3
918 0.60 (E)-5-methyl-4-undecene 0.5 0.9 0.9 0.8 0.9 1.0 0.9
924 0.60 (Z)-5-methyl-5-undecene 0.6 0.7 0.8 0.5 0.6 0.6 0.6
942 0.60 1-dodecene 1.8 1.8 2.8 1.2 1.2 1.7 0.7
960 0.62 alkene isomer (m/z 55, 69, 41) 3.1 5.2 4.2 1.4 1.6 1.6 1.6
978 0.59 alkene isomer (m/z 55, 69, 43) 1.0 1.0 0.5 0.9 0.8 1.1 0.2
1062 0.61 1-tridecene 2.7 2.2 4.0 1.5 1.6 2.2 2.5
Aldehydes
144 0.78 butanal 0.3 0.3 0.5 0.2 0.3 0.3 0.2
252 1.17 hexanal 1.3 1.6 0.8 1.9 1.5 1.0 1.7
474 1.22 heptanal 0.4 0.4 0.3 0.5 0.6 0.2 0.5
576 0.92 2-ethylhexanal 0.0 0.0 0.0 0.1 0.1 0.1 0.1
588 3.58 benzaldehyde 1.1 1.0 1.7 3.8 1.4 1.7 1.3
666 1.06 octanal 1.6 0.5 0.5 1.6 1.6 1.9 1.9
822 1.00 nonanal 4.9 5.2 4.9 5.9 6.5 4.7 6.4
900 1.28 (E)-2-nonenal 0.1 0.2 0.2 0.3 0.3 0.3 0.3
960 0.97 decanal 6.2 4.3 4.3 5.3 6.6 4.5 6.0
1038 1.03 aldehyde isomer (m/z 41, 55, 71) 0.8 1.0 0.9 0.9 1.1 1.3 0.8

Appendix
212
1tR a (s) 2tR
a (s) Compounds
S56 S57 S58 S59 S60 S61 S62
1086 1.02 undecanal 0.3 0.2 0.2 0.5 0.6 0.4 0.5
1200 1.09 dodecanal 0.3 0.3 0.3 0.7 0.7 0.6 0.7
Ketones
138 0.79 2-butanone 0.3 0.0 0.3 0.4 0.2 0.2 0.2
240 1.16 2-hexanone 0.0 0.0 0.0 0.0 0.0 0.0 0.0
438 1.19 3-heptanone 1.8 1.2 0.2 0.1 0.1 0.1 0.1
450 1.29 ketone isomer (m/z 43, 58, 71) 0.2 0.1 0.2 0.2 0.1 0.1 0.2
450 2.07 ciclohexanone 0.7 0.7 0.4 0.6 0.6 0.9 0.5
642 1.10 3-octanone 0.2 0.1 0.1 0.1 0.1 0.1 0.1
642 1.33 6-methyl-5-hepten-2-one 3.1 3.5 4.0 5.2 5.0 3.6 6.0
804 1.03 2-nonanone 0.1 0.1 0.1 0.2 0.1 0.1 0.0
810 1.02 ketone isomer (m/z 43, 58, 71) 0.1 0.1 0.1 0.0 0.0 0.0 0.1
Miscellaneous
630 2.13 1-octen-3-ol 0.6 0.2 0.2 0.6 0.3 0.2 0.2
720 1.78 2-ethyl-1-hexanol 0.5 0.5 0.4 4.9 5.9 4.4 6.3
774 0.99 2-nonen-1-ol 0.2 0.2 0.1 0.2 0.3 0.2 0.3
780 1.86 1-octanol 0.1 0.1 0.3 0.1 0.1 0.1 0.2
912 0.97 2-decen-1-ol 0.2 0.5 0.4 0.2 0.2 0.2 0.5
Top Related