


Languages
Pages
Legal


BlightStatus Demolitions
Data Over Time, Place, & Demographics
Data
• NOLA
• ACS
• Tiger Shapefiles

Resources/Tools
• RStudio
• ArcMap
• Tableau

Factor 1: Population
• Even Distribution

Factor 2:Income
• Negative Influence

Factor 3:Age (65+)

Factor 4:Age (<= 5)
• Evenly Distributed (can almost
make out a bell curve at 6%)

Factor 5:Race
* Mostly Negative Influence

NOLA CouncilDistricts
Source:
http://www.nolacitycouncil
.com/maps/maps.asp
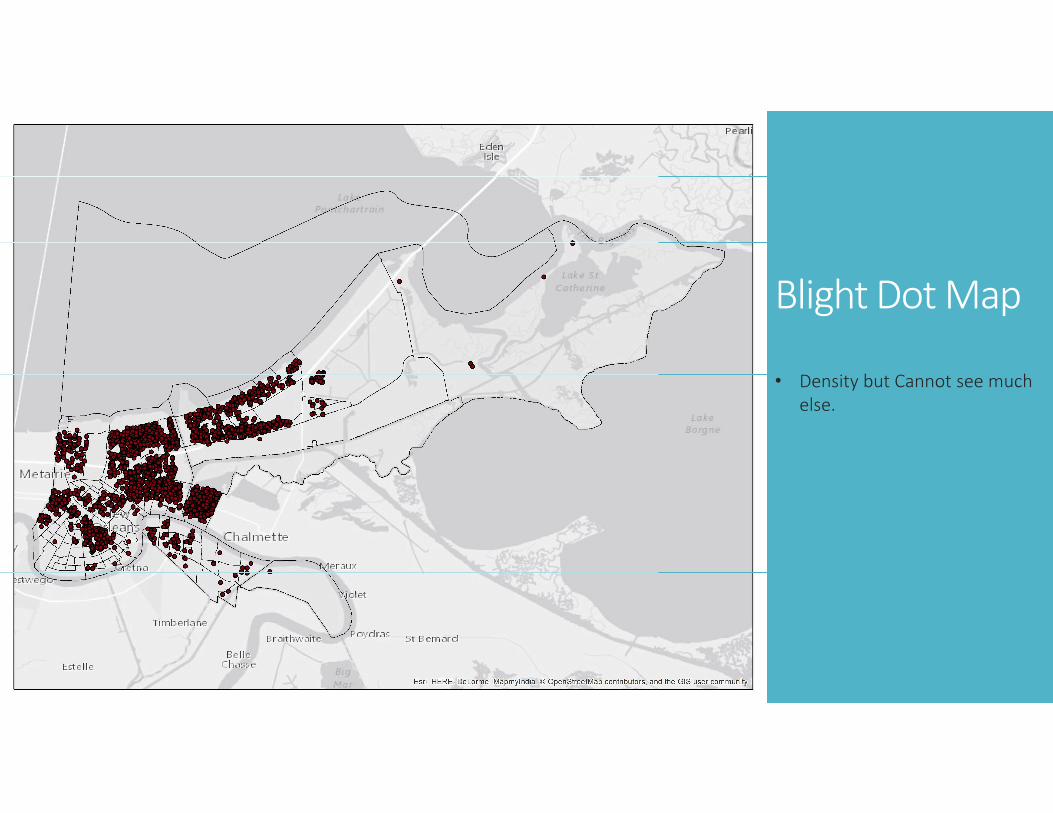
Blight Dot Map
• Density but Cannot see much
else.

Blight Choropleth
• Clearer Representation of
Blight Count
• Council Districts: C & D

Days to Demolish

Demolition Over Time

Program & Council Districts

Program Time Series

Questions?
Thank you
• Next Steps
Top Related