


Languages
Pages
Legal


Consumer Price Index September 2017 News Release
Inflationary Trend (Headline CPI)
September 2017 Inflation
2 October 2017 Highlights Inflation rate in September 2017 rose 0.86 percent (YoY)This was increased 3 months in a row from the higher in gasoline retail prices as OPEC group has limited their production causing the higher prices. Besides, on 16 September 2017, there was the adjustment in prices of cigarettes and liquor according to new tax structure as well as the increase in fresh vegetables from the flood in some agricultural areas.Those resulted in Inflation rate averaged 9 months went up 0.59 percent (AoA). For these reasons, Ministry of Commerce had adjusted the 2017 forecast at 0.4 -1.0 percent from 0.7-1.7 percent previously.
Division of Trade Information and Economic Indices. Trade Policy Strategy Office.
Countries Inflation rates(Ave.Jan-Aug.17)
Inflation Projection 2017 (as of Sep.60)
Inflation rate 0.4 – 1.0 (YoY)
GDPf 3.0 – 4.0 (YoY)
Dubai Oilf 45 – 55 USD/Barrel
Exchange Ratef
33.5 – 34.5 Baht/USD
0.00
1.00
2.00
3.00
4.00
5.00
Thail
and
Singa
pore
Taiw
an
Hong
Kon
g
Chin
a
Sout
h Ko
rea
Indi
a
Phill
ipin
es
Viet
nam
Mal
aysia
Indo
nesia
0.56 0.7 0.73 1.4 1.5
2.1 2.88 3.1
3.85 3.9 3.94
Price level of goods and services in September 2017 increased 0.58 percent (MoM).This was due to 0.70 percent increase in Food and Non-alcoholic beverages category (pork, eggs, fresh fruit and vegetables, prepared food) as well as 0.50 percent increase in Non-food and alcoholic beverages (electricity, cleaning supplies, gasoline, cigarettes, liquor).Price movement are as the following: Pork increased 0.24 percent during the Chinese Ghost festival Eggs increased 1.41 both hens eggs and duck eggs.Less supply due to
raining season Fresh fruits and vegetables increased 5.00 such as coriander Chinese
cabbage, celery, cauliflower, lettuce as it was rainy and those were perishable.For some fruits, prices were higher during Hungry Ghost festival such as oranges, rambutan, longon, longan, dragon fruit
Prepared food increased 0.06 percent such as ready made curry, breakfast, ordered food
Electricity increased 2.62 percent from the adjustment in Ft during September-December 2017 which was 8.87 satang higher per unit
Cleaning supplies increased 0.87 percent such as detergent, bathroom washing liquid, fabric starch and laundry liquid detergent
Gasoline increased 2.22 percent (Benzene 95, Diesel, Gasohol 91 95 E20 E85, NGV, LPG) following the reduction in production in world crude oil market
Tobacco and Alcoholic beverages increased 1.94 percent such as cigarettes and liquor from excise tax structure adjustment that was effective since 16 September 2017
Comparing with August 2016, prices went up 0.86 percent (YoY) from gasoline retail prices which followed the world crude oil market, electricity, seasoning and condiments, non-alcoholic beverages, prepared food, cigarettes and liquor mainly.
Inflation rate averaged Jan.-Sep.2017 comparing with the same period last year increased 0.59 percent (AoA)
Core Inflation increased 0.09 percent (MoM), increased 0.53 percent (YoY) and increased 0.54 percent (AoA)
0.86
101.22
-2.00
-1.00
0.00
1.00
2.00
3.00
98.0
98.5
99.0
99.5
100.0
100.5
101.0
101.5
2014
20
15
2016
jan
.16Fe
b.16
Mar
.16Ap
r.16
May
.16Ju
n.16
Jul.1
6Au
g.16
Sep.
16Oc
t.16
Nov.1
6De
c.16
jan.17
Feb.
17M
ar.17
Apr.1
7M
ay.17
Jun.1
7Ju
l.17
Aug.1
7Se
p.17
(%) YoY (2015=100)
-1.08
6.54
0.53
-0.86
Core Inflation Energy
Fresh food Headline CPI
กองสารสนเทศและดัชนีเศรษฐกิจการค้า
Consumer Price Index News Release-September 2017
Consumer Price Index September 2017
Consumer Price Index (CPI) is a measure of average change over time in the prices of consumer items—goods and services
that people buy for day-to-day living.CPI comprises of Food and Non-alcoholic beverages, Apparel and Footwear, Housing and Furnishing, Medical and Personal care, Transportation and Communication, Recreation and Education, Tobacco and alcoholic beverages divisions covering 422 items
Consumer Price Index of September 2017 can be described as the following:
1.Consumer Price Index of September 2017(base year 2015) was 101.22 (August 2017=100.64)
2.The change in CPI of September 2017 comparing with
2.1 Comparing with August 2017 (MoM) increased 0.58 percent.The percentage change in each category are shown
in Chart 1
2.2 Comparing with September 2016(YoY) increased 0.86 percent.The percentage change in each category are
shown in Chart 2
Division of Trade Information and Economic Indices. Trade Policy Strategy Office.
This was mainly due to Food and Non-alcoholic beverages category increased 0.70 percent (MoM) as the increase in vegetables and fruits 5.00 percent such as coriander chinese cabbage, celery, cauliflower,l ettuce resulting from the heavy and continuous raining.For fruits, prices increased during Ghost festival such as orange, rambutan, longon, longan, dragon fruit as well as higher prices of pork, eggs, rice, prepared food such as ready made curry, breakfast, ordered food.For Transportation and Communication category increased 0.72 percent from gasoline retail prices up 2.22 percent following the world crude oil prices(Benzene 95, diesel, gasohol 91 95 E20 E85, NGV, LPG), boat fares which were higher with diesel prices.Besides, there were higher prices in Housing and Furnishing category 0.51 percent from electricity(2.62 percent) according to Ft adjustment during September-December 2017 higher 8.87 Satang per Unit as well as excise tax adjustment of cigarettes and liquor resulting in 1.94 percent higher in Tobacco and Alcoholic beverages category
This was mainly due to Food and Non-alcoholic beverages category up 0.06 percent such as fresh vegetables, instant coconut milk, groung coconut, tamarinds, ready to drink coffee, cold coffee, food supplement. Housing and Furnishing category up 1.07 percent(house rent, electricity).Medical and Personal care category up 0.21 percent (drugs, out-patient medical care services, dental fee, blood test fee).Transportation and Communication category up 2.25 percent (gasoline such as Benzene 95, Gasohol 91 95 E20 E85 NGV LPG, car and motorcycle).Reading and Recreation category up 0.53 percent (travelling domestically and internationally).Tobacco and Alcoholic beverages category up 2.06 percent(cigarettes, beer, wine, liquor).Apparel and Footwear category up 0.11 percent (men clothes, women and children shoes)
Period Change Percent
2.1 August 2017 (MoM) INCREASE +0.58
2.2 September 2016 (YoY)
2.3 Average 9 months 2017(AoA) (Jan.-Sep. 2017) comparing with (Jan.-Sep.2016)
INCREASE INCREASE
+0.86
+0.59
0.58
0.70
0.00
0.51
0.06
0.72
-0.01
1.94
Headline CPI
Food and Non-alcoholic…
Apparel and Footwear
Housing and Furnishing
Medical and Personal…
Transport and…
Recreation and reading
Tobacco and alcoholic…
0.86
0.06
0.11
1.07
0.21
2.25
0.53
2.06
Headline CPI
Food and Non-…
Apparel and…
Housing and…
Medical and…
Transport and…
Recreation and…
Tobacco and…

กองสารสนเทศและดัชนีเศรษฐกิจการค้า
Consumer Price Index News Release-September 2017
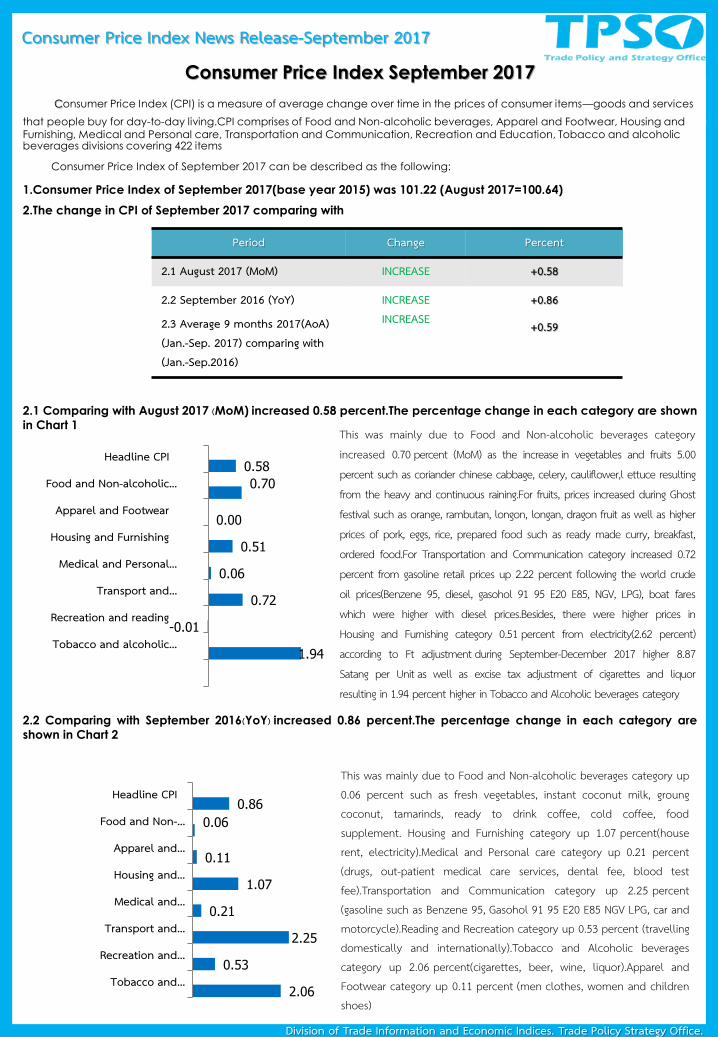
2.3 Averaged 9 months (Jan.-Sep.2017 comparing with Jan.-Sep.2016)(AoA) increased 0.59 percent.The percentage
change in each category are shown in Chart 3
3.Inflation forecasting(2017) Trade Policy Strategy Office(TPSO) projected that inflation will be between 0.4-1.0 from previously 0.7-1.7, under these assumptions:
4. ปัจจัยที่ส่งผลกระทบต่ออัตราเงินเฟ้อ
Division of Trade Information and Economic Indices.Trade Policy Strategy Office.
CPI section. Division of Trade Information and Economic Indices.Trade Policy Strategy Office.Ministry of Commerce. 563 Nonthaburi 1 Road, Muang, Nonthaburi Call 02 507 5847 Fax 02 507-5825 Call Center 1203
www.price.moc.go.th
Projection 1. Economic growth (%)
3.50
(3.0 – 4.0)
Continuous increase because of higher household expenditure and recovery in Export • Higher household expenditure following higher farmers income • Measure supporting low income earners through national welfare card
reducing expenditure • Export expansion from recovery in the world market • Tourists figure increase continuously • Government expenditure still the engine of growth
2. Dubai Oil Prices (USD / Barrel)
50.0
(45.0 - 55.0)
Demand for oil is higher according to the economic recovery • OPEC agreed on the limitation of oil production • Seasonal needs in winter and economic recovery • Political conflict in Middle East and natural disasters
3. Foreign exchange (Baht / USD)
34.0
(33.5 – 34.5)
Baht/USD tends to appreciate at the end of the year • Continuous capital flow from abroad • Current account surplus as foreign investors relieving worriness about
Thai political situation • Uncertainty of FED interest adjustment • Korean Peninsula situation
Supporting factors Risk factors
Household sector demand started to recover relevant to production and farmers income as well as measure supporting low income earners through national welfare card reducing expenditure.
Uncertainty of major trading partners trade policies influenced on export
Export expansion from recovery in the world market and tourist figure increased continuously
World oil prices showed the upward trend affecting retail gasoline prices in the country
Government expenditure in the fiscal year 2017 Uncertainty of FED interest adjustment and Korean Peninsula situation
This was mainly due to Transportation and Communication category increased 2.55 percent(gasoline such as Benzene 95, Diesel, Gasohol 91 95 E20 E85 NGV).Reading and Recreation category increased 0.57 percent(travelling expenses, educational expenses).Tobacco and Alcoholic beverages category increased 2.06 percent (cigarettes, wine, liquor).Medical and Personal care category increased 0.30 percent (drug, personal care items) While Housing and Furnishing decreased -0.15 percent(electricity, cleaning supplies)as well as Food and Non-alcoholic beverages decreased -0.07 percent (rice, vegetables, fruits and eggs)
0.59
-0.07
0.02
-0.15
0.30
2.55
0.57
2.06
Headline CPI
Food and Non-alcoholic…
Apparel and Footwear
Housing and Furnishing
Medical and Personal…
Transport and…
Recreation and reading
Tobacco and…

กองสารสนเทศและดัชนีเศรษฐกิจการค้า
Consumer Price Index News Release-September 2017
5. Table of CPI and Percentage change
* CPI deducting fresh food and energy Download news release in infographic at :
(2015 = 100)
CPI section. Division of Trade Information and Economic Indices.Trade Policy Strategy Office.Ministry of Commerce. 563 Nonthaburi 1 Road, Muang, Nonthaburi Call 02 507 5847 Fax 02 507-5825 Call Center 1203
www.price.moc.go.th
Weight September 2017 August 2017
Items Sep.17 Index %Change Index %Change
Sep.17 Sep.16 M/M Y/Y A/A Aug.17 M/M Y/Y A/A
Headline CPI 100.00 101.22 100.36 0.58 0.86 0.59 100.64 0.11 0.32 0.56
Food and Non-alcoholic beverages 36.41 102.13 102.07 0.70 0.06 -0.07 101.42 -0.24 -0.92 -0.08
Rice, flour and cereal products 2.90 97.12 99.57 0.25 -2.46 -2.02 96.88 -0.27 -2.79 -1.97
Meat, poultry and fish 6.59 101.85 102.37 0.07 -0.51 0.03 101.78 -0.02 -0.73 0.10
Eggs and diary products 1.56 100.64 103.64 0.61 -2.89 -1.88 100.03 -0.08 -3.12 -1.74
Vegetables and Fruits 4.70 106.03 106.49 5.00 -0.43 -3.50 100.98 -2.35 -7.34 -3.88
- Fresh vegetables 1.88 105.23 100.63 5.88 4.57 -7.58 99.39 -2.74 -4.70 -9.00
- Fresh fruits 2.39 104.69 109.65 4.98 -4.52 -2.35 99.72 -2.46 -10.80 -2.07
Seasoning and Condiments 1.71 101.38 101.27 -0.12 0.11 1.47 101.50 -0.34 0.63 1.66
Non-alcoholic beverages 1.72 101.12 100.53 -0.01 0.59 0.95 101.13 -0.09 0.60 0.99
Prepared food at home 8.71 102.60 101.34 0.11 1.24 1.09 102.49 0.38 1.13 1.07
Food away from home 8.52 102.34 101.30 0.01 1.03 1.20 102.33 0.05 1.08 1.23
Non-food and beverages 63.59 100.72 99.41 0.50 1.32 0.98 100.22 0.32 1.03 0.93
Apparel and Footwear 2.86 100.42 100.31 0.00 0.11 0.02 100.42 0.12 -0.09 0.01
Housing and Furnishing 22.91 99.69 98.63 0.51 1.07 -0.15 99.18 0.00 0.57 -0.30
Medical and Personal care 6.20 101.11 100.90 0.06 0.21 0.30 101.05 -0.12 0.22 0.31
Transport and Communication 23.91 100.69 98.47 0.72 2.25 2.55 99.97 0.86 2.10 2.59
- Public transport services 2.04 99.95 99.80 0.00 0.15 0.10 99.95 0.02 0.15 0.09
- Motor Fuel 7.55 101.42 93.78 2.22 8.15 10.24 99.22 2.64 8.30 10.52
- Communication 4.25 99.94 99.97 0.01 -0.03 -0.04 99.93 -0.01 -0.04 -0.04
Recreation and reading 6.16 101.54 101.00 -0.01 0.53 0.57 101.55 0.01 0.61 0.58
Tobacco and alcoholic beverages 1.55 115.86 113.52 1.94 2.06 2.06 113.65 0.01 0.11 2.06
Core Inflation 72.75 101.44 100.91 0.09 0.53 0.54 101.35 0.05 0.46 0.54
Fresh food and energy 27.25 100.60 98.85 1.90 1.77 0.76 98.72 0.26 -0.08 0.64
- Fresh food 15.75 101.93 103.04 1.58 -1.08 -1.57 100.34 -0.76 -3.29 -1.63
- Energy 11.50 98.37 92.33 2.35 6.54 4.72 96.11 1.73 5.51 4.49
กองสารสนเทศและดัชนีเศรษฐกิจการค้า
Consumer Price Index News Release-September 2017
A Brief Explanation of Consumer Price Index (CPI) and Inflation
Division of Trade Information and Economic Indices, Trade Policy Strategy Office, Ministry of Commerce is
the organisation compiling and disseminating Consumer Price Index (CPI) monthly. The objectives is to measure
cost of living of people as well as movement of prices in the form of “Inflation”. CPI has been developed continuously and has rebasing every 4-5 years.
Recently, Committee of Indices compiling and developing which comprises of the senior advisors and
experts from both public and private sectors had concensus on rebasing CPI from 2011 to 2015 referring Economic
and Social of Households Survey of National Statistics Office to re-structure the expenditure in the basket of goods so that index will be up to date relevant to consumption pattern as well as comply with the international standard. Consumer Price Index base year 2015 covers 422 items(base year 2011 covered 450 items) including 7
categories of goods and services those are essential to the living of people : 1) Food and Non-alcoholic beverages
category 2)Apparel and Footwear category 3) Housing and Furnishing category 5) Transportation and
Communication category 6) Recreation and Reading category 7) Tobacco and alcoholic beverage.CPI is
computed by comparing prices of goods over time to the base year which is set as 100.However, households under
this calculation are represented by household in metropolitan area with 1-5 people and 12,000-62,000 Baht/month in
Bangkok and suburban area and all 4 regions of Thailand in 43 provinces. 1
Headline Inflation is the measure of average change over time in the prices of consumer items-good and
services that people buy for day-to-day living (base year: 2015)
Core Inflation is the headline CPI deducted fresh food prices(which are fluctuated and seasonal) and
energy prices(which are not in control of Monetary Policy). The items left are subjected to market mechanism and can be provided the fundamental inflation picture of Thai Economy
Core Inflation rate is the percent change in Consumer Price Index which calculate from headline CPI
deducted by fresh food and energy prices.
In conclusion, CPI is to measure inflation of the economy which is one of the economic indicators.To
analyze,we will take all the factors those affect the prices into consideration such as the factors those has influence on cost of production i.e.gasoline cooking
-------------------------------------------------------------------------
1 43 provinces in the index computation are
Bangkok and suburban 1.Bangkok 2.Nonthaburi 3.Pathumthani 4.Samutprakan
Central region 5.Ayutthaya 6. Lopburi 7.Singhburi 8.Chonburi 9.Rayong 10.Chanburi 11.Prajeenburi
12.Ratchaburi 13.Supunburi 14.Petchburi 15.Prajuabkhirikun
Northern region 16.Nakhonsawan 17.Taak 18.Prae 19.Chiengmai 20.Chiengrai 21. Uttraladit 22.Pitsanulok
23.Petchaboon 24.Naan
North eastern region 25.Nakhonratchasima 26.Khonkaen 27.Surin 28.Ubonratchathani 29.Nongkai 30.Srisaket
31.Mookdahan 32.Udonthani 33.Roi-ed 34.Nakhonpanom
Southern region 35.Surathani 36.Nakhonsithannarat 37.Trang 38.Songkhla 39. Yala 40.Phuket 41.Krabi 42.Narathiwat
43.Ranong
----------------------------------------------------------
CPI section. Division of Trade Information and Economic Indices.Trade Policy Strategy Office.Ministry of Commerce. 563 Nonthaburi 1 Road, Muang, Nonthaburi Call 02 507 5847 Fax 02 507-5825 Call Center 1203
www.price.moc.go.th
Top Related