


Languages
Pages
Legal


NEWMARK GROUP, INC.General Investor Presentation
September 2018

2DISCLAIMER
Discussion of Forward-Looking Statements by Newmark Group, Inc. and BGC Partners, Inc.
Statements in this document regarding BGC and Newmark that are not historical facts are “forward-looking statements” that involve risks and uncertainties, which could
cause actual results to differ from those contained in the forward-looking statements. Except as required by law, BGC and Newmark undertake no obligation to update any
forward-looking statements. For a discussion of additional risks and uncertainties, which could cause actual results to differ from those contained in the forward-looking
statements, see Newmark’s and BGC’s Securities and Exchange Commission filings, including, but not limited to, the risk factors set forth in these filings and any updates to
such risk factors contained in subsequent Forms 10-K, Forms 10-Q or Forms 8-K.
Notes Regarding Financial Tables and Metrics
Excel files with the Company’s most recent quarterly financial results and metrics from the current period are accessible in the financial results press release at the “Investor
Relations” section of http://www.ngkf.com. They are also available directly at http://ir.ngkf.com/investors/news-releases/financial-and-corporate-releases/default.aspx.
Other Items
Newmark Group, Inc. (NASDAQ: NMRK) (“Newmark” or “the Company”) generally operates as “Newmark Knight Frank”, “Newmark”, “NKF”, or derivations of these names.
The discussion of financial results reflects only those businesses owned by the Company and does not include the results for Knight Frank or for the independently-owned
offices that use some variation of the Newmark name in their branding or marketing. Berkeley Point Financial LLC, and its wholly owned subsidiary Berkeley Point Capital
LLC may together be referred to as “Berkeley Point” or “BPF”. For the purposes of this document, the terms “producer” and “front office employee” are synonymous. The
average revenue per producer figures are based only on “leasing and other commissions”, “capital markets”, and “Gains from mortgage banking activities/origination, net”
revenues and corresponding producers. The productivity figures exclude both revenues and staff in “management services, servicing fees and other.” Headcount numbers
used in this calculation are based on a period average. Throughout this document, certain percentage changes are described as “NMF” or “not meaningful figure”.
Newmark is a publicly traded subsidiary of BGC Partners, Inc. (NASDAQ: BGCP) (“BGC Partners”, or “BGC”). BGC is the largest and controlling shareholder of Newmark.
As a result, BGC consolidates the results of Newmark and reports them as its Real Estate Services segment. These segment results may differ from those of Newmark as a
stand-alone company with respect to revenues, pre-tax GAAP income and pre-tax Adjusted Earnings. These differences are reconciled in the tables in BGC’s first quarter
2018 financial results press release titled “Reconciliation of BGC Real Estate Segment to Newmark Group, Inc. Stand-Alone for Revenues”, “Reconciliation of BGC Real
Estate Segment to Newmark Group, Inc. Stand-Alone for GAAP Income (Loss) From Operations before Income Taxes” and “Reconciliation of BGC Real Estate Segment to
Newmark Group, Inc. Stand-Alone for Pre-Tax Adjusted Earnings”.
On June 28, 2013, BGC sold eSpeed to Nasdaq, Inc. (“Nasdaq”). The purchase consideration consisted of $750 million in cash paid upon closing, plus an expected
payment of up to 14.9 million shares of Nasdaq common stock to be paid ratably over 15 years beginning in 2013, assuming that Nasdaq, as a whole, generates at least
$25 million in gross revenues each of these years. In connection with the separation and prior to the completion of Newmark’s IPO, BGC transferred to Newmark the right
to receive the remainder of the Nasdaq payments. Newmark recognized the receipt of the first of these payments in the quarter ended September 30, 2017, and expects to
recognize the receipt of shares ratably in the third quarter of each of the next ten fiscal years. Nasdaq “Payments” may be used interchangeably with the Nasdaq share
“earn-out”. The future value of Nasdaq shares discussed in this document are based on the closing price as of August 1, 2018. On June 20, 2018, Newmark announced
the monetization of approximately two million Nasdaq shares. For further information, see the June 6, 2018 press release titled “Newmark And BGC Partners Announce
Monetization of Approximately Two Million Nasdaq Shares and Update Their Outlooks”, and the related filings made on the same date on Form 8-K.
On September 8, 2017, BGC acquired Berkeley Point Financial LLC, including its wholly owned subsidiary Berkeley Point Capital LLC. Berkeley Point is now a subsidiary of
Newmark. Newmark’s financial results have been recast to include the results of Berkeley Point for all periods discussed in this document because this transaction involved
reorganizations of entities under common control. Unless otherwise noted, all year-on-year comparisons in this document reflect the recast results.
Throughout this document the term “GSE” may refer to a government-sponsored enterprise such as Fannie Mae or Freddie Mac, “FHA” is used to refer to the Federal
Housing Administration. In addition “TTM” is used to describe certain “trailing twelve month” periods.

3DISCLAIMER (CONTINUED)
Certain reclassifications may have been made to previously reported amounts to conform to the current presentation and to show results on a consistent basis across
periods. Any such changes would have had no impact on consolidated revenues or earnings for GAAP and would either leave essentially unchanged or increase pre- and
post-tax Adjusted Earnings for the prior periods, all else being equal. Certain numbers in the tables throughout this document may not sum due to rounding. Rounding may
have also impacted the presentation of certain and year-on-year percentage changes.
Newmark, Grubb & Ellis, ARA, Computerized Facility Integration, Landauer, Excess Space Retail Services, Inc., and Berkeley Point are trademarks/service marks, and/or
registered trademarks/service marks and/or service marks of Newmark Group, Inc. and/or its affiliates. Knight Frank is a service mark of Knight Frank (Nominees) Limited.
Adjusted Earnings and Adjusted EBITDA
This presentation should be read in conjunction with Newmark’s most recent financial results press releases. Unless otherwise stated, throughout this document Newmark
refers to its income statement results only on an Adjusted Earnings basis. Newmark may also refer to “Adjusted EBITDA”. For a complete and revised description of these
non-GAAP terms and how, when, and why management uses them, see the “Adjusted Earnings Defined“ and “Adjusted EBITDA Defined” pages of this presentation. For
both this description and reconciliations to GAAP, as well as for more information regarding GAAP results, see Newmark’s most recent financial results press release,
including the sections called “Adjusted Earnings Defined”, “Differences Between Consolidated Results for Adjusted Earnings and GAAP”, “Reconciliation of GAAP Income
(Loss) to Adjusted Earnings”, Adjusted EBITDA Defined”, and “Reconciliation of GAAP Income (Loss) to Adjusted EBITDA”. These reconciliations can be found in the
“Appendix” section of this presentation. Below is a summary of certain GAAP and non-GAAP results for Newmark.
A discussion of GAAP, Adjusted Earnings and Adjusted EBITDA and reconciliations of these items, as well as liquidity, to GAAP results are found later in this document,
incorporated by reference, and also in our most recent financial results press release and/or are available at http://ir.ngkf.com/investors/investors-home/default.aspx
Liquidity Defined
Newmark may also use a non-GAAP measure called “liquidity”. The Company considers liquidity to be comprised of the sum of cash and cash equivalents plus marketable
securities that have not been financed, reverse repurchase agreements, and securities owned, less securities loaned and repurchase agreements. The Company considers
this an important metric for determining the amount of cash that is available or that could be readily available to the Company on short notice.

4
Full-service CRE firm with high-producing professionals
Highest revenue growth in the U.S. CRE services sector
Strong year-over-year Adjusted Earnings and Adjusted
EBITDA growth
Proven ability to profitably attract and retain talent
Strong track record of accretive acquisitions
Attractive industry dynamics
Multiple avenues for future growth and margin improvement
Intermediary-oriented, low risk business model
INVESTMENT HIGHLIGHTS

BUSINESS OVERVIEW

6
BROAD SERVICE OFFERING AND HIGHEST GROWTH IN US CRE SECTOR
Business Line CBRE JLL C&W Colliers HFFWalker &
Dunlop
Marcus &
Millichap
Leasing ✔ ✔ ✔ ✔ ✔
Investment Sales &
Mortgage Brokerage✔ ✔ ✔ ✔ ✔ ✔ ✔ ✔
Multifamily lending
(GSE and FHA) ✔ ✔ ✔ ✔ ✔
Servicing ✔ ✔ ✔ ✔ ✔
Property & Facility
Management✔ ✔ ✔ ✔ ✔
Advisory & Consulting ✔ ✔ ✔ ✔ ✔ ✔
Appraisal ✔ ✔ ✔ ✔ ✔
Property &
Development Services✔ ✔ ✔ ✔ ✔
Non-Agency Lending ✔
Investment Management ✔ ✔ ✔ ✔
Historical Revenue
CAGR2 38% 16% 14% 13% 15% 16% 29% 17%
Source: Public filings
1. Includes Newmark’s 27% interest in the commercial real estate-related limited partnership between the Company and Cantor
2. Newmark’s unaudited 2011 revenues are based on full year 2011 revenues for Newmark & Co. Except for C&W, revenue CAGRs are based on global revenues reported for FY 2011 and
FY 2017. C&W’s revenue CAGR is based on gross revenue for FY 2017 and gross revenue for 2011 as reported by UGL Limited for DTZ and by EXOR S.p.A. for C&W Group
Note: The peers are CBRE Group, Inc. (CBRE), Jones Lang LaSalle Incorporated (JLL), Cushman & Wakefield plc (C&W), Colliers International Group Inc. (Colliers), HFF, Inc. (HFF),
Walker & Dunlop, Inc. (Walker & Dunlop), and Marcus & Millichap, Inc. (Marcus & Millichap). All revenues figures on this page are based on those reported prior to any restatements related
to ASC 606
1

7
272.3 337.5
172.6203.1
118.880.8
174.0
275.7
YTD 2017 YTD 2018
YTD 2018 REVENUE PERFORMANCE
Leasing and Other
Commissions
38%
YTD 2018 Revenue Growth (US$ millions)
Capital markets
Leasing and other
commissions
Gains from mortgage banking
activities/origination, net
Management services,
servicing fees and other737.7
897.1
YTD 2018 Revenue Composition
Highlights
Drivers
Management,
Servicing Fees
and Other
Revenues
31%Investment Sales,
Mortgage
Brokerage, and
Agency Lending3
31%
Capital
Markets3
22%
Gains from Mortgage
Banking Activities/
Origination, Net3
9%
Leasing and Other
Commissions
38%
› YTD 2018 management services, servicing fees and other increased 58% YoY1
› YTD 2018 leasing and other commissions revenue increased 24% YoY
› YTD 2018 capital markets revenue increased 18% YoY
› Over 85% of revenue growth was organic
› Strong revenue growth from leasing, Valuation & Advisory, and Global Corporate Services
› Investment sales outpacing comparable industry metrics
› Commercial real estate fundamentals remain strong
1. Excluding additional pass-through revenue related to ASC 606, these revenues would have increased 34%
2. Sources: CoStar and/or Newmark Research
3. Investment sales, mortgage brokerage, and Agency lending revenues represents two separate line items: 1) real estate capital markets (which consists of
investment sales and mortgage brokerage), and 2) Gains from mortgage banking activities/origination, net (referred to here as “agency lending”)

8
PARTNERSHIP STRUCTURE CREATES COMPETITIVE ADVANTAGE
Virtually all Newmark producers are partners• Partners sign long-term contracts; more than 20% of fully diluted share
count
Up front consideration for hiring and acquisitions
includes partnership units
• Loans incentivize partners to stay for the full term
• Partners have nonexchangeable equity forfeited if they leave; helps
reduce compensation ratio over time
• Lowers corporate non-GAAP tax rate
95% retention rate1
1. Based on the number of partners whose contracts were up for renewal and who were pursued for renewal in 2015, 2016, and 2017

9
SUCCESSFUL TRACK RECORD OF ACCRETIVE ACQUISITIONS
Note: Certain of these acquisitions involved only the purchase of assets
1. Included 17 transactions not all of which were in 2014 with some completed after that year
5 Acquisitions
• The CRE Group
• Rudesill-Pera
Multifamily
• Continental Realty
• Newmark Grubb
Mexico City
• Walchle Lear
Grubb & Ellis
• Cornish & Carey
Commercial
• Apartment Realty
Advisors (ARA)1
18 Acquisitions
2 Acquisitions
• Frederick Ross
• Smith Mack
4 Acquisitions
• Excess Space
• Computerized Facility
Integration
• Cincinnati Commercial
Real Estate
• Steffner Commercial
Real Estate d/b/a
Newmark Grubb
Memphis
9 Acquisitions
• Berkeley Point
Financial
• Regency Capital
Partners
• Spring11
• 6 former Integra Realty
Resources officesNewmark
Knight Frank
20132011 2012 2014 2015 2016 2017 2018
6 Acquisitions
• 4 former Integra
Realty Resources
offices
• RKF
• Jackson Cooksey
› In addition to growth through acquisition, over 40% of Newmark’s growth since 2011 has been organic

HIGHLIGHTS OF FINANCIAL
PERFORMANCE

11
ADJUSTED EARNINGS & ADJUSTED EBITDA PERFORMANCE
Pre-tax Adjusted Earnings1Adjusted EBITDA
before allocations to units1
(US$ millions) (US$ millions)
217
368
94
139
$0
$50
$100
$150
$200
$250
$300
$350
$400
TTM 2Q17 TTM 2Q18 YTD 2017 YTD 2018
17.3% 24.7% 16.0% 19.9%
$259
$434
$118
$178
$0
$50
$100
$150
$200
$250
$300
$350
$400
$450
TTM 2Q17 TTM 2Q18 YTD 2017 YTD 2018
1. TTM 2Q18 includes other income related to the Nasdaq shares of $79.3 million. Excluding this income, TTM 2Q18 pre-tax Adjusted Earnings and
TTM 2Q18 Adjusted EBITDA would have been up approximately 33% and 37%, while TTM 2Q18 pre-tax Adjusted Earnings margin and TTM
2Q18 Adjusted EBITDA margin would have been 16.5% and 20.2%, respectively
3
Margin14.5% 21.0% 12.7% 15.5%Margin

12
$230
$1,756
FY 2011 FY 2012 FY 2013 FY 2014 FY 2015 FY 2016 FY 2017 TTM 2Q18
Newmark Revenues1
1. Based on revenues reported for BGC’s Real Estate Services segment for FY 2012, FY 2013, and FY 2014. FY 2011 revenues are based on unaudited full
year 2011 revenues for Newmark & Co. Includes Berkeley Point revenues for FY 2014 onwards
LONG-TERM REVENUE AND PRODUCTIVITY GROWTH
(US$ millions)
$474 $622 $707$680$467Revenue /
Producer
($’000)
› Revenue has increased at a CAGR of 37% since FY 2011
› Revenue per producer increased at a CAGR of 11% from FY 2012 to TTM 2Q18
$806
74% growth
from 2012
$826

13
Property & Facilities Mgmt.
Leasing(agency)
Loan Servicing
Global Corporate Services
Mortgage Brokerage
Nasdaq IncomeMortgage
Banking
Investment Sales
ValuationLeasing
(tenant rep)
23%44%
33%
DIVERSE AND RECURRING INCOME STREAMS
Balanced mix of revenue and
other income with
approximately 67% derived
from recurring and highly
visible sources in TTM 2Q 2018
Ten largest customers
represent less than 6% of total
revenue1
Note: Chart based on revenue and other income related to the Nasdaq earn-out for the TTM ended June 30, 2018
1. For the TTM ended June 30, 2018

14STRONG CREDIT PROFILE
1. Callable at par beginning June 26, 2017. Newmark has announced that this debt will be replaced with $112.5 million in notional debt at 6.5% on 9/5/2018
2. This calculation is based on Newmark’s Adjusted EBITDA before allocations to units
3. Includes “redeemable partnership interests”, “noncontrolling interests” and “total stockholders’ equity”
Note: This table does not include short-term borrowings, of which there was $271 million of debt related to Newmark’s credit facility with BGC as of June 30,
2018. Restricted cash is also excluded from this table
› Newmark’s balance sheet does not include the over $725 million of Nasdaq shares
(at August 1, 2018 closing price) expected to be received in the future
($ in '000s)
Newmark Group, Inc. 6/30/2018
Cash and Cash Equivalents $60,274
Newmark Group, Inc. Interest Rate Maturity 6/30/2018
Converted Term Loan 4.307% 9/8/2019 $247,150
Long-term debt payable to related parties1
8.125% 6/26/2042 112,500
Long-term debt payable to related parties 5.375% 12/9/2019 300,000
Total Long-term Debt $659,650
6/30/2018
Adjusted EBITDA before allocations to units 433,581$
Leverage Ratio: Total Long-term Debt / Adjusted EBITDA2
1.5x
Net Leverage Ratio: Net Long-term Debt / Adjusted EBITDA21.4x
Total equity3
778,279
Newmark Group, Inc. (Adj. EBITDA and Ratios are TTM 2Q 2018)

GROWTH OPPORTUNITIES

16GLOBAL CRE SERVICES MARKET OPPORTUNITY
$220+ BnTotal Revenue
Opportunity
(FY 2017)
$28Bn(<15%)
$1.6Bn(<1%)
1. Represents actual revenues earned by global commercial real estate services firms as well as potential revenues from outsourcing opportunities
Sources: IBIS World, Bloomberg, public filings, CoStar and Newmark Knight Frank research. Top 6 CRE Brokerage and Services Companies as measured by FY17
global revenue prior to any restatements related to ASC 606: Newmark, CBRE (fee-revenue), JLL (fee-revenue), Colliers, Savills, Cushman & Wakefield (fee-revenue)
Note: Chart has not been shown to scale
1
Large and Highly
Fragmented Market
The Top 6 CRE Brokerage
& Services Firms
2017 Market Share <15%
MASSIVE POTENTIAL GLOBAL MARKET FOR BROKERAGE AND SERVICES
$220B+Total Revenue Opportunity1
$27B(<15%)
$1.6B(<1%)
TOP 6 COMPANIES

17
NEWMARK’S CAPITAL MARKETS
2017 US MARKET SHARE COMPARED TO PEERS
Cro
ss S
ellin
g
Cro
ss S
ellin
g
SIGNIFICANT RUNWAY TO CONTINUE INCREASING MARKET SHARE (IN NOTIONAL DOLLAR VOLUMES)
Business Line
Newmark’s
Rank1
Newmark’s
US Market
Share2
2017
US Market
Size Estimate
Average US
Market Share
of Newmark’s
Largest Peers3
Growth
Opportunity
Overall
Investment Sales5 5.3% $487.2B 8.2% 54.7%
Overall Mortgage
Brokerage7 3.8% $284.3B 13.0% 242.1%
Fannie Mae
Origination5 6.4% $61.2B 9.9% 54.7%
Freddie Mac
Origination5 6.8% $68.7B 11.5% 69.1%
1. Investment sales rank is based on RCA. Mortgage brokerage rank based on how Newmark would have ranked if it had been included in MBA’s 2017 annual origination ranking.
Newmark did not submit to be included in MBA’s 2017 annual origination rankings. Fannie Mae and Freddie Mac rankings are from the agencies
2. Market share estimate for investment sales is based on Newmark’s 2017 US investment sales volume as reported by RCA rather than Newmark’s actual volumes on the prior page.
This is the same source for the market share of Newmark’s peers and the overall market size estimate
3. Based on top 5 peers for each respective business line. Each peer set has a different composition, and may include privately held companies
Source: Real Capital Analytics (“RCA”), Newmark Knight Frank Research and Mortgage Bankers Association (“MBA”)
› If Newmark grows to be in line with the average of its top 5 peers in each business line, its combined
investment sales, mortgage brokerage and origination revenues would exceed $1.0 billion, all else equal

18REVENUE GROWTH OPPORTUNITY IN AGENCY LEASING
Representation of landlords:
› Represents 37% of Newmark leasing revenues over TTM 2Q18
› Significant opportunity for future growth
166
300
0
50
100
150
200
250
300
350
FY 2013 FY 2017
OFFICE AGENCY LEASING ASSIGNMENTS (SQUARE FEET)
Mill
ion
Sq
ua
re F
ee
t

19
REVENUE GROWTH OPPORTUNITIES IN MANAGEMENT SERVICES AND GLOBAL CORPORATE SERVICES
Property and Facilities Management: Leverage growth in agency leasing and capital markets
• Currently manage nearly 125 MSF; approximately $175 million in annual revenues1
• Top 4 competitors manage on average 3 BSF2
• We expect to more than double the size of this businesses by leveraging real estate capital markets
relationships and other opportunities over time
Valuation & Appraisal: Continue growth through acquisitions and new hires
• Headcount has increased by 270 professionals to a total of 300 professionals
YOY as of March 31, 2018
• Over time we expect to be one of the largest CRE valuation & appraisal businesses in the US with
over $150 million in annual revenue as compared to approximately $10 million in 2017
Global Corporate Services: Leverage consulting and technology to expand client relationships
• Synergies between consulting, technology, tenant rep leasing for large occupiers of real estate
• Opportunity to increase revenues by hundreds of millions of dollars from large corporate occupiers
1. Square feet managed is as of March 31, 2018. Annual revenues based on revenues for the trailing twelve months ended March 31, 2018
2. Top 4 competitors are CBRE, JLL, Colliers, and Cushman & Wakefield. Source for their square feet managed is National Real Estate
Investor
3. Represents additional US revenue opportunity across all business lines Newmark currently operates in, including leasing, capital
markets, GSE origination, property and facilities management, Valuation & Appraisal, and Global Corporate Services
US market opportunity across all business lines adds up to > $1.1 billion in revenues3
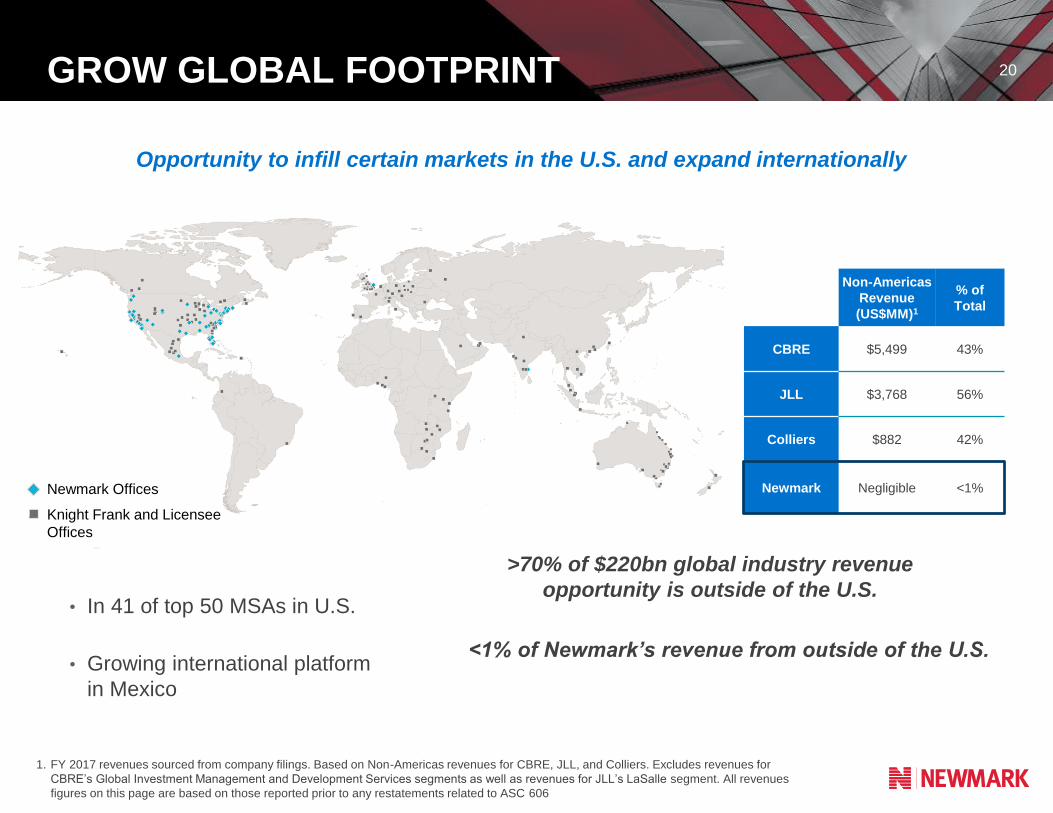
20GROW GLOBAL FOOTPRINT
Non-Americas
Revenue
(US$MM)1
% of
Total
CBRE $5,499 43%
JLL $3,768 56%
Colliers $882 42%
Newmark Negligible <1%
1. FY 2017 revenues sourced from company filings. Based on Non-Americas revenues for CBRE, JLL, and Colliers. Excludes revenues for
CBRE’s Global Investment Management and Development Services segments as well as revenues for JLL’s LaSalle segment. All revenues
figures on this page are based on those reported prior to any restatements related to ASC 606
• In 41 of top 50 MSAs in U.S.
• Growing international platform
in Mexico
>70% of $220bn global industry revenue
opportunity is outside of the U.S.
<1% of Newmark’s revenue from outside of the U.S.
Opportunity to infill certain markets in the U.S. and expand internationally
Newmark Offices
Knight Frank and Licensee
Offices

CONCLUSION

22
NMRK INTENDS TO COMPLETE SPIN-OFF FROM BGCP BY YEAR-END 2018 (OUTLOOK AS OF 8-2-2018)
• The Company continues to make progress towards the planned spin-off, which BGCP and
NMRK said (as of 8-2-2018) that they intend to complete by the end of 2018
• Newmark Group is working with the rating agencies to obtain its own credit rating and
believes that it is well-positioned to be investment grade
• This will better enable Newmark Group to refinance its long-term debt at an attractive
interest rate
• Separation from BGCP is required in order for the spin-off to be tax-free for BGCP
shareholders
• Had the spin-off occurred immediately following the close of 2Q2018, the ratio of Newmark
common shares to be distributed in respect of each BGCP common share would have
been approximately 0.4647. BGCP owns 59% of Newmark’s 258.9 million fully diluted
shares
• Had the spin-off occurred as of this same date, NMRK’s Class A float would have increased
from approximately 23MM shares to 148MM shares
Note: The total number of Class A shares would have increased to approximately 160MM in this hypothetical scenario. The float
includes only Class A common shares not owned by Cantor or by executives or Directors of NMRK. See also the sections of this
document titled “Newmark’s Fully Diluted Share Count Summary As Of June 30, 2018” and “Proposed Spin-Off of Newmark”

23
Full-service CRE firm with high-producing professionals
Highest revenue growth in the U.S. CRE services sector
Strong year-over-year Adjusted Earnings and Adjusted
EBITDA growth
Proven ability to profitably attract and retain talent
Strong track record of accretive acquisitions
Attractive industry dynamics
Multiple avenues for future growth and margin improvement
Intermediary-oriented, low risk business model
INVESTMENT HIGHLIGHTS

GAAP FINANCIAL RESULTS

25SELECT CONSOLIDATED GAAP FINANCIAL RESULTS
Highlights of Consolidated GAAP Results (USD
millions, except per share data)2Q 2018 2Q 2017 Change (%)
Revenues $466.6 $405.1 15.2%
Income before income taxes and noncontrolling
interests15.1 56.6 (73.3)%
Net income (loss) for fully diluted shares 0.7 N/A N/A
GAAP net income (loss) per fully diluted share 0.00 N/A N/A
Pre-tax earnings margin 3.2% 14.0%

26
NEWMARK GROUP, INC. CONDENSED CONSOLIDATED STATEMENTS OF OPERATIONS
(IN THOUSANDS, EXCEPT PER SHARE DATA) (UNAUDITED) (UNDER GAAP)
Revenues: 2018 2017 2018 2017
Commissions 279,833 239,848 540,568 444,806
Gains from mortgage banking activities/originations, net 41,877 73,546 80,791 118,808
Management services, servicing fees and other 144,909 91,677 275,720 174,039
Total revenues 466,619 405,071 897,079 737,653
Expenses:
Compensation and employee benefits 268,980 238,518 521,675 453,663
Allocations of net income and grant of exchangeability to limited partnership
units 65,026 23,851 90,835 34,500
Total compensation and employee benefits 334,006 262,369 612,510 488,163
Operating, administrative and other 80,048 59,404 155,475 106,786
Fees to related parties 6,301 4,167 13,195 8,885
Depreciation and amortization 20,201 23,218 42,714 41,455
Total non-compensation expenses 106,550 86,789 211,384 157,126
Total operating expenses 440,556 349,158 823,894 645,289
Other income (losses), net:
Other income (loss) (365) (715) 5,342 (1,308)
Total other income (losses), net (365) (715) 5,342 (1,308)
Income (loss) from operations 25,698 55,198 78,527 91,056
Interest (income) expense , net (10,582) 1,381 (23,991) 2,515
Income before income taxes and noncontrolling interests 15,116 56,579 54,536 93,571
Provision (benefit) for income taxes 10,822 1,422 17,755 1,407
Consolidated net income (loss) 4,294$ 55,157$ 36,781$ 92,164$
Less: Net income (loss) attributable to noncontrolling interest in subsidiaries 3,555 12 16,045 308
Net income (loss) available to common stockholders 739$ 55,145$ 20,736$ 91,856$
Per share data:
Basic earnings per share
Net income (loss) available to common stockholders 739$ 55,145$ 20,736$ 91,856$
Basic earnings per share 0.00$ N/A 0.13$ N/A
Basic weighted-average shares of common stock outstanding 155,157 N/A 155,157 N/A
Fully diluted earnings per share
Net income (loss) for fully diluted shares 739 N/A 32,755 N/A
Fully diluted earnings per share 0.00$ N/A 0.13$ N/A
Fully diluted weighted-average shares of common stock outstanding 155,938 N/A 252,805 N/A
Dividends declared per share of common stock 0.09$ N/A 0.18$ N/A
Dividends declared and paid per share of common stock 0.09$ N/A 0.09$ N/A
Six Months Ended June 30,Three Months Ended June 30,

27
NEWMARK GROUP, INC. CONDENSED CONSOLIDATED STATEMENTS OF FINANCIAL
CONDITION (IN THOUSANDS, EXCEPT PER SHARE DATA) (UNAUDITED) (UNDER GAAP)
June 30, December 31,
2018 2017
Assets
Current Assets:
Cash and cash equivalents 60,274$ 121,027$
Restricted cash 314,991 52,347
Marketable securities 9,127 57,623
Loans held for sale 547,968 362,635
Receivables, net 317,663 210,471
Other current assets 48,738 20,994
Total current assets 1,298,761 825,097
Goodwill 481,714 477,532
Mortgage servicing rights, net 392,040 392,626
Loans, forgivable loans and other receivables from employees and partners 248,038 209,549
Fixed assets, net 67,686 64,822
Other intangible assets, net 26,677 24,921
Other assets 322,223 278,460
Total assets 2,837,139$ 2,273,007$
Liabilities, Redeemable Partnership Interest, and Equity:
Current Liabilities:
Warehouse notes payable 540,571$ 360,440$
Accrued compensation 228,788 205,395
Current portion of accounts payable, accrued expenses and other liabilities 184,248 124,961
Secured loans 9,127 57,623
Current portion of payables to related parties 267,397 34,169
Total current liabilities 1,230,131 782,588
Long-term debt 247,150 670,710
Long-term debt payable to related parties 412,500 412,500
Other long term liabilities 169,079 163,795
Total liabilities 2,058,860 2,029,593
Equity:
Total equity (1) 778,279 243,414
Total liabilities and equity 2,837,139$ 2,273,007$
(1) Includes "redeemable partnership interests," "noncontrolling interests" and "total stockholders' equity."

28
NEWMARK GROUP, INC. SUMMARIZED CONDENSED CONSOLIDATED
STATEMENTS OF CASH FLOWS (IN THOUSANDS) (UNAUDITED) (UNDER GAAP)
2018 2017
(120,989)$ 190,760$
12,942 (139,893)
309,938 (20,608)
201,891 30,259
173,374 117,554
375,265$ 147,813$
64,345$ 52,774$
The Condensed Consolidated Statements of Cash Flows are presented in summarized form. For complete
Condensed Consolidated Statements of Cash Flows, please refer to the company's Quarterly Report on Form 10-Q
for the six months ended June 30, 2018, to be filed with the Securities and Exchange Commission in the near future.
Six Months Ended June 30,
Cash and cash equivalents and restricted cash at beginning of period
Cash and cash equivalents and restricted cash at end of period
Net cash provided by (used in) operating activities excluding activity
from loan originations and sales
Net cash provided by (used in) operating activities
Net cash provided by (used in) investing activities
Net cash provided by (used in) financing activities
Net increase (decrease) in cash and cash equivalents

APPENDIX

30
$91.39
Nasdaq common shares to
be received each year (2018
through 2027)
Nasdaq share price1
Recurring Pre-Tax Annual
Earnings1
~1mm
~$91mm
8
>$725mmCumulative Pre-Tax Earnings
Available for Growth
Number of payments yet to
be received or monetized
(2018, 2021 – 2027)
NASDAQ PAYMENTS EXPLAINED
› In June 2013, BGC Partners sold its eSpeed
business to Nasdaq
› Consideration included a deferred payment of
approximately 14.9 million Nasdaq common
shares to be paid ratably over 15 years1
› BGC transferred the right to receive the
remaining 10.9 million shares to Newmark
› Newmark recognized $76 million in other
income during FY 2017 related to the first
Nasdaq payment
› Based on the 8/1/18 Nasdaq share price,
these payments are valued at approximately
$91 million per year
› On June 20, 2018, Newmark monetized the 2019
and 2020 tranches of Nasdaq, retaining all upside
and generating net proceeds of $153 million
› The NASDAQ payments provide significant
financial flexibility for Newmark
Note: The only condition for the Nasdaq payments is that Nasdaq (all of Nasdaq) produces $25 million in gross revenue for the applicable year (Nasdaq’s
annual gross revenue was $4.0 billion in FY 2017). The right to receive these shares is not included on Newmark’s balance sheet because of this condition
1. Based on the 8/1/18 Nasdaq share price

31
NEWMARK’S FULLY DILUTED SHARE COUNT SUMMARY AS OF JUNE 30, 2018
1. In conjunction with the proposed spin-off of Newmark, the limited partnership units are owned by employees of both Newmark and BGC. Over time, virtually all of the partners of
Newmark are expected to only own units and/or shares of Newmark and virtually all of the partners of BGC are expected to only own units and/or shares of BGC. Going forward,
partners of Newmark will be compensated with Newmark partnership units and partners of BGC will be compensated with BGC partnership units
2. These primarily represent contingent shares and/or units for which all necessary conditions have been satisfied except for the passage of time
3. Subject to applicable spin-off terms and partnership adjustments. See also the section of this document titled “Proposed Spin-Off of Newmark”
› Had the spin-off occurred immediately following the close of the second quarter of 2018, the ratio
of Newmark common shares to be distributed in respect of each BGC common share would have
been approximately 0.4647. BGC owns 59% of Newmark’s 258.9 million fully diluted shares
› Currently the outstanding shares and shares underlying the limited partnership units in yellow
are the shares available to be distributed to BGC shareholders as part of the proposed spin-
off3
Newmark Group, Inc. Fully Diluted Share Count Summary
As of June 30, 2018
Fully-diluted
Shares (millions) Ownership (%)
Class A owned by Public 23.3 9%
Limited partnership units owned by employees1
57.6 22%
Other owned by employees2
1.6 1%
Class A owned by BGC 115.6 45%
Class B owned by BGC 15.8 6%
Limited partnership units owned by BGC and subsidiaries 21.4 8%
Partnership units owned by Cantor 23.6 9%
Total 258.9 100%

32MORTGAGE SERVICING: PREDICTABLE AND RECURRING
$100
$120
$52
$61
TTM 2Q17 TTM 2Q18 YTD 2017 YTD 2018
(US$ millions)Servicing Fees1
Highly Recurring High Margin Business Servicing Portfolio Composition as of June 30, 2018
› Newmark’s servicing portfolio was $58.9 billion as of June 30, 2018
› The weighted average life of the loans in Newmark’s primary servicing portfolio was 8 years as
of June 30, 2018
1. Recorded as part of management services, servicing fees and other
Fannie Mae, 33%
Freddie Mac, 24%
FHA and other, 10%
Limited servicing, 27%
Special servicing, 6%
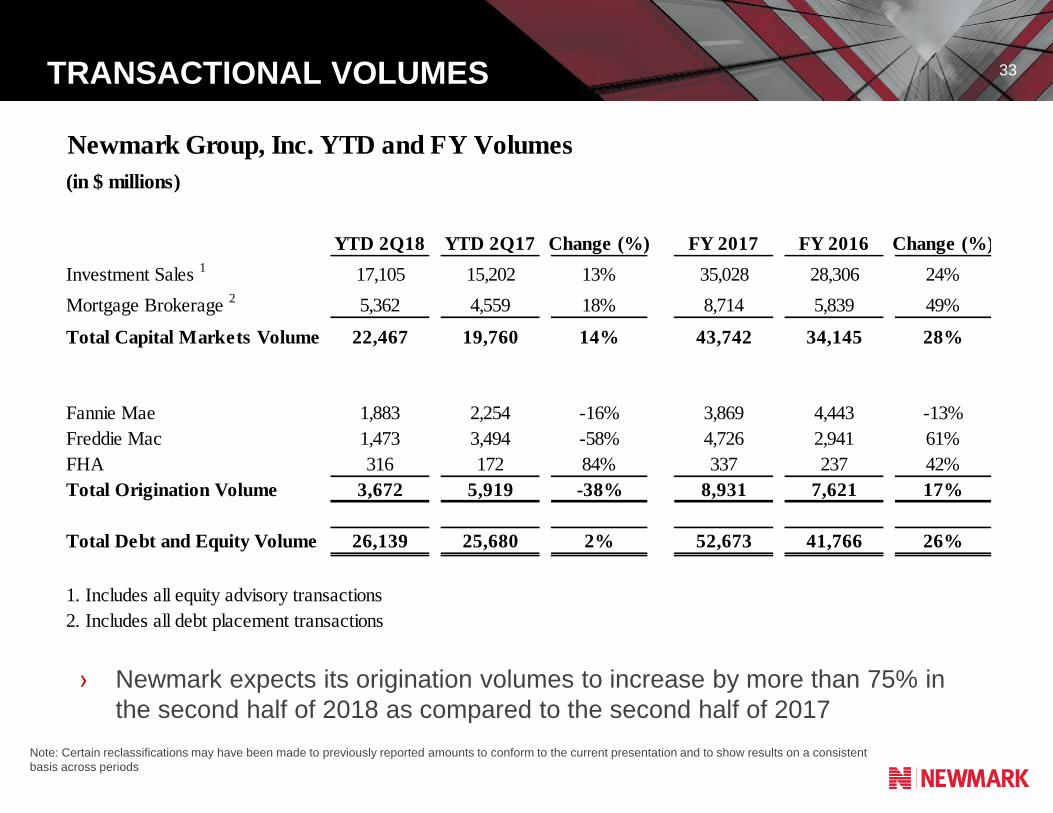
33TRANSACTIONAL VOLUMES
Note: Certain reclassifications may have been made to previously reported amounts to conform to the current presentation and to show results on a consistent
basis across periods
› Newmark expects its origination volumes to increase by more than 75% in
the second half of 2018 as compared to the second half of 2017
Newmark Group, Inc. YTD and FY Volumes
(in $ millions)
YTD 2Q18 YTD 2Q17 Change (%) FY 2017 FY 2016 Change (%)
Investment Sales 1
17,105 15,202 13% 35,028 28,306 24%
Mortgage Brokerage 2
5,362 4,559 18% 8,714 5,839 49%
Total Capital Markets Volume 22,467 19,760 14% 43,742 34,145 28%
Fannie Mae 1,883 2,254 -16% 3,869 4,443 -13%
Freddie Mac 1,473 3,494 -58% 4,726 2,941 61%
FHA 316 172 84% 337 237 42%
Total Origination Volume 3,672 5,919 -38% 8,931 7,621 17%
Total Debt and Equity Volume 26,139 25,680 2% 52,673 41,766 26%
1. Includes all equity advisory transactions
2. Includes all debt placement transactions

34
Institutional Investors in Real Estate
by Type (2017)
INCREASING INSTITUTIONAL INVESTMENT IN CRE
3.7%4.5%
5.2% 5.6%
9.6%10.3%
1990 2000 2005 2010 2015 2018E
Sources: Preqin Real Estate Online, National Association of Industrial and Office Properties, Cornell University’s Baker Program in Real Estate,
and Hodes Weill & Associates
Note: Due to rounding, the percentages in the second chart may not add up to 100%
› As institutional investors increase their ownership of commercial real estate,
Newmark benefits from increased transaction velocity and outsourcing
opportunities
19%
17%
14%14%
9%
8%
5%
3%
10%
Private Sector Pension Fund
Family Office/Wealth Manager
Public Pension Fund
Foundation
Endowment Plan
Insurance Company
Asset Manager
Bank/Investment Bank
Other
Target Allocation to Real Estate by
All Institutional Investors

35PROJECTED COMMERCIAL MORTGAGE MATURITIES
$267
$103 $115
$132 $150
$172
$196
$223
$321 $327 $334
$366 $371 $371 $362
$352
$400
$342 $353 $375
$395 $397
$0
$100
$200
$300
$400
$500
2001 2002 2003 2004 2005 2006 2007 2008 2009 2010 2011 2012 2013 2014 2015 2016 2017 2018 2019 2020 2021 2022
BIL
LIO
NS
Banks CMBS Life Insurance Other (primarily GSE)
Source: Newmark Knight Frank Research, Trepp
› $1.5 trillion in commercial mortgage maturities from 2019 – 2022 should support strong
levels of refinancing activity
ATTRACTIVE REFINANCING ENVIRONMENT
$1.5
Trillion

36
VACANCY RATES REMAIN FLAT AS NEW INVENTORY DELIVERIES ARE
OFFSET BY SUSTAINED DEMAND FOR COMMERCIAL REAL ESTATE
0.0%
4.0%
8.0%
12.0%
16.0%
20.0%
2Q11 2Q12 2Q13 2Q14 2Q15 2Q16 2Q17 2Q18
Office Industrial Retail Unweighted Average
› Vacancy rates remain flat in the office and industrial sectors, reflecting sustained demand that
continues to outpace construction activity across major commercial real estate property
types. The retail sector experienced a 250 basis point decrease year-over-year
Source: CoStar, Newmark Research
U.S. Vacancy Rates by Asset Class

37
FULLY DILUTED WEIGHTED-AVERAGE SHARE COUNT FOR GAAP AND
ADJUSTED EARNINGS (IN THOUSANDS) (UNAUDITED)
2018 2017 (1) 2018 2017 (1)
Common stock outstanding 155,157 N/A 155,447 N/A
Limited partnership units - N/A 67,033 N/A
Cantor units - N/A 23,758 N/A
Founding partner units - N/A 5,714 N/A
RSUs 146 N/A 213 N/A
Other 635 N/A 639 N/A
Fully diluted weighted-average share count for GAAP 155,938 - 252,804 -
Adjusted Earnings Adjustments:
Common stock outstanding - N/A - N/A
Limited partnership units 73,354 N/A - N/A
Cantor units 23,714 N/A - N/A
Founding partner units 5,696 N/A - N/A
RSUs - N/A - N/A
Other - N/A - N/A
Fully diluted weighted-average share count for
Adjusted Earnings 258,702 228,390 252,804 226,794
Note:
(1) This methodology divides the relevant historical weighted average share counts of BGC Partners by 2.2 and adds the 23.0 million
shares of NMRK Class A common stock issued in the IPO as though they were issued and outstanding for the entire relevant period.
BGC's fully diluted weighted average share count for the three and six months ended June 30, 2017 was 451.9 and 448.3 million, respectively.
Newmark’s post-tax Adjusted Earnings per share for the three and six months ended June 30, 2018 and 2017 under this methodology is
$0.25 and $0.47, and $0.21 and $0.34, respectively.
Three Months Ended June 30, Six Months Ended June 30,

38
DIFFERENCES BETWEEN CONSOLIDATED RESULTS FOR ADJUSTED EARNINGS AND GAAP
Differences between Consolidated Results for Adjusted Earnings and GAAP
The following sections describe the main differences between results as calculated for Adjusted Earnings and GAAP for the periods discussed herein.
In the second quarter 2018, the difference between compensation expenses as calculated for GAAP and Adjusted Earnings included non-cash, non-dilutive
net charges related to $60.3 million in grants of exchangeability with respect to units of BGC held by certain Newmark partners and $4.7 million in allocation of
net income to limited partnership units and FPUs.
In the second quarter 2017, the difference between compensation expenses as calculated for GAAP and Adjusted Earnings included non-cash, non-dilutive
net charges related to the $17.6 million in grants of exchangeability; and $6.2 million in allocation of net income to limited partnership units and FPUs.
In the first six months of 2018, the difference between compensation expenses as calculated for GAAP and Adjusted Earnings included non-cash, non-dilutive
net charges related to $82.1 million in grants of exchangeability with respect to units of BGC held by certain Newmark partners and $8.8 million in allocation of
net income to limited partnership units and FPUs.
In the first six months of 2017, the difference between compensation expenses as calculated for GAAP and Adjusted Earnings included non-cash, non-dilutive
net charges related to the $23.7 million in grants of exchangeability; and $10.8 million in allocation of net income to limited partnership units and FPUs.
Impact of OMSRs and MSRs on Non-Compensation Expenses for Adjusted Earnings
GAAP income from operations before income taxes for the second quarter 2018 includes a $9.0 million non-cash gain attributable to OMSRs net of MSRs. In
the year earlier period, the comparable gain attributable to OMSRs net of amortization of MSRs was $23.6 million. These non-cash GAAP net gains were
excluded from pre-tax Adjusted Earnings calculations as an adjustment to non-compensation expenses.
GAAP income from operations before income taxes for the first six months of 2018 includes a $12.2 million non-cash gain attributable to OMSRs net of MSRs.
In the year earlier period, the comparable gain attributable to OMSRs net of amortization of MSRs was $39.0 million. These non-cash GAAP net gains were
excluded from pre-tax Adjusted Earnings calculations as an adjustment to non-compensation expenses.
Other Differences between Non-compensation Expenses for Adjusted Earnings and GAAP
In addition to the adjustments related to OMSRs and MSRs, the difference between non-compensation expenses in the second quarter 2018 as calculated for
GAAP and Adjusted Earnings also included $1.3 million of non-cash GAAP charges related to amortization of intangibles; and $0.3 million of non-recurring
costs.
In addition to the adjustments related to OMSRs and MSRs, the difference between non-compensation expenses in the second quarter 2017 as calculated for
GAAP and Adjusted Earnings also included $1.4 million of non-cash GAAP charges related to amortization of intangibles; and $0.8 million of non-recurring
costs.
In addition to the adjustments related to OMSRs and MSRs, the difference between non-compensation expenses in the first six months of 2018 as calculated
for GAAP and Adjusted Earnings also included $2.8 million of non-cash GAAP charges related to amortization of intangibles; and $0.4 million of non-recurring
costs associated with the IPO.
In addition to the adjustments related to OMSRs and MSRs, the difference between non-compensation expenses in the first six months of 2017 as calculated
for GAAP and Adjusted Earnings also included $2.7 million of non-cash GAAP charges related to amortization of intangibles; and $2.0 million of non-recurring
costs associated with the IPO.

39
DIFFERENCES BETWEEN CONSOLIDATED RESULTS FOR ADJUSTED EARNINGS AND GAAP (CONTINUED)
Differences between Other income (loss) for Adjusted Earnings and GAAP
GAAP income from operations before income taxes for the second quarter 2018 and first half of 2018 includes a $2.8 million non-cash loss attributable to
unrealized non-cash mark-to-market gains or losses on “other income (loss)” related to the variable share forward agreement with respect to Newmark’s
expected receipt of the Nasdaq payments in 2019 and 2020. In the year earlier periods, there was no comparable loss attributable to other non-cash, non-
dilutive, non-economic items. These non-cash GAAP net losses were excluded from pre-tax Adjusted Earnings calculations.
Differences between Taxes for Adjusted Earnings and GAAP
Newmark’s GAAP provision for income taxes is calculated based on an annualized methodology. The Company’s GAAP provision for income taxes was $10.8
million for the second quarter 2018. The Company includes additional tax-deductible items when calculating the provision for taxes with respect to Adjusted
Earnings using an annualized methodology. These include tax-deductions related to equity-based compensation with respect to limited partnership unit
exchange, employee loan amortization, and certain net-operating loss carryforwards. The provision for income taxes with respect to Adjusted Earnings was
modified by $0.8 million for the second quarter 2018. As a result, the provision for income taxes for Adjusted Earnings was $10.0 million for second quarter
2018.
Newmark’s GAAP provision for income taxes was $1.4 million for the second quarter 2017. The Company’s provision for income taxes with respect to
Adjusted Earnings was modified by $9.2 million for the second quarter 2017 using the same methodology described above. As a result, the provision for
income taxes for Adjusted Earnings was $10.6 million for second quarter 2017. The Company did not include the effect of the 2017 U.S. Tax Cuts and Jobs
Act when calculating the Adjusted Earnings provision for income taxes for 2017.
Newmark’s GAAP provision for income taxes is calculated based on an annualized methodology. The Company’s GAAP provision for income taxes was $17.8
million for the first six months of 2018. The Company includes additional tax-deductible items when calculating the provision for taxes with respect to Adjusted
Earnings using an annualized methodology. These include tax-deductions related to equity-based compensation with respect to limited partnership unit
exchange, employee loan amortization, and certain net-operating loss carryforwards. The provision for income taxes with respect to Adjusted Earnings was
modified by $0.7 million for the first six months of 2018. As a result, the provision for income taxes for Adjusted Earnings was $18.5 million for the first six
months of 2018.
Newmark’s GAAP provision for income taxes was $1.4 million for the first six months of 2017. The Company’s provision for income taxes with respect to
Adjusted Earnings was modified by $15.5 million for the first six months of 2017 using the same methodology described above. As a result, the provision for
income taxes for Adjusted Earnings was $16.9 million for first six months of 2017. The Company did not include the effect of the 2017 U.S. Tax Cuts and Jobs
Act when calculating the Adjusted Earnings provision for income taxes for 2017.

40ADJUSTED EARNINGS DEFINED
Adjusted Earnings Defined
Newmark uses non-GAAP financial measures including, but not limited to, “pre-tax Adjusted Earnings” and “post-tax Adjusted Earnings,” which are supplemental
measures of operating results that are used by management to evaluate the financial performance of the Company and its consolidated subsidiaries. Newmark believes
that Adjusted Earnings best reflect the operating earnings generated by the Company on a consolidated basis and are the earnings which management considers
available for, among other things, dividends and/or distributions to Newmark’s common stockholders and holders of Newmark Holdings partnership units during any
period.
As compared with items such as “Income (loss) before income taxes and noncontrolling interests” and “Net income (loss) for fully diluted shares” all prepared in
accordance with GAAP, Adjusted Earnings calculations primarily exclude certain non-cash compensation and other expenses that generally do not involve the receipt or
outlay of cash by the Company and/or which do not dilute existing stockholders, as described below. In addition, Adjusted Earnings calculations exclude certain gains
and charges that management believes do not best reflect the ordinary operating results of Newmark.
Adjustments Made to Calculate Pre-Tax Adjusted Earnings
Newmark defines pre-tax Adjusted Earnings as GAAP income (loss) from operations before income taxes and noncontrolling interest in subsidiaries, excluding certain
items such as:
• The impact of any unrealized non-cash mark-to-market gains or losses on “other income (loss)” related to the variable share forward agreement with respect to
Newmark’s expected receipt of the Nasdaq payments in 2019 and 2020;
• Non-cash asset impairment charges, if any;
• Allocations of net income to limited partnership units;
• Non-cash charges related to the amortization of intangibles with respect to acquisitions;
• Non-cash charges relating to grants of exchangeability to limited partnership units.
Virtually all of the Company’s key executives and producers have partnership or equity stakes in the Company and receive deferred equity or limited partnership units as
part of their compensation. A significant percentage of Newmark’s fully diluted shares are owned by the Company’s executives, partners and employees. The Company
issues limited partnership units and grants exchangeability to unit holders to provide liquidity to Newmark’s employees, to align the interests of the Company’s
employees and management with those of common stockholders, to help motivate and retain key employees, and to encourage a collaborative culture that drives cross-
selling and revenue growth.
When the Company issues limited partnership units, the shares of common stock into which the units can be ultimately exchanged are included in Newmark’s fully
diluted share count for Adjusted Earnings at the beginning of the subsequent quarter after the date of grant. Newmark includes such shares in the Company’s fully
diluted share count when the unit is granted because the unit holder is expected to be paid a pro-rata distribution based on Newmark’s calculation of Adjusted Earnings
per fully diluted share and because the holder could be granted the ability to exchange their units into shares of common stock in the future. Non-cash charges with
respect to grants of exchangeability reflect the value of the shares of common stock into which the unit is exchangeable when the unit holder is granted exchangeability
not previously expensed in accordance with GAAP. The amount of non-cash charges relating to grants of exchangeability the Company uses to calculate pre-tax
Adjusted Earnings on a quarterly basis is based upon the Company’s estimate of expected grants of exchangeability to limited partnership units during the annual period,
as described further below under “Adjustments Made to Calculate Post-Tax Adjusted Earnings.”
Adjusted Earnings also excludes non-cash GAAP gains attributable to originated mortgage servicing rights (which Newmark refer to as “OMSRs”) and non-cash GAAP
amortization of mortgage servicing rights (which the Company refers to as “MSRs”). Under GAAP, the Company recognizes OMSRs gains equal to the fair value of
servicing rights retained on mortgage loans originated and sold. Subsequent to the initial recognition at fair value, MSRs are carried at the lower of amortized cost or fair
value and amortized in proportion to the net servicing revenue expected to be earned. However, it is expected that any cash received with respect to these servicing
rights, net of associated expenses, will increase Adjusted Earnings (and Adjusted EBITDA) in future periods.

41ADJUSTED EARNINGS DEFINED (CONTINUED)
Additionally, Adjusted Earnings calculations exclude certain unusual, one-time or non-recurring items, if any. These items are excluded from Adjusted Earnings because
the Company views excluding such items as a better reflection of the ongoing, ordinary operations of Newmark. Newmark’s definition of Adjusted Earnings also excludes
certain gains and charges with respect to acquisitions, dispositions, or resolutions of litigation. Management believes that excluding such gains and charges also best
reflects the ongoing operating performance of Newmark.
Adjustments Made to Calculate Post-Tax Adjusted Earnings
Because Adjusted Earnings are calculated on a pre-tax basis, Newmark also intends to report post-tax Adjusted Earnings to fully diluted stockholders. Newmark defines
post-tax Adjusted Earnings to fully diluted stockholders as pre-tax Adjusted Earnings reduced by the non-GAAP tax provision described below.
The Company calculates its tax provision for post-tax Adjusted Earnings using an annual estimate similar to how it accounts for its income tax provision under GAAP. To
calculate the quarterly tax provision under GAAP, Newmark estimates its full fiscal year GAAP income (loss) from operations before income taxes and noncontrolling
interests in subsidiaries and the expected inclusions and deductions for income tax purposes, including expected grants of exchangeability to limited partnership units
during the annual period. The resulting annualized tax rate is applied to Newmark’s quarterly GAAP income (loss) from operations before income taxes and
noncontrolling interests in subsidiaries. At the end of the annual period, the Company updates its estimate to reflect the actual tax amounts owed for the period.
To determine the non-GAAP tax provision, Newmark first adjusts pre-tax Adjusted Earnings by recognizing any, and only, amounts for which a tax deduction applies
under applicable law. The amounts include non-cash charges with respect to grants of exchangeability, certain charges related to employee loan forgiveness, certain net
operating loss carryforwards when taken for statutory purposes, and certain charges related to tax goodwill amortization. These adjustments may also reflect timing and
measurement differences, including treatment of employee loans, changes in the value of units between the dates of grants of exchangeability and the date of actual unit
exchange, variations in the value of certain deferred tax assets and liabilities and the different timing of permitted deductions for tax under GAAP and statutory tax
requirements.
After application of these previously described adjustments, the result is the Company’s taxable income for Newmark’s pre-tax Adjusted Earnings, to which the Company
then applies the statutory tax rates. This amount is the Company’s non-GAAP tax provision. Newmark views the effective tax rate on pre-tax Adjusted Earnings as equal
to the amount of Newmark’s non-GAAP tax provision divided by the amount of pre-tax Adjusted Earnings.
Generally, the most significant factor affecting this non-GAAP tax provision is the amount of non-cash charges relating to the grants of exchangeability to limited
partnership units. Because the non-cash charges relating to the grants of exchangeability are deductible in accordance with applicable tax laws, increases in
exchangeability have the effect of lowering the Company’s non-GAAP effective tax rate and thereby increasing Newmark’s post-tax Adjusted Earnings.
Management uses post-tax Adjusted Earnings in part to help it evaluate, among other things, the overall performance of the business, to make decisions with respect to
the Company’s operations, and to determine the amount of dividends payable to common stockholders and distributions payable to holders of limited partnership units.
Newmark incurs income tax expenses based on the location, legal structure and jurisdictional taxing authorities of each of its subsidiaries. Certain of the Company’s
entities are taxed as U.S. partnerships and are subject to the Unincorporated Business Tax (“UBT”) in New York City. Any U.S. federal and state income tax liability or
benefit related to the partnership income or loss, with the exception of UBT, rests with the unit holders rather than with the partnership entity. The Company’s financial
statements include U.S. federal, state and local income taxes on the Company’s allocable share of the U.S. results of operations. Outside of the U.S., Newmark is
expected to operate principally through subsidiary corporations subject to local income taxes. For these reasons, taxes for Adjusted Earnings are expected to be
presented to show the tax provision the Company would expect to pay if 100 percent of earnings were taxed at global corporate rates.

42ADJUSTED EARNINGS DEFINED (CONTINUED)
Calculations of Pre-Tax and Post-Tax Adjusted Earnings per Share
Newmark’s Adjusted Earnings per share calculations assume either that:
• The fully diluted share count includes the shares related to any dilutive instruments, but excludes the associated interest expense, net of tax, when the impact would
be dilutive; or
• The fully diluted share count excludes the shares related to these instruments, but includes the associated interest expense, net of tax.
The share count for Adjusted Earnings excludes certain shares expected to be issued in future periods but not yet eligible to receive dividends and/or distributions. Each
quarter, the dividend payable to Newmark’s common stockholders, if any, is expected to be determined by the Company’s Board of Directors with reference to a number
of factors, including post-tax Adjusted Earnings per fully diluted share. Newmark may also pay a pro-rata distribution of net income to limited partnership units, as well as
to Cantor for its noncontrolling interest. The amount of this net income, and therefore of these payments per unit, would be determined using the above definition of pre-
tax Adjusted Earnings using the fully diluted share count. The declaration, payment, timing and amount of any future dividends payable by the Company will be at the
discretion of its board of directors using the fully diluted share count.
Other Matters with Respect to Adjusted Earnings
The term “Adjusted Earnings” should not be considered in isolation or as an alternative to GAAP net income (loss). The Company views Adjusted Earnings as a metric
that is not indicative of liquidity or the cash available to fund its operations, but rather as a performance measure. Pre- and post-tax Adjusted Earnings are not intended to
replace the Company’s presentation of its GAAP financial results. However, management believes that these measures help provide investors with a clearer
understanding of Newmark’s financial performance and offer useful information to both management and investors regarding certain financial and business trends
related to the Company’s financial condition and results of operations. Management believes that Adjusted Earnings measures and the GAAP measures of financial
performance should be considered together.
Newmark anticipates providing forward-looking guidance for GAAP revenues and for certain Adjusted Earnings measures from time to time. However, the Company
does not anticipate providing an outlook for GAAP results other than revenue. This is because certain GAAP items, which are excluded from Adjusted Earnings, are
difficult to forecast with precision before the end of each period. The Company therefore believes that it is not possible to forecast GAAP results or to quantitatively
reconcile GAAP results to non-GAAP results with sufficient precision unless Newmark makes unreasonable efforts. The items that are difficult to predict on a quarterly
basis with precision and which can have a material impact on the Company’s GAAP results include, but are not limited, to the following:
• Allocations of net income and grants of exchangeability to limited partnership units, which are determined at the discretion of management throughout and up to the
period-end;
• The impact of certain marketable securities, as well as any gains or losses related to associated mark-to- market movements and/or hedging including with respect to
the Nasdaq Forward. These items are calculated using period-end closing prices;
• Non-cash asset impairment charges, which are calculated and analyzed based on the period-end values of the underlying assets. These amounts may not be known
until after period-end; and
• Acquisitions, dispositions and/or resolutions of litigation, which are fluid and unpredictable in nature.

43ADJUSTED EBITDA DEFINED
Adjusted EBITDA and Adjusted EBITDA Before Allocations to Units Defined
Newmark provides a non-GAAP financial performance measure, “Adjusted EBITDA,” which the Company defines as “Net income (loss) for fully diluted shares” derived in
accordance with GAAP and adjusted for the addition of the following items:
• Provision (benefit) for income taxes;
• Net income (loss) attributable to noncontrolling interest;
• Employee loan amortization and reserves on employee loans;
• Interest expense;
• Fixed asset depreciation and intangible asset amortization;
• Non-cash charges relating to grants of exchangeability to limited partnership units;
• Other non-cash charges related to equity-based compensation;
• Other non-cash income (loss); and
• Net non-cash GAAP gains related to OMSRs and MSRs amortization.
The Company also discloses “Adjusted EBITDA before allocations to units,” which is Adjusted EBITDA excluding GAAP charges with respect to allocations of net income to
limited partnership units. Such allocations represent the pro-rata portion of pre-tax earnings available to such unit holders. These units are included in the fully-diluted share
count, and are exchangeable on a one-to-one basis, subject to certain adjustments, into shares of Newmark’s Class A common stock. As these units are exchanged into
shares of the Company’s Class A common stock, unit holders will become entitled to cash dividends paid on the shares of the Class A common stock rather than cash
distributions in respect of the units. The Company views such allocations as economically equivalent to dividends on common shares. Because dividends paid to common
shares are not an expense under GAAP, management believes similar allocations of income to unit holders should also be excluded by investors when analyzing Newmark’s
results on a fully-diluted basis with respect to Adjusted EBITDA.
For all periods beginning with the third quarter of 2018, the Company will simplify its definition of “Adjusted EBITDA” so that it excludes GAAP charges with respect to
allocations of net income to limited partnership units. Therefore, the term “Adjusted EBITDA” will be consistent with what the Company has historically referred to as
“Adjusted EBITDA before allocations to units”.
The Company’s management believes that these Adjusted EBITDA measures are useful in evaluating Newmark’s operating performance, because the calculations of these
measures generally eliminate the effects of financing and income taxes and the accounting effects of capital spending and acquisitions, which would include impairment
charges of goodwill and intangibles created from acquisitions. Such items may vary for different companies for reasons unrelated to overall operating performance. As a
result, the Company’s management uses these measures to evaluate operating performance and for other discretionary purposes. Newmark believes that these Adjusted
EBITDA measures are useful to investors to assist them in achieving a more complete picture of the Company’s financial condition and results of operations.
Because these Adjusted EBITDA measures are not recognized measurements under GAAP, investors should use these measures in addition to “Net income (loss) for fully
diluted shares” when analyzing Newmark’s operating performance. Because not all companies use identical Adjusted EBITDA calculations, the Company’s presentation of
these Adjusted EBITDA measures may not be comparable to similarly-titled measures of other companies. Furthermore, these Adjusted EBITDA measures are not intended
to be measures of free cash flow or GAAP cash flow from operations, because these Adjusted EBITDA measures do not consider certain cash requirements, such as tax and
debt service payments.
See the reconciliation table “Reconciliation of GAAP Income (Loss) to Adjusted EBITDA” elsewhere in this document for additional information on this topic.

44PROPOSED SPIN-OFF
Proposed Spin-Off of Newmark
BGC has advised Newmark that it currently expects to pursue a distribution to its stockholders of all of the Class A common shares and Class B common shares of
Newmark that BGC then owns (the “spin-off”) in a manner that is intended to qualify as generally tax-free for U.S. federal income tax purposes. As currently
contemplated, shares of Class A common stock of Newmark held by BGC would be distributed to the holders of shares of Class A common stock of BGC, and
shares of Class B common stock of Newmark held by BGC would be distributed to the holders of shares of Class B common stock of BGC.
Had the spin-off occurred immediately following the close of the second quarter of 2018, the ratio of Newmark common shares to be distributed in respect of each
BGC common share would have been approximately 0.4647. However, the exact ratio of Newmark common shares to be distributed in respect of each BGC
common share in the spin-off will depend on, among other things, the number of BGC common shares outstanding and the number of Newmark common shares
(including Newmark common shares underlying units of Newmark Partners, L.P.) owned by BGC as of the record date of the spin-off. The spin-off is subject to a
number of conditions, and BGC may determine not to proceed with the spin-off if the BGC board of directors determines, in its sole discretion, that the spin-off is not
in the best interest of BGC and its stockholders. Accordingly, the spin-off may not occur on any expected timeframe, or at all.
Please see the section titled “Item 13—Certain Relationships and Related Transactions, and Director Independence—Separation and Distribution Agreement—The
Distribution” and “Item 13—Certain Relationships and Related Transactions, and Director Independence—Separation and Distribution Agreement— BGC Partners
Contribution of Newmark OpCo Units Prior to the Distribution” in Newmark’s amended 2017 annual report on Form 10-K/A for additional information regarding the
proposed distribution.
45DIVIDEND POLICY & ASC 606
Newmark Dividend Policy
Newmark’s board of directors has authorized a dividend policy that reflects its intention to pay a quarterly dividend, starting with the first quarter of 2018. Any dividends to
Newmark’s common stockholders will be calculated based on its expected post-tax Adjusted Earnings per fully diluted share, as a measure of net income for the year. See
Newmark’s 10-Q for a definition of “post-tax Adjusted Earnings” per fully diluted share.
Newmark currently expects that, in any year, its aggregate quarterly dividends will be equal to or less than its estimate at the end of the first quarter of such year of 25% of its
post-tax Adjusted Earnings per fully diluted share to its common stockholders for such year. The declaration, payment, timing and amount of any future dividends payable by
Newmark will be at the discretion of its board of directors; provided that any dividend to its common stockholders that would result in the dividends for a year exceeding 25%
of its post-tax Adjusted Earnings per fully diluted share for such year shall require the consent of the holder of a majority of the Newmark Holdings exchangeable limited
partnership interests, which is currently Cantor.
For the first quarter of 2018, Newmark’s board of directors declared a dividend of 9 cents per share based on management’s current expectation of its post-tax Adjusted
Earning per fully diluted share for the year, and has indicated that it expects such dividend to remain consistent for the full year. To the extent that 25% of Newmark’s post-
tax Adjusted Earnings per fully diluted share for the year exceeds this dividend on an annualized basis (i.e. an expected aggregate of $0.36 for four quarters), Newmark does
not expect that its board of directors will increase the amount of the quarterly dividend payment during the year, or make downward adjustments in the event of a shortfall,
although no assurance can be given that adjustments will not be made during the year. Newmark has indicated that it expects to announce the annual expected dividend rate
in the first quarter of each year.
Impact of Adopting Revenue Recognition Guidance
On January 1, 2018, we adopted ASC 606, which provides accounting guidance on the recognition of revenues from contracts with customers and impacts the presentation
of certain revenues and expenses in our Condensed Consolidated Statements of Operations. Newmark elected to adopt ASC 606 using a modified retrospective approach
with regard to contracts that were not completed as of December 31, 2017, and prospectively from January 1, 2018 onward. Accordingly, our financial information have not
been revised for historical comparable periods and are presented under the accounting standards in effect during those periods. Due to the adoption of ASC 606, for all
periods from the first quarter of 2018 onward, Newmark did not and will not record revenues or earnings related to “Leasing and other commissions” with respect to
contingent revenue expected to be received in future periods as of December 31, 2017, in relation to contracts signed prior to January 1, 2018, for which services have
already been completed. Instead, the Company recorded this contingent revenue and related commission payments on the balance sheet on January 1, 2018, with a
corresponding pre-tax improvement of approximately $22.7 million and Newmark recognized an increase of $16.5 million and $2.3 million to beginning retained earnings and
non-controlling interest, respectively, as a cumulative effect of adoption of an accounting change. Over time, the Company expects to receive $23 million of cash related to
these “Leasing and other commissions” receivables, primarily over the course of 2018 and 2019. This cash, however, will not be recorded as GAAP net income.
Additionally, prior to the adoption of ASC 606, Newmark presented certain management services expenses incurred on behalf of customers, subject to reimbursement, on a
net basis. Under ASC 606, Newmark concluded that it controls the services provided by a third party on behalf of customers and, therefore, acts as a principal under those
contracts and will present the related expenses on a gross basis in our Condensed Consolidated Statements of Operations, with no impact on net income available to
common stockholders.
ASC 606 does not apply to revenue associated with financial instruments, including loans and securities that are accounted for under other U.S. GAAP guidance, and as a
result, did not have an impact on the elements of our Condensed Consolidated Statements of Operations most closely associated with financial instruments, including
Commissions, Gains from mortgage banking activities/originations, net and Servicing fees.
There was no significant impact as a result of applying ASC 606 to our results of operations for the three months ended March 31, 2018, except as it relates to the
recognition and presentation of Management services, servicing fees and other revenues that contained future contingencies and certain Operating, Administrative and Other
expenses subject to reimbursement.
Refer to Newmark’s Quarterly Reports on Form 10-Q for further information.

46
RECONCILIATION OF GAAP INCOME (LOSS) TO ADJUSTED EBITDA
(IN THOUSANDS)(UNAUDITED)
2018 2017 2018 2017
GAAP Net income (loss) available to common stockholders 739$ 55,145$ 20,736$ 91,856$
Add back:
Provision (benefit) for income taxes 10,822 1,422 17,755 1,407
Net income (loss) attributable to noncontrolling interest in subsidiaries 3,555 12 16,045 308
OMSR Revenue (24,695) (42,597) (45,792) (71,907)
MSR Amortization 15,726 19,040 33,550 32,916
Other Depreciation and Amortization 4,475 4,178 9,163 8,541
Depreciation and amortization 20,201 23,218 42,713 41,457
Grant of Exchangeability to limited partnership units (1) 60,334 17,644 82,083 23,681
Other non-cash and equity based compensation and amortization (2) 7,572 8,040 5,188 16,054
Non-Recurring (Gains) / Losses 275 814 444 2,016
Other non-cash, non-dilutive, non-economic items (3) 2,808 1,221 2,638 2,553
Interest expense (4) 12,915 7 27,735 13
Adjusted EBITDA 94,526$ 64,926$ 169,545$ 107,438$
Allocations of net income 4,692 6,206 8,752 10,818
Adjusted EBITDA before allocations to units $ 99,218 $ 71,132 $ 178,297 $ 118,256
Note: For all periods beginning with the third quarter of 2018, the Company will simplify its definition of “Adjusted EBITDA” so that it excludes GAAP charges with respect to
allocations of net income to limited partnership units. Therefore, the term “Adjusted EBITDA” will be consistent with what the Company has historically referred to as “Adjusted
EBITDA before allocations to units”.
(1) Represents non-cash and non-dilutive charges relating to grants of exchangeability to limited partnership units.
(2) Includes other equity based amortization and employee loans amortization and reserves.
(4) The Interest expense add back for Adjusted EBITDA excludes operating interest on Warehouse notes payable of $4.4 million and $9.5 million, for the Three Months Ended June 30,
2018 and 2017 and $8.1 million and $11.4 million for the Six Months Ended June 30, 2018 and 2017, respectively.
Three Months Ended June 30, Six Months Ended June 30,
(3) Includes the impact of any unrealized non-cash mark-to-market gains or losses on “other income (loss)” related to the variable share forward agreement with respect to Newmark’s
expected receipt of the Nasdaq payments in 2019 and 2020. Also includes certain other non-cash expenses.

47
TTM RECONCILIATION OF GAAP INCOME (LOSS) TO ADJUSTED EBITDA
(IN THOUSANDS)(UNAUDITED)
2018 2017
GAAP Net income (loss) available to common stockholders 73,372$ 207,683$
Add back:
Provision (benefit) for income taxes 73,826 4,542
Net income (loss) attributable to noncontrolling interest in subsidiaries 16,342 (317)
OMSR Revenue (94,856) (147,384)
MSR Amortization 73,152 60,188
Other Depreciation and Amortization 23,919 16,027
Depreciation and amortization 97,071 76,215
Grant of Exchangeability to limited partnership units (1) 147,837 53,101
Other non-cash equity based compensation and amortization (2) 56,036 47,083
Non-Recurring (Gains) / Losses 5,357 (14,315)
Other non-cash, non-dilutive, non-economic items (3) 4,834 2,553
Interest expense (4) 30,606 15
Adjusted EBITDA 410,426$ 229,176$
Allocations of net income 23,155 30,282
Adjusted EBITDA before allocations to units $ 433,581 $ 259,457
(1) Represents non-cash and non-dilutive charges relating to grants of exchangeability to limited partnership units.
(2) Includes other equity based amortization and employee loans amortization and reserves.
(3) Includes the impact of any unrealized non-cash mark-to-market gains or losses on “other income (loss)” related to the variable share forward
agreement with respect to Newmark’s expected receipt of the Nasdaq payments in 2019 and 2020. Also includes certain other non-cash expenses.
(4) The Interest expense add back for Adjusted EBITDA excludes operating interest on Warehouse notes payable.
Note: For all periods beginning with the third quarter of 2018, the Company will simplify its definition of “Adjusted EBITDA” so that it excludes GAAP
charges with respect to allocations of net income to limited partnership units. Therefore, the term “Adjusted EBITDA” will be consistent with what the
Company has historically referred to as “Adjusted EBITDA before allocations to units”.
TTM Ended June 30,

48
RECONCILIATION OF GAAP INCOME (LOSS) TO ADJUSTED EARNINGS
AND GAAP FULLY DILUTED EPS TO POST-TAX ADJUSTED EPS
(IN THOUSANDS, EXCEPT PER SHARE DATA) (UNAUDITED)
2018 2017 2018 2017
Net income (loss) available to common stockholders 739$ 55,145$ 20,736$ 91,856$
Provision (benefit) for income taxes 10,822 1,422 17,755 1,407
Net income (loss) attributable to noncontrolling interest in subsidiaries 3,555 12 16,045 308
Pre-tax adjustments:
OMSR Revenue (24,695) (42,597) (45,793) (71,907)
MSR amortization 15,726 19,040 33,551 32,916
Grant of exchangeability to limited partnership units 60,334 17,644 82,083 23,681
Intangible Asset Amortization 1,257 1,350 2,770 2,697
Non recurring (Gains) / Losses 275 814 443 2,016
Other non-cash, non-dilutive, non-economic items (1) 2,808 - 2,808 -
Allocation of Net Income 4,692 6,206 8,752 10,818
Total pre-tax adjustments 60,397 2,457 84,614 221
Pre-tax Adjusted Earnings 75,513$ 59,036$ 139,150$ 93,792$
GAAP Net income (loss) available to common stockholders 739$ 55,145$ 20,736$ 91,856$
Allocation of net income (loss) to noncontrolling interest in subsidiaries 3,311 - 14,998 -
Total pre-tax adjustments (from above) 60,397 2,457 84,614 221
Income tax adjustment to reflect adjusted earnings taxes 832 (9,205) (699) (15,476)
Post-tax Adjusted Earnings 65,279$ 48,397$ 119,649$ 76,601$
Per Share Data
GAAP fully diluted earnings per share 0.00$ N/A 0.13$ N/A
Less: Allocations of net income to limited partnership units and FPUs, net of
tax (0.01) N/A (0.06) N/A
Nasdaq Forward Contract Preferred Discount 0.00 N/A 0.00 N/A
Total pre-tax adjustments (from above) 0.23 0.01 0.33 0.00
Income tax adjustment to reflect adjusted earnings taxes 0.00 (0.04) (0.00) (0.07)
Post-tax adjusted earnings per share 0.25$ 0.21$ 0.47$ 0.34$
Pre-tax adjusted earnings per share 0.29$ 0.26$ 0.55$ 0.41$
Fully diluted weighted-average shares of common stock outstanding 258,703 228,390 252,805 226,794
(1) Includes the impact of any unrealized non-cash mark-to-market gains or losses on “other income (loss)” related to the variable share forward
(“Nasdaq Forward”) agreement with respect to Newmark’s expected receipt of the Nasdaq payments in 2019 and 2020.
Three Months Ended June 30, Six Months Ended June 30,

49TTM RECONCILIATION OF GAAP INCOME (LOSS) TO ADJUSTED EARNINGS
(IN THOUSANDS) (UNAUDITED)
2018 2017
Net income (loss) available to common stockholders 73,372$ 207,683$
Provision (benefit) for income taxes 73,826 4,542
Net income (loss) attributable to noncontrolling interest in subsidiaries 16,342 (317)
Pre-tax adjustments:
Reserves on employee loan 26,055 18,142
OMSR Revenue (94,856) (147,384)
MSR amortization 73,152 60,188
Grant of exchangeability to limited partnership units 147,837 53,101
Intangible Asset Amortization 11,118 4,758
Non recurring (Gains) / Losses 5,357 (14,315)
Other non-cash, non-dilutive, non-economic items (1) 12,808 -
Allocation of Net Income 23,155 30,282
Total pre-tax adjustments 204,627 4,772
Pre-tax Adjusted Earnings 368,167$ 216,680$
GAAP Net income (loss) available to common stockholders 73,372$ 207,683$
Allocation of net income (loss) to noncontrolling interest in subsidiaries 14,998 -
Total pre-tax adjustments (from above) 204,627 4,772
Income tax adjustment to reflect adjusted earnings taxes 14,150 (35,443)
Post-tax Adjusted Earnings 307,146$ 177,012$
(1) Includes the impact of any unrealized non-cash mark-to-market gains or losses on “other income (loss)” related to the variable share forward
(“Nasdaq Forward”) agreement with respect to Newmark’s expected receipt of the Nasdaq payments in 2019 and 2020.
TTM Ended June 30,

50
FULLY DILUTED WEIGHTED-AVERAGE SHARE COUNT FOR GAAP AND
ADJUSTED EARNINGS (IN THOUSANDS) (UNAUDITED)
2018 2017 (1) 2018 2017 (1)
Common stock outstanding 155,157 N/A 155,447 N/A
Limited partnership units - N/A 67,033 N/A
Cantor units - N/A 23,758 N/A
Founding partner units - N/A 5,714 N/A
RSUs 146 N/A 213 N/A
Other 635 N/A 639 N/A
Fully diluted weighted-average share count for GAAP 155,938 - 252,804 -
Adjusted Earnings Adjustments:
Common stock outstanding - N/A - N/A
Limited partnership units 73,354 N/A - N/A
Cantor units 23,714 N/A - N/A
Founding partner units 5,696 N/A - N/A
RSUs - N/A - N/A
Other - N/A - N/A
Fully diluted weighted-average share count for
Adjusted Earnings 258,702 228,390 252,804 226,794
Note:
(1) This methodology divides the relevant historical weighted average share counts of BGC Partners by 2.2 and adds the 23.0 million
shares of NMRK Class A common stock issued in the IPO as though they were issued and outstanding for the entire relevant period.
BGC's fully diluted weighted average share count for the three and six months ended June 30, 2017 was 451.9 and 448.3 million, respectively.
Newmark’s post-tax Adjusted Earnings per share for the three and six months ended June 30, 2018 and 2017 under this methodology is
$0.25 and $0.47, and $0.21 and $0.34, respectively.
Three Months Ended June 30, Six Months Ended June 30,

MEDIA CONTACT:Karen Laureno-Rikardsen+1 212-829-4975
INVESTOR CONTACTS:Jason McGruder Kelly Collar+1 212-610-2426 +1 212-610-2426
Find out more aboutNewmark at the following sites:
http://www.ngkf.com/https://twitter.com/newmarkkf
https://www.linkedin.com/company/newmark-knight-frank/http://ir.ngkf.com/investors/investorshome/default.aspx
Top Related