


Languages
Pages
Legal


NewExt: WP2 Mortality Risk Valuation- Results and uses for Externe
University of Bath
Project Meeting May 26th, 2003
PSI
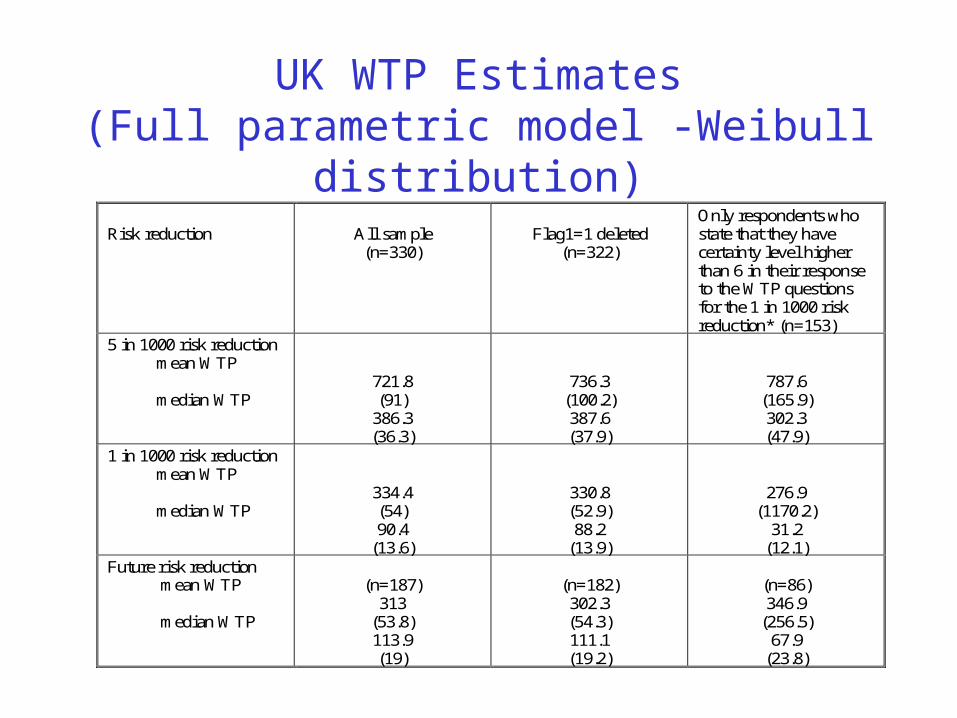
UK WTP Estimates(Full parametric model -Weibull distribution)
Risk reduction All sample(n=330)
Flag1=1 deleted(n=322)
Only respondents whostate that they havecertainty level higherthan 6 in their responseto the WTP questionsfor the 1 in 1000 riskreduction* (n=153)
5 in 1000 risk reduction mean WTP
median WTP721.8(91)
386.3(36.3)
736.3(100.2)387.6(37.9)
787.6(165.9)302.3(47.9)
1 in 1000 risk reduction mean WTP
median WTP334.4(54)90.4
(13.6)
330.8(52.9)88.2
(13.9)
276.9(1170.2)
31.2(12.1)
Future risk reduction mean WTP
median WTP
(n=187)313
(53.8)113.9(19)
(n=182)302.3(54.3)111.1(19.2)
(n=86)346.9
(256.5)67.9
(23.8)

Key questions to ask of results
• What is the effect of age on WTP for reductions in one’s own risk of death?
• What is the effect of health on WTP for reductions in one’s own risk of death?
• How is WTP affected by latency?

Annual value of statistical life (Euro) with immediate risk reduction
From WTP for the 5 in1000 risk reduction
From WTP for the 1 in1000 risk reduction
Using mean WTP 1,472,640(198,496)
3,308,160(529,280)
Using median WTP 775,104(75,808)
881,920(138,560)
*These figures are computed by taking the annual WTP figures and dividing by X/10000,where X is the risk reduction, which is assumed to be evenly spread over 10 years. Thisapproach eliminates the need for choosing a discount rate.** For “cleaned” sample. Standard errors in parentheses.
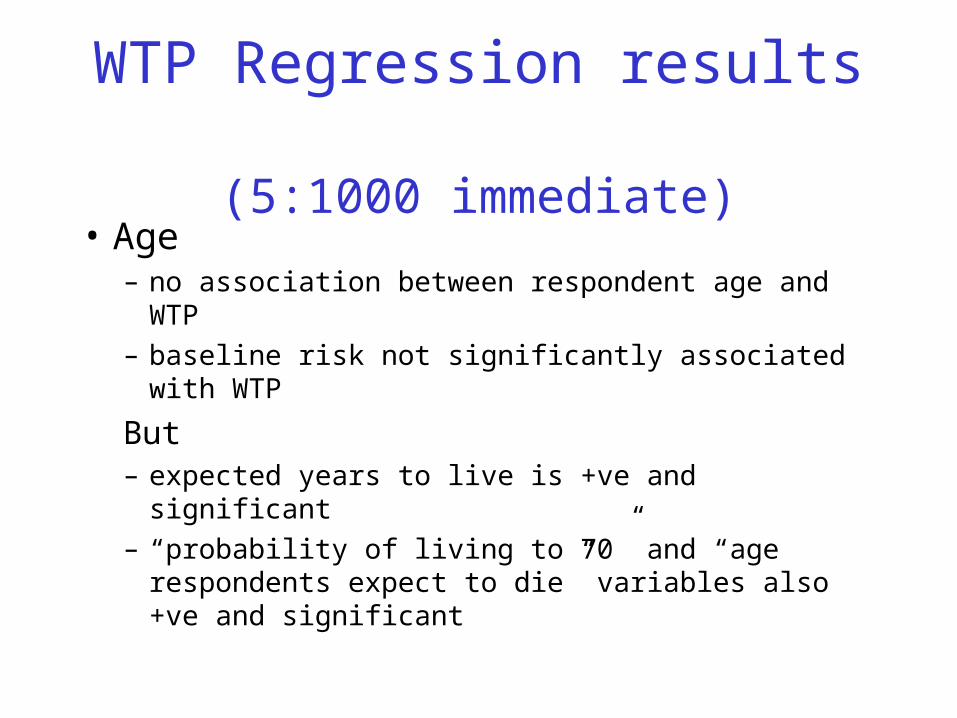
WTP Regression results (5:1000 immediate)
• Age– no association between respondent age and WTP
– baseline risk not significantly associated with WTP
But– expected years to live is +ve and significant
– “probability of living to 70” and “age respondents expect to die” variables also +ve and significant

WTP Regression results (5:1000 immediate)
• Higher education levels associated with lower WTP
• Higher income associated with higher WTP
• Own chronic illness associated with higher WTP, though illness in family associated with lower WTP

WTP Regression results (5:1000 immediate)
• WTP lower if respondents doubted effectiveness of product
• WTP lower for respondents did not think whether they could afford the product

WTP (5:1000 future)
From WTP for the 5 in1000 risk reduction from
age 70Using mean WTP 604,600
(108,600)Using median WTP 222,200
(38,400)

WTP Regression (5:1000 future)
• WTP for future risk reduction increases with (log) chance of surviving to 70
• WTP for future risk reduction decreases when respondent thinks their health will be worse in future
• Other variables not significant
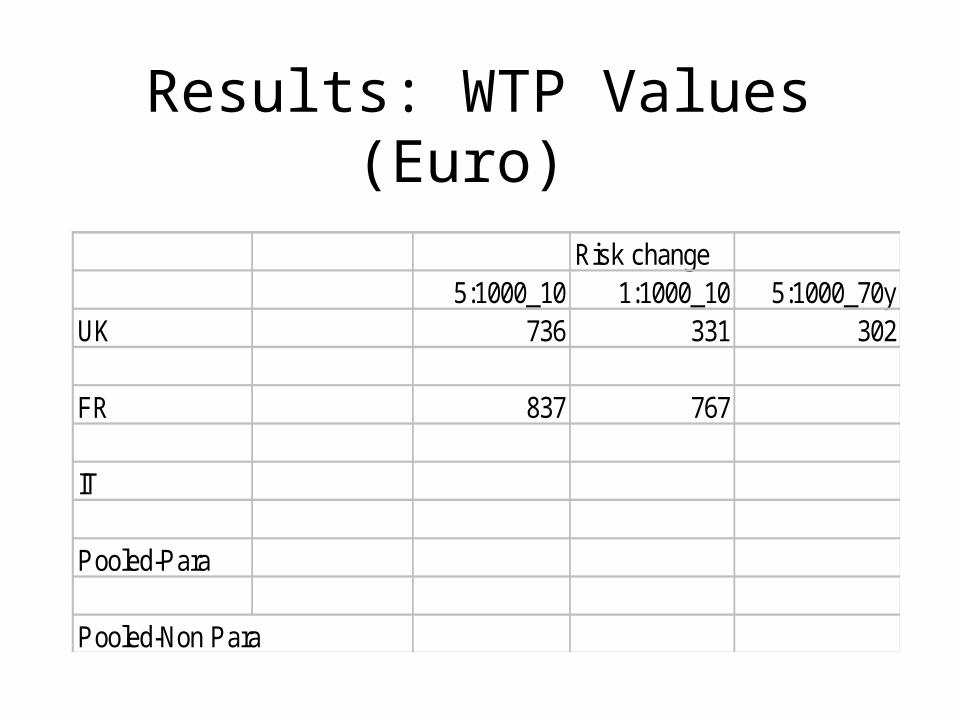
Results: WTP Values (Euro)
Risk change5:1000_10 1:1000_10 5:1000_70y
UK 736 331 302
FR 837 767
IT
Pooled-Para
Pooled-Non Para

ExternE Requirements
• Air pollution context– epidemiological results only allow
quantification of loss of life expectancy (LLE)– epidemiology suggests elderly in health most
likely to be vulnerable to premature death from air pollution
need to convert WTP for risk to LLE

Risk change - LLE conversion
• Intuitively, if survival probability in future time periods rises, result will be rise in life expectancy - conversions made by Ari.
Male 5:1000
Present Age When risk change occurs
Change in LE (days)
40 next 10 yrs 5670 next 10 yrs 2256 next 10 yrs 3440 70-80 22
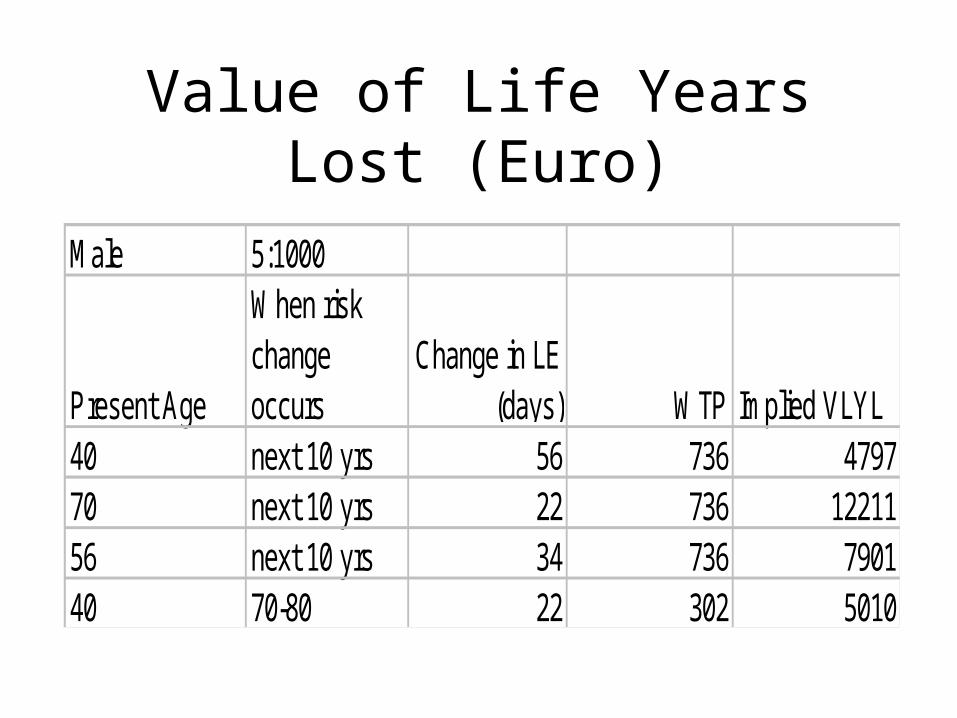
Value of Life Years Lost (Euro)
Male 5:1000
Present Age
When risk change occurs
Change in LE (days) WTP Implied VLYL
40 next 10 yrs 56 736 479770 next 10 yrs 22 736 1221156 next 10 yrs 34 736 790140 70-80 22 302 5010
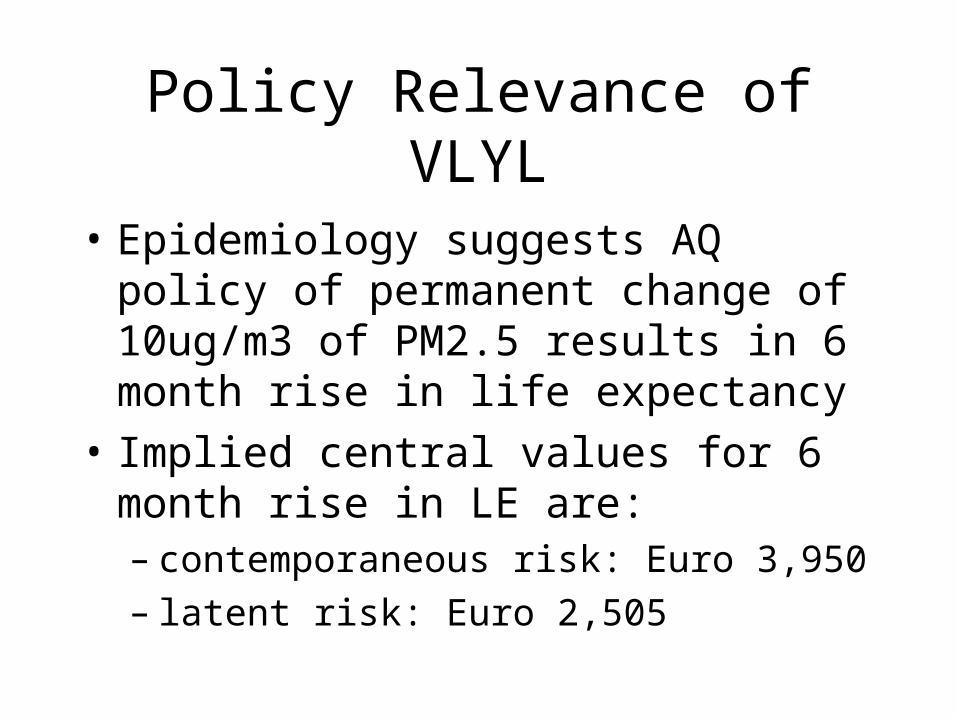
Policy Relevance of VLYL
• Epidemiology suggests AQ policy of permanent change of 10ug/m3 of PM2.5 results in 6 month rise in life expectancy
• Implied central values for 6 month rise in LE are:– contemporaneous risk: Euro 3,950– latent risk: Euro 2,505

Outstanding issues
• EU policy context: need pooled results to finalise recommended values
• Extensions of existing methodology– small-scale testing of 2 variants in France
• change “product” to “public health programme”
• change risk reduction to increase in life expectancy

French Variants
• change “product” to “public health programme”• Because, e.g.:
– culture of free medical treatment in EU means respondents have difficulty in understanding health actions in terms of costs

public health programme WTP (Euro)
Starting bid of E150Product Pub. Health
5:1000_10 1203 327
1:1000_10 821 140

French Variants
• change risk reduction to increase in life expectancy
• Because:– respondents may not understand probabilities– want toavoidhaving to mak eartificial
conversion between WTP for risk change and LE change

Change risk reduction to increase in life expectancy
Starting bid of E150Product LE equiv.
5:1000_10 1203 149
1:1000_10 821 46

French extensions
Table 2. Mean WTP for the open question in France
Risk reductionVariant
1/1000next 10 years
5/1000next 10 years
5/1000from 70 to 80
Original version a, b 404 € 663 € 368 €Open question a, c 213 € 247 € 232 €Gain in LE 200 €a sequence S2 (=first 5/1000 then 1/1000)b mean of the open questionc in this variant the bids of the original were removed and only the open question was asked.d in this variant people were told their gain in LE and only the open question was asked.

French extensions
Table 3. Comparison of results France – Canada.
Risk reductionCountry and method
1/1000next 10 years
5/1000next 10 years
Ratio(5/1000)/(1/1000)
FranceS1 a (mean of open question in original version)
428 € 515 € 1.2
FranceS2 a (mean of open question in original version)
404 € 663 € 1.6
France(analysis with spike model, S1 and S2 merged)
440 € 712 € 1.6
France(logit of double bounded bid, S1 and S2 merged)
247 € 600 € 2.4
Canada(analysis with spike model)
368 C$ (S1) 600 C$ (S2) 1.6
Canada(logit of double bounded bid)
296 C$ (S1) 464 C$ (S2) 1.6
a sequence S1 (=first 1/1000 then 5/1000), S2 (=first 5/1000 then 1/1000)

Table 4. Comparison of results France, Italy and UK(mean of open question in original version, sequence S1).
Risk reduction 1/1000next 10 years
5/1000next 10 years
Ratio(5/1000)/(1/1000)
France 428 515 1.2Italy 565 788 1.4UK 174 528 3.0

Future Work
• Provide final values for ExternE from pooled data
• Estimate direct WTP values for appropriate changes in life expectancy - NEEDS?
Top Related