


Languages
Pages
Legal


NREL is a national laboratory of the U.S. Department of Energy, Office of Energy Efficiency and Renewable Energy, operated by the Alliance for Sustainable Energy, LLC.
New Wind Energy Resource Potential Estimates for the United States
Dennis Elliott (NREL)
Marc Schwartz, Steve Haymes, Donna Heimiller, George Scott (NREL)
Michael Brower, Erik Hale, Bryon Phelps (AWS Truepower, LLC)
Second Conference on Weather, Climate and the New Energy Economy
January 27, 2011
91st Annual Meeting of the American Meteorological Society
Seattle, Washington
NREL/PR-5500-50439

NATIONAL RENEWABLE ENERGY LABORATORY
U.S. Wind Mapping RationaleProvides accurate information about the wind resource in each state• For federal and state policy
discussion, analysis, and implementation
• To support the 20% wind future• To facilitate wind prospecting • To support state, regional, and
national wind integration analyses
Validates wind resource maps• Essential to ensure stakeholder
confidence in accuracy of map estimates
Supports the Program’s mission of eliminating barriers to wind energy.

NATIONAL RENEWABLE ENERGY LABORATORY
Technical Approach: Wind Mapping & ValidationProduce maps based on: • Numerical modeling (AWS Truepower)
and adjustments• Empirical and analytical methods• 1 km2 or finer horizontal-resolution
wind resource maps
Validate preliminary maps using public and private wind measurement data
Develop and validate maps at 50-m height for 39 states
Update mapping at 80- & 100-m heights for 48 contiguous states• Develop wind potential estimates (net
of exclusions)
Publish on DOE’s Wind Powering America (WPA) Web site

NATIONAL RENEWABLE ENERGY LABORATORY
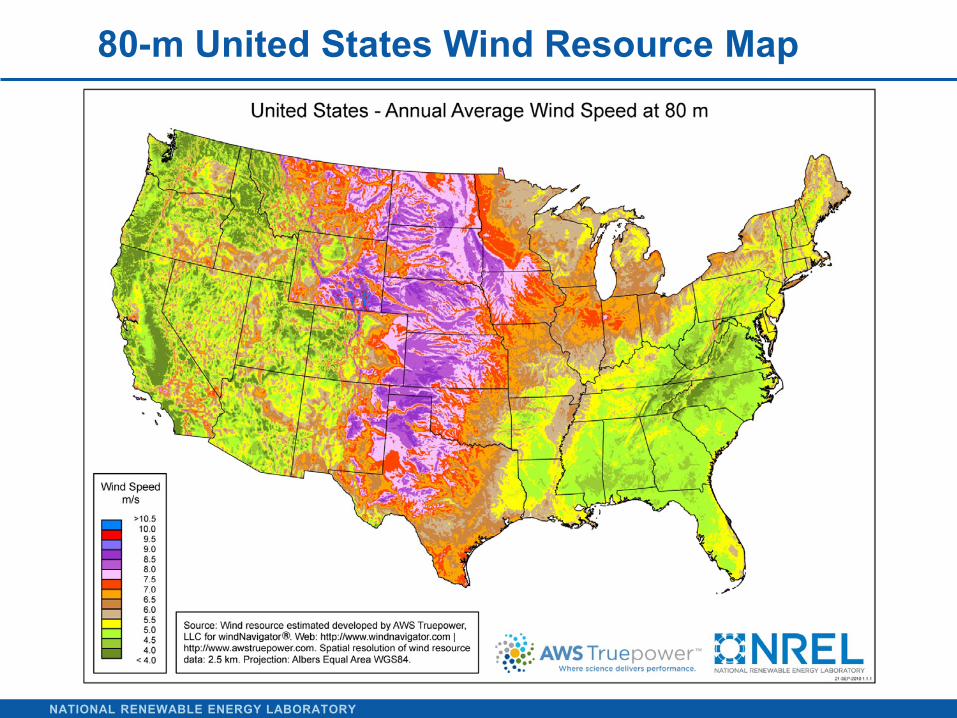
U.S. Wind Mapping and Potential: 50-m Height
50-m wind mapping (2001-2009) • Culmination of long-term
project that began in 2001; jointly funded by states and DOE/WPA
• Comprehensive validation of WPA maps using available measurement data
• Incorporated state maps by others to produce a national wind map (“patchwork quilt” evident in some regions)
• 50-m wind potential estimates to support U.S. 20% wind scenario study

NATIONAL RENEWABLE ENERGY LABORATORY
U.S. Wind Mapping and Potential: 80- & 100-m Heights80- & 100-m mapping and potential estimates (2009-2010) • New products for contiguous United States and each state developed through a
collaborative project with AWS Truepower• Annual average wind speed maps at 80- and 100-m heights• NREL validated 19 selected state maps with tower measurement data from 300+ locations• Wind potential estimates at 80 m and 100 m based on modeled wind turbine capacity
factor (CF) data – CF example: 1-MW rated turbine at 30% CF = an average of 300 kW• Posted new products to WPA Web site (broke all-time DOE/EERE records for most hits)• Hosted national Webinar to discuss new products and methodology• Responded to many media and stakeholder requests about the new products
NATIONAL RENEWABLE ENERGY LABORATORY
80-m United States Wind Resource Map
NATIONAL RENEWABLE ENERGY LABORATORY
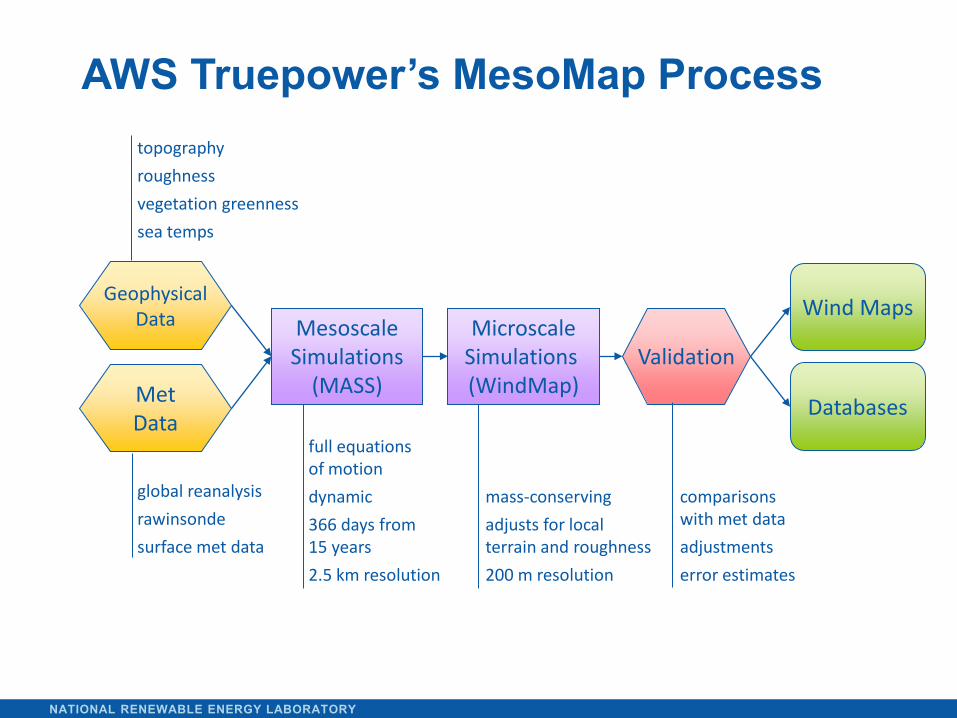
AWS Truepower’s MesoMap Process
GeophysicalData Mesoscale
Simulations(MASS)
MicroscaleSimulations (WindMap)
Wind Maps
MetData
Databases
Validation
full equations of motion
dynamic
366 days from15 years
2.5 km resolution
mass-conserving
adjusts for localterrain and roughness
200 m resolution
global reanalysis
rawinsonde
surface met data
topography
roughness
vegetation greenness
sea temps
comparisonswith met data
adjustments
error estimates

NATIONAL RENEWABLE ENERGY LABORATORY
AWS Truepower’s Estimation of Plant Output
For each point, wind speed distribution created from 12 years of weather simulations (windTrends)
Then gross turbine output calculated for a generic IEC Class 2 turbine power curve, corrected for air density
0%
2%
4%
6%
8%
10%
12%
14%
0 2 4 6 8 10 12 14 16 18 20 22 24 >25.5
Wind Speed (m/s)
Freq
uecn
y
Speed FreqWeibull Freq
0%
10%
20%
30%
40%
50%
60%
70%
80%
90%
100%
0 5 10 15 20 25 30
Cap
acity
Fac
tor
Speed (m/s)
Composite IEC Class II Power Curve

NATIONAL RENEWABLE ENERGY LABORATORY
Development of Wind Potential Estimates
• AWS Truepower produced a national dataset of estimated CF (not adjusted for losses)
– Spatial resolution of 200 m– Heights of 80 m and 100 m– Land-based areas only (no offshore), 48 contiguous states
• NREL used the CF data to estimate the land area and wind potential for each state
– Windy land defined as areas with >= 30% CF, which are generally considered to be suitable for wind energy development
– Areas with CF >=30% have mean annual wind speeds of about 6.4 m/s and greater– Excluded sensitive environmental lands and incompatible land-use areas– For wind potential, assumed 5 MW/km2 of installed nameplate capacity
Why use CF and not Power Class to produce wind potential estimates?CF is representative of power output from large wind turbines.Power class is representative of theoretical energy in the wind.

NATIONAL RENEWABLE ENERGY LABORATORY
National Exclusion Map

NATIONAL RENEWABLE ENERGY LABORATORY
Wind Resource Potential at 80 & 100 m - United States
Capacity factor (CF) example: 1-MW rated turbine at 30% CF = an average of 300 kW

NATIONAL RENEWABLE ENERGY LABORATORY
Tables of State Wind PotentialEstimates of Windy Land Area and Wind Energy Potential by StateFor Areas >=30% Capacity Factor at 80 m
Installed Capacity – assumes 5 MW/km2 of available windy land areaAnnual Generation – annual wind energy generation that could be produced from the installed capacity
(Tables are also available for other CF categories and heights)

NATIONAL RENEWABLE ENERGY LABORATORY
Comparison of State Wind Maps and Potential Graphs
Arizona
Ohio
North Dakota

NATIONAL RENEWABLE ENERGY LABORATORY
Wind Potential – Key FindingsU.S. wind potential from areas with CF>=30% is enormous
• At 80 m, almost 10,500 GW capacity
• At 100 m, 12,000 GW capacity
Most of the wind potential comes from windy central regions, but many eastern and western states have significant wind potential
• 35 states with >1,000 MW capacity at 80 m
• 38 states with >1,000 MW capacity at 100 m
For higher CF ranges at 80 m, U.S. wind potential is still very large
• CF>=35%, >8,000 GW and 28 states >1,000 MW
• CF>=40%, >5,500 GW and 19 states >1,000 MW
– Available at: http://www.windpoweringamerica.gov/wind_maps.asp
Top 10 states with CF >=30% at 80 m
• By Installed Capacity: TX, KS, MT, NE, SD, ND, IA, WY, OK, NM
• By Annual Generation: TX, KS, NE, SD, MT, ND, IA, WY, OK, MN

NATIONAL RENEWABLE ENERGY LABORATORY
Proposed Next Steps
• Develop new 80- and 100-m wind resource maps and potential estimates for Alaska and Hawaii
• Update national maps to include entire United States
• Incorporate new offshore maps as they become available
• Develop maps at 30-m height for small wind turbine industry
• Initiate comprehensive program to validate 80- and 100-m maps
• Review and update exclusion methodology
• Identify key areas for new measurements and updated assessments
Top Related