


Languages
Pages
Legal

Neuronal Genes for Subcutaneous Fat Thickness inHuman and Pig Are Identified by Local GenomicSequencing and Combined SNP Association StudyKyung-Tai Lee1, Mi-Jeong Byun1,2, Kyung-Soo Kang1, Eung-Woo Park1, Seung-Hwan Lee1, Seoae Cho2,
HyoYoung Kim3, Kyu-Won Kim2, TaeHeon Lee3, Jong-Eun Park3, WonCheoul Park3, DongHyun Shin3,
Hong-Seog Park4, Jin-Tae Jeon5, Bong-Hwan Choi1, Gul-Won Jang1, Sang-Haeng Choi4, Dae-Won Kim6,
Dajeong Lim1, Hae-Suk Park1, Mi-Rim Park1, Jurg Ott7, Lawrence B. Schook8, Tae-Hun Kim1*, Heebal
Kim2,3*
1 Division of Animal Genomics and Bioinformatics, National Institute of Animal Science, Rural Development Administration, Suwon, Republic of Korea, 2 Interdisciplinary
Program in Bioinformatics, Seoul National University, Seoul, Republic of Korea, 3 Department of Agricultural Biotechnology and Research Institute for Agriculture and Life
Sciences, Seoul National University, Seoul, Republic of Korea, 4 Genome Research Center, Korea Research Institute of Bioscience and Biotechnology, Daejeon, Republic of
Korea, 5 Division of Applied Life Science, Gyeongsang National University, Jinju, Republic of Korea, 6 Division of Malaria and Parasitic Diseases, National Institute of Health,
Seoul, Republic of Korea, 7 Beijing Institute of Genomics, Beijing, China, 8 Institute for Genomic Biology, University of Illinois at Urbana-Champaign, Urbana, Illinois, United
States of America
Abstract
Obesity represents a major global public health problem that increases the risk for cardiovascular or metabolic disease. Thepigs represent an exceptional biomedical model related to energy metabolism and obesity in humans. To pinpoint causalgenetic factors for a common form of obesity, we conducted local genomic de novo sequencing, 18.2 Mb, of a porcine QTLregion affecting fatness traits, and carried out SNP association studies for backfat thickness and intramuscular fat content inpigs. In order to relate the association studies in pigs to human obesity, we performed a targeted genome wide associationstudy for subcutaneous fat thickness in a cohort population of 8,842 Korean individuals. These combined association studiesin human and pig revealed a significant SNP located in a gene family with sequence similarity 73, member A (FAM73A)associated with subscapular skin-fold thickness in humans (rs4121165, GC-corrected p-value = 0.0000175) and with backfatthickness in pigs (ASGA0029495, p-value = 0.000031). Our combined association studies also suggest that eight neuronalgenes are responsible for subcutaneous fat thickness: NEGR1, SLC44A5, PDE4B, LPHN2, ELTD1, ST6GALNAC3, ST6GALNAC5,and TTLL7. These results provide strong support for a major involvement of the CNS in the genetic predisposition to acommon form of obesity.
Citation: Lee K-T, Byun M-J, Kang K-S, Park E-W, Lee S-H, et al. (2011) Neuronal Genes for Subcutaneous Fat Thickness in Human and Pig Are Identified by LocalGenomic Sequencing and Combined SNP Association Study. PLoS ONE 6(2): e16356. doi:10.1371/journal.pone.0016356
Editor: Thomas Mailund, Aarhus University, Denmark
Received August 9, 2010; Accepted December 23, 2010; Published February 2, 2011
Copyright: � 2011 Lee et al. This is an open-access article distributed under the terms of the Creative Commons Attribution License, which permits unrestricteduse, distribution, and reproduction in any medium, provided the original author and source are credited.
Funding: This work was supported by 2-5-13 Agenda research (PJ006711) from the National Institute of Animal Science and by a grant (20050301034467) fromthe BioGreen 21 Program, Rural Development Administration, Republic of Korea. This research was also supported by the Korea Association Resource (KARE)project funded by the Korean National Institute of Health in Korea. The funders had no role in study design, data collection and analysis, decision to publish, orpreparation of the manuscript.
Competing Interests: The authors have declared that no competing interests exist.
* E-mail: [email protected] (THK); [email protected] (HK)
Introduction
The pig (Sus scrofa domesticus) was domesticated from Sus scrofa,
the wild boar, approximately 9,000 years ago in multiple regions
of the world [1,2]. It has become an important animal as one of
the major animal protein sources for humans and is also an
exceptionally relevant biomedical model for energy metabolism
and obesity in humans since it is devoid of brown fat postnatally
and due to its similar metabolic features, cardiovascular systems,
and proportional organ sizes [3].
Obesity is increasing in an epidemic manner and represents a
major public health problem by increasing risk to cardiovascular
disease [4,5] and metabolic disease such as type 2 diabetes [6].
Recently, two genome-wide association (GWA) studies have
expanded the number of genetic susceptibility loci for obesity by
identifying SNPs associated with body mass index (BMI) and
weight, thus, contributing to obesity risk. The loci identified are
located in or near ten genes including the neuronal growth
regulator 1 (NEGR1) genes [7,8]. Both of the GWA studies
hypothesized a role of the central nervous system (CNS) in the
predisposition to a common form of obesity as has previously been
shown for rare monogenic forms of obesity. Although both, BMI
and weight are highly heritable, the variants detected in these large
GWA studies explained only a small fraction of the inherited
variability in BMI and weight [7,8].
In pigs, high heritability has been estimated for backfat
thickness (BFT) and intramuscular fat (IMF) content. Estimates
of heritability for BFT are between 50% and 70%, and those for
IMF content between 38% and 67% [9]. IMF is necessary to
increase meat quality. However, a conflicting relationship exists
PLoS ONE | www.plosone.org 1 February 2011 | Volume 6 | Issue 2 | e16356

between IMF and BFT because extra fat in pigs unnecessarily
raises the cost of feed [10]. Various efforts have been made to
identify the chromosomal regions influencing BFT and IMF by
quantitative trait loci (QTL) analysis on pig chromosome 6 (SSC6)
BFT [11,12,13] and IMF [14,15,16,17,18,19,20]. Recent QTL
analyses revealed that the region between S0228 and SW1881
might harbor a highly significant QTL affecting fatness and meat
quality traits on SSC6 [21,22,23] (Figure 1). Thus, we carried out
both a de novo local genomic sequencing and a SNP association
study in this region to identify loci associated with BFT and IMF
content. Our rationale was that it is important to both identify
causal genetic factors in the pig QTL region, and to expand the
knowledge of genetic risk factors predisposing to common forms of
obesity in humans. To relate and expand the QTL results
observed in pigs to human common forms of obesity, we
performed a targeted genome wide association study with
subcutaneous fat thickness in a cohort population of 8,842 Korean
individuals.
Results
Local genomic sequencing of the pig QTL regionTo perform de novo local genomic sequencing of the QTL
region, a total of 316 markers were developed from pig Bacterial
Artificial Chromosome (BAC) end sequences summarized in
Table S2. The Korean Native Pig (KNP) BAC library [24] was
screened by 4D-PCR [25], and sequenced by a shotgun strategy.
Additional BAC clones produced by the International Swine
Genome Sequencing Consortium were used for gap filling.
Approximately 18.2 Mb sequence was generated after assembling
these sequences. Out of 72 protein coding genes on human
syntenic regions, 70 orthologous genes were detected in pigs.
Three porcine pseudo-genes and four novel genes were annotated
in this region. A total of 10 non-coding RNAs were detected
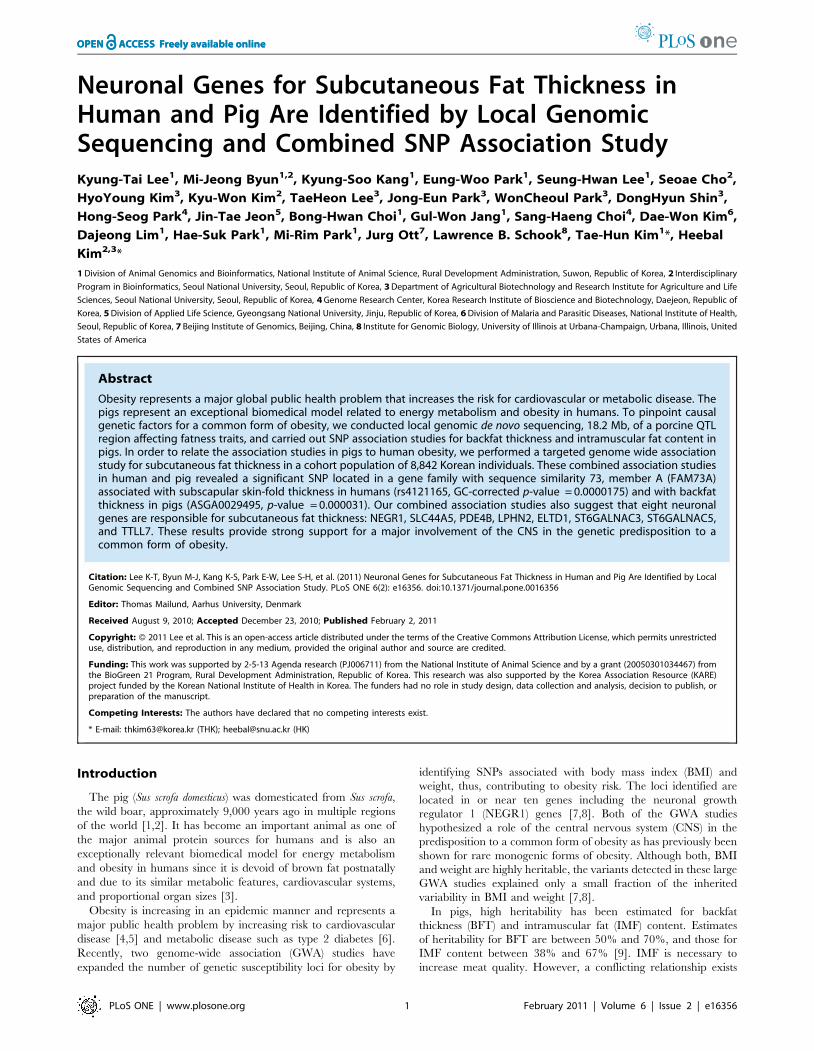
(Table S3). Comparative analysis with the human syntenic region
exhibited a genomic structure and contents similar to that in the
pig QTL region (Figure 2A), which included functional genes,
repetitive elements, GC content and CpG islands. A detailed
description of the genomic sequencing is provided in the methods.
The similarity of the genomic structure and contents with the
human syntenic region augments the merit of the pig as a relevant
biomedical model to identify and expand causal genetic factors
predisposing to common forms of human obesity. Visualization of
syntenic blocks along the region between pig and four other
species, human, mouse, dog and cow, shows closer genomic
similarity between pig and human than between pig and mouse
(Figure 2B). Rodent models have long been the pillar of obesity
and metabolic syndrome research. However, marked differences
in metabolism and adipose tissue biology between rodents and
humans have been recognized and, thus, the pig is emerging as a
more appropriate biomedical model for obesity in humans because
of its biological similarities with humans [3].
SNP association studies for backfat thickness andintramuscular fat content in pigs
After filtering SNP genotypes for quality control (Materials and
Methods), we conducted a SNP association study of the region
using 235 SNPs in 527 pigs for BFT and IMF content traits. We
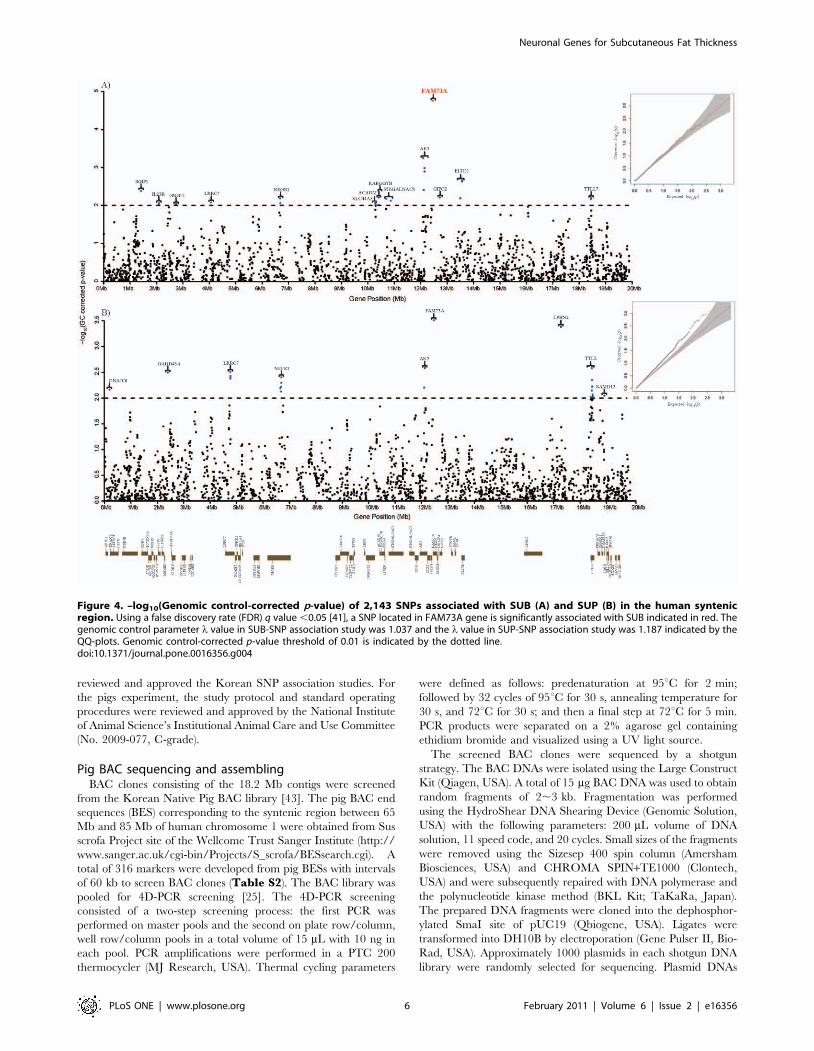
identified 52 SNPs (22.1% of the 235 SNPs) associated with BFT
at p = 0.000213, equivalent to p-value = 0.05 after Bonferroni
correction (Figure 3A and Table S4). Although this genomic
region has been suggested to contain QTLs for BFT, more
significant SNPs than expected were identified considering that the
Bonferroni procedure is a very conservative correction (some of
the SNPs are in strong linkage disequilibrium and therefore the
tests are not independent). None of the SNPs, however, were
Figure 1. A Pig QTL 18 Mb region affecting fatness and meat quality on SSC6. The information was compiled from PigQTLdb (http://www.genome.iastate.edu/cgi-bin/QTLdb/SS/index). The QTL region and confidence interval of the 18 Mb region is displayed. Reference(s) of each QTLindexed by number in parenthesis are in Table S1.doi:10.1371/journal.pone.0016356.g001
Neuronal Genes for Subcutaneous Fat Thickness
PLoS ONE | www.plosone.org 2 February 2011 | Volume 6 | Issue 2 | e16356
Neuronal Genes for Subcutaneous Fat Thickness
PLoS ONE | www.plosone.org 3 February 2011 | Volume 6 | Issue 2 | e16356

found to be significantly associated with IMF content (Figure 3B).
The significant SNPs are located in or near 13 protein coding
genes, with 10 genes containing at least one significant SNP each.
The SNP (ALGA0122230) showing the strongest association with
BFT is located near the neuronal growth regulator 1 (NEGR1)
gene. Recently the GIANT consortium [8] reported that the
NEGR1 obesity-associated SNPs they detected seemed to be in
strong linkage disequilibrium with nearby copy number variations
(CNV), although there is currently no functional evidence to
support the involvement of the CNV in non-syndromic human
obesity. The NEGR1 protein participates in the regulation of
neurite outgrowth in the developing brain [26,27]. Interestingly,
we found that of the 13 genes associated with BFT, 8 genes
including NEGR1 are involved in psychiatric disease, neural
development or high expression in CNS. The eight genes include:
NEGR1, a member of solute carrier (SLC) superfamily 44
(SLC44A5); phosphodiesterase 4B (PDE4B); latrophilin 2
(LPHN2); epidermal growth factor; latrophilin; seven transmem-
brane domains containing 1 (ELTD1), ST6 (a-N-acetylneurami-
nyl-2,-3-b-galactosyl-1,3)-N-acetylgalactosamine-a-2,6-sialyltrans-
ferase 3 (ST6GALNAC3), ST6GALNAC5; and tubulin tyrosine
ligase-like family, member 7 (TTLL7).
The SLC superfamily is a major group of membrane transporter
proteins that control cellular uptake and efflux of nutrients,
neurotransmitters, metabolites, drugs, and toxins [28]. Although
biological and neurological functions for the majority of the SLC
genes in the mammalian brain are largely unknown, recently, Dahlin
et al. [29] reported that 82% of known SLC genes were expressed in
the brain. Among the members of this superfamily, a member of
SLC44 was present in oligodendrocytes. To date, the biological
function of SLC44A5 is unknown. PDE4B belongs to a family of four
PDE4 genes, all coding for phosphodiesterases that hydrolyze the
second messenger cyclic adenosine monophosphate (cAMP). Since
PDE4B was first suggested as a risk factor for schizophrenia [30],
PDE4B has also been suggested as a candidate gene associated with
both schizophrenia and bipolar disorder [31]. Variation in the resting
electroencephalogram (EEG) is associated with common, complex
psychiatric traits including alcoholism, schizophrenia, and anxiety
disorders [32]. Recently, genome-wide association identified SNPs
with significant association to EEG traits on 1p31.3 of human
chromosome 1 [32], and interestingly, it is the human syntenic region
to the pig QTL region in which ST6GALNAC3 and LPHN2 are
included. LPHN2 is a G-protein-coupled receptor related to the
receptor that binds black widow (Latrodectus) spider venom in synaptic
membranes [33]. ST6GALNAC3 is an integral Golgi membrane
protein, which catalyzes the transfer of sialic acids to carbohydrate
groups on glycoproteins and glycolipids. Expression of the ST6GAL-
NAC5 gene is normally restricted to the brain both in mice [34] and
humans [35]. Based on a linkage study [36] the ELTD1 gene has
been implicated in neuropeptide signaling and signal transduction
pathways, making it an important candidate for genetic risk to
cannabis use disorders. TTLL7 is a highly specific enzyme that
performs b-tubulin polyglutamylation [37] and has been suggested as
a candidate gene associated with Alzheimer’s disease [38].
Targeted genome wide association study withsubcutaneous fat thickness in a cohort population
In order to relate these 13 functional genes including 8 neuronal
genes to non-syndromic human obesity, we carried out a SNP
association study for subcutaneous fat content in the human
syntenic region using the recently reported 8,842 individuals of a
Korean cohort data [39]. Unlike BFT measurement in pigs, the
subcutaneous fat in humans was indirectly measured by subscapular
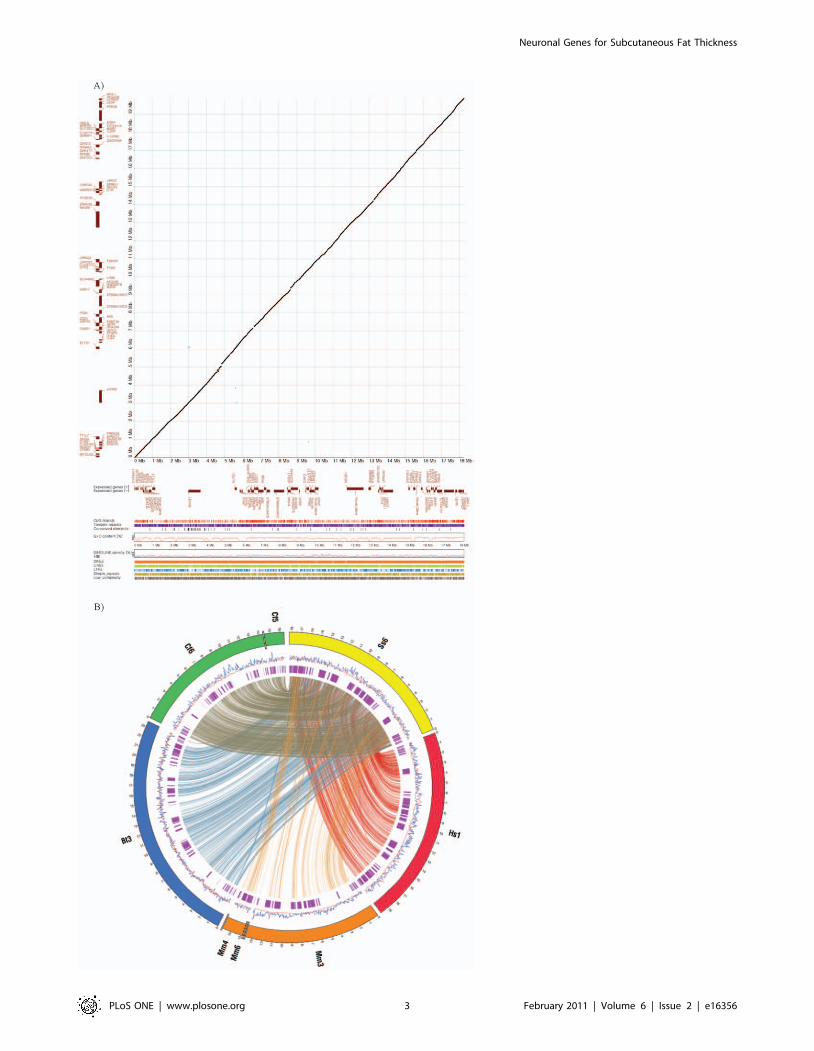
and suprailiac skin-fold thickness (SUB and SUP). A total of 2,143
SNPs passed all quality control filters in the human syntenic region
(Materials and Methods). The genomic control parameter l value in
SUB-SNP association study was 1.037, indicating no overall
inflation of statistical results due to population stratification, while
the l value in the SUP-SNP association study was 1.187 (Figure 4).
After genomic control (GC) correction [40], no evidence of inflation
remained for either of the association studies. Using a false discovery
rate (FDR) q value [41] ,0.05, we identified one SNP located in a
gene family with sequence similarity 73, member A (FAM73A) gene
associated with SUB (rs4121165, GC-corrected p-value =
0.0000175) (Figure 4A and Table S5). The FAM73A gene was
also significantly associated with BFT in pigs. Considering that SUB
is measured in the human back, FAM73A is a strong candidate gene
responsible for subcutaneous back fat thickness in both humans and
pigs. The SNP also showed the strongest association with SUP. To
our knowledge, no biological function of the gene has been
reported. However, based on tissue expression analysis in humans of
the GeneCards (www.genecards.org), the gene seems to be
expressed prominently in the nervous system. After the FDR
correction, there were no significant SNPs associated with the two
skin fold thickness measurements except the SNP in the FAM73A
gene. However, using a GC-corrected p-value threshold of 0.01,
genes containing SNPs with a lower p-value cutoff seem to show
enrichment of the 13 genes (Table S4) associated with pig BFT.
Using the threshold, out of 14 genes containing significant SNPs in
the SUB-SNP association, 7 genes are among 13 functional genes
associated with pig BFT. Likewise in the SUP-SNP association, 4
genes out of 9 belong to those 13 functional genes (Figure 4B and
Table S6). Considering 72 protein coding genes in the region
(probability of success = 13/72), exact binomial probability
observing the given number of genes or more in each result, 7 out
of 14 genes, is 0.0065 for SUB-SNP association and 0.0621 for SUP-
SNP association which is 4 out of 9 genes. Therefore, it is unlikely to
observe this number of common genes by chance in both, the
human and pig association studies especially for the SUB-SNP
association.
Discussion
Measurement error in assessing the skin-fold thickness may be
considerably larger than the BFT measurement in pigs. Skin-fold
thicknesses in human are affected by individual and regional
differences in compressibility that vary with age, gender and recent
weight loss. In addition, pressure from skin-fold caliper measure-
ment may force some adipose tissue lobules to slide into areas of
Figure 2. Comparative genomic analysis of pig QTL region affecting fatness and meat quality on SSC6. Similar genomic structure andcontents was revealed by comparative analysis between the human syntenic region and the pig QTL region (A) and visualization of syntenic blocksalong the region between pig (Ss) and the four other species: human(Hs), mouse(Mm), dog(Cf) and cow(Bt) (B). In the dot-plot analysis (A), proteincoding genes are shown as forward (upper) and reverse (lower) in brown color according to x- and y-axis for pigs and human, respectively. Theconserved segments from 70-100% are plotted. The genomic feature of pig appear in order from top to bottom under dot-plot: CpG islands, Tandemrepeats, G+C content, SINE (blue) and LINE (red) repeat densities using a sliding window of 100 kbp, Interspersed repeat elements (SINEs, LINEs, LTRelements, Simple repeats and Low complextiy). In the synteny maps (B), the rings depict from outside to inside: synteny regions of each chromosome,SINE (blue) and LINE (red) repeat density using a sliding window of 100 kb and protein-coding genes (purple). Genomic coordinates are shown in100 kb intervals. Synteny blocks larger than 5 kb are displayed by connecting lines.doi:10.1371/journal.pone.0016356.g002
Neuronal Genes for Subcutaneous Fat Thickness
PLoS ONE | www.plosone.org 4 February 2011 | Volume 6 | Issue 2 | e16356

lesser pressure. This sliding may be more marked for thick skin-
folds in which the adipose tissue contains little connective tissue
[42]. On the contrary, BFT in pigs are accurately measured with a
ruler between the 10th and 11th rib on the chilled carcass. Because
of these measurement errors, the association study in pigs is likely
to provide higher statistical power than that for humans if they are
under similar conditions except the measurement errors.
Our combined association studies in human and pig in the
predefined fatness related pig QTL region revealed three most likely
genes, FAM73A, NEGR1 and TTLL7, as being responsible for
genetic predisposition to common forms of obesity, especially
subcutaneous fat thickness (Figure 5). The second likely set of genes
for genetic predisposition includes five genes, LPHN2, SLC44A5,
ELTD1, ST6GALNAC3 and GIPC2 (Figure 5). As mentioned
above, two recent GWA studies [7,8] suggested the role of the CNS
in the predisposition to the non-syndromic form of obesity. Our
results strongly support a major involvement of the CNS in the
genetic predisposition, and suggest several neuronal genes as genetic
risk factors for the polygenic common form of obesity (Figure 5).
Except for the NEGR1 gene, to our knowledge, the other neuronal
genes are newly suggested in our research for the genetic association
with obesity related traits. Our findings of candidate causal genes
may provide expanded insight into mechanisms underlying obesity
biology. Further evaluation of these candidate genes in humans and
pig may enable researchers to accelerate gaining knowledge of
genetic factors for common forms of obesity.
Materials and Methods
Ethics statementApproval was granted from relevant review boards in all study
sites; all included subjects gave informed written consent. The
Korea Centers for Disease Control and Prevention’s review board
Figure 3. –log10(p-value) of SNPs in the 18.2 Mb pig genomic region. 52 SNPs were identified to be associated with backfat thickness trait(A), and none of the SNPs were found to be significantly associated with intramuscular fat content (B). Gene locations are shown by bars and genesymbols beneath the figure. Genes on the same side indicate same transcriptional direction of the genes.doi:10.1371/journal.pone.0016356.g003
Neuronal Genes for Subcutaneous Fat Thickness
PLoS ONE | www.plosone.org 5 February 2011 | Volume 6 | Issue 2 | e16356
reviewed and approved the Korean SNP association studies. For
the pigs experiment, the study protocol and standard operating
procedures were reviewed and approved by the National Institute
of Animal Science’s Institutional Animal Care and Use Committee
(No. 2009-077, C-grade).
Pig BAC sequencing and assemblingBAC clones consisting of the 18.2 Mb contigs were screened
from the Korean Native Pig BAC library [43]. The pig BAC end
sequences (BES) corresponding to the syntenic region between 65
Mb and 85 Mb of human chromosome 1 were obtained from Sus
scrofa Project site of the Wellcome Trust Sanger Institute (http://
www.sanger.ac.uk/cgi-bin/Projects/S_scrofa/BESsearch.cgi). A
total of 316 markers were developed from pig BESs with intervals
of 60 kb to screen BAC clones (Table S2). The BAC library was
pooled for 4D-PCR screening [25]. The 4D-PCR screening
consisted of a two-step screening process: the first PCR was
performed on master pools and the second on plate row/column,
well row/column pools in a total volume of 15 mL with 10 ng in
each pool. PCR amplifications were performed in a PTC 200
thermocycler (MJ Research, USA). Thermal cycling parameters
were defined as follows: predenaturation at 95uC for 2 min;
followed by 32 cycles of 95uC for 30 s, annealing temperature for
30 s, and 72uC for 30 s; and then a final step at 72uC for 5 min.
PCR products were separated on a 2% agarose gel containing
ethidium bromide and visualized using a UV light source.
The screened BAC clones were sequenced by a shotgun
strategy. The BAC DNAs were isolated using the Large Construct
Kit (Qiagen, USA). A total of 15 mg BAC DNA was used to obtain
random fragments of 2,3 kb. Fragmentation was performed
using the HydroShear DNA Shearing Device (Genomic Solution,
USA) with the following parameters: 200 mL volume of DNA
solution, 11 speed code, and 20 cycles. Small sizes of the fragments
were removed using the Sizesep 400 spin column (Amersham
Biosciences, USA) and CHROMA SPIN+TE1000 (Clontech,
USA) and were subsequently repaired with DNA polymerase and
the polynucleotide kinase method (BKL Kit; TaKaRa, Japan).
The prepared DNA fragments were cloned into the dephosphor-
ylated SmaI site of pUC19 (Qbiogene, USA). Ligates were
transformed into DH10B by electroporation (Gene Pulser II, Bio-
Rad, USA). Approximately 1000 plasmids in each shotgun DNA
library were randomly selected for sequencing. Plasmid DNAs
Figure 4. –log10(Genomic control-corrected p-value) of 2,143 SNPs associated with SUB (A) and SUP (B) in the human syntenicregion. Using a false discovery rate (FDR) q value ,0.05 [41], a SNP located in FAM73A gene is significantly associated with SUB indicated in red. Thegenomic control parameter l value in SUB-SNP association study was 1.037 and the l value in SUP-SNP association study was 1.187 indicated by theQQ-plots. Genomic control-corrected p-value threshold of 0.01 is indicated by the dotted line.doi:10.1371/journal.pone.0016356.g004
Neuronal Genes for Subcutaneous Fat Thickness
PLoS ONE | www.plosone.org 6 February 2011 | Volume 6 | Issue 2 | e16356

were bi-directionally sequenced for each plasmid with the BigDye
Terminator v3.1 Cycle Sequencing Kit (Applied Biosystems) and
the ABI 3730 automatic sequencer (Applied Biosystems). Se-
quence data were assembled using the PHRAP program
(University of Washington, Seattle, WA, USA). To fill gaps,
primer pairs were designed from the high-quality region with a
PHRAP score greater than 70 on both ends of each contig. PCR
amplifications were performed using appropriate BAC DNA used
to construct the shotgun library as a template. PCR products were
inserted into the pGEM T Easy vector (Promega, USA) and
sequenced. Finishing assembly was performed in Seqman
(DNASTAR, USA). The complete sequences of 126 KNP BAC
clones and 33 unfinished KNP BAC clones were deposited into
EMBL/GenBank (EF488234, FN673706-FN673830, FN674549-
FN675238). A total of 29 CHORI242 BAC clones were selected
from the FPC clone map of the Wellcome Trust Sanger Institute
website to fill the gaps within the KNP BAC clone maps (TableS1). The selected CHORI242 BAC clones were sequenced to up
to 8-fold depth (FN677038-FN677340).
All BAC clone sequences were assembled with Seqman to
construct continuous genomic sequences. The representative
genome sequence of approximately 18.2 Mb mainly consisted of
KNP BAC clone sequences. The pig genome sequences of Sscrofa9
produced by Swine Genome Sequencing Consortium were used to
replace the remaining gaps within the BAC clone contigs (ftp://ftp.
ensembl.org/pub/current_fasta/sus_scrofa/dna/).
Sequence annotation and comparative genome analysisThe genomic sequence of 18,261,618 bp was used to predict
putative genes using de novo gene prediction programs, that is,
GENSCAN [44], AUGUSTUS [45] and GeneMark.hmm [46].
For cis-alignment analysis, the Sus scrofa UniGene build 38 and
expressed sequence tag (EST) sequences were downloaded from
NCBI. Then, the ESTs were aligned against the sequenced
genome using BLAT [47] and filtered by 98% coverage cutoff. For
trans-alignment, human and mouse protein sequences from the
UniProtKB database (http://www.uniprot.org/downloads) were
aligned against the sequenced genome using BLAT [47] and
filtered by 95% coverage cutoff. To eliminate false positive gene
findings, de novo genes which included EST-aligned or trans-
aligned genomic region were selected in the annotation process.
Final gene annotation was determined by careful manual
inspection.
To perform comparative genome analysis, we downloaded the
assembled genome sequences: Human (1:65,592,395-85,484,668);
Mouse (4:101,091,882-102,963,468, 6:67,372,926-66,971,344,
Figure 5. Summary of genes identified in our combined association studies in humans and pigs in the predefined fatness relatedpig QTL region. Intersection of the three association studies show three most likely genes, FAM73A, NEGR1 and TTLL7, as being responsible forgenetic predisposition to common forms of obesity, especially subcutaneous fat thickness. Eight neuronal genes identified in the pig SNP-BFTassociation study are indicated in pink.doi:10.1371/journal.pone.0016356.g005
Neuronal Genes for Subcutaneous Fat Thickness
PLoS ONE | www.plosone.org 7 February 2011 | Volume 6 | Issue 2 | e16356

3:145,804,770-159,502,701); Cow (3:62,655,270-86,200,728); Dog
(5:46,172,737-48,121,421, 6:65,987,112-80,443,206) from the
UCSC Genome Browser [48]. The numbers in each parenthesis
indicate chromosome number and bp locations of the chromo-
some. To mask interspersed repeats and low complexity regions,
the RepeatMasker program (http://www.repeatmasker.org) was
used with the -xsmall option for each corresponding library. With
masked genome sequences, the BLASTZ alignment program [49]
was used to define the map of conserved synteny using the ‘‘C = 2
T = 1 H = 2200 Z = 10’’ option to align each of the genomes to the
Pig sequence. GC content density was calculated by using 100 kb
non-overlapping bins along each chromosome. For identifying
clusters of CpG dinucleotides in GC content-rich regions, we used
the CpG island searcher program (CpGi130) with criteria (GC
content .50%, ObsCpG/ExpCpG .0.60, and length .200 bp)
[50]. To visualize the global distribution of synteny blocks along
the genome, we used the CIRCOS visualization program [51] and
a dotplot analysis program, custom-made with a perl script using
BLASTZ result.
Pigs and SNP association studies with backfat thicknessand intramuscular fat traits
Five Korean native (domesticated wild) sires and ten
Landrace dams were used to produce a three-generation
pedigree at the National Institute of Animal Science, Rural
Development Administration (RDA). Among the F1s, ten boars
were randomly chosen and mated with up to six F1 sows to
generate 38 full-sib F2 families [52,53]. DNA samples were
obtained from a total of 527 F2 progeny and genotyped with the
iSelect Infinium Porcine ArrayChips (Illumina, San Diego, CA,
USA). Intramuscular fat content (IMF) and backfat thickness
(BFT) traits were analyzed to find the significant SNPs on an
18.2 Mb genomic sequence between SW2098 and SW1881 on
pig chromosome 6. IMF was determined in a sample of
longissimus muscle, and BFT was measured between the 10th
and 11th rib. Average values (6 standard deviation) for the IMF
and BFT in the F2s were 2.21% (62.76%) and, 24.1 mm
(68.1 mm) respectively [52,53]. Genomic DNA was isolated
from blood samples using the Wizard Genomic DNA Purifica-
tion Kit (Promega, Madison, WI, USA). A total of 451 SNPs out
of 62,163 SNP probes were mapped on the 18.2 Mb genomic
sequence (88,750,779 bp-103,764,358 bp) by BLAT (minIden-
tity = 97, tGapCount #1 and 39end match).
A goodness of fit chi-square test was used to test Hardy-
Weinberg equilibrium (HWE) by comparing the observed number
of subjects for each genotype with the expected number of subjects
assuming HWE and so genotype distributions were tested at each
polymorphic locus for departure from HWE. SNPs were screened
out at p-value ,0.001 via HWE tests. We excluded SNPs with
.5% missing genotypes and with minor allele frequencies ,5%.
As a result, 235 SNPs in chromosome 6 passed our quality control
filters and a total of 527 pig individuals were included in the
analysis.
SNP association analyses of the 18.2 Mb region with BFT and
IMF in the pigs were performed using the genomewide rapid
association mixed model and regression (GRAMMAR) approach
[54]. The basic idea of this GRAMMAR is to perform a single
polygenic analysis using the complete pedigree but ignoring
marker data. Subsequently, residuals from the polygenic analysis,
which are adjusted for polygenic covariation and fixed effects are
used as the quantitative phenotype for whole genome association
study. In the initial step, the data are analyzed under the mixed
model in ASREML [55].
Yijk~mzSizb1Djzakzeijk ð1Þ
where Yijk is the trait measured in the kth animal of ith sex and jth age
at slaughter days; m is an overall mean, Si is the fixed effect of ith
sex, b1 is a regression coefficient, Dj is covariate for the age at
slaughter days, ak is additive genetic (polygenic) effect of kth animal,
fitted as a random effect and eijk is the random residual error. The
variance for additive genetic (polygenic) effects of animals is
defined as Var (a) = Asa based on the pedigree of the offspring
and sa is the additive genetic variance due to polygenes [56]. For
the residual random effects, the variance is defined as Is2e, where I
is the identity matrix and s2e is the residual variance. The
residuals from this analysis are given by
eei~Yijk{(mmzSSizbb1Djzaak)
where SSi and bb1 are the estimates of sex and age effects and aaj is
the estimated contribution from the polygene (breeding value). In
the second step for the whole genome association study, these
residuals are used as the phenotype in a simple linear regression
for each SNP (g i),
eei~mzb2gizei ð2Þ
where eei is the vector of residuals from model (1), m is the mean, g
is the vector of genotypes at the marker i, b2 is the marker
genotype effect and ei is the vector of random residuals. This
approach is called GRAMMAR [54].
The simple linear regression analysis was performed in the R/
SNPassoc package [57]. Markers with a test statistic exceeding a
threshold corresponding to a p-value below the region-wise
Bonferroni corrected significance threshold (0.05/#SNPs) were
selected for the final test using the full animal model in ASREML
[55]:
Yijkl~mzSizb1Djzb2gkzalzeijkl ð3Þ
where Yijkl is the trait measured in the lth animal of ith sex, jth age at
slaughter days and kth genotype; m is an overall mean, Si is the fixed
effect of ith sex, b1 is a regression coefficient, Dj is covariate for the
age at slaughter days, b2 is the marker genotype effect, gk is the
vector of genotypes at the marker k, al is additive genetic
(polygenic) effect of lth animal, fitted as a random effect and eijkl
is the random residual error. Additive genetic covariances among
animals and residual variance are described in the model (1).
SNP association study of subcutaneous fat thickness inhuman
The Korea Association Resource (KARE) project was initiated
in 2007 to undertake large-scale GWA analyses. Participants in
this project were recruited from two community-based cohorts
(i.e., the rural Ansung and urban Ansan cohorts) in the Gyeonggi
Province of South Korea. The Ansung and Ansan cohorts consist
of 5,018 and 5,020 participants, respectively, ranging in age from
40 to 69 years. Genomic DNAs was isolated from peripheral blood
drawn from the participants and genotyped on the Affymetrix
Genome-Wide Human SNP array 5.0 containing 500,568 SNPs.
Prior to the analysis, we performed genotype calling and quality
control as previously described in Cho et al. [39]. After sample and
SNP quality controls, a total of 8,842 individuals and 2,143 SNPs
in the human syntenic region were included in the association
Neuronal Genes for Subcutaneous Fat Thickness
PLoS ONE | www.plosone.org 8 February 2011 | Volume 6 | Issue 2 | e16356

studies. Subcutaneous fat in humans was indirectly measured by
subscapular and suprailiac skin-fold thickness (SUB and SUP) for
the SNP association study. To perform a SNP association study
with skin-fold thickness measurement, data transformation of the
actual skin-fold thickness measurement is desirable because the
frequency distribution of most skin-fold measurements is skewed,
and the relationship of body density to skin-folds may not be
rectilinear because of a larger proportion of the body fat which is
deposited subcutaneously with increasing obesity [58]. Natural
logarithmic transformation for SUB measurement and square root
transformation for SUP measurement was performed in which the
assumption of normal distribution was more reasonable for each
trait. Linear regression analysis was performed in an additive
model using PLINK [59], including sex, age and geographic
region as covariates. The p-values were adjusted by a genomic
control method [40] and followed by FDR [41] corrections as
implemented in PLINK [59]. As described in the result, we could
not find significant SNP associations except one SNP of the traits.
Thus we used GC-corrected p-value threshold of 0.01 to
summarize the top highest SNP associations with the traits in
human and test enrichment of significant genes in pigs.
Supporting Information
Table S1 References of each QTL region indicated in the
Figure 1.
(DOC)
Table S2 List of sequence-tagged sites (STSs) designed used to
screen bacterial artificial chromosome (BAC) clones. The STSs
were designed from BAC end sequences (BES) mapped on
PigMap corresponding to human genomic region between 65 Mb
and 85 Mb in chromosome 1.
(DOC)
Table S3 List of gene annotation in the pig 18.2 Mb region.
(DOC)
Table S4 List of SNPs significantly associated with the backfat
thickness trait in the 18.2 Mb region.
(DOC)
Table S5 List of SNPs associated with subscapular skin-fold
thickness at the threshold of genomic control-corrected p-value
0.01.
(DOC)
Table S6 List of SNPs associated with suprailiac skin-fold
thickness at the threshold of genomic control-corrected p-value
0.01.
(DOC)
Acknowledgments
We are grateful to Richard Clark, the Wellcome Trust Sanger Institute, for
providing 30 CHORI242 BAC clones and the International Swine
Genome Sequencing Consortium for Build 9 porcine genome sequence.
Author Contributions
Conceived and designed the experiments: KTL THK HK. Performed the
experiments: MJB KSK EWP HSP JTJ BHC GWJ SHC DWK DL HSP
MRP. Analyzed the data: SHL WCP DHS SC HYK KWK THL JEP
KTL HK JO LBS. Wrote the paper: KTL JO LBS HK.
References
1. Kijas JM, Andersson L (2001) A phylogenetic study of the origin of the domesticpig estimated from the near-complete mtDNA genome. J Mol Evol 52: 302–308.
2. Larson G, Dobney K, Albarella U, Fang M, Matisoo-Smith E, et al. (2005)Worldwide phylogeography of wild boar reveals multiple centers of pig
domestication. Science 307: 1618–1621.
3. Spurlock ME, Gabler NK (2008) The development of porcine models of obesity
and the metabolic syndrome. J Nutr 138: 397–402.
4. Lakka TA, Lakka HM, Salonen R, Kaplan GA, Salonen JT (2001) Abdominal
obesity is associated with accelerated progression of carotid atherosclerosis inmen. Atherosclerosis 154: 497–504.
5. Kenchaiah S, Evans JC, Levy D, Wilson PW, Benjamin EJ, et al. (2002) Obesity
and the risk of heart failure. N Engl J Med 347: 305–313.
6. Kahn SE, Hull RL, Utzschneider KM (2006) Mechanisms linking obesity to
insulin resistance and type 2 diabetes. Nature 444: 840–846.
7. Thorleifsson G, Walters GB, Gudbjartsson DF, Steinthorsdottir V, Sulem P,
et al. (2009) Genome-wide association yields new sequence variants at seven locithat associate with measures of obesity. Nat Genet 41: 18–24.
8. Willer CJ, Speliotes EK, Loos RJ, Li S, Lindgren CM, et al. (2009) Six new lociassociated with body mass index highlight a neuronal influence on body weight
regulation. Nat Genet 41: 25–34.
9. Neugebauer N, Luther H, Reinsch N (2010) Parent-of-origin effects cause
genetic variation in pig performance traits. Animal 4: 672–681.
10. Suzuki K, Inomata K, Katoh K, Kadowaki H, Shibata T (2009) Genetic
correlations among carcass cross-sectional fat area ratios, production traits,intramuscular fat, and serum leptin concentration in Duroc pigs. Journal of
Animal Science 87: 2209–2215.
11. Malek M, Dekkers J, Lee H, Baas T, Prusa K, et al. (2001) A molecular genome
scan analysis to identify chromosomal regions influencing economic traits in thepig. II. Meat and muscle composition. Mammalian Genome 12: 637–645.
12. Ovilo C, Oliver A, Noguera J, Clop A, Barragan C, et al. (2002) Test forpositional candidate genes for body composition on pig chromosome 6. Genetics
Selection Evolution 34: 465–479.
13. Szyda J, Grindflek E, Liu Z, Lien S (2003) Multivariate mixed inheritance
models for QTL detection on porcine chromosome 6. Genetics Research 81:65–73.
14. de Koning D, Janss L, Rattink A, van Oers P, de Vries B, et al. (1999) Detectionof quantitative trait loci for backfat thickness and intramuscular fat content in
pigs (Sus scrofa). Genetics 152: 1679.
15. Gerbens F, Van Erp A, Harders F, Verburg F, Meuwissen T, et al. (1999) Effect
of genetic variants of the heart fatty acid-binding protein gene on intramuscularfat and performance traits in pigs. Journal of Animal science 77: 846.
16. De Koning D, Rattink A, Harlizius B, van Arendonk J, Brascamp E, et al. (2000)Genome-wide scan for body composition in pigs reveals important role of
imprinting. Proceedings of the National Academy of Sciences 97: 7947.
17. Gerbens F, De Koning D, Harders F, Meuwissen T, Janss L, et al. (2000) The
effect of adipocyte and heart fatty acid-binding protein genes on intramuscularfat and backfat content in Meishan crossbred pigs. Journal of Animal science 78:
552.
18. Ovilo C, Perez-Enciso M, Barragan C, Clop A, Rodriguez C, et al. (2000) AQTL for intramuscular fat and backfat thickness is located on porcine
chromosome 6. Mammalian Genome 11: 344–346.
19. Grindflek E, Szyda J, Liu Z, Lien S (2001) Detection of quantitative trait loci formeat quality in a commercial slaughter pig cross. Mammalian Genome 12:
299–304.
20. Uleberg E, Widerøe I, Grindflek E, Szyda J, Lien S (2005) Fine mapping of aQTL for intramuscular fat on porcine chromosome 6 using combined linkage
and linkage disequilibrium mapping. Journal of Animal Breeding and Genetics
122: 1–6.
21. Ovilo C, Fernandez A, Noguera J, Barragan C, Leton R, et al. (2005) Finemapping of porcine chromosome 6 QTL and LEPR effects on body composition
in multiple generations of an Iberian by Landrace intercross. Genetics Research85: 57–67.
22. Mohrmann M, Roehe R, Susenbeth A, Baulain U, Knap P, et al. (2006)
Association between body composition of growing pigs determined by magneticresonance imaging, deuterium dilution technique, and chemical analysis. Meat
Science 72: 518–531.
23. Edwards D, Ernst C, Raney N, Doumit M, Hoge M, et al. (2007) QTL mapping
in an F2 Duroc x Pietrain resource population: II. Carcass and meat qualitytraits. Journal of Animal science.
24. Jeon AT, Park EW, Jeon HJ, Kim TH, Lee KT, et al. (2003) A large-insert
porcine library with sevenfold genome coverage: a tool for positional cloning ofcandidate genes for major quantitative traits. Molecules and Cells 16: 113–116.
25. Asakawa S, Abe I, Kudoh Y, Kishi N, Wang YM, et al. (1997) Human BAC
library: Construction and rapid screening. Gene 191: 69–79.
26. Marg A, Sirim P, Spaltmann F, Plagge A, Kauselmann G, et al. (1999)Neurotractin, a novel neurite outgrowth-promoting Ig-like protein that interacts
with CEPU-1 and LAMP. J Cell Biol 145: 865–876.
27. Schafer M, Brauer AU, Savaskan NE, Rathjen FG, Brummendorf T (2005)Neurotractin/kilon promotes neurite outgrowth and is expressed on reactive
astrocytes after entorhinal cortex lesion. Mol Cell Neurosci 29: 580–590.
28. Hediger MA, Romero MF, Peng JB, Rolfs A, Takanaga H, et al. (2004) TheABCs of solute carriers: physiological, pathological and therapeutic implications
Neuronal Genes for Subcutaneous Fat Thickness
PLoS ONE | www.plosone.org 9 February 2011 | Volume 6 | Issue 2 | e16356
of human membrane transport proteinsIntroduction. Pflugers Arch 447:
465–468.29. Dahlin A, Royall J, Hohmann JG, Wang J (2009) Expression Profiling of the
Solute Carrier Gene Family in the Mouse Brain. Journal of Pharmacology and
Experimental Therapeutics 329: 558–570.30. Millar JK, Pickard BS, Mackie S, James R, Christie S, et al. (2005) DISC1 and
PDE4B are interacting genetic factors in schizophrenia that regulate cAMPsignaling. Science 310: 1187–1191.
31. Kahler AK, Otnaess MK, Wirgenes KV, Hansen T, Jonsson EG, et al. (2010)
Association study of PDE4B gene variants in Scandinavian schizophrenia andbipolar disorder multicenter case-control samples. Am J Med
Genet B Neuropsychiatr Genet 153B: 86–96.32. Hodgkinson CA, Enoch MA, Srivastava V, Cummins-Oman JS, Ferrier C, et al.
(2010) Genome-wide association identifies candidate genes that influence thehuman electroencephalogram. Proc Natl Acad Sci U S A 107: 8695–8700.
33. Lang J, Ushkaryov Y, Grasso A, Wollheim CB (1998) Ca2+-independent insulin
exocytosis induced by alpha-latrotoxin requires latrophilin, a G protein-coupledreceptor. EMBO J 17: 648–657.
34. Okajima T, Fukumoto S, Ito H, Kiso M, Hirabayashi Y, et al. (1999) Molecularcloning of brain-specific GD1alpha synthase (ST6GalNAc V) containing CAG/
Glutamine repeats. J Biol Chem 274: 30557–30562.
35. Bos PD, Zhang XH, Nadal C, Shu W, Gomis RR, et al. (2009) Genes thatmediate breast cancer metastasis to the brain. Nature 459: 1005–1009.
36. Agrawal A, Pergadia ML, Saccone SF, Lynskey MT, Wang JC, et al. (2008) Anautosomal linkage scan for cannabis use disorders in the nicotine addiction
genetics project. Arch Gen Psychiatry 65: 713–721.37. Ikegami K, Mukai M, Tsuchida J, Heier RL, MacGregor GR, et al. (2006)
TTLL7 is a mammalian beta-tubulin polyglutamylase required for growth of
MAP2-positive neurites. J Biol Chem 281: 30707–30716.38. Heinzen EL, Need AC, Hayden KM, Chiba-Falek O, Roses AD, et al. (2010)
Genome-wide scan of copy number variation in late-onset Alzheimer’s disease.J Alzheimers Dis 19: 69–77.
39. Cho YS, Go MJ, Kim YJ, Heo JY, Oh JH, et al. (2009) A large-scale genome-
wide association study of Asian populations uncovers genetic factors influencingeight quantitative traits. Nat Genet 41: 527–534.
40. Devlin B, Roeder K (1999) Genomic control for association studies. Biometrics55: 997–1004.
41. Benjamini Y, Hochberg Y (1995) Controlling the false discovery rate: a practicaland powerful approach to multiple testing. Journal of the Royal Statistical
Society Series B (Methodological) 57: 289–300.
42. Nagy E, Vicente-Rodriguez G, Manios Y, Beghin L, Iliescu C, et al. (2008)Harmonization process and reliability assessment of anthropometric measure-
ments in a multicenter study in adolescents. Int J Obes (Lond) 32 Suppl 5:S58–65.
43. Jeon JT, Park EW, Jeon HJ, Kim TH, Lee KT, et al. (2003) A large-insert
porcine library with sevenfold genome coverage: a tool for positional cloning of
candidate genes for major quantitative traits. Mol Cells 16: 113–116.
44. Burge CB, Karlin S (1998) Finding the genes in genomic DNA. Curr Opin
Struct Biol 8: 346–354.
45. Stanke M, Steinkamp R, Waack S, Morgenstern B (2004) AUGUSTUS: a web
server for gene finding in eukaryotes. Nucleic Acids Res 32: W309–312.
46. Lomsadze A, Ter-Hovhannisyan V, Chernoff YO, Borodovsky M (2005) Gene
identification in novel eukaryotic genomes by self-training algorithm. Nucleic
Acids Res 33: 6494–6506.
47. Kent WJ (2002) BLAT–the BLAST-like alignment tool. Genome Res 12:
656–664.
48. Schneider KL, Pollard KS, Baertsch R, Pohl A, Lowe TM (2006) The UCSC
Archaeal Genome Browser. Nucleic Acids Res 34: D407–410.
49. Schwartz S, Kent WJ, Smit A, Zhang Z, Baertsch R, et al. (2003) Human-mouse
alignments with BLASTZ. Genome Res 13: 103–107.
50. Takai D, Jones PA (2003) The CpG island searcher: a new WWW resource. In
Silico Biol 3: 235–240.
51. Krzywinski M, Schein J, Birol I, Connors J, Gascoyne R, et al. (2009) Circos: an
information aesthetic for comparative genomics. Genome Res 19: 1639–1645.
52. Choy Y, Jeon G, Kim T, Choi B, Chung H (2002) Ear type and coat color on
growth performances of crossbred pigs. Asian-australasian journal of animal
sciences 15: 1178–1181.
53. Choy YH, Jeon GJ, Kim TH, Choi BH, Cheong IC, et al. (2002) Genetic
Analyses of Carcass Characteristics in Crossbred Pigs: Cross between Landrace
Sows and Korean Wild Boars Asian-Aust J Anim Sci 15: 1080–1084.
54. Aulchenko YS, de Koning DJ, Haley C (2007) Genomewide rapid association
using mixed model and regression: a fast and simple method for genomewide
pedigree-based quantitative trait loci association analysis. Genetics 177:
577–585.
55. Gilmour A, Gogel B, Cullis B, Thompson R (2006) ASReml user guide release
2.0. UK: VSN International Ltd, Hemel Hempstead.
56. Henderson C, Guelph Uo (1984) Applications of linear models in animal
breeding: Canada: University of Guelph Guelph.
57. Gonzalez JR, Armengol L, Sole X, Guino E, Mercader JM, et al. (2007)
SNPassoc: an R package to perform whole genome association studies.
Bioinformatics 23: 644–645.
58. Durnin JV, Womersley J (1974) Body fat assessed from total body density and its
estimation from skinfold thickness: measurements on 481 men and women aged
from 16 to 72 years. Br J Nutr 32: 77–97.
59. Purcell S, Neale B, Todd-Brown K, Thomas L, Ferreira MA, et al. (2007)
PLINK: a tool set for whole-genome association and population-based linkage
analyses. Am J Hum Genet 81: 559–575.
Neuronal Genes for Subcutaneous Fat Thickness
PLoS ONE | www.plosone.org 10 February 2011 | Volume 6 | Issue 2 | e16356
Top Related