


Languages
Pages
Legal

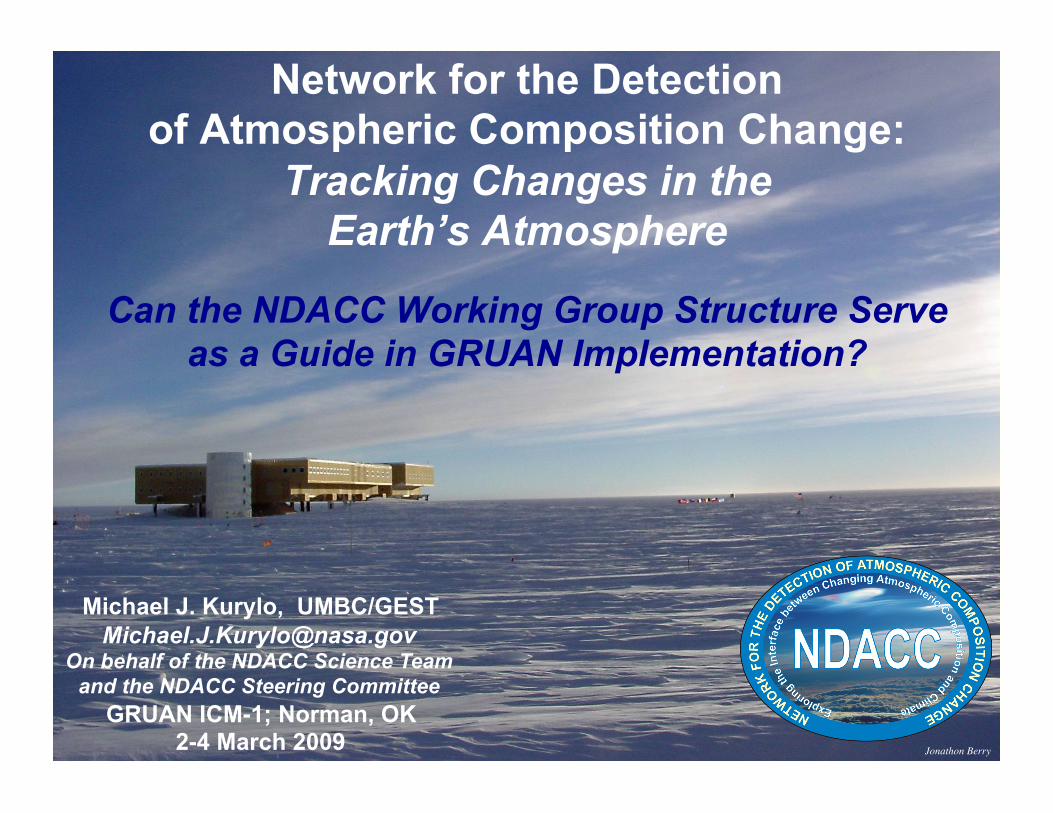
Network for the Detection of Atmospheric Composition Change:
Tracking Changes in the Earth’s Atmosphere
Can the NDACC Working Group Structure Serve as a Guide in GRUAN Implementation?
Jonathon Berry
Michael J. Kurylo, UMBC/GEST [email protected]
On behalf of the NDACC Science Team and the NDACC Steering Committee
GRUAN ICM-1; Norman, OK 2-4 March 2009
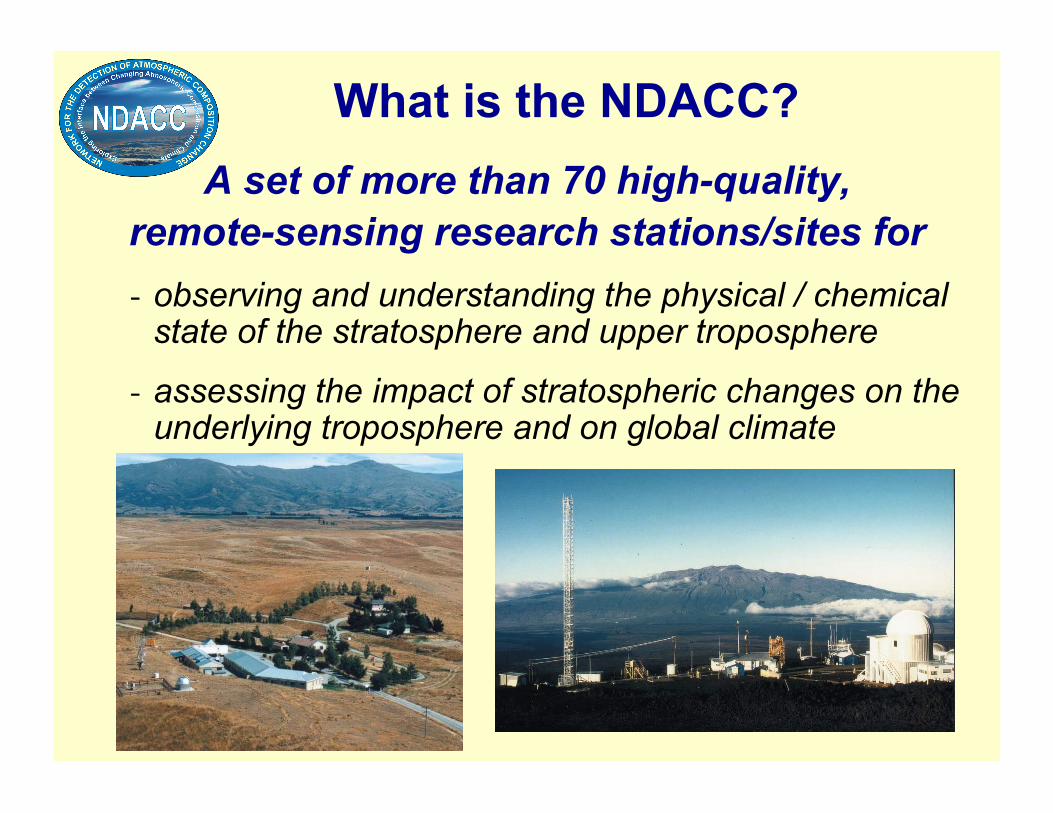
What is the NDACC? A set of more than 70 high-quality,
remote-sensing research stations/sites for - observing and understanding the physical / chemical
state of the stratosphere and upper troposphere
- assessing the impact of stratospheric changes on the underlying troposphere and on global climate
1. To study the temporal and spatial variability of atmospheric composition and structure
2. To provide early detection and subsequent long-term monitoring of changes in the chemical and physical state of the stratosphere and upper troposphere, thereby providing the means to discern and understand the causes of such changes
3. To establish the links between changes in stratospheric O3, UV radiation at the ground, tropospheric chemistry, and climate
Goals of the NDACC
4. To provide independent validation, calibration, and complementary data for space-based sensors of the atmosphere
5. To support process-study field campaigns occurring at various latitudes and seasons
6. To provide verified data for testing and improving multidimensional chemistry and transport models of the stratosphere and troposphere
Goals of the NDACC

Quality Control
A Commitment to Data Quality
• Investigators subscribe to protocols designed to ensure that archived data are of as high a quality as possible within the constraints of measurement technology and retrieval theory.
• Validation – Instruments and data analysis methods are
evaluated and continuously monitored. – Formal intercomparisons are used to
evaluate algorithms and instruments.

Data Archiving and Availability
• Data are submitted to the Data Host Facility within one year of measurement
• Data are publicly available within two years of measurement – However, many PIs approve immediate availability
upon submission to the DHF
• Many NDACC data are available on shorter timescale via collaborative arrangement with the appropriate PIs.
NDACC Operational Structure
NDACC Steering Committee • Primary managerial body
− Two Co-Chairs − Science Team Working Group Representatives − Peer Reviewers and Cooperating Network Representatives − Ex-Officio Representatives from Sponsoring / Partnering
International Agencies / Institutions
NDACC Science Team • Forum for Conducting Network Operations
− PIs from All Sites / Stations − Coordinated through Working Groups (WGs) – Annual Meetings
o Specific Instrument Types o Measurement Parameter / Species (currently O3 & H2O) o Relevant Activities (Satellites, Theory & Modeling, etc.) o Ad Hoc (Future Measurement Strategies and Emphases)
Instrument WG Functions
Measurement Quality Control • Protocol Development
− Instrument-specific Performance Requirements − Validation − Calibration
• Recommendations on Proposed Affiliations • Instrument / Measurement Intercomparison Campaigns • Algorithm Intercomparisons
− Decisions on Common Basis Parameters
Data Reporting and Archiving • Adherence to Data Protocol • Archiving Formats • Consistency in Reporting the Same Quantity
− Important in Utilizing Measurements from Existing Networks
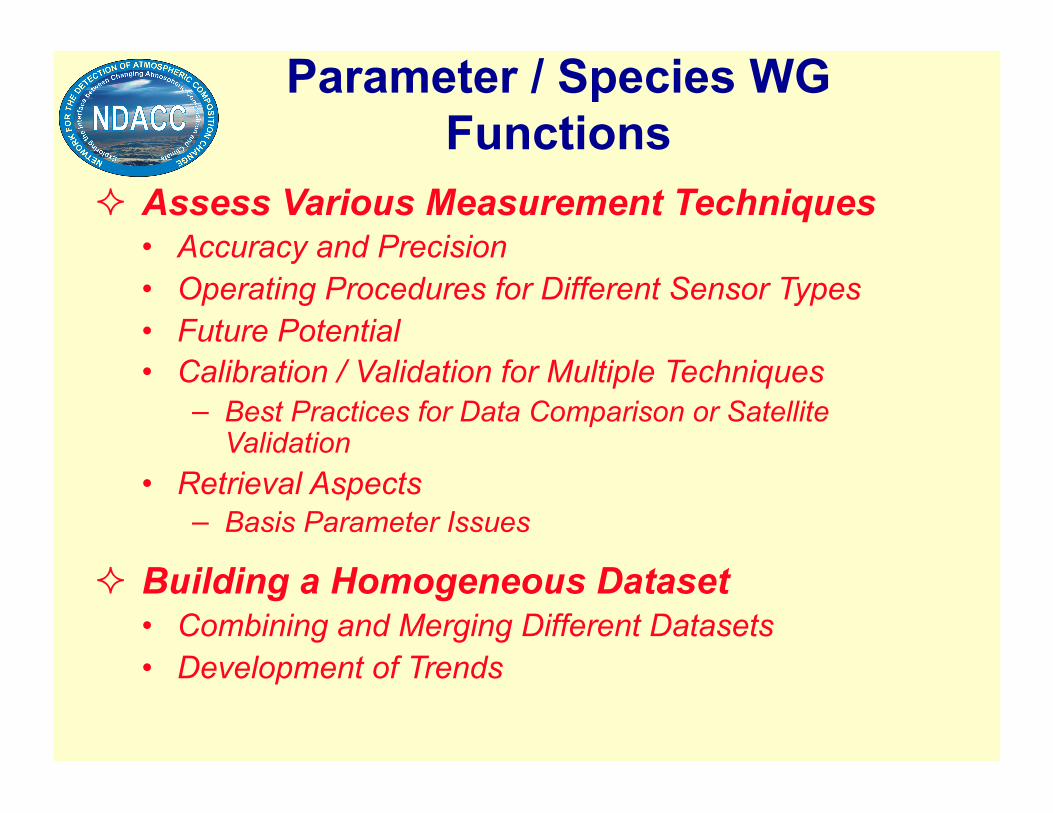
Parameter / Species WG Functions
Assess Various Measurement Techniques • Accuracy and Precision • Operating Procedures for Different Sensor Types • Future Potential • Calibration / Validation for Multiple Techniques
− Best Practices for Data Comparison or Satellite Validation
• Retrieval Aspects − Basis Parameter Issues
Building a Homogeneous Dataset • Combining and Merging Different Datasets • Development of Trends
Examples from NDACC Ozone and Water Vapor
Working Group Meetings
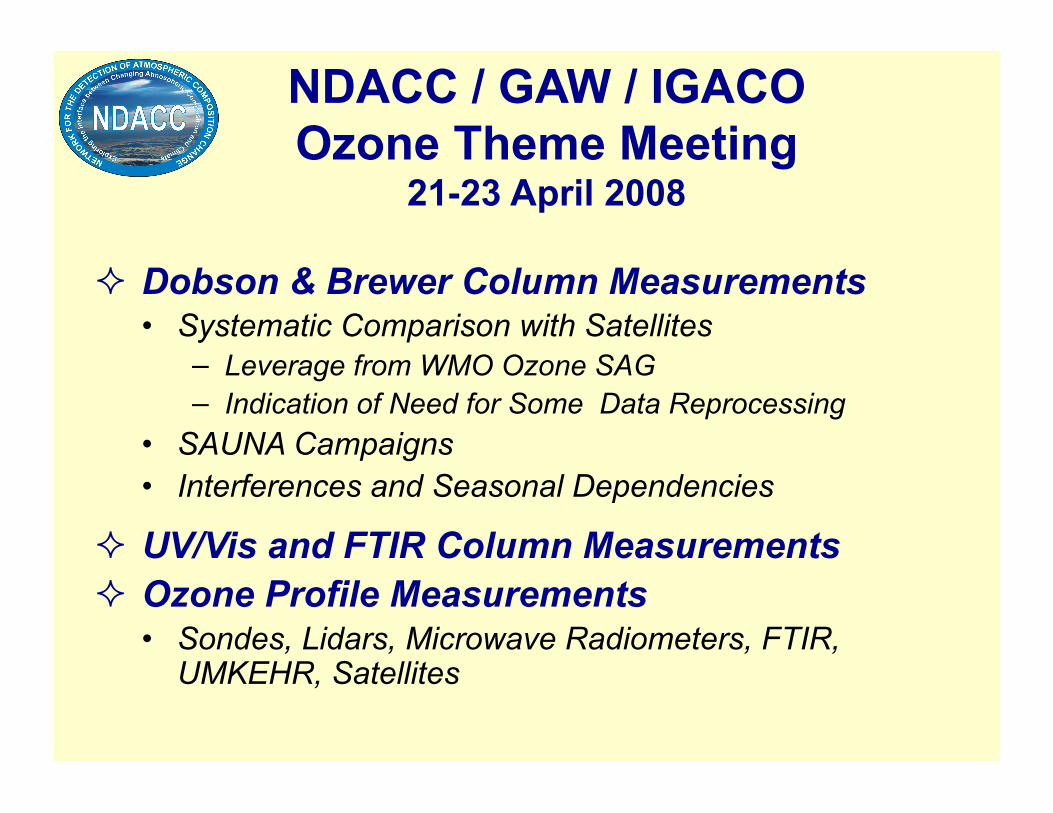
NDACC / GAW / IGACO Ozone Theme Meeting
21-23 April 2008
Dobson & Brewer Column Measurements • Systematic Comparison with Satellites
− Leverage from WMO Ozone SAG − Indication of Need for Some Data Reprocessing
• SAUNA Campaigns • Interferences and Seasonal Dependencies
UV/Vis and FTIR Column Measurements Ozone Profile Measurements
• Sondes, Lidars, Microwave Radiometers, FTIR, UMKEHR, Satellites
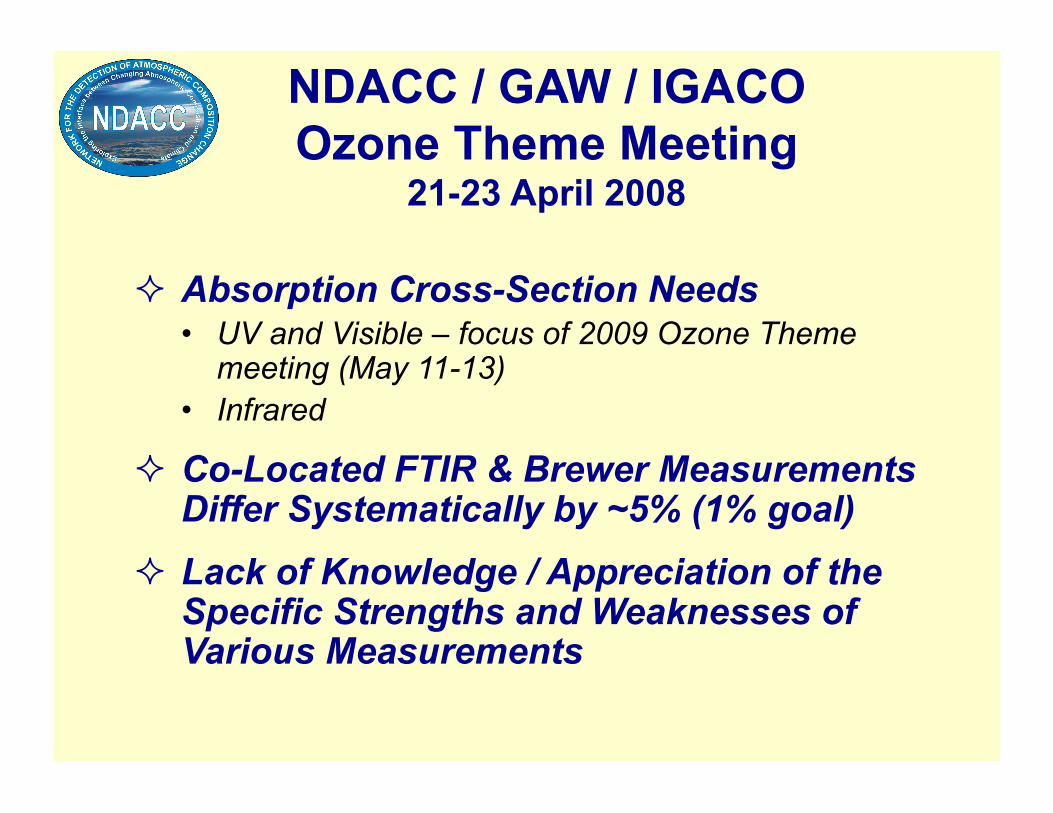
Absorption Cross-Section Needs • UV and Visible – focus of 2009 Ozone Theme
meeting (May 11-13) • Infrared
Co-Located FTIR & Brewer Measurements Differ Systematically by ~5% (1% goal)
Lack of Knowledge / Appreciation of the Specific Strengths and Weaknesses of Various Measurements
NDACC / GAW / IGACO Ozone Theme Meeting
21-23 April 2008

• The global total ozone network started in the 1950’s, using Dobson spectrophotometers; Brewer spectrophotometers have been in use since the early 1980’s.
• In the first decade all Dobsons were operated with the factory constants; performance was essentially not controlled by regular intercomparisons with well-calibrated instruments (e.g., reference or standard Dobsons).
• In the 1970’s, when the importance of high quality data in ozone research and monitoring was recognized and subsequently larger differences between instruments had been detected, more and more but still sporadic Dobson Intercomparison Campaigns (DIC) were conducted.
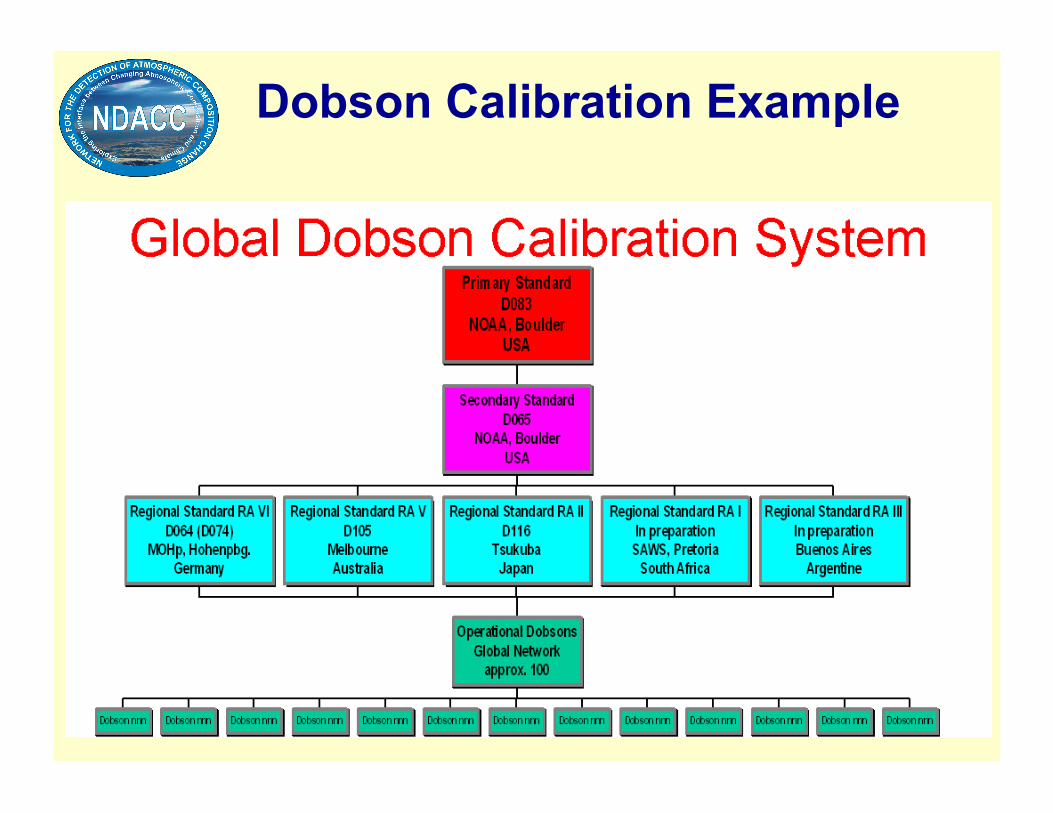
Dobson Calibration Example

• Since the 1980’s a preliminary calibration system was developed and established under NOAA. DIC’s were organized more often and regularly.
• After integration of the Dobson network into the WMO GAW this preliminary calibration system became part of the QA/QC task of GAW. This process gave a fresh impetus to develop and improve the currently existing calibration system. The responsibility of the World Dobson Calibration Center WDCC (NOAA, GMD, Boulder) for organization and implementation of most of the international campaigns was delegated to Regional Dobson Calibration Centers (RDCC), established for each WMO Regional Association. Five RDCC’s, three of which are fully operational, are now responsible for the regular maintenance and calibration services of the Dobsons in their network.
Dobson Calibration Example
Dobson Calibration Example

• The frequency of calibrations has been significantly enhanced, resulting in clear improvements in instrument calibration.
• A similar system for calibration has been now established at least for the European Brewer network.
Dobson Calibration Example

Aim: Investigate, in detail, various aspects of H2O measurements • Accuracy of different sensor types
− in situ (balloon and aircraft) – radiosondes, frost point and Lyman-α hygrometers, …
− remote sensing – FTIR, Raman and DIAL lidars, microwave radiometers, solar and star occultation sensors, …
• Calibration issues • Spectroscopic issues • Retrieval aspects - volume mixing ratios, number
density, averaging kernels, altitude resolution, … • Synergy of combining and merging data obtained by
different techniques • Validation and campaigns
2005: Inception of NDACC Working Group on Water Vapor
Three workshops conducted (July 2006, February 2008, September 2008)
International team on H2O established within
Team Lead - Nik Kämpfer
2005: NDACC Steering Committee Establishes a Working Group on H2O
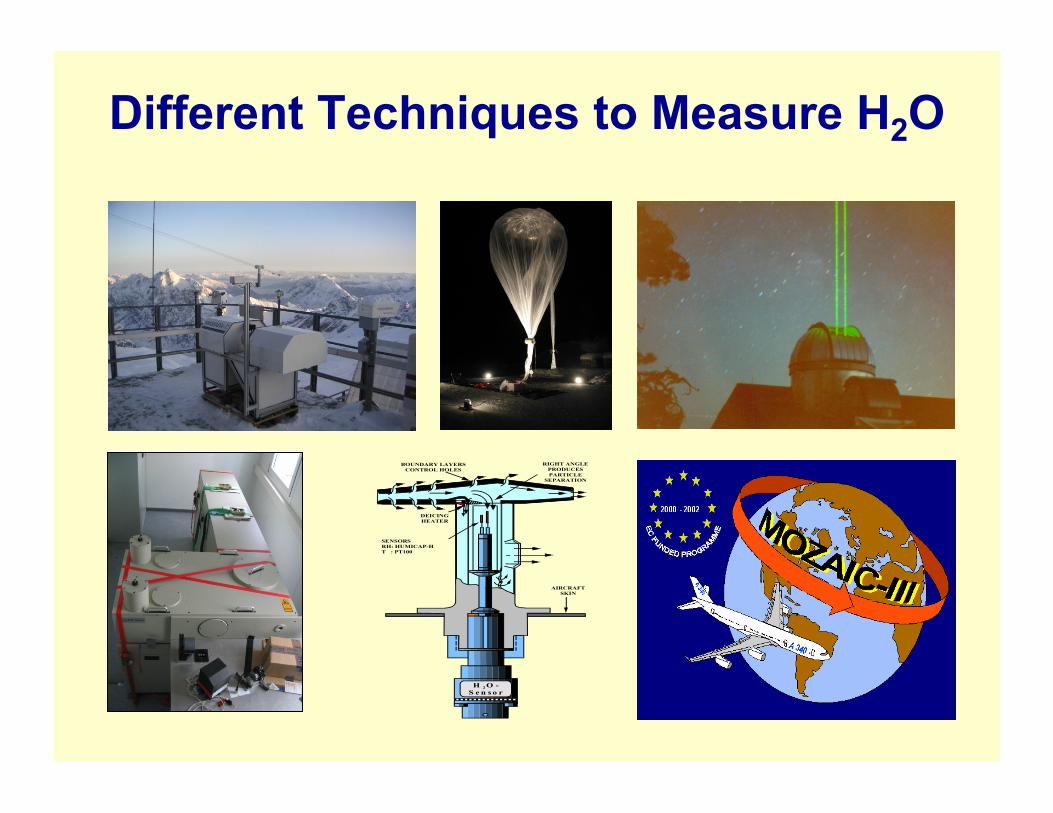
Different Techniques to Measure H2O
H 2 O -S e n s o r
AIRCRAFTSKIN
SENSORSRH: HUMICAP-HT : PT100
DEICINGHEATER
BOUNDARY LAYERSCONTROL HOLES
RIGHT ANGLEPRODUCESPARTICLE
SEPARATION

Lauder: 1994–2008
Seoul: 2006–2008
Mauna Loa : 1996–2008
Bern: 2007–2008
Comparison of NDACC Microwave Instruments with MLS / AURA
Onsala: 2002–2008
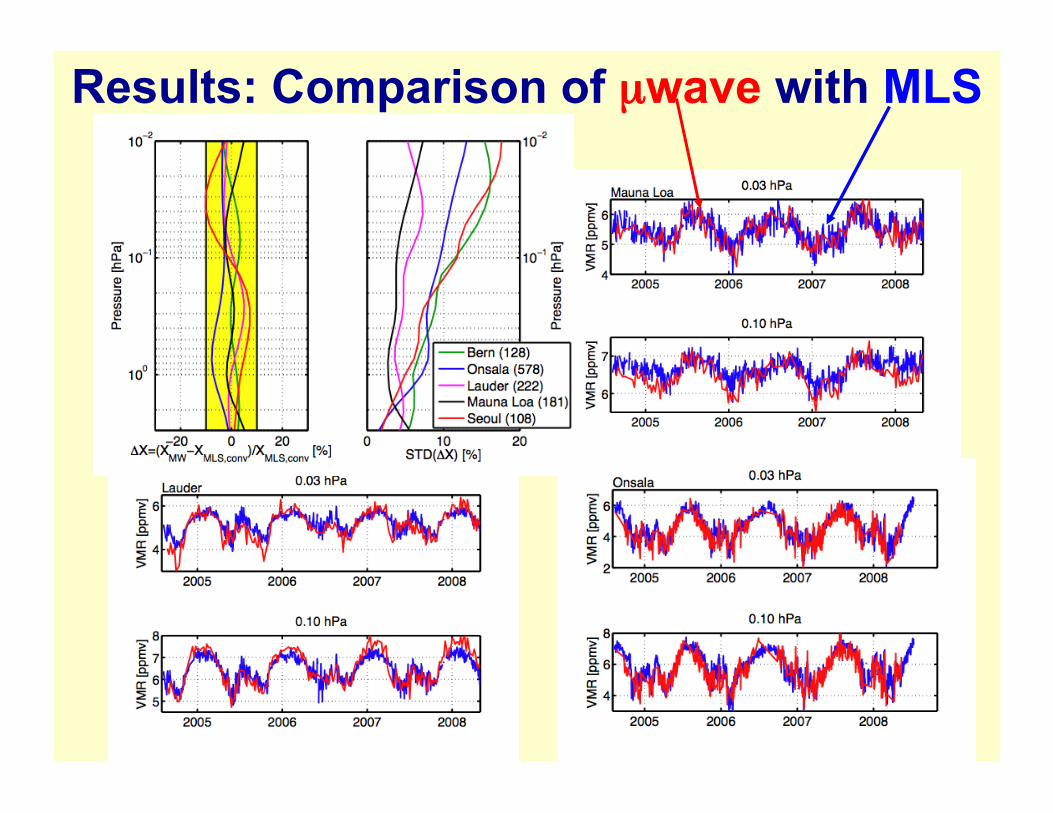
Results: Comparison of µwave with MLS
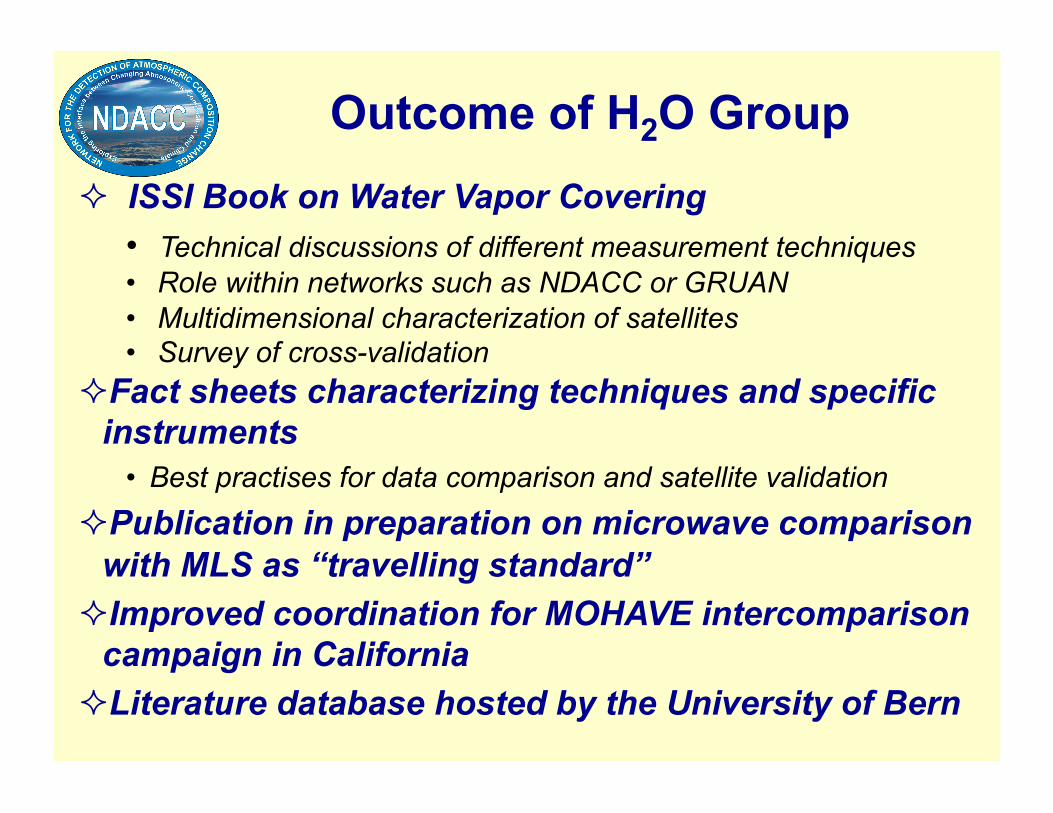
Outcome of H2O Group ISSI Book on Water Vapor Covering
• Technical discussions of different measurement techniques • Role within networks such as NDACC or GRUAN • Multidimensional characterization of satellites • Survey of cross-validation
Fact sheets characterizing techniques and specific instruments
• Best practises for data comparison and satellite validation Publication in preparation on microwave comparison
with MLS as “travelling standard” Improved coordination for MOHAVE intercomparison
campaign in California Literature database hosted by the University of Bern
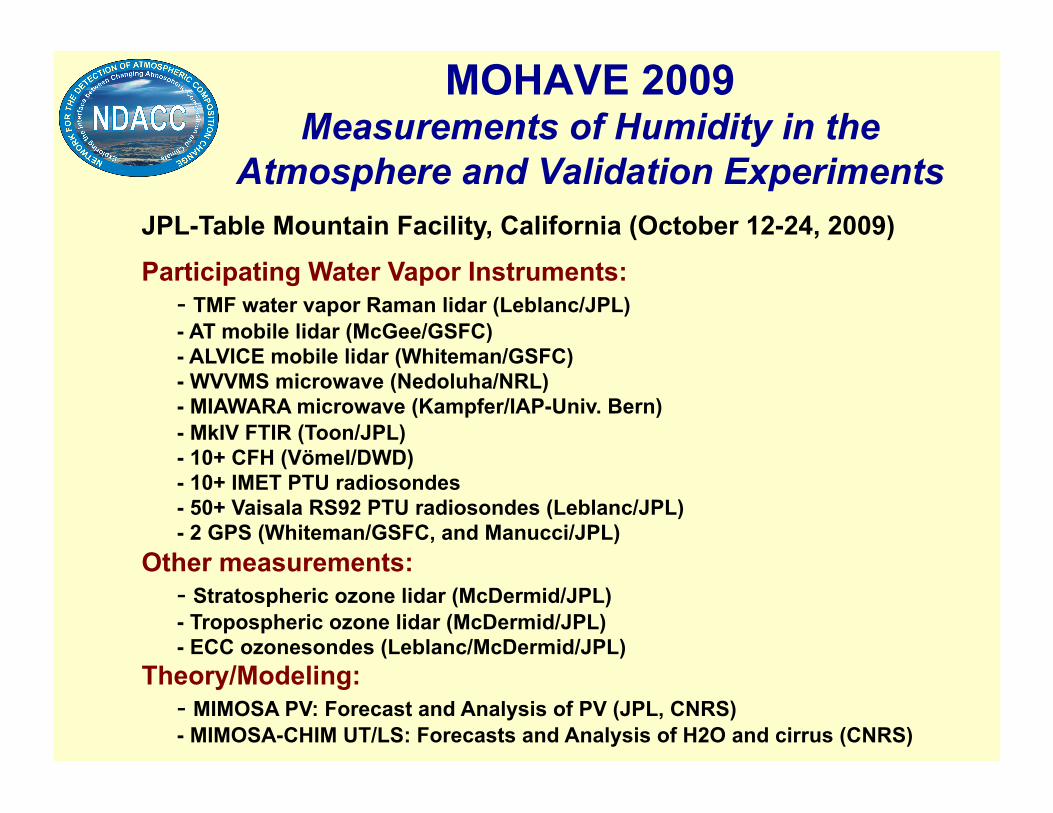
JPL-Table Mountain Facility, California (October 12-24, 2009)
Participating Water Vapor Instruments: - TMF water vapor Raman lidar (Leblanc/JPL) - AT mobile lidar (McGee/GSFC) - ALVICE mobile lidar (Whiteman/GSFC) - WVVMS microwave (Nedoluha/NRL) - MIAWARA microwave (Kampfer/IAP-Univ. Bern) - MkIV FTIR (Toon/JPL) - 10+ CFH (Vömel/DWD) - 10+ IMET PTU radiosondes - 50+ Vaisala RS92 PTU radiosondes (Leblanc/JPL) - 2 GPS (Whiteman/GSFC, and Manucci/JPL)
Other measurements: - Stratospheric ozone lidar (McDermid/JPL) - Tropospheric ozone lidar (McDermid/JPL) - ECC ozonesondes (Leblanc/McDermid/JPL)
Theory/Modeling: - MIMOSA PV: Forecast and Analysis of PV (JPL, CNRS) - MIMOSA-CHIM UT/LS: Forecasts and Analysis of H2O and cirrus (CNRS)
MOHAVE 2009 Measurements of Humidity in the
Atmosphere and Validation Experiments

Recommendations for GRUAN
Don’t Reinvent the Wheel • Draw On Capabilities of Established High-Quality
Networks • Augment These Capabilities as Needed to Provide Key
Climate Variables on a Global Scale
Instrument-Specific WGs First • GRUAN is the Reference Network for GUAN
− Emphasis on the Quality (Accuracy & Precision) of Various Measurement
− Build-Up Phase is Better Supported by an Instrument-Specific Organization
− Mirror NDACC Instrument WG Functions Parameter-Specific WGs Second
• Once Instruments Are Fully Characterized
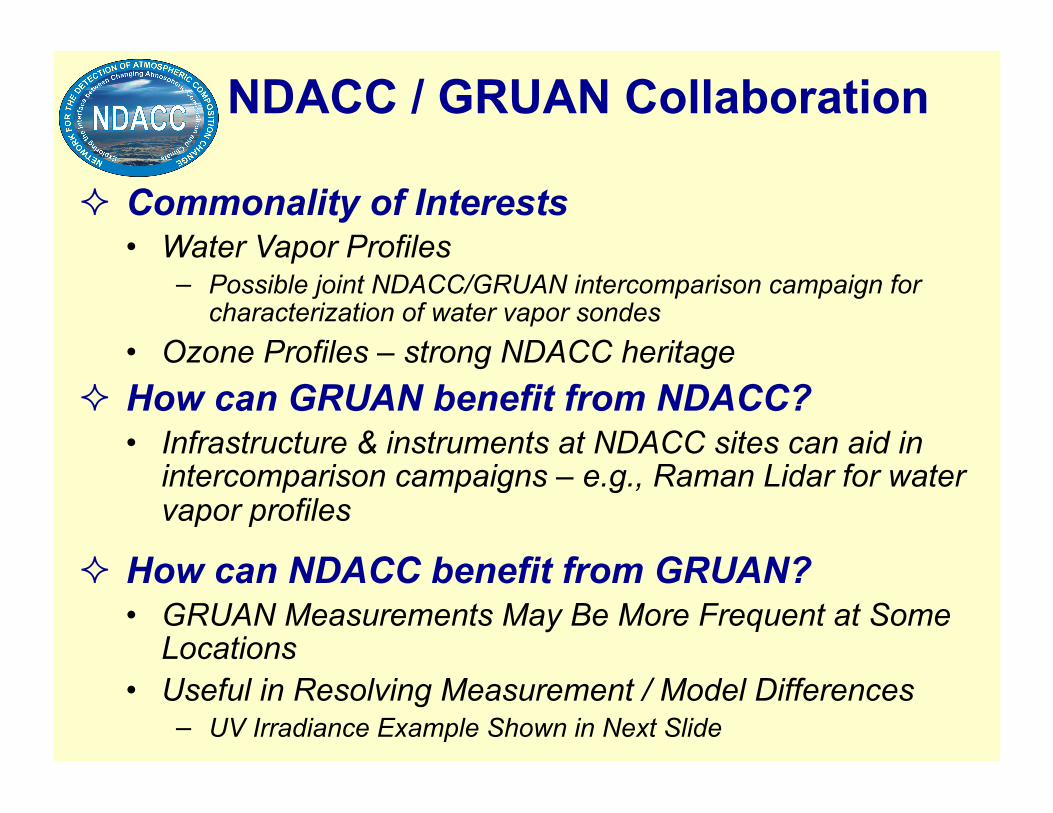
NDACC / GRUAN Collaboration
Commonality of Interests • Water Vapor Profiles
− Possible joint NDACC/GRUAN intercomparison campaign for characterization of water vapor sondes
• Ozone Profiles – strong NDACC heritage How can GRUAN benefit from NDACC?
• Infrastructure & instruments at NDACC sites can aid in intercomparison campaigns – e.g., Raman Lidar for water vapor profiles
How can NDACC benefit from GRUAN? • GRUAN Measurements May Be More Frequent at Some
Locations • Useful in Resolving Measurement / Model Differences
− UV Irradiance Example Shown in Next Slide
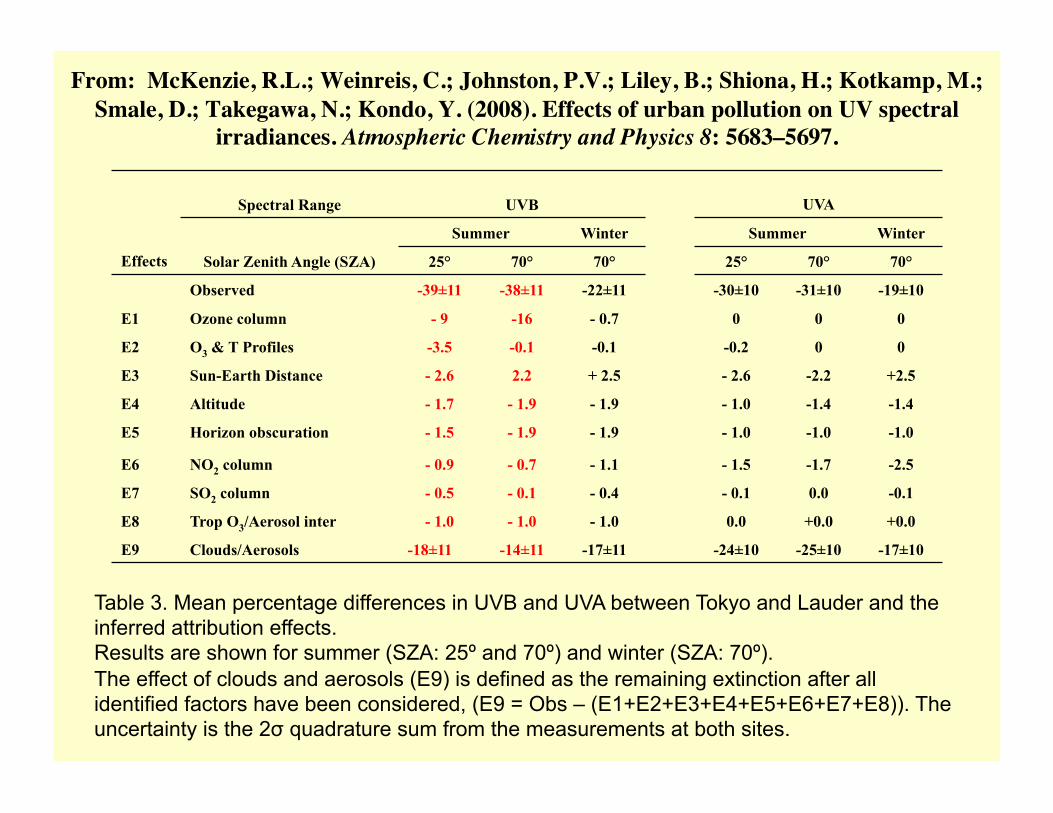
From: McKenzie, R.L.; Weinreis, C.; Johnston, P.V.; Liley, B.; Shiona, H.; Kotkamp, M.; Smale, D.; Takegawa, N.; Kondo, Y. (2008). Effects of urban pollution on UV spectral
irradiances. Atmospheric Chemistry and Physics 8: 5683–5697.
Table 3. Mean percentage differences in UVB and UVA between Tokyo and Lauder and the inferred attribution effects. Results are shown for summer (SZA: 25º and 70º) and winter (SZA: 70º). The effect of clouds and aerosols (E9) is defined as the remaining extinction after all identified factors have been considered, (E9 = Obs – (E1+E2+E3+E4+E5+E6+E7+E8)). The uncertainty is the 2σ quadrature sum from the measurements at both sites.
Effects
Spectral Range UVB UVA
Solar Zenith Angle (SZA)
Summer Winter Summer Winter
25° 70° 70° 25° 70° 70°
Observed -39±11 -38±11 -22±11 -30±10 -31±10 -19±10
E1 Ozone column - 9 -16 - 0.7 0 0 0
E2 O3 & T Profiles -3.5 -0.1 -0.1 -0.2 0 0
E3 Sun-Earth Distance - 2.6 2.2 + 2.5 - 2.6 -2.2 +2.5
E4 Altitude - 1.7 - 1.9 - 1.9 - 1.0 -1.4 -1.4
E5 Horizon obscuration - 1.5 - 1.9 - 1.9 - 1.0 -1.0 -1.0
E6 NO2 column - 0.9 - 0.7 - 1.1 - 1.5 -1.7 -2.5
E7 SO2 column - 0.5 - 0.1 - 0.4 - 0.1 0.0 -0.1
E8 Trop O3/Aerosol inter - 1.0 - 1.0 - 1.0 0.0 +0.0 +0.0
E9 Clouds/Aerosols -18±11 -14±11 -17±11 -24±10 -25±10 -17±10

• http://www.ndacc.org
• New informational leaflet
• Annual newsletters now available
• “News and Highlights” section
• Protocols being updated
Top Related