


Languages
Pages
Legal


©Nemertes Research 2014± www.nemertes.com ± 888-‐241-‐2685 ±DN3477
1
Contact Center Total Cost of Ownership
By Lisa Durant Research Analyst, Nemertes Research
Executive Summary
Understanding the Total Cost of Ownership (TCO) of contact center alternatives is critical for sound decision-‐making. Nemertes recommends considering capital, implementation, and ongoing operational costs in TCO analysis. Nemertes conducted a research study including 114 organizations (most of which used multiple contact-‐center vendors) and gathered 190 data points covering cost data for a number of contact-‐center vendors. Five vendors received enough responses for us to analyze them independently: Aspect, Avaya, Cisco, Interactive Intelligence, and NEC. We then used this data to develop a first-‐year TCO analysis comparing each vendor to overall aggregate costs. Nemertes analysis shows that capital, implementation, and operation costs vary between vendors, especially for rollouts of fewer than 100 agent licenses. Costs vary based on deployment size, type (on-‐premises vs. cloud), and product, meaning no single vendor is the most cost-‐effective (defined as offering the lowest TCO) for every situation. For example, Interactive Intelligence provides the lowest first-‐year cost (a combination of capital, implementation, and operational metrics) for contact center rollouts of all sizes. But, when just evaluating subsequent-‐year operational costs for all sizes of rollouts, Avaya comes out on top. However, when looking only at rollouts under 100 licenses, Interactive Intelligence provides both the lowest first-‐ and subsequent-‐year costs. Small contact centers (under 100 agent licenses) are receiving a lot of attention as vendors expand cloud and on-‐premises offerings aimed primarily at small and midsize customers. Small contact centers generally use similar applications as larger contact centers, including automatic call distributors (ACDs), interactive voice response (IVR), call recording, and workforce optimization (WFO) applications. Although organizations still deploy the majority of small contact centers on-‐premises, a growing number are using and evaluating private cloud, public cloud, or hybrid (on-‐premises and cloud combination) environments.

©Nemertes Research 2014± www.nemertes.com ± 888-‐241-‐2685 ±DN3477
2
The Issue
Nemertes conducted an independent study (no vendors sponsored it) to evaluate contact-‐center costs. The research documented capital, implementation, and operational costs associated with implementing and maintaining contact-‐center applications. We also gathered data on factors such as rollout size, vendor selection, and type of deployment (cloud vs. on-‐premises) to evaluate how those factors affect cost. Nemertes studied 114 enterprises and gathered 190 data points providing detailed contact-‐center cost data for several vendors. Five vendors received enough responses for us to analyze them independently: Aspect, Avaya, Cisco, Interactive Intelligence, and NEC. Those vendors that did not receive enough response were rolled into an “Other” category. Overall, we found that costs varied most significantly for deployments under 100 licenses. Nemertes recommends companies of all sizes evaluate a number of factors when making contact-‐center vendor and product decisions. Initial capital costs are important, but the lowest up-‐front price doesn’t always mean the highest value. And because organizations don’t know what the ongoing operational costs will be until they actually operate the system, it’s difficult to evaluate such costs—yet extremely important. The cost data here provides that critical piece of the puzzle by gathering that real-‐world data from organizations already using these vendors. We recommend IT leaders consider all costs—with an emphasis on ongoing operational costs—the proposed solution’s technical capabilities, existing relationships with the vendor, the solution’s customer-‐service capabilities, the solution’s ability to integrate with existing business applications, and referrals from existing customers.
The Data
Nemertes analysts conducted in-‐depth phone interviews with 17 IT professionals to establish a reasonable range for each category of costs. We then sent email invitations to a pre-‐qualified list of several hundred IT professionals. The email contained a link to an electronic survey containing a subset of the cost data questions asked during the phone interviews. We analyzed the survey data, eliminating respondents whose cost entries fell outside of a “reasonable” range established by the interviews. Through this process, we received 97 valid responses. Most companies used multiple contact center vendors, so we received 190 data points for contact center vendors. Nemertes used the following definitions of cost data for the phone interviews, online surveys, and subsequent analysis and calculated costs per license using the formulas noted.
± Capital cost – Includes all hardware, software, and licenses required for contact center.
©Nemertes Research 2014± www.nemertes.com ± 888-‐241-‐2685 ±DN3477
3
o The formula we use is as follows: !"#$%"& !"#$#
!"#$%& !" !"#$%&$& (!"#ℎ !"#$% !"# !"#$%&'!(%)
± Implementation cost – Includes staff time and third-‐party consultants or integrators. o The formula we use is as follows:
!"#$$ !"#$ × !"!"#" ℎ!"#$% !"#$ + !ℎ!"# !"#$% !"#$#!"#$%& !" !"#$%&$&
± Operational cost – Includes staff time, equipment maintenance costs, third-‐
party managed services, training, and certification costs. We gathered four types of operational data: o Internal staff – Includes the total loaded cost of internal staff (measured as
full-‐time equivalents) divided by the number of agent and supervisor licenses.
o Annual equipment maintenance – Includes the amount that the organization pays to the vendor or VAR for annual equipment maintenance.
o Third-‐party services – Includes any third-‐party partners, systems integrators, or consultants who help with ongoing system operations.
o Training – Includes training costs for IT staff only (not end users). The formula we use is as follows:
!"#$%& !" !"#$ × !"#$%&# !""#!$ !"#$%$ !"#"$% +
!"#$%&!'( !"#$%&$"$'& +!"#"$%& !"#$%&"! + !"!"#"#$!"#$%&%!'$%()
!"#$%& !" !"#$%&$&
Using these definitions and formulas, Nemertes calculated total costs per license for each of the below technologies:
± Automatic Call Distributor (ACD) – A platform that routes incoming calls based on internally set rules and instructions to specified groups of agents.
± Interactive Voice Response (IVR) – A technology that enables customers calling into the contact center to perform self service or input information for agents via keypad or spoken word.
± Predictive Dialing – A tool that dials a pre-‐defined list of telephone numbers and then connects answered calls to agents.
©Nemertes Research 2014± www.nemertes.com ± 888-‐241-‐2685 ±DN3477
4
± Skills-‐Based Routing – A routing strategy used to assign incoming contact requests to the most suitable agent rather than just the next available agent.
± Call Recording – A technology that records voice conversations. ± Virtual Hold – A technology that allows customers to request and receive
callbacks rather than waiting in queue for an agent to respond.
Contact-Center Key Findings
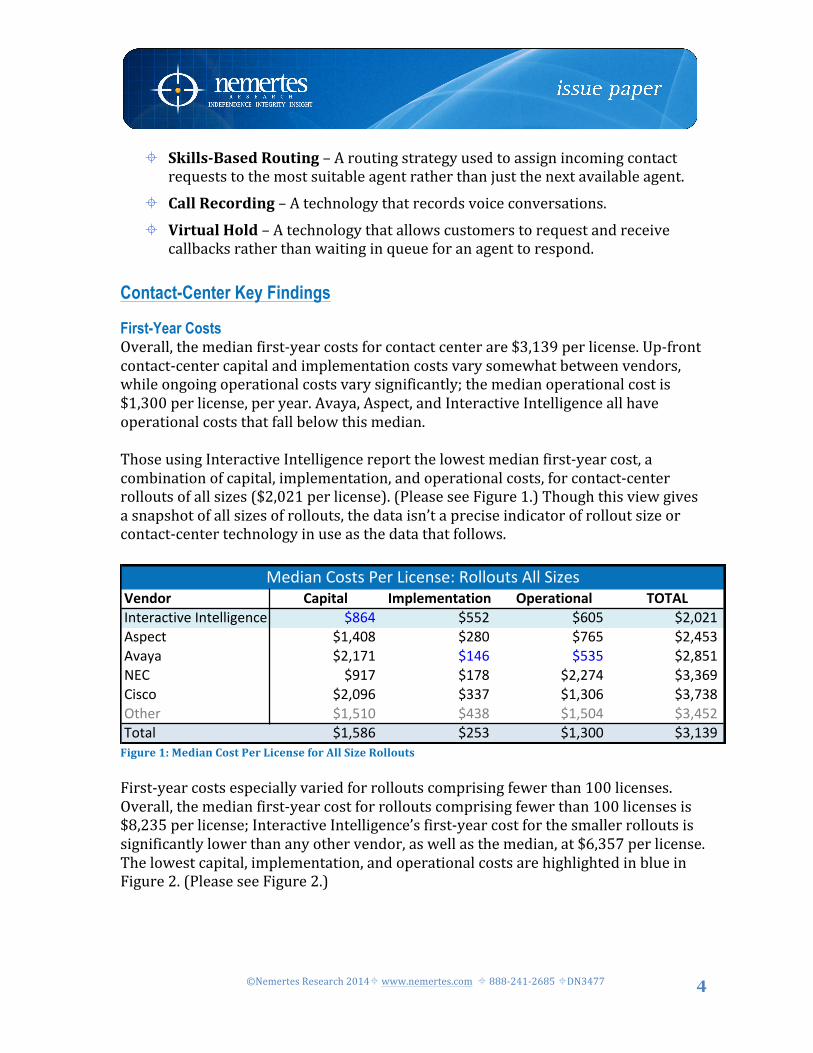
First-Year Costs Overall, the median first-‐year costs for contact center are $3,139 per license. Up-‐front contact-‐center capital and implementation costs vary somewhat between vendors, while ongoing operational costs vary significantly; the median operational cost is $1,300 per license, per year. Avaya, Aspect, and Interactive Intelligence all have operational costs that fall below this median. Those using Interactive Intelligence report the lowest median first-‐year cost, a combination of capital, implementation, and operational costs, for contact-‐center rollouts of all sizes ($2,021 per license). (Please see Figure 1.) Though this view gives a snapshot of all sizes of rollouts, the data isn’t a precise indicator of rollout size or contact-‐center technology in use as the data that follows.
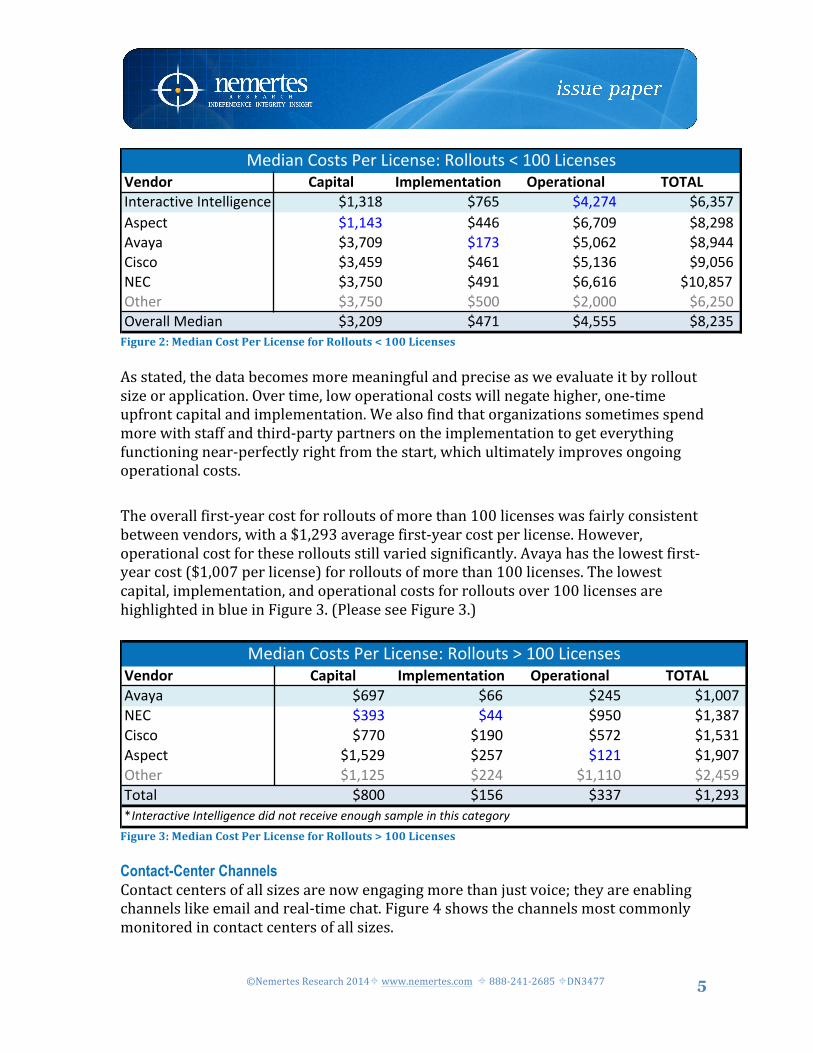
Figure 1: Median Cost Per License for All Size Rollouts First-‐year costs especially varied for rollouts comprising fewer than 100 licenses. Overall, the median first-‐year cost for rollouts comprising fewer than 100 licenses is $8,235 per license; Interactive Intelligence’s first-‐year cost for the smaller rollouts is significantly lower than any other vendor, as well as the median, at $6,357 per license. The lowest capital, implementation, and operational costs are highlighted in blue in Figure 2. (Please see Figure 2.)
!"#$%& '()*+(, -.),"."#+(+*%# /)"&(+*%#(, 0/012!"#$%&'#()$*!"#$++(,$"'$ -./0.1 -234 -5/625 -3/042789$'# -./.50 -553 -3/2:; -1/6;17)&<& -0/2:; -.20 -4/:36 -1/;55=(8'> -0/54; -53. -4/.03 -;/:43?@= -0/24: -5;. -3/3.3 -.:/142A#B$% -0/24: -4:: -6/::: -3/64:A)$%&++*C$D(&" -0/6:; -52. -5/444 -1/604
!"#$%& '()*+(, -.),"."#+(+*%# /)"&(+*%#(, 0/0127)&<& -3;2 -33 -654 -./::2?@= -0;0 -55 -;4: -./012=(8'> -22: -.;: -426 -./40.789$'# -./46; -642 -.6. -./;:2A#B$% -./.64 -665 -./..: -6/54;E>#&+ -1:: -.43 -002 -./6;0F!"#$%&'#()$*!"#$++(,$"'$*-(-*".#*%$'$()$*$"./,0*1&23+$*("*#0(1*'&#$,.%4
!"#$%& '()*+(, -.),"."#+(+*%# /)"&(+*%#(, 0/012!"#$%&'#()$*!"#$++(,$"'$ -135 -446 -3:4 -6/:6.789$'# -./5:1 -61: -234 -6/5407)&<& -6/.2. -.53 -404 -6/14.?@= -;.2 -.21 -6/625 -0/03;=(8'> -6/:;3 -002 -./0:3 -0/201A#B$% -./4.: -501 -./4:5 -0/546E>#&+ -./413 -640 -./0:: -0/.0;
C$D(&"*=>8#8*G$%*H('$"8$I*J>++>K#8*L*.::*H('$"8$8
C$D(&"*=>8#8*G$%*H('$"8$I*J>++>K#8*M*.::*H('$"8$8
C$D(&"*=>8#8*G$%*H('$"8$I*J>++>K#8*7++*N(O$8
©Nemertes Research 2014± www.nemertes.com ± 888-‐241-‐2685 ±DN3477
5
Figure 2: Median Cost Per License for Rollouts < 100 Licenses As stated, the data becomes more meaningful and precise as we evaluate it by rollout size or application. Over time, low operational costs will negate higher, one-‐time upfront capital and implementation. We also find that organizations sometimes spend more with staff and third-‐party partners on the implementation to get everything functioning near-‐perfectly right from the start, which ultimately improves ongoing operational costs. The overall first-‐year cost for rollouts of more than 100 licenses was fairly consistent between vendors, with a $1,293 average first-‐year cost per license. However, operational cost for these rollouts still varied significantly. Avaya has the lowest first-‐year cost ($1,007 per license) for rollouts of more than 100 licenses. The lowest capital, implementation, and operational costs for rollouts over 100 licenses are highlighted in blue in Figure 3. (Please see Figure 3.)
Figure 3: Median Cost Per License for Rollouts > 100 Licenses Contact-Center Channels Contact centers of all sizes are now engaging more than just voice; they are enabling channels like email and real-‐time chat. Figure 4 shows the channels most commonly monitored in contact centers of all sizes.
!"#$%& '()*+(, -.),"."#+(+*%# /)"&(+*%#(, 0/012!"#$%&'#()$*!"#$++(,$"'$ -./0.1 -234 -5/625 -3/042789$'# -./.50 -553 -3/2:; -1/6;17)&<& -0/2:; -.20 -4/:36 -1/;55=(8'> -0/54; -53. -4/.03 -;/:43?@= -0/24: -5;. -3/3.3 -.:/142A#B$% -0/24: -4:: -6/::: -3/64:A)$%&++*C$D(&" -0/6:; -52. -5/444 -1/604
!"#$%& '()*+(, -.),"."#+(+*%# /)"&(+*%#(, 0/0127)&<& -3;2 -33 -654 -./::2?@= -0;0 -55 -;4: -./012=(8'> -22: -.;: -426 -./40.789$'# -./46; -642 -.6. -./;:2A#B$% -./.64 -665 -./..: -6/54;E>#&+ -1:: -.43 -002 -./6;0F!"#$%&'#()$*!"#$++(,$"'$*-(-*".#*%$'$()$*$"./,0*1&23+$*("*#0(1*'&#$,.%4
!"#$%& '()*+(, -.),"."#+(+*%# /)"&(+*%#(, 0/012!"#$%&'#()$*!"#$++(,$"'$ -135 -446 -3:4 -6/:6.789$'# -./5:1 -61: -234 -6/5407)&<& -6/.2. -.53 -404 -6/14.?@= -;.2 -.21 -6/625 -0/03;=(8'> -6/:;3 -002 -./0:3 -0/201A#B$% -./4.: -501 -./4:5 -0/546E>#&+ -./413 -640 -./0:: -0/.0;
C$D(&"*=>8#8*G$%*H('$"8$I*J>++>K#8*L*.::*H('$"8$8
C$D(&"*=>8#8*G$%*H('$"8$I*J>++>K#8*M*.::*H('$"8$8
C$D(&"*=>8#8*G$%*H('$"8$I*J>++>K#8*7++*N(O$8

©Nemertes Research 2014± www.nemertes.com ± 888-‐241-‐2685 ±DN3477
6
Figure 4: Channels Monitored in the Contact Center All vendors supply a solution that supports the most common channels including e-‐mail and real-‐time chat; however, prices differ based on how vendors bundle and sell channels for specific solutions. IT decision makers should consider these pricing differences when deciding on a specific solution and vendor. Contact Center Applications ACDs (66%), IVRs (55%), and call recording (53%) are the most common applications used by contact centers of all sizes. Workforce optimization (47%) and skills-‐based routing (45%) also are used fairly frequently. (Please see Figure 5.)

©Nemertes Research 2014± www.nemertes.com ± 888-‐241-‐2685 ±DN3477
7
Figure 5: Contact Center Applications The average first-‐year cost for an ACD, the most commonly used contact center application, is $966 per license; the average ongoing operational cost for an ACD is $288 per license. Interactive Intelligence provides the lowest first-‐year and ongoing operational costs for ACD deployments across all size rollouts. Figure 6 shows how ACD capital, implementation, and operational costs differentiate between vendors; the lowest costs for each category are highlighted in blue. (Please see Figure 6.)
Figure 6: ACD Median Cost Per License (All Size Rollouts)

©Nemertes Research 2014± www.nemertes.com ± 888-‐241-‐2685 ±DN3477
8
The median first-‐year cost for an IVR is $884 per license, with the ongoing operational cost at $271 per license. Avaya had both the lowest average first-‐year and ongoing operational costs for IVR. The lowest capital, implementation, and operational costs for IVR are highlighted in blue in Figure 7. (Please see Figure 7.)
Figure 7: IVR Median Costs Per License (All Size Rollouts) The median first-‐year cost for call recording is $766 per license, and the median ongoing operational cost is $288 per license. Interactive Intelligence has the lowest first-‐year ($401 per license) and ongoing operational costs ($77 per license) for call recording. The lowest capital, implementation, and operational costs for call recording are highlighted in blue in Figure 8. (Please see Figure 8.)
Figure 8: Call Recording Median Costs Per License (All Size Rollouts)
The same vendor does not necessarily provide these contact center applications. Only 22% of contact centers use only one vendor. (Please see Figure 9).
!"#$%& '()*+(, -.),"."#+(+*%# /)"&(+*%#(, 0/012!"#$%&'#()$*!"#$++(,$"'$ -.// -.0. -11 -23.4(5'6 -237 -89 -/37 -113:)&;& -8/2 -28 -<11 -987=>4 -171 -/1 -.?1<8 -<?8<0@#A$% -818 -.<< -..1 -9.2@)$%&++*B$C(&" -2<0 -83 -<99 -177
4&++*D$'6%C(",*E$C(&"*465#5*F$%*G('$"5$H*:++*I(J$*D6++6K#5

©Nemertes Research 2014± www.nemertes.com ± 888-‐241-‐2685 ±DN3477
9
The number of vendors used within a contact center also differentiated based on deployment size. Figure 10 shows the percentage of companies using single or multiple vendors broken down by deployment size.
Figure 10: Number of Vendors and Deployment Size The choice to use one or multiple vendors to provide contact center applications affects total cost of ownership. For example, the median first-‐year cost of ownership for an Avaya ACD alone is $1,043 per license, and the median first-‐year cost of
Number of Vendors in Contact Center
Figure 9: Number of Vendors in Contact Center

©Nemertes Research 2014± www.nemertes.com ± 888-‐241-‐2685 ±DN3477
10
ownership for an Avaya IVR is $773 per license. However, Nemertes found that the median first-‐year cost of ownership for an Avaya ACD and IVR in combination is $1,677 per license (a difference of $139 per license). This is similar for other vendors as well. Deployment Model Most vendors currently offer contact center solutions both on-‐premises and in the cloud; many also offer hybrid models combining both on-‐premises and cloud solutions.
On average, 53.8% of participants deploy contact center solutions on-‐premises; 41.4% deploy contact center solutions through public cloud, private cloud, or hybrid (on-‐prem/cloud combination) models. (Please see Figure 11.) Of those deploying SaaS/public cloud, 72% are small contact centers (<100 licenses). The majority of most vendors’ customers are using on-‐premises solutions though most vendors offer both cloud and on-‐premises solutions. However, 80% of Interactive Intelligence customers and 64% of NEC customers are using public cloud, private cloud, or hybrid solutions. Figure 12 shows deployment type by vendor.
Deployment Method
Figure 11: Deployment Method

©Nemertes Research 2014± www.nemertes.com ± 888-‐241-‐2685 ±DN3477
11
Figure 12: Deployment Type by Vendor
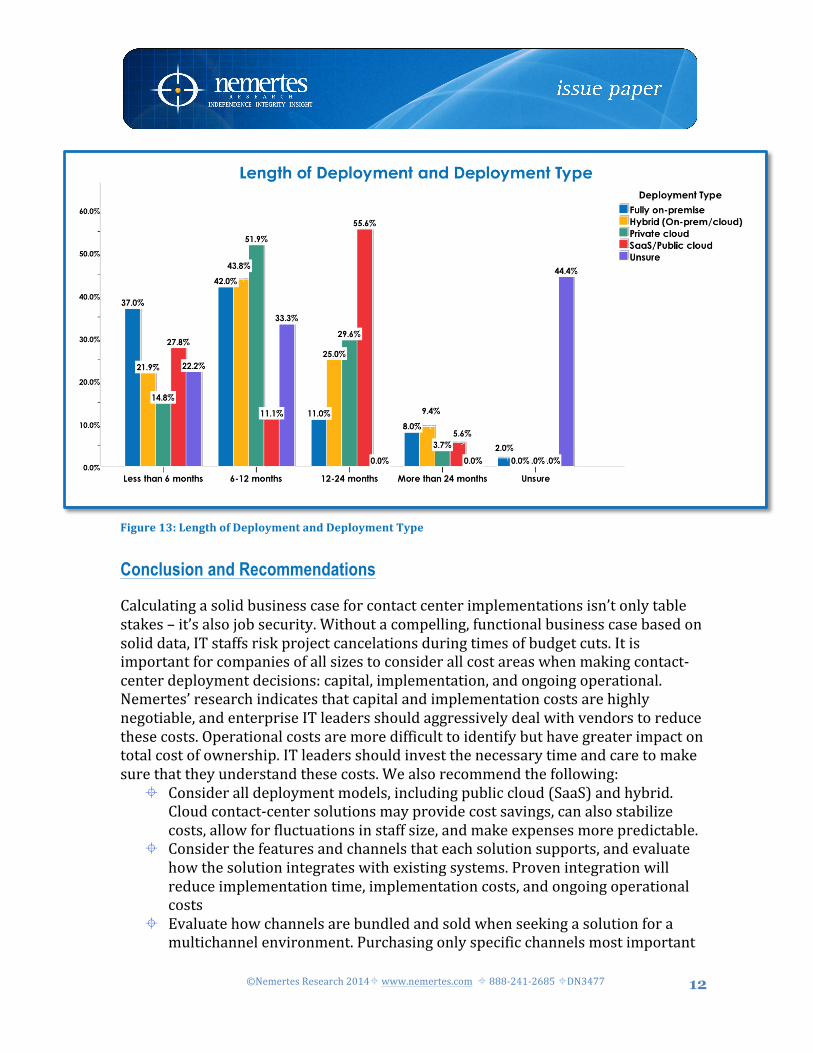
Interactive Intelligence and NEC’s higher number of cloud customers reflects the current direction of the contact center industry. Cloud and hybrid contact centers are gaining more traction, especially with smaller contact centers. Deployment Length Another aspect to consider when evaluating contact center solutions and deployment type is the time it takes to deploy the solution and how that fits in with company needs and timelines. Lengthy deployments can also affect costs should a company need to pay specific individuals to manage implementation. For example, ACD deployment time differentiates depending on deployment type. Nemertes found that 55.6% of those deploying SaaS/public cloud ACDs stated that deployment took 12–24 months; 39% stated that it took less than 12 months to deploy their SaaS ACD solution. Figure 13 shows length of deployment and deployment type. (See Figure 13.)
!"#$%& '#()&"*+,"-..-/0)123+40
43%1$ 562&+$7&+8.9"0:3%1$
;,)"49 !"#!$ %#%$ &#'$ %#%$;8.6. !%#($ )#&$ *#*$ ''#*$:+,4% )*#"$ '%#'$ '&#%$ '"#!$<#9"&.49+8"0<#9"33+="#4" '%#%$ )%#%$ "%#%$ '%#%$>?: +!#%$ !#,$ ")#&$ "&#($'9@"& ,,#%$ ,#%$ '(#%$ '(#%$;8"&.=" )+#*$ &#!$ '!#"$ ',#)$
*Where total does not add up to 100%, the balance are “unsure”
©Nemertes Research 2014± www.nemertes.com ± 888-‐241-‐2685 ±DN3477
12
Figure 13: Length of Deployment and Deployment Type
Conclusion and Recommendations
Calculating a solid business case for contact center implementations isn’t only table stakes – it’s also job security. Without a compelling, functional business case based on solid data, IT staffs risk project cancelations during times of budget cuts. It is important for companies of all sizes to consider all cost areas when making contact-‐center deployment decisions: capital, implementation, and ongoing operational. Nemertes’ research indicates that capital and implementation costs are highly negotiable, and enterprise IT leaders should aggressively deal with vendors to reduce these costs. Operational costs are more difficult to identify but have greater impact on total cost of ownership. IT leaders should invest the necessary time and care to make sure that they understand these costs. We also recommend the following:
± Consider all deployment models, including public cloud (SaaS) and hybrid. Cloud contact-‐center solutions may provide cost savings, can also stabilize costs, allow for fluctuations in staff size, and make expenses more predictable.
± Consider the features and channels that each solution supports, and evaluate how the solution integrates with existing systems. Proven integration will reduce implementation time, implementation costs, and ongoing operational costs
± Evaluate how channels are bundled and sold when seeking a solution for a multichannel environment. Purchasing only specific channels most important

©Nemertes Research 2014± www.nemertes.com ± 888-‐241-‐2685 ±DN3477
13
to the company rather than pre-‐bundled channels that will not be used could reduce costs.
± Consider the time it takes to deploy and implement a solution. Lengthy deployment times can affect costs – especially if the company plans to pay someone to handle implementation.
± Evaluate how combining common contact center products and functions could reduce costs. Purchasing some applications together from one vendor can reduce costs.
± Demand and contact referrals after creating a short list of two to three vendors to consider. This direct contact with actual users will enable IT leaders to better understand capital, implementation, and ongoing operational costs.
± Evaluate operational costs, which can vary widely between vendors and deployment models. Often, leveraging existing staff expertise with a specific vendor can reduce operational costs.

©Nemertes Research 2014± www.nemertes.com ± 888-‐241-‐2685 ±DN3477
14
Contact Center Cost Study Methodology
For this Nemertes Contact Center Cost Study Research Project, analysts conducted in-‐depth phone interviews with 17 IT professionals. Nemertes also conducted several short follow-‐up calls or exchanged emails to clarify and augment data. During the interviews, each analyst asked a pre-‐planned list of questions to ensure that they asked the questions consistently. Many questions are open-‐ended, providing an opportunity for participants to provide their own unbiased insight and observations. After completing the interviews, we established reasonable ranges for each category of costs. We then sent email invitations to a prequalified list of IT professionals. The email contained a link to an electronic survey with a subset of the cost data questions asked during the interviews. We analyzed the survey data, eliminating respondents whose cost entries fell outside a “reasonable” range established by the interviews. We received 97 valid responses and most companies used more than one contact center provider. We received 190 data points for contact center providers. To ensure the report is relevant to the largest possible group of readers, we deliberately sought to reach the broadest possible range of industries and company sizes. To determine what participants were including in their contact center initiatives, we asked open-‐ended questions about contact center usage, plans and goals, and costs. The specific technologies included ACD, IVR, call recording, workforce optimization, skills-‐based routing, virtual hold, predictive dialing, and voice analytics. We also asked demographic questions, including number of employees, annual revenue, job titles, and IT budgets. As a result, individual interviews and surveys varied considerably in the number of questions answered and in the number of subject areas addressed, as well as in the degree of insight provided for each contact center topic covered, based on the interest and expertise of the participants involved. For the interviews and surveys, Nemertes drew participants from its database of IT professionals, its non-‐vendor client base, and to a lesser extent, from publicly available lists of IT executives and published case studies. Nemertes gave all vendors equal opportunity to provide customer names. Nemertes guarantees confidentiality and anonymity for participants and their companies. Any reports or slides generated from this data include quotations from real individuals, identified only by title and/or industry affiliation. Please note these quotes are verbatim, with no changes in content or wording, except to correct grammar.
Timeframe We conducted interviews and surveys with contact center cost study participants from IT organizations between September and December 2013. We asked

©Nemertes Research 2014± www.nemertes.com ± 888-‐241-‐2685 ±DN3477
15
participants to provide us with insight into ongoing contact center initiatives and those planned for the next two years.
Participants
In selecting individual participants, we asked to speak with the individual or individuals within IT most closely associated with decision-‐making, operations and overall knowledge in the contact center area. By Title In this study, Nemertes gathered data from a wide range of decision makers/influencers. Directors of IT, CIOs, and CTOs represent the bulk of research participants (51.6%).
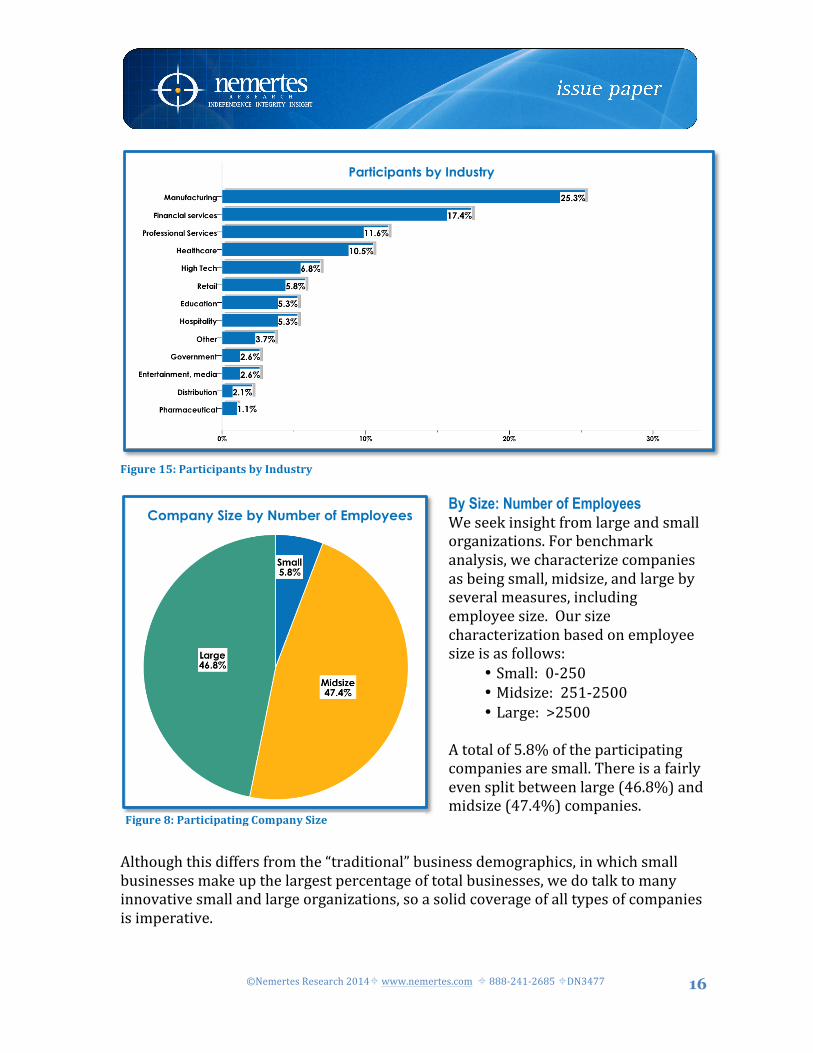
Figure 14: Participants by Title By Industry As noted, we sought to include the broadest possible range of industries in our research. Manufacturing, financial services, and professional services (broadly covering all professional services sub-‐areas, including engineering, accounting, law firms, etc.) top the list of industries represented, accounting for 25.3%, 17.4%, and 11.6% of participants respectively. We also spoke to relatively high percentages in healthcare (10.5%), high tech (6.8%), and retail (5.8%).
©Nemertes Research 2014± www.nemertes.com ± 888-‐241-‐2685 ±DN3477
16
Figure 15: Participants by Industry
By Size: Number of Employees We seek insight from large and small organizations. For benchmark analysis, we characterize companies as being small, midsize, and large by several measures, including employee size. Our size characterization based on employee size is as follows:
• Small: 0-‐250 • Midsize: 251-‐2500 • Large: >2500
A total of 5.8% of the participating companies are small. There is a fairly even split between large (46.8%) and midsize (47.4%) companies.
Although this differs from the “traditional” business demographics, in which small businesses make up the largest percentage of total businesses, we do talk to many innovative small and large organizations, so a solid coverage of all types of companies is imperative.
Participants by Industry
Company Size by Number of Employees
Figure 8: Participating Company Size
©Nemertes Research 2014± www.nemertes.com ± 888-‐241-‐2685 ±DN3477
17
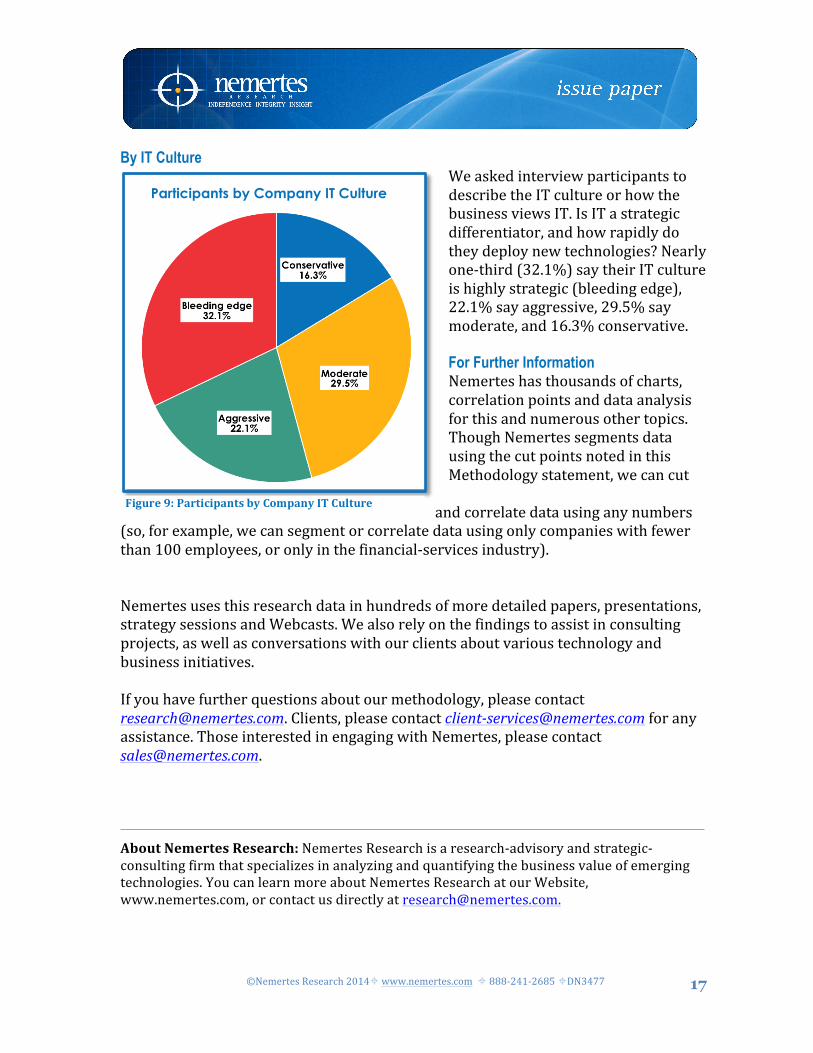
By IT Culture We asked interview participants to describe the IT culture or how the business views IT. Is IT a strategic differentiator, and how rapidly do they deploy new technologies? Nearly one-‐third (32.1%) say their IT culture is highly strategic (bleeding edge), 22.1% say aggressive, 29.5% say moderate, and 16.3% conservative. For Further Information Nemertes has thousands of charts, correlation points and data analysis for this and numerous other topics. Though Nemertes segments data using the cut points noted in this Methodology statement, we can cut
and correlate data using any numbers (so, for example, we can segment or correlate data using only companies with fewer than 100 employees, or only in the financial-‐services industry).
Nemertes uses this research data in hundreds of more detailed papers, presentations, strategy sessions and Webcasts. We also rely on the findings to assist in consulting projects, as well as conversations with our clients about various technology and business initiatives.
If you have further questions about our methodology, please contact [email protected]. Clients, please contact client-‐[email protected] for any assistance. Those interested in engaging with Nemertes, please contact [email protected].
About Nemertes Research: Nemertes Research is a research-‐advisory and strategic-‐consulting firm that specializes in analyzing and quantifying the business value of emerging technologies. You can learn more about Nemertes Research at our Website, www.nemertes.com, or contact us directly at [email protected].
Participants by Company IT Culture
Figure 9: Participants by Company IT Culture
Top Related