


Languages
Pages
Legal

Needleless Electrospinning Experimental Study and Nanofiber Application in
Semiconductor Packaging
by
Tianwei Sun
A Thesis Presented in Partial Fulfillment of the Requirements for the Degree
Master of Science
Approved April 2014 by the Graduate Supervisory Committee:
Hanqing Jiang, Chair
Hongyu Yu Kangping Chen
ARIZONA STATE UNIVERSITY
May 2014
i
ABSTRACT
Electronics especially mobile electronics such as smart phones, tablet PCs, notebooks
and digital cameras are undergoing rapid development nowadays and have thoroughly
changed our lives. With the requirement of more transistors, higher power, smaller size,
lighter weight and even bendability, thermal management of these devices became one of
the key challenges. Compared to active heat management system, heat pipe, which is a
passive fluidic system, is considered promising to solve this problem. However,
traditional heat pipes have size, weight and capillary limitation. Thus new type of heat
pipe with smaller size, lighter weight and higher capillary pressure is needed.
Nanofiber has been proved with superior properties and has been applied in multiple
areas. This study discussed the possibility of applying nanofiber in heat pipe as new wick
structure. In this study, a needleless electrospinning device with high productivity rate
was built onsite to systematically investigate the effect of processing parameters on fiber
properties as well as to generate nanofiber mat to evaluate its capability in electronics
cooling. Polyethylene oxide (PEO) and Polyvinyl Alcohol (PVA) nanofibers were
generated. Tensiometer was used for wettability measurement. The results show that
independent parameters including spinneret type, working distance, solution
concentration and polymer type are strongly correlated with fiber morphology compared
to other parameters. The results also show that the fabricated nanofiber mat has high
capillary pressure.
Key words: Nanofiber, Needleless electrospinning, Heat pipe, Wick structure
ii
ACKNOWLEDGMENTS
My most sincere appreciation and gratitude go to my committee chair and advisor,
Dr. Hanqing Jiang, for his kindness, patience, inspiring mentorship and attentive
guidance in my research and my entire academic life. This work can’t be done without
his help. I would like to thank Dr. Hongyu Yu and Dr. Kangping Chen for their serving
as part of my committee.
I would like to thank Cheng Lv, Guanhao Qiao and Prithwish Chatterjee for their
help in this project. They are great people to work with. Thanks to my parents for their
tremendous support during my study.
iii
TABLE OF CONTENTS
Page
LIST OF FIGURES………………………………………………………………….……v
CHAPTER
1 INTRODUCTION……………………………………………………………….…..1
1.1 Nanofiber……………………………………………………………………4
1.2 Electrospinning………………………………………………………….…..5
1.2.1 Tylor Cone………………………………………………………….....6
1.2.2 Needle and Needleless Electrospinning………………………………9
1.3 Microelectronic Packaging…………………………………………………14
1.3.1 Thermal Management………………………………………………..14
1.3.2 Heat Pipe …………………………………………………………….15
1.4 Scope of This Thesis………………………………………………………..17
1.5 Organization of the Thesis………...………………………………………. 18
2 EXPERIMENTAL METHOD……………………………………………………...19
2.1 Needleless Electrospinning…………………………………………………19
2.1.1 Experimental Design…………………………………………………19
2.1.2 Safety Concerns……………………………………………………...22
2.1.3 Experiment and Modification……………………………………….23
2.2 Capillary Action ……...……………………………………………………32
3 RESULT AND DISCUSSION……………………………………………………..37
3.1 Effect of Processing Parameters on Eletrospinning…………….………….37
3.2 Capillary Test Results ………………………………………...……..….….41
iv
CHAPTER Page
3.3 Challenges and Future Work……………………………………………...49
4 CONCLUSION...………………………………………………...………………....51
REFERENCES…………………………………………………………………………..53
v
LIST OF FIGURES
Figure Page
1. Nanofiber, Pollen and Human Hair…………………………………………...……..…4
2. Tylor Cone……………………………………………………………………….......…6
3. Needle Based Electrospinning……………………………………………………...…10
4. Thermal Resistance and Electric Resistance……………………………………...….. 14
5. Heat Pipe Work loop: 1-2: Evaporator; 2-3: Adiabatic section; 3-4: Condenser;
4-1: Wick flow ……………………………………………….…………………….....16
6. Device Model in SolidWorks………………………………………………………....19
7. Picture of Device Set Up……………………………….……………………………...21
8. Cylinder Spinneret with Chain Ball……………………………………………….…..22
9. Collecting Plate with Edges Coated with PDMS………………………………….......23
10. Air Flow within Chamber……………………………………………………………24
11. Electrical Intensity between Plate and Spinneret……………………………………27
12. Electrical Intensity versus Spinneret Diameter………………………………………29
13. New Spinneret with Three Rings………………………………………………….....29
14. Electric Field Intensity Using New Spinneret…………………………………….…30
15. Electric Intensity along Center Line: (a) With Shaft and Reservoir;
(b) With Shaft No Reservoir; (c) With Reservoir No Shaft;
(d) No Reservoir No Shaft……………………………………………………...….…31
16. Wick Structure and Nanofiber (a) Wick Structure; (b) Low Porosity Nanofiber;
(c) High Porosity Nanofiber……………………………………..……….....………..33
vi
Figure Page
17. Nanofiber Images: (a) PEO Nanofiber SEM Images; (b) Images for Porosity
Measurement……………………………………………………..………………….38
18. Distribution of Voids Area………………………………………………………..…38
19. SEM Image of PEO Fiber Generated…………………………………………….….39
20. SEM Images of PVA Fiber Generated …………………………………………..….40
21. Fiber Diameter Distribution of Different Polymer Type: (a) PEO (Mw=300,000)
Concentration of 11%; (b) PEO (Mw=100,000) Concentration of 11%; (c) PVA
(Mw=146,000-186,000) Concentration of 11%.…………………………..………….41
22. Beading on Fiber ………………………………………………………………..…...41
23. Image of Cross Section of Heat Pipe………………………………………………...45
24. Image of Fiber Mat Sample……………………………………………………..…...45
25. Wick Structure Ethanol Absorption …………………………………..…………..…46
26. PVA Fiber Ethanol Absorption ……………………………………………….…......46
27. Mass Absorption of Nanofiber and Wick Structure …………….……..………….…47
28. Mass Absorption Rate of Nanofiber and Wick Structure …………….………...…...47
29. Mass Absorption Rate per Unit Cross Section Area ..…………………...………..…48
30. Fiber Mat Before and After Capillary Test ………………………………………….49
1
CHAPTER 1 INTRODUCTION
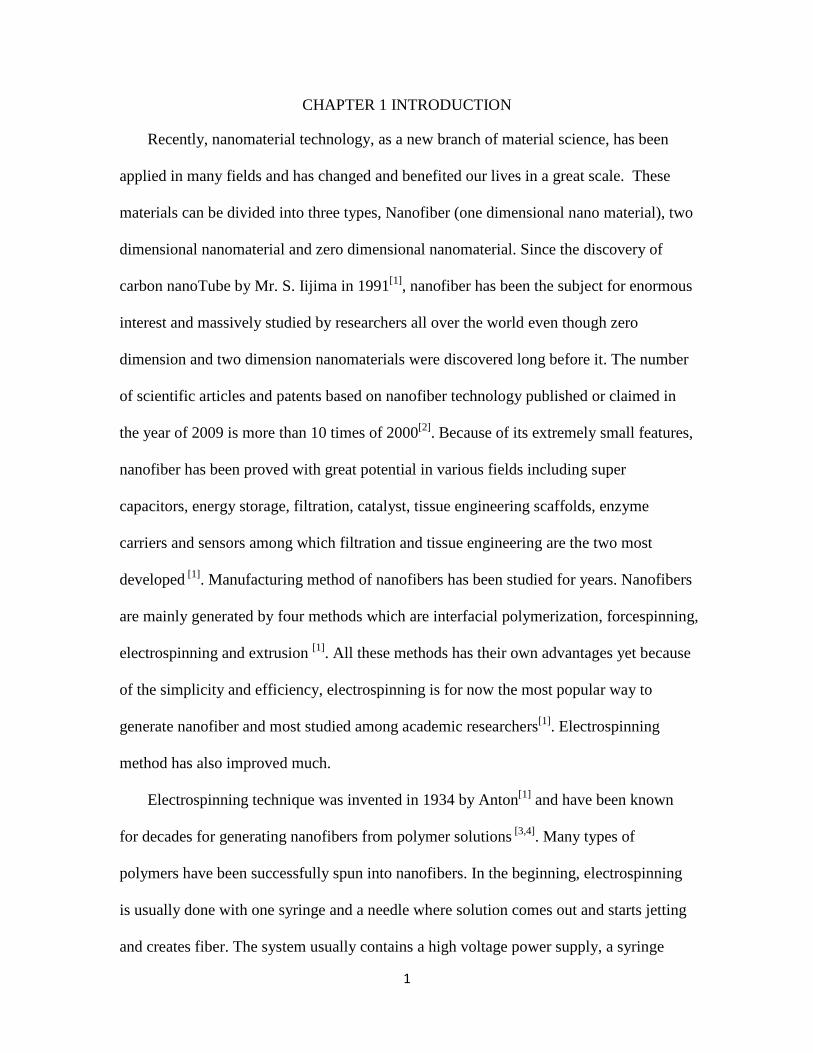
Recently, nanomaterial technology, as a new branch of material science, has been
applied in many fields and has changed and benefited our lives in a great scale. These
materials can be divided into three types, Nanofiber (one dimensional nano material), two
dimensional nanomaterial and zero dimensional nanomaterial. Since the discovery of
carbon nanoTube by Mr. S. Iijima in 1991[1], nanofiber has been the subject for enormous
interest and massively studied by researchers all over the world even though zero
dimension and two dimension nanomaterials were discovered long before it. The number
of scientific articles and patents based on nanofiber technology published or claimed in
the year of 2009 is more than 10 times of 2000[2]. Because of its extremely small features,
nanofiber has been proved with great potential in various fields including super
capacitors, energy storage, filtration, catalyst, tissue engineering scaffolds, enzyme
carriers and sensors among which filtration and tissue engineering are the two most
developed [1]. Manufacturing method of nanofibers has been studied for years. Nanofibers
are mainly generated by four methods which are interfacial polymerization, forcespinning,
electrospinning and extrusion [1]. All these methods has their own advantages yet because
of the simplicity and efficiency, electrospinning is for now the most popular way to
generate nanofiber and most studied among academic researchers[1]. Electrospinning
method has also improved much.
Electrospinning technique was invented in 1934 by Anton[1] and have been known
for decades for generating nanofibers from polymer solutions [3,4]. Many types of
polymers have been successfully spun into nanofibers. In the beginning, electrospinning
is usually done with one syringe and a needle where solution comes out and starts jetting
and creates fiber. The system usually contains a high voltage power supply, a syringe
2
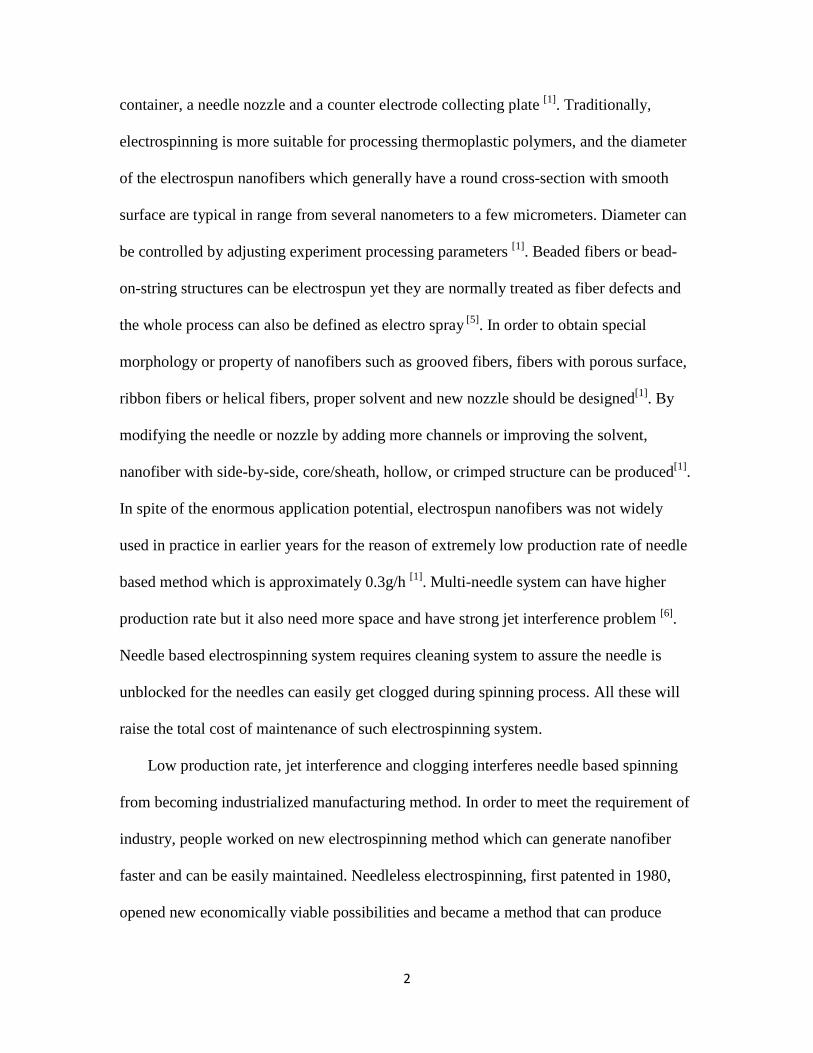
container, a needle nozzle and a counter electrode collecting plate [1]. Traditionally,
electrospinning is more suitable for processing thermoplastic polymers, and the diameter
of the electrospun nanofibers which generally have a round cross-section with smooth
surface are typical in range from several nanometers to a few micrometers. Diameter can
be controlled by adjusting experiment processing parameters [1]. Beaded fibers or bead-
on-string structures can be electrospun yet they are normally treated as fiber defects and
the whole process can also be defined as electro spray [5]. In order to obtain special
morphology or property of nanofibers such as grooved fibers, fibers with porous surface,
ribbon fibers or helical fibers, proper solvent and new nozzle should be designed[1]. By
modifying the needle or nozzle by adding more channels or improving the solvent,
nanofiber with side-by-side, core/sheath, hollow, or crimped structure can be produced[1].
In spite of the enormous application potential, electrospun nanofibers was not widely
used in practice in earlier years for the reason of extremely low production rate of needle
based method which is approximately 0.3g/h [1]. Multi-needle system can have higher
production rate but it also need more space and have strong jet interference problem [6].
Needle based electrospinning system requires cleaning system to assure the needle is
unblocked for the needles can easily get clogged during spinning process. All these will
raise the total cost of maintenance of such electrospinning system.
Low production rate, jet interference and clogging interferes needle based spinning
from becoming industrialized manufacturing method. In order to meet the requirement of
industry, people worked on new electrospinning method which can generate nanofiber
faster and can be easily maintained. Needleless electrospinning, first patented in 1980,
opened new economically viable possibilities and became a method that can produce
3
nanofiber in a mass industrial scale [7]. Numerous jets can form on the surface of the fiber
generator simultaneously in a natural self-organized way without interfering each other.
Research shows that the yield of poly (ethylene oxide) (PEO) nanofibers using a
needleless method can be more than 260 times in mass compared to using single-jet
needle based electrospinning [8]. In spite of the merit of this novel method, the quality of
nanofiber made by needleless electrospinning is hard to control due to many processing
parameters and the fiber usually has monotonous morphology with round smooth surface
[4]. With constant improvement it is now proved that with optimum parameters,
needleless electrospinning can also generate high quality nanofiber. Lin et al. [1]
successfully used spiral coil to generate nanofibers with smaller diameter and narrower
distribution than the fibers from needle based electrospinning. Thus the study of the
effect of different parameters became crucial in the commercialization of needleless
electrospinning and it is in great need to build a needleless electrospinning system. The
first part of this study focused on building up an onsite needleless electrospinning device
to study the processing parameter and also provide nanofiber sample for other
discipline’s research.
With higher production rate and higher quality, nanofibers become cheaper and more
applicable. Other than the application fields mentioned previously, nanofiber can also be
a promising material in thermal management of microelectronic packaging. R. Srikar et al
[9] have testified superior performance of nanofiber in drop or spray impact cooling. In
their study, polymer nanofiber with thickness about 100 um was coated on the electronic
metal surface. When water drop on the metal surface, the fiber mat reduces the bounce
back and increase the wettability of the surface at the same time by letting water penetrate
4
into nanofiber and evenly distribute on metal surface thus the water can fully contact heat
source and evaporate quickly. Considering the work mechanism of traditional metal wick
structure in a heat pipe is very similar to the drop impact cooling where water flow inside
porous media and evaporate to take away heat of the same amount of latent heat, it is
worth trying to apply nanofiber in heat pipe. It is notable that nanofiber layer with smaller
pore size might have better capillary pressure and better capillary induced liquid flow
than wick structure. Nanofiber is also lighter than metal wick structure as another
advantage.
Before we present the details of this work, we first take a review of the specialty of
nanofiber, the mechanism of electrospinning and thermal management of semiconductor
packaging.
1.1 Nanofiber
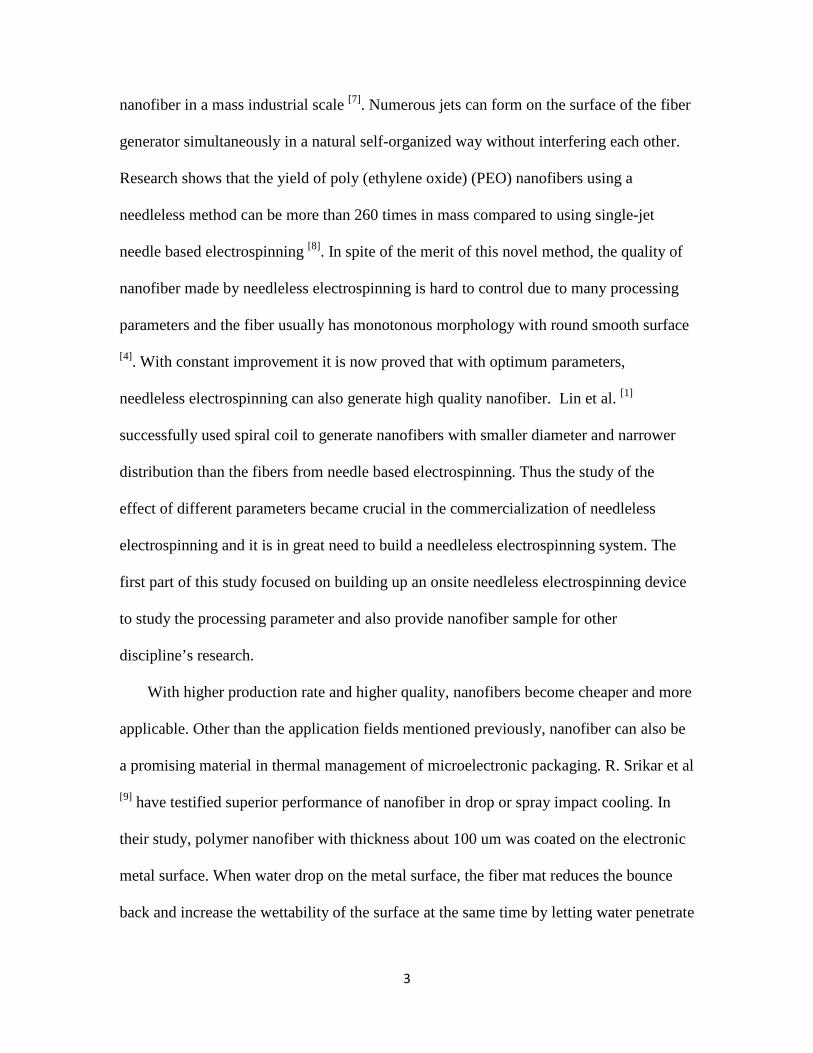
Figure 1. Nanofiber, Pollen and Human hair Nanofibers are generally defined as the fibers with diameter lower than 100
nanometers. The definition can sometimes be extended to fibers with diameter smaller
than 1000 nanometers from a commercial perspective. Figure 1 gives an idea of how
small these fibers are by comparing them with pollen and human hair. Beyond improving
the performance of traditional textiles and fabrics, nanofibers are creating entirely new
5
applications for fibers because of its many unique characteristics. First, since nanofiber
has fiber diameter reaching nano-scale, there is a shift of governing physic mechanism
within the material media. For example gravity becomes less important while Van der
Walls force becomes the governing factor. Second, nanofiber has extremely high surface
to mass ratio [10]. The surface area to mass ratio increases as the diameter decrease thus
nanofiber has a very high ratio which is about 1000 times higher than a microfiber and
reaches as high as 10-100 m2/g [10]. It has been shown that nanofiber also has many other
advantages like higher tensile strength (thus can reduce crack propagation), thermal
properties (higher thermal resistance), electrical properties (improve electron transfer).
Because of all these features, nanofiber can be used in multiple fields such as air and
liquid filtration (for its extremely small pore size and high porosity), performance apparel
with low wettability and high strength (extremely small pores material, high thermal
resistance and high tensile strength), acoustic muffler (high surface to volume ratio can
absorb most of the energy of air vibration), wound dressing (unique flexible structure
with tiny pores containing medicine), battery separators (extremely small pores) and drug
delivery (high surface to volume ratio).
Nowadays nanofibers can be produced by method of interfacial polymerization,
forcespinning, electrospinning and extrusion.
1.2 Electrospinning
Electrospinning is one of the most popular way to fabricate nanofibers today [11] for it
can create nanomaterials with excellent properties. Unlike traditional spinning
techonologies, electrospinning is free of complex movement of mechanical components
which does reciprocate move to twist and draw fibres into yarn and fabric. On the
6
contrary, it is based on self-organization of nanoscale fibers in an electric field which
resembles biological processes of formation of cellulose and collagen [11].
The electrospinning process includes multiple stages such as jetting, jet whipping and
drying. The liquid (usually polymer solution) is first electrified by an external electric
field and start to form Tylor cones on the surface. When the electric force exceeds certain
value a jet of the liquid will come out of the cone and dragged to the opposite electrode
under electric force. The jet can remain straight for a while and then start to whip and dry
during which the diameter of the jet fall into nanoscale and the jet solidify as fiber and
deposits itself on opposite electrode.
1.2.1 Tylor Cone
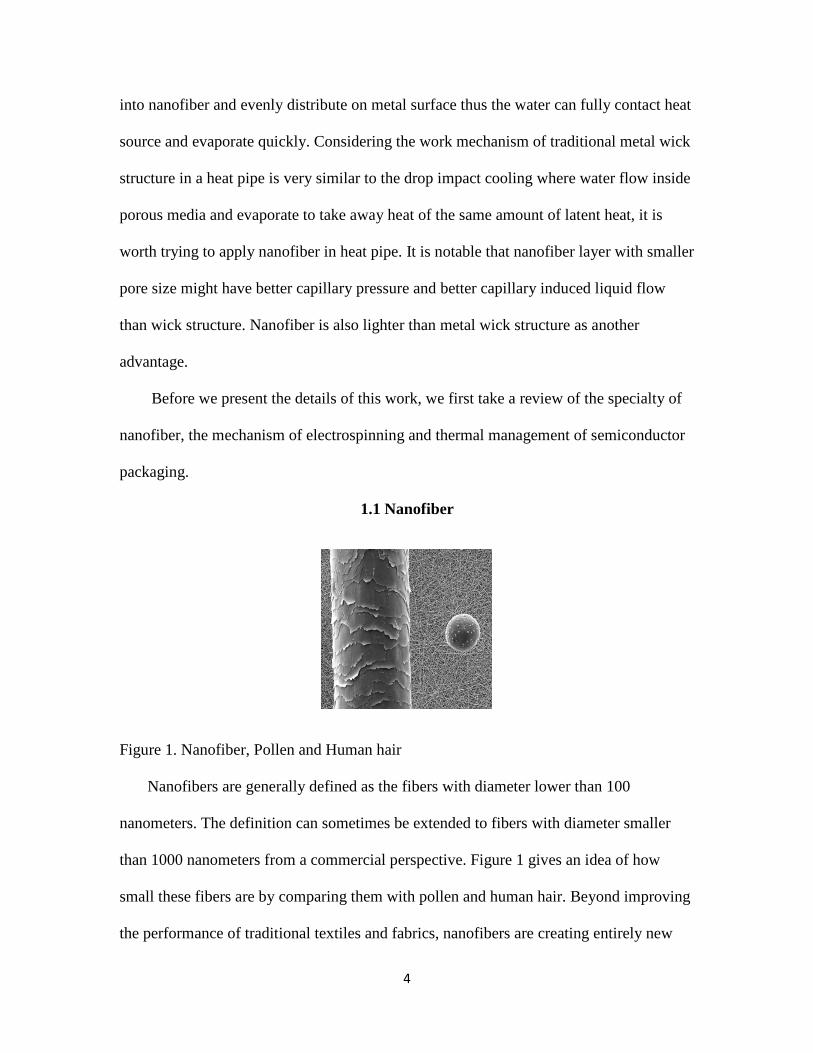
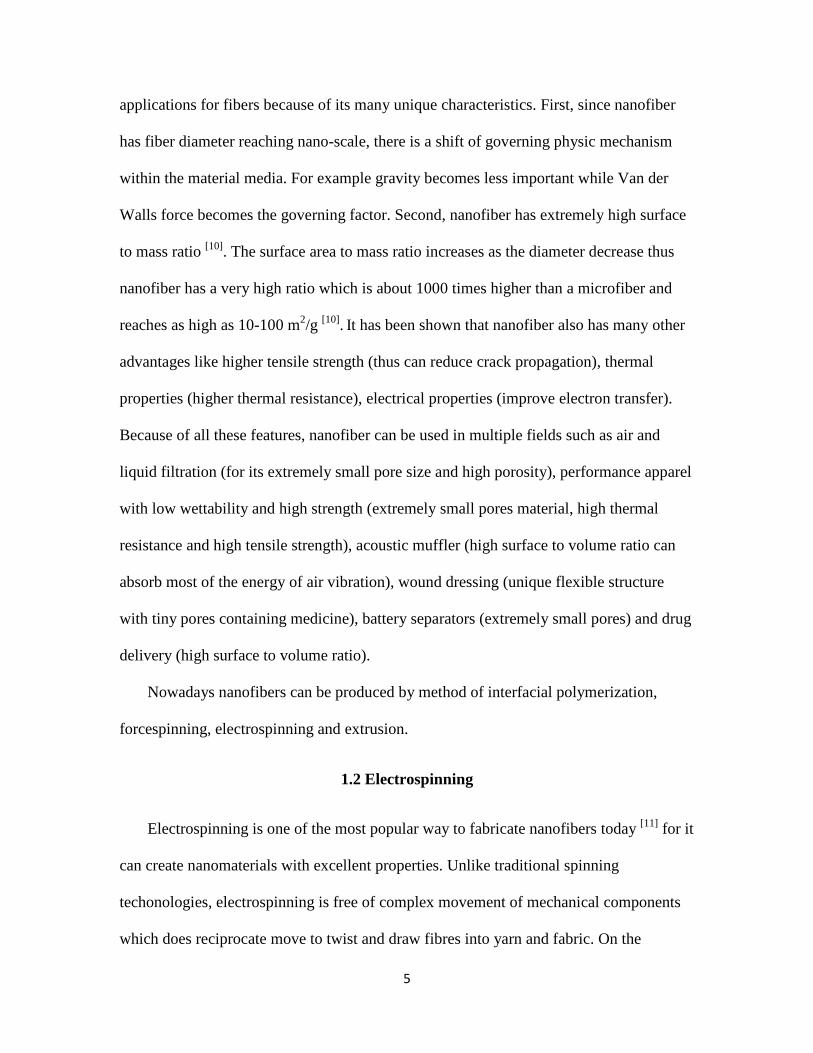
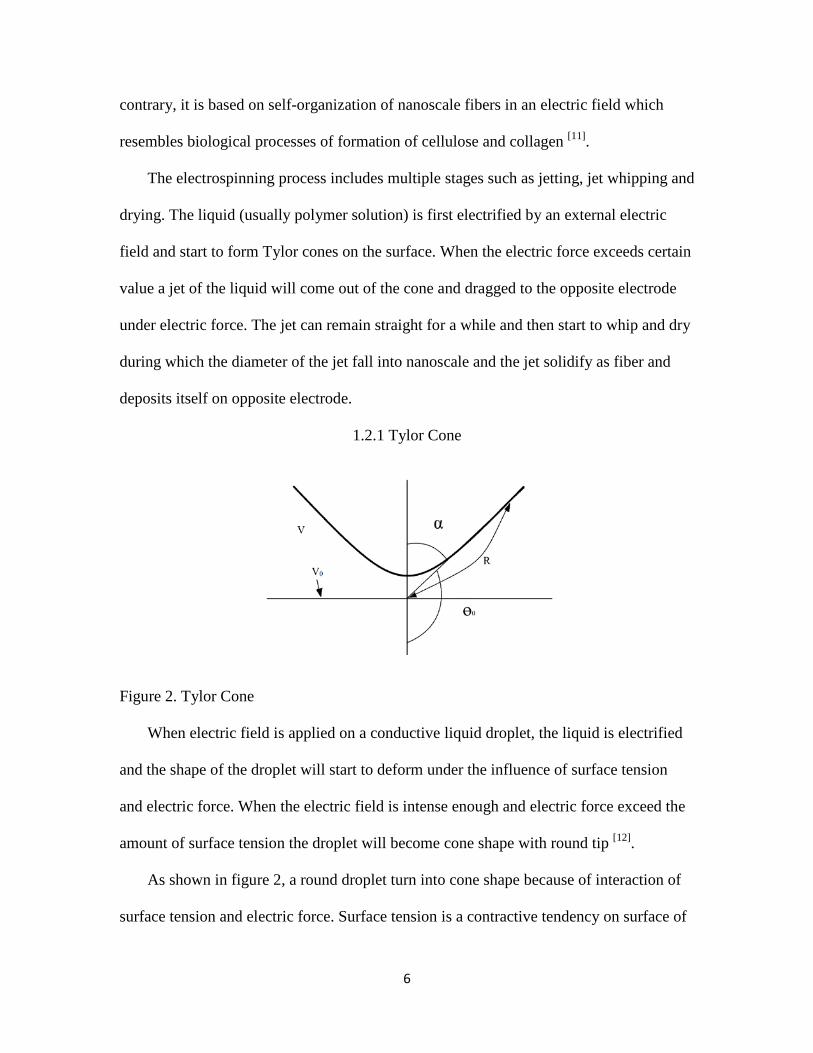
Figure 2. Tylor Cone When electric field is applied on a conductive liquid droplet, the liquid is electrified
and the shape of the droplet will start to deform under the influence of surface tension
and electric force. When the electric field is intense enough and electric force exceed the
amount of surface tension the droplet will become cone shape with round tip [12].
As shown in figure 2, a round droplet turn into cone shape because of interaction of
surface tension and electric force. Surface tension is a contractive tendency on surface of
7
a liquid that allows it to resist external force. Surface tension is caused by cohesive force
between liquid molecules within the droplet. While the molecule inside the liquid are
under balanced cohesive forces from their neighbors, the ones on the surface are under
unbalanced forces and are being pulled back by inward force. Thus the surface tension on
liquid surface are equal everywhere. If the electric force applied on the liquid it will start
to deform the droplet by overcoming the surface tension. According to Taylor ’s theory,
electric force and surface tension should be equal on liquid’s surface and electric force is
determined by equipotential line, so eventually the shape of the droplet will turn to the
shape of equipotential line. Thus Taylor’s derivation has two assumptions: (1) the surface
of the cone is equipotential surface; (2) the cone exist in a steady state equilibrium
(electric force and surface tension are balanced) [13, 14].
As shown in figure 2, the potential V of a point between equal potential line (V0) and
liquid drop surface can be expressed in a spherical coordinate as equation (1.1) where γ is
the surface tension, R is the coordinate radius, )(cos 02/1 θP is the Legendre function of
the order 1/2. In order to reach the equilibrium state, equation (1.3) must equal to 0 which
means 𝜃0=130.7o. Thus Tylor angle can be obtained as α = 49.3𝑜.
)(cos 02/12/1
0 θγ PRVV += (1.1)
0VV = (1.2)
0)(cos 02/1 =θP (1.3)
If the voltage reached and exceeded a certain value, a strain of solution will jet out
from the rounded tip. When jetting happens, the rounded tip turns into sharp conical tip
which is very close to the theoretical perfect cone of exactly predicted angle.
Critical applied voltage for electrospinning was proposed by Taylor in 1969[15] as:
8
𝑉𝑐2 = 4𝑙𝑛 �2ℎ𝑅� (1.3𝜋𝑅′𝛾)(0.09) (1.4)
Where h is the electrodes distance, R’ is the needle tip outer radius, 𝛾 is the solution
surface tension, 0.09 is constant.
𝐹𝑒 = 𝐸𝑞 (1.5)
E = −∇V (1.6)
According to the relationship between voltage and electric intensity, we know we can
always increase electric intensity by raising voltage or change geometry to higher
curvature. The critical voltage 𝑉𝑐 in kilovolts is given by Taylor et al [11] where γ is the
surface tension, R’ is the radius of the needle tip, h is the distance between two electrodes
and the hydrostatic pressure is zero:
�4 ln(2ℎ𝑅′
)𝜋𝑅′𝛾1.30(0.09) < 𝑉𝑐 < �4 ln( 4ℎ𝑅′
)𝜋𝑅′𝛾1.30(0.09) (1.7)
It is worth noticing that viscosity is not included inside this equation because the
liquid is not in motion thus viscosity is negligible.
For needleless electrospinning, Taylor cone can also form on the free surface yet the
electric field must previously cause unstable waves on the liquid surface. Lucas et al
explained the critical electric intensity for self-organization of waves on free surface
liquid as:
𝐸𝑐 = �4𝛾𝜌𝑔/𝜀24 (1.8)
Where 𝜌 is liquid density, g is gravity acceleration, 𝛾 is solution surface tension, 𝜀 is the
electric permittivity.
9
1.2.2 Needle and Needleless Electrospinning
After the liquid solution ejects from the tip of the Taylor cone, it will first go through
straight jet stage and then a whipping elongation stage [16] before it finally turn into
nanofiber. It is accepted that when jet is in the air, the process is governed by four steady
state equations representing conservation of mass and electric charges, the linear
momentum balance and Coulomb’s law [16].
π𝑅′′2𝑣 = 𝑄 (1.9)
π𝑅′′2𝐾𝐸 + 2𝜋𝑅′′𝑣𝜎𝛼 = 𝐼 (1.10)
ρνν′ = ρg + 3𝑅2
𝑑𝑑𝑧
(𝜂𝑅′′2𝑣′) + 𝛾𝑅′′′𝑅2
+ 𝜎𝜎′𝜀�
+ (𝜀 − 𝜀)̅𝐸𝐸′ + 2𝜎𝐸𝑅′′
(1.11)
E(z) = 𝐸∞(𝑧) − ln𝜒(1𝜀�𝑑(𝜎𝑅′′)𝑑𝑧
− 𝛽2𝑑2(𝐸𝑅′′2)
𝑑𝑧2) (1.12)
Where R’’ is the jet radius, ν is axial velocity, Q is the volume flow rate, K is the
conductivity of the liquid, E is the z-axis component of the electric field, σ is the surface
charge density, α is the surface charge parameter, I is the current, ρ is liquid density, η is
liquid viscosity, ε is dielectric constant of liquid, 𝜀 ̅is the dielectric constant of ambient air,
𝐸∞ is external electric field, χ is the L/R0 the aspect ratio, β is ε𝜀�− 1. ν′, R′′′,σ′,E′ are first
derivatives with respect to z.
10
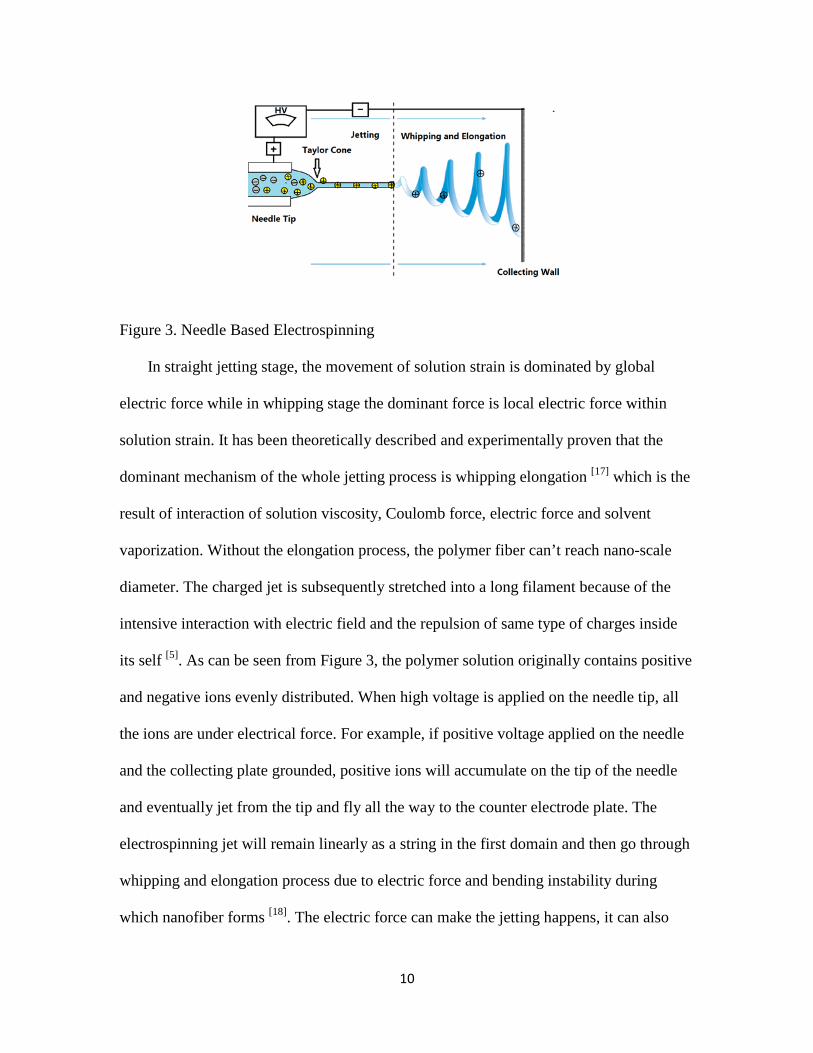
Figure 3. Needle Based Electrospinning In straight jetting stage, the movement of solution strain is dominated by global
electric force while in whipping stage the dominant force is local electric force within
solution strain. It has been theoretically described and experimentally proven that the
dominant mechanism of the whole jetting process is whipping elongation [17] which is the
result of interaction of solution viscosity, Coulomb force, electric force and solvent
vaporization. Without the elongation process, the polymer fiber can’t reach nano-scale
diameter. The charged jet is subsequently stretched into a long filament because of the
intensive interaction with electric field and the repulsion of same type of charges inside
its self [5]. As can be seen from Figure 3, the polymer solution originally contains positive
and negative ions evenly distributed. When high voltage is applied on the needle tip, all
the ions are under electrical force. For example, if positive voltage applied on the needle
and the collecting plate grounded, positive ions will accumulate on the tip of the needle
and eventually jet from the tip and fly all the way to the counter electrode plate. The
electrospinning jet will remain linearly as a string in the first domain and then go through
whipping and elongation process due to electric force and bending instability during
which nanofiber forms [18]. The electric force can make the jetting happens, it can also
11
elongate the string into fibers. Because the jets contain a lot of positive ions, the repulsion
force between these ions can stretch the fiber by pushing each other away thus the longer
it keeps flying in air the thinner the fiber will be. Solvent evaporation happens during the
flying domain leads to the solidification of the filaments into fibers [5]. As the fiber
elongates, surface area gets bigger and bigger and this could in return benefit the solvent
vaporization. This is why people have been adding volatile additions into solution during
electrospinning process. As the jet gets thinner, longer and solidified, they are collected
by a collecting plate, which is usually grounded or connected to a counter electrode.
Needle based electrospinning process is an extremely complicated process which
includes fields in physical and chemical engineering, mainly subjects such as
electrostatics, hydrodynamics, rheology, aerodynamics, mass transfer, heat transfer.
charge transfer between solid and liquid surfaces[19]. Changing parameters could
influence the production rate and quality of the fiber which generally taken as the
porosity, the mean fiber diameter and the distribution of diameter [4]. Processing
parameters can be put into three categories as solution properties, process conditions and
ambient conditions [20]. It can also be divided into two groups: Independent parameters
and dependent parameters [21]. Independent parameters are parameters can be directly
controlled by operator for example type of polymer, molecular weight, type of solvent,
solution concentration, rheological characteristic, solution temperature, solution surface
tension, solution electric conductivity, type and geometry of spinneret and collector
electrode, distance between electrodes, rotation/movement of electrode, voltage applied,
throughput, relative humidity, ambient temperature and air flow velocity [21]. Dependent
parameters are parameters determined by independent parameters for example life of jets,
12
electric current and area weight of nanofiber layer [21]. The key to get high quality
nanofiber is to find balance between all these parameters which correlate each other. For
example, increasing polymer concentration can reduce surface tension yet will increase
viscosity at the same time [22]. If the solution viscosity is too high, jet will not form and if
the viscosity is too low, jet will break into beads [22]. Generally the viscosity of the
solution should be maintained at 1~ 20 poise [22]. The polymer concentration and solvent
type determine the solution surface tension and viscosity [23]. The voltage, work distance
and spinneret type together determine the electric field. The solvent type, air flow,
polymer concentration, work distance, humidity, temperature and electric field together
determine the whipping and solidification of nanofiber when flying between electrodes.
Needleless electrospinning needs even more consideration in processing parameters
such as the geometry of spinnerets, instability/vibration of solution.
Spinneret geometry play an important role in controlling fiber quality and
productivity [1]. In 2005, a cylinder shaped roller was introduced as the spinneret to
produce nanofiber and was immediately commercialized by Elmarco Co. with the name
of “Nanospider”. Because it is harder to reach high electric intensity on free surface, the
geometry of the spinneret is studied by many researchers. Since 2009, the spinneret has
been built in different shapes such as bowel edge, conical wire coil, metal plate, splashing
spinneret, rotary cone and even straight wire [1]. Niu et al. [1] and his group proved that a
spiral coil has higher production rate and better fiber morphology control than disk and
cylinder spinnerets. This is because of the electric intensity is highly dependent on the
applied voltage and the structure geometry. Sharper edges or smaller curve radius can
13
make higher potential gradient on its edges thus make the solution layer on it under
strong electric force and start to jet.
Mechanical vibration is desirable during spinning process for it can help initiating
jets. Rotation spinnerets can automatically introduce instability from spinneret movement
and vibration of transmission components. Stationary spinnerets need help of external
mechanism such as magnetic field or gravity [1]. In 2004, a magnetic-field-assisted
needleless electrospinning was reported to provide instability [1]. In 2007, air bubbles
were introduced to initiate unsteady state [1].
During needleless electrospinning, the surface of the spinneret is first covered by a
thin layer of polymer solution by rotating and partially immersion in the solution. Then a
high voltage is applied and lead to high electric intensity on spinneret spikes. The high
electric intensity together with the instability caused by rotation intensified the
perturbation to form Taylor cones [1]. Then the fibers follow the same process in needle
based electrospinning and finally deposit themselves on collecting plate.
Today the research work on needleless electrospinning generally focused on four
areas [21]: 1, Investigation on the physical principle of the needleless electrospinning
process in order to understand the mechanism way to control fiber quality. 2,
Experimental study on production parameters. 3, Develop laboratory, pilot and
productionl level electrospinning machine. 4, Develop of final fiber products for variety
purpose. This study is related to item 2, 3, 4.
14
1.3 Microelectronic Packaging
1.3.1 Thermal Management
According to Moore’s prediction in 1965, the number of transistors on integrated
circuit doubles every two years which will inevitably lead to remarkably higher power
density on packages. Researchers predict that the computer chips heat fluxes will get as
high as 150W/cm2 with sub-milimeter zones greater than 1000W/cm2 [24]. High
temperature within package could cause failure of functional parts. Thermal management
is now one of the most critical challenges of semiconductor packaging.
Thermal management is the strategy to enhance heat dissipation, maintain electronic
devices or circuitry at acceptable temperatures to ensure system reliability and prevent
premature failure. Techniques include heat sink and fans for air cooling, liquid cooling
and heat pipes.
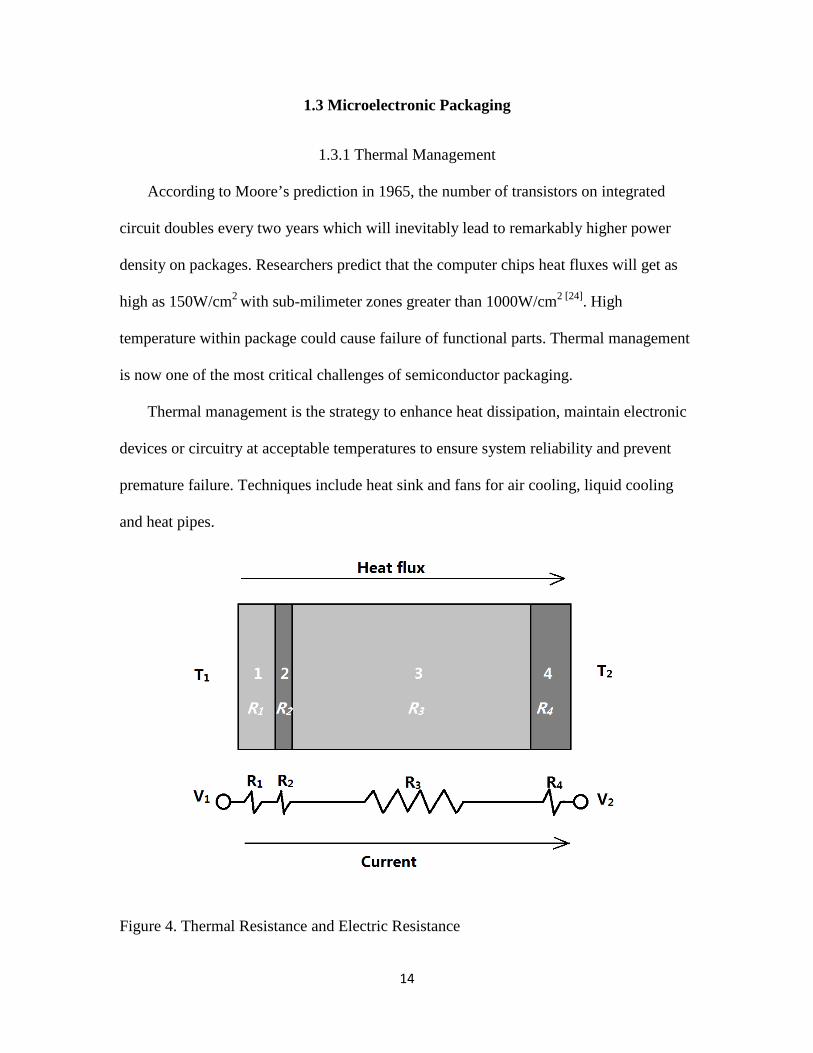
Figure 4. Thermal Resistance and Electric Resistance
15
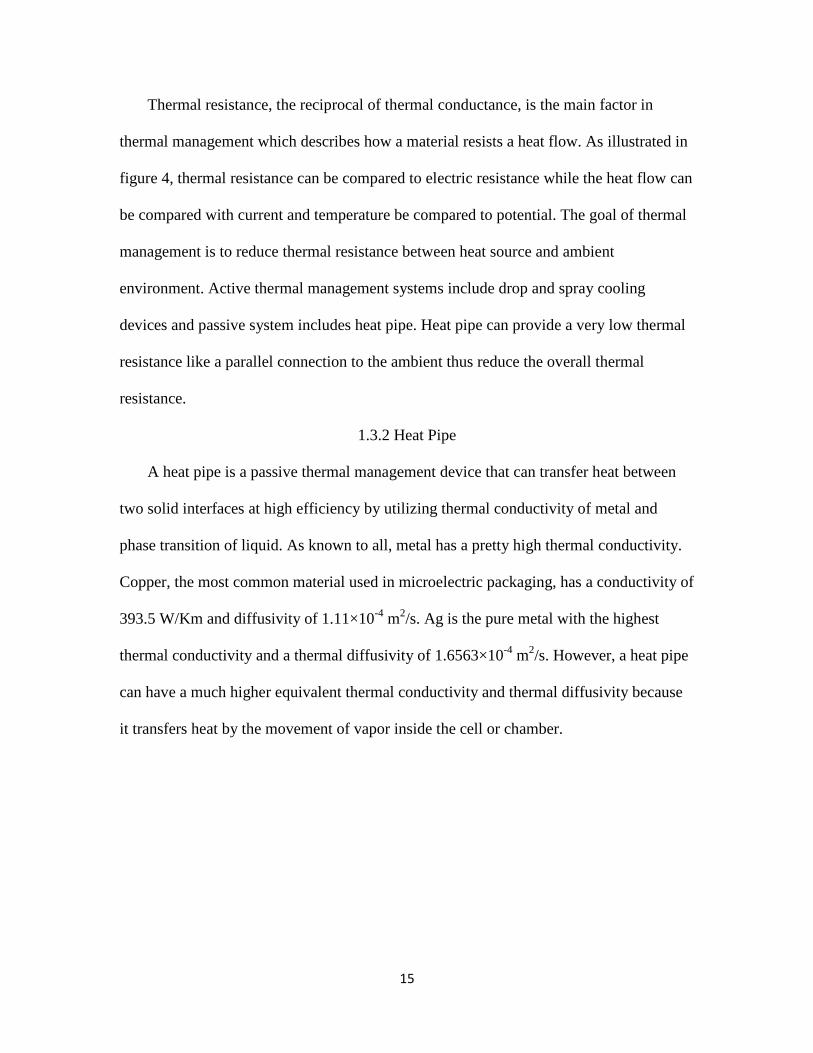
Thermal resistance, the reciprocal of thermal conductance, is the main factor in
thermal management which describes how a material resists a heat flow. As illustrated in
figure 4, thermal resistance can be compared to electric resistance while the heat flow can
be compared with current and temperature be compared to potential. The goal of thermal
management is to reduce thermal resistance between heat source and ambient
environment. Active thermal management systems include drop and spray cooling
devices and passive system includes heat pipe. Heat pipe can provide a very low thermal
resistance like a parallel connection to the ambient thus reduce the overall thermal
resistance.
1.3.2 Heat Pipe
A heat pipe is a passive thermal management device that can transfer heat between
two solid interfaces at high efficiency by utilizing thermal conductivity of metal and
phase transition of liquid. As known to all, metal has a pretty high thermal conductivity.
Copper, the most common material used in microelectric packaging, has a conductivity of
393.5 W/Km and diffusivity of 1.11×10⁻⁴ m2/s. Ag is the pure metal with the highest
thermal conductivity and a thermal diffusivity of 1.6563×10⁻⁴ m2/s. However, a heat pipe
can have a much higher equivalent thermal conductivity and thermal diffusivity because
it transfers heat by the movement of vapor inside the cell or chamber.
16
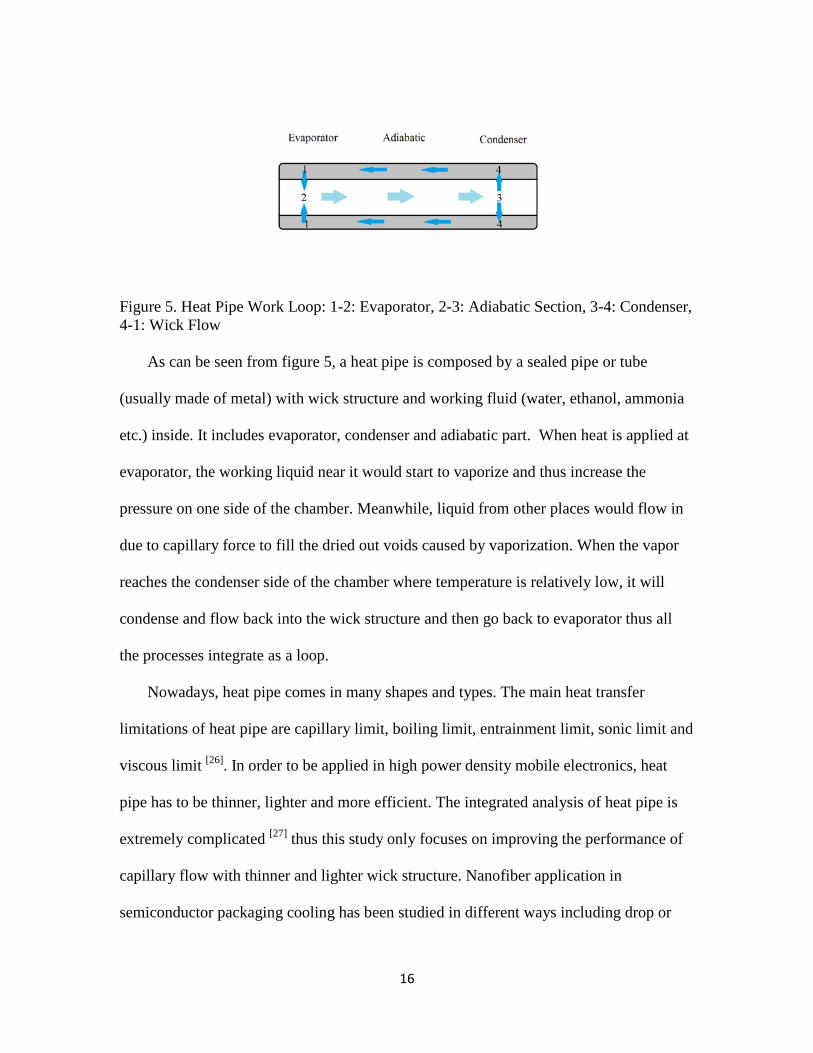
Figure 5. Heat Pipe Work Loop: 1-2: Evaporator, 2-3: Adiabatic Section, 3-4: Condenser, 4-1: Wick Flow As can be seen from figure 5, a heat pipe is composed by a sealed pipe or tube
(usually made of metal) with wick structure and working fluid (water, ethanol, ammonia
etc.) inside. It includes evaporator, condenser and adiabatic part. When heat is applied at
evaporator, the working liquid near it would start to vaporize and thus increase the
pressure on one side of the chamber. Meanwhile, liquid from other places would flow in
due to capillary force to fill the dried out voids caused by vaporization. When the vapor
reaches the condenser side of the chamber where temperature is relatively low, it will
condense and flow back into the wick structure and then go back to evaporator thus all
the processes integrate as a loop.
Nowadays, heat pipe comes in many shapes and types. The main heat transfer
limitations of heat pipe are capillary limit, boiling limit, entrainment limit, sonic limit and
viscous limit [26]. In order to be applied in high power density mobile electronics, heat
pipe has to be thinner, lighter and more efficient. The integrated analysis of heat pipe is
extremely complicated [27] thus this study only focuses on improving the performance of
capillary flow with thinner and lighter wick structure. Nanofiber application in
semiconductor packaging cooling has been studied in different ways including drop or
17
spray impact cooling, thermal interface material and nonwoven thermal insulation
material [23]. Nanopillar structure, similar to nanofiber, was studied with superior
performance in heat pipe yet it is hard for industrialized manufacture [24]. Applying
nanofiber in heat pipe is relatively novel idea and could lead to heat pipe with better
cooling performance for mobile phones, tablets and can make electronics thinner and
lighter. The potential merit of nanofiber is small dimension, light weight, high capillary
pressure, good capillary flow and flexibility. To illustrate that, we have to compare the
size, weight, capillary pressure and capillary flow between traditional wick structure and
nanofiber.
1.4 Scope of This Thesis
Mobile electronics are facing severe challenge in thermal management to as the
device become smaller, thinner and higher power density. Heat pipe which is a passive
liquid cooling device is very promising in solving the thermal management problem. Yet
traditional heat pipes using copper sinter wick structure, groove or mesh have limitation
in size, weight and capillary. Considering nanofiber mat, as a porous material, has smaller
pore size, lighter weight, thinner size than traditional wick structure and also needleless
electrospinning has made it possible for massive production of nanofiber, it is very
possible that nanofiber can work as the traditional wick structure and be part of ultrathin
heat pipes for semiconductor packaging.
The main focus of the presented thesis is to first build an onsite functional needleless
electrospinning device to study nanofiber fabrication process, quality control method and
generate sample fiber mat for further study. After nanofiber is successfully generated,
morphology, capillary action of the fiber sample mat are measured and compared with
18
corresponding properties of copper sinter wick structure. The feasibility of applying
nanofiber in heat pipe is further discussed.
1.5 Organization of the Thesis
Chapter 2 presents the construction and improvement of onsite needleless
electrospinning device, the experiment procedure and capillary test. Chapter 3 gives the
results of the measurements. The last chapter is the summary of the thesis.
19
CHAPTER 2 EXPERIMENTAL METHOD
2.1 Needleless Electrospinning
2.1.1 Experimental Design
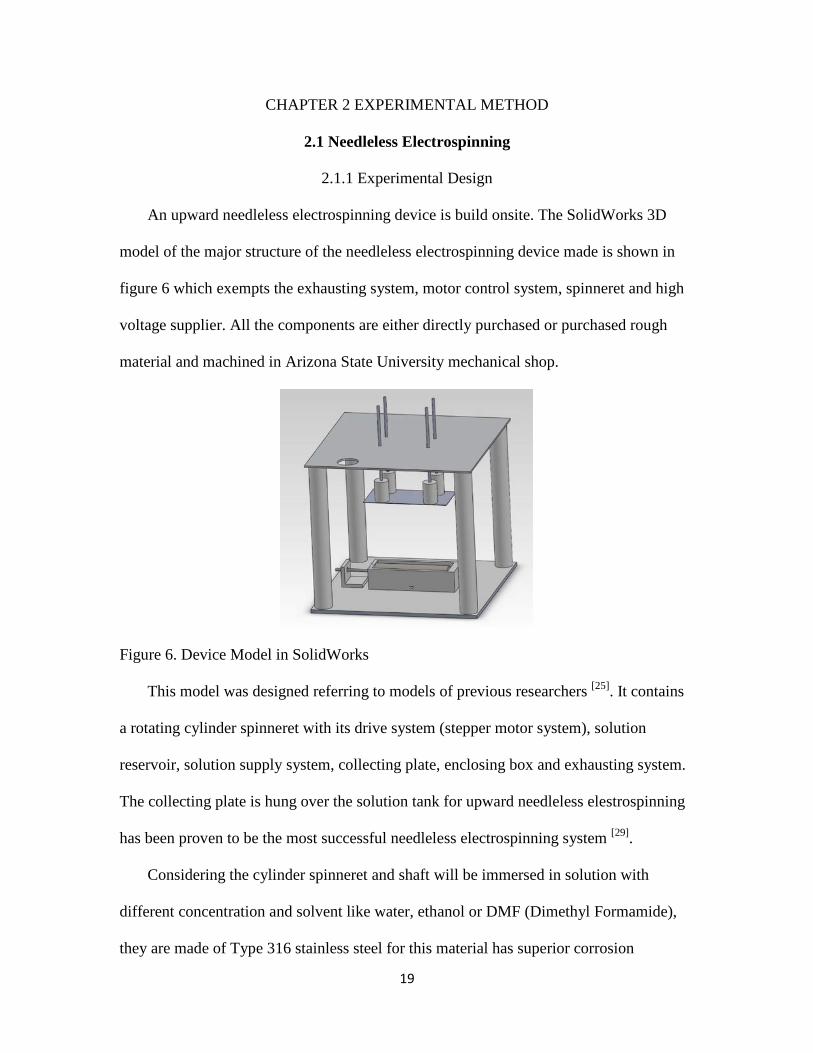
An upward needleless electrospinning device is build onsite. The SolidWorks 3D
model of the major structure of the needleless electrospinning device made is shown in
figure 6 which exempts the exhausting system, motor control system, spinneret and high
voltage supplier. All the components are either directly purchased or purchased rough
material and machined in Arizona State University mechanical shop.
Figure 6. Device Model in SolidWorks This model was designed referring to models of previous researchers [25]. It contains
a rotating cylinder spinneret with its drive system (stepper motor system), solution
reservoir, solution supply system, collecting plate, enclosing box and exhausting system.
The collecting plate is hung over the solution tank for upward needleless elestrospinning
has been proven to be the most successful needleless electrospinning system [29].
Considering the cylinder spinneret and shaft will be immersed in solution with
different concentration and solvent like water, ethanol or DMF (Dimethyl Formamide),
they are made of Type 316 stainless steel for this material has superior corrosion
20
resistance thus no oxidation should happen on the surface or joints and interference the
experiment. For the solution reservoir and supporting columns, UHMWPE (Ultra High
Molecular Weight Polyethylene) was selected because of its good mechanical impact
strength (structure will go through constant impact like vibration), chemical corrosion
resistance, machinability, light weight and electrical insulation property (the solution
inside might be charged with high voltage). Static dissipative UHMWPE was chosen to
build the base plate for it can reduce potential static electricity thus protect operator.
Transparent acrylic sheets were used as the shield to enclose the whole box to protect
operator from breathing in nanofibers and touching charged components and allowing
them to observe the whole process. The shield windows are equipped with auto- shut
interlock which will automatically shut down the HV supplier whenever the shield
window is open to prevent potential electric hazards. The top frame plate was made by
aluminum to prevent deflection and it is grounded. On the top frame plate, four holes
were drilled to fit the threaded rods which will hold the collecting plate. By adding eight
nuts the threaded rods can be fixed on the top plate and the height can be adjusted. We
used UHMW Coupler, which has good electrical insulating properties, to connect the rod
and the plate which is made of steel. Later PDMS (polydimethylsiloxane) was added on
the plate’s edge to avoid arcing. All the metal components are grounded except the
spinneret. Figure 7 below shows the final assembly of the electrospinning device.
21
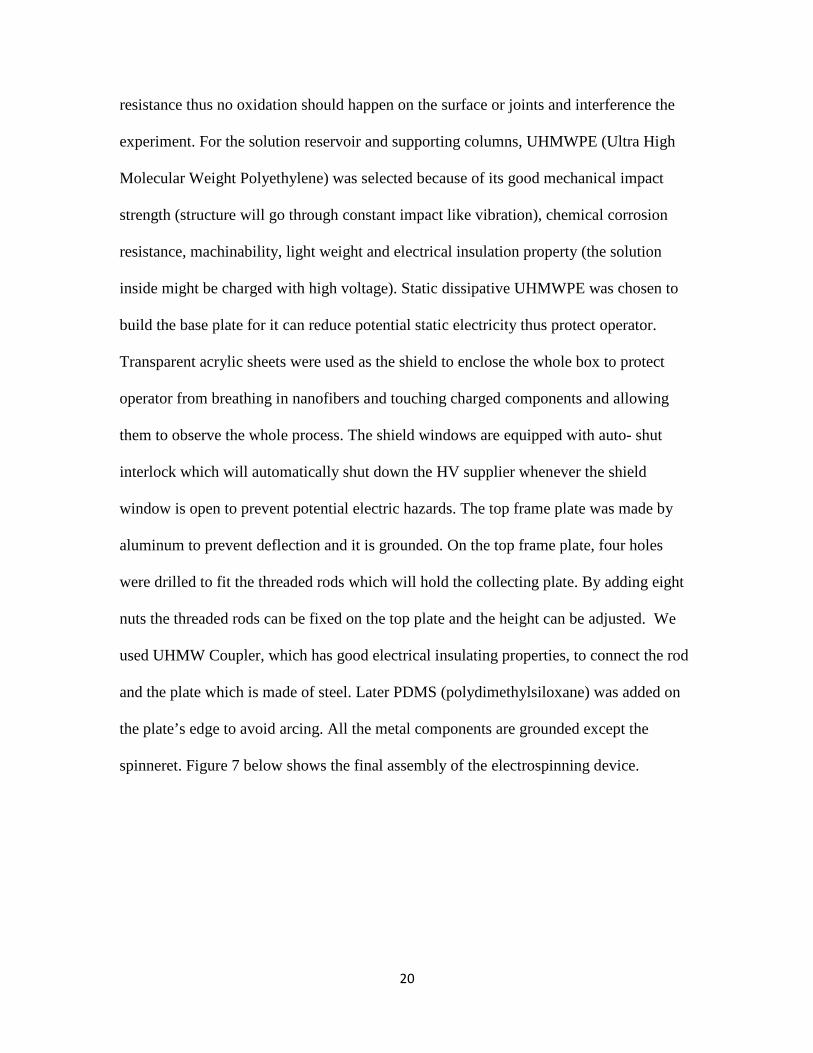
Figure 7. Picture of Device Set Up The spinneret is driven by step motor at a speed of 4 rpm or 13 rpm. If the rotating
speed of the cylinder spinneret is too high, solution layer on the spinneret’s surface will
not be enough time to form Taylor Cone while if the rotating speed is too low there will
not be enough instability and the feeding rate will be low that the spinning process might
stop. Based on previous researcher’s experience, the rotating speed should be set from a
few rpm to 60 rpm. The control program is installed in a host computer which is
connected to the step motor to control the rotating speed during the experiment.
Gamma High Voltage Power Supply ES75P-10W is used which supplies a DC
positive voltage potential from 0 to 75kV in 10 Watts with arc over and short circuit
protected (in needleless electrospinning, voltage above 40 KV is usually used [8]). The
current is about 133 uA which is lower than perception level current 1mA when an
electric shock occurs. Electropositive spinneret charging system or electronegative
collector charging system is proved to be superior in terms of fiber quality, compact fiber
deposition and higher productivity [19]. Yet for safety consideration the collector here is
connected with the positive electrode of the power supplier.
22
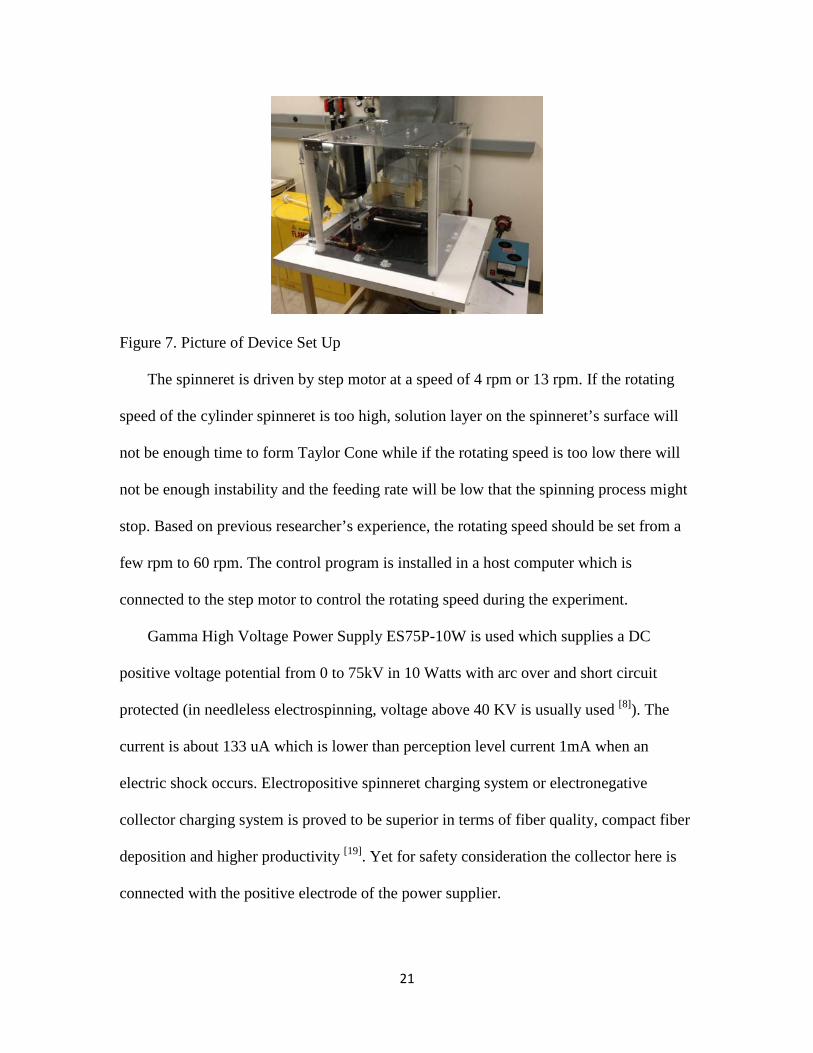
Cylinder spinneret, cylinder spinneret with chain ball and ring spinneret were used
for testing.
Figure 8. Cylinder Spinneret with Chain Ball
2.1.2 Safety Concerns
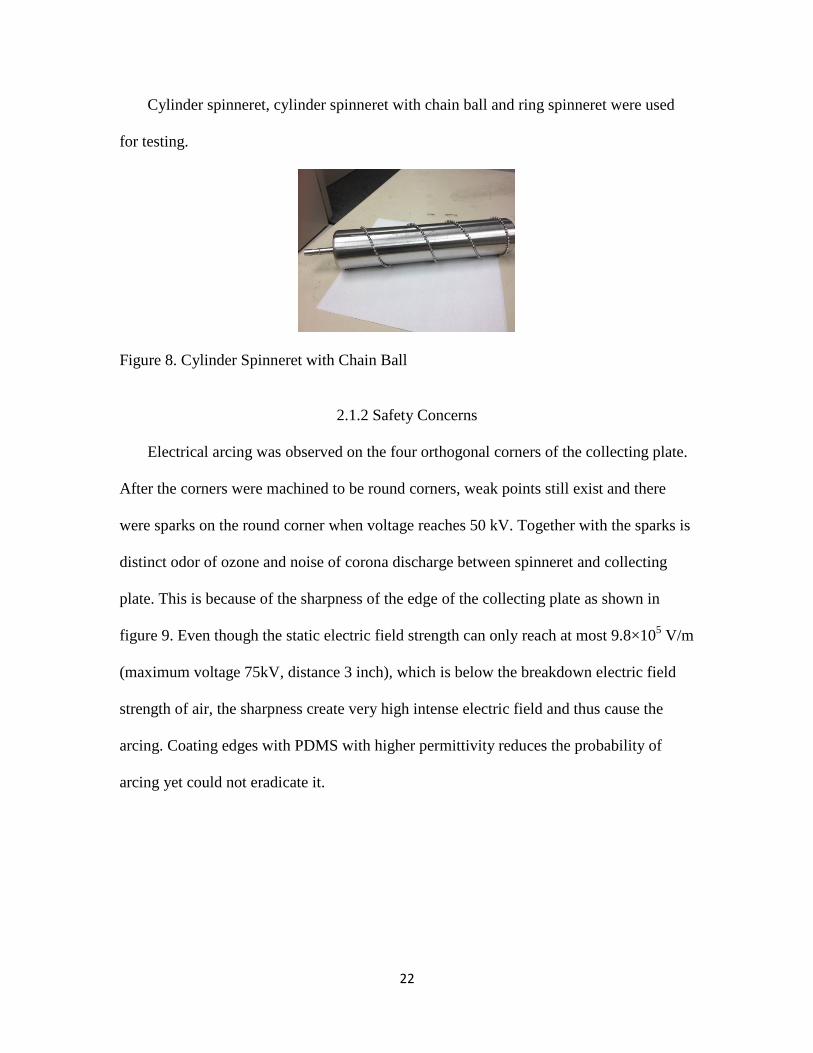
Electrical arcing was observed on the four orthogonal corners of the collecting plate.
After the corners were machined to be round corners, weak points still exist and there
were sparks on the round corner when voltage reaches 50 kV. Together with the sparks is
distinct odor of ozone and noise of corona discharge between spinneret and collecting
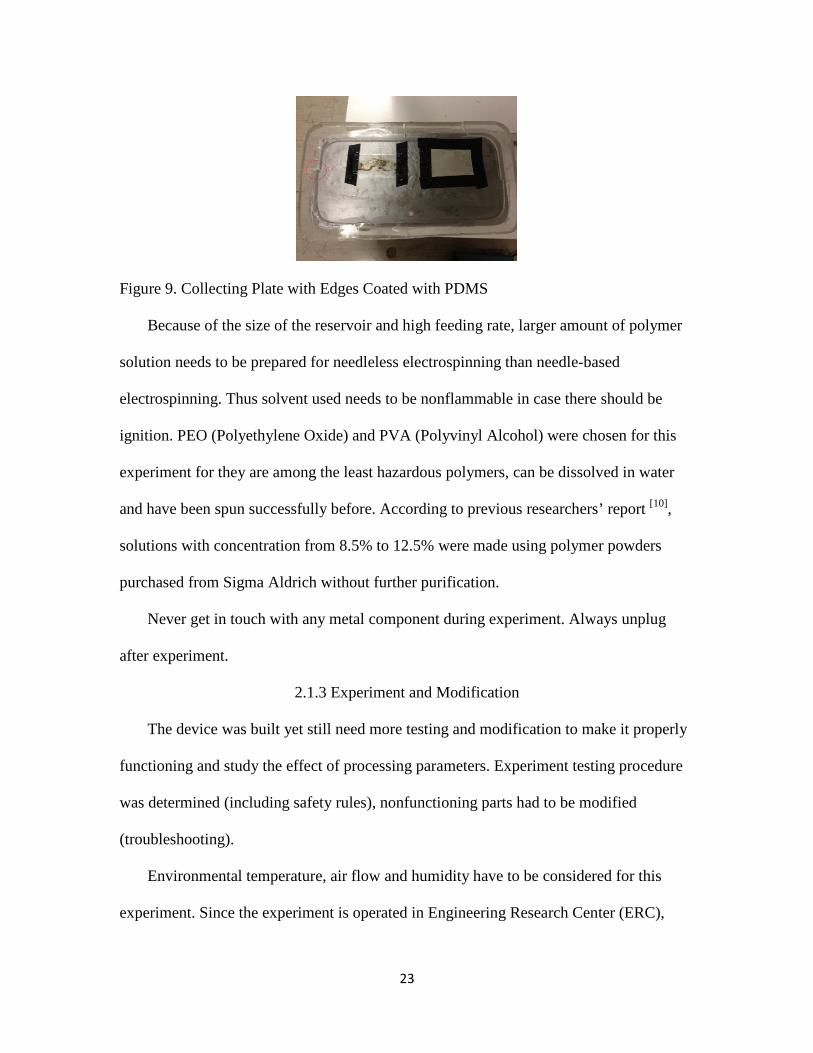
plate. This is because of the sharpness of the edge of the collecting plate as shown in
figure 9. Even though the static electric field strength can only reach at most 9.8×10⁵ V/m
(maximum voltage 75kV, distance 3 inch), which is below the breakdown electric field
strength of air, the sharpness create very high intense electric field and thus cause the
arcing. Coating edges with PDMS with higher permittivity reduces the probability of
arcing yet could not eradicate it.
23
Figure 9. Collecting Plate with Edges Coated with PDMS Because of the size of the reservoir and high feeding rate, larger amount of polymer
solution needs to be prepared for needleless electrospinning than needle-based
electrospinning. Thus solvent used needs to be nonflammable in case there should be
ignition. PEO (Polyethylene Oxide) and PVA (Polyvinyl Alcohol) were chosen for this
experiment for they are among the least hazardous polymers, can be dissolved in water
and have been spun successfully before. According to previous researchers’ report [10],
solutions with concentration from 8.5% to 12.5% were made using polymer powders
purchased from Sigma Aldrich without further purification.
Never get in touch with any metal component during experiment. Always unplug
after experiment.
2.1.3 Experiment and Modification
The device was built yet still need more testing and modification to make it properly
functioning and study the effect of processing parameters. Experiment testing procedure
was determined (including safety rules), nonfunctioning parts had to be modified
(troubleshooting).
Environmental temperature, air flow and humidity have to be considered for this
experiment. Since the experiment is operated in Engineering Research Center (ERC),
24
where the temperature is almost constant, we couldn’t control the ambient temperature.
Environment temperature and humidity is about 20oC and relative humidity is 30% to
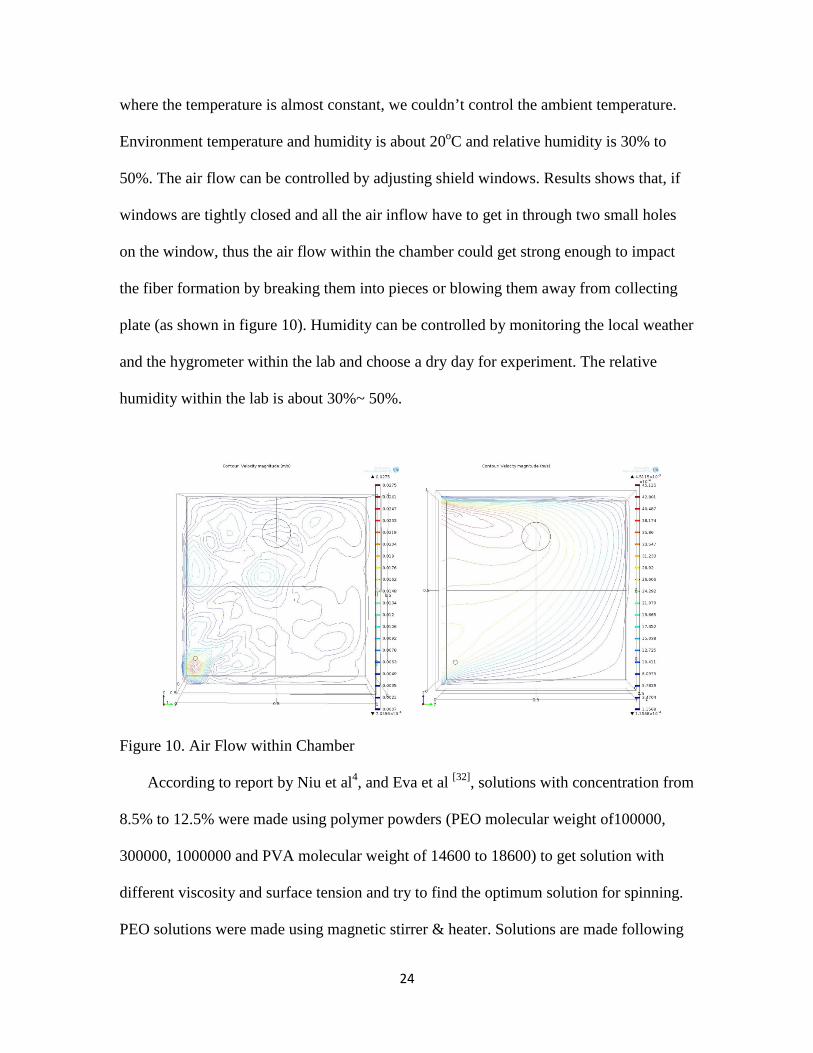
50%. The air flow can be controlled by adjusting shield windows. Results shows that, if
windows are tightly closed and all the air inflow have to get in through two small holes
on the window, thus the air flow within the chamber could get strong enough to impact
the fiber formation by breaking them into pieces or blowing them away from collecting
plate (as shown in figure 10). Humidity can be controlled by monitoring the local weather
and the hygrometer within the lab and choose a dry day for experiment. The relative
humidity within the lab is about 30%~ 50%.
Figure 10. Air Flow within Chamber According to report by Niu et al4, and Eva et al [32], solutions with concentration from
8.5% to 12.5% were made using polymer powders (PEO molecular weight of100000,
300000, 1000000 and PVA molecular weight of 14600 to 18600) to get solution with
different viscosity and surface tension and try to find the optimum solution for spinning.
PEO solutions were made using magnetic stirrer & heater. Solutions are made following
25
certain procedures. First put beaker on the magnetic stirrer & heater, fill it with certain
amount of deionized water. Then turn on the stirrer (for PVA solution, heater should also
be turned on later), gently pour powder into water as the magnet is stirring (stirring speed
set at 8 -9 in a scale of 10). As time going, the viscosity of the solution will increases, the
rotation speed of the magnet should be switched to lower value so the magnet can
continue stirring without getting entangled by thick solution. When all the powder are
added, remain stirring and heating for an hour and then turn off the heater and switch to
lower stirring speed and leave it overnight. To fill in the solution bin and make the
spinning happen, at least 180mL solution has to be made so that the spinneret can contact
the solution. All solution samples should be stored at room temperature [16].
Before starting the experiment, make sure the plug is out, power supplier is powered
off. The solution can be poured into reservoir directly. Adjust the height of the collecting
plate and stick aluminum foil on the plate (considering the balance between applied
voltage and collecting distance, the plate should be kept 4~15 cm above spinneret).
Connect the collecting plate with power supplier’s anode and ground the spinneret. Then
close the window shield, plug in and turn on the step motor. Make sure the spinneret can
spin in proper pace at 4 rpm (Cengiz et al used 3.2~4 rpm for their designs [15]) and the
surface of the spinneret is covered by solution. Now turn on the power supplier,
gradually raise the voltage until jetting happens or up to 70kV (higher than 7kV will
cause corona discharge. Stop increasing voltage as soon as jetting happens for higher
voltage will not improve fiber quality but just increase productivity [8]). When experiment
is done, turn off power supplier and plug out. Open the shield, ground the collecting plate
before taking it off. Fiber mat can be taken off the plate now. To drain the solution
26
reservoir, a syringe is used to suck the solution inside out to waste bottle. The spinneret
also needs to be cleaned after experiment. After filing the experiment minute form the
experiment is done and operator can leave lab. The experiment minute contains
information including time, duration, solution information, process condition and safety
check items.
Along with the test process, the collecting plate and the spinneret are modified for
better electrospinning and to study the effect.
The original collecting plate was designed as rectangular shaped steel plate. Arcing
can be observed on its corners with sparks when voltage reaches 50kV as the air
breakdown between plate and spinneret. The ozone, heat and noise of corona discharge
generated are dangerous in spite of the solution used is not flammable. Continuous arcing
can ionize air and produce ozone which is hazardous to human. Continuous arcing can
raise the temperature which may melt the fiber and cause damage to spinneret even
power supplier. To avoid the electrical breakdown in air, we re-machined the rectangular
corners of collect plate to round ones (so the electric field gradient is lower on the corner),
removed unnecessary metal components. The rest of the metal made components, such
as screws, stepper motor stand, top plate, solution valves, exhaust pipeline connection
were all grounded. In addition, according to simulation results, rounding the edge of
spinneret and apply lower permitivity on edge of the plate can decrease unnecessary high
electric potential gradient and thus reduce intensity on these areas (Figure 11). We
covered the edge of the steel plate with thick PDMS (Polydimethylsiloxane) as shown in
figure 9. PDMS has a larger breakdown voltage (2×10⁷ V/m) than air because of its great
band gap energy. The edge of the spinneret was also rounded and polished for the same
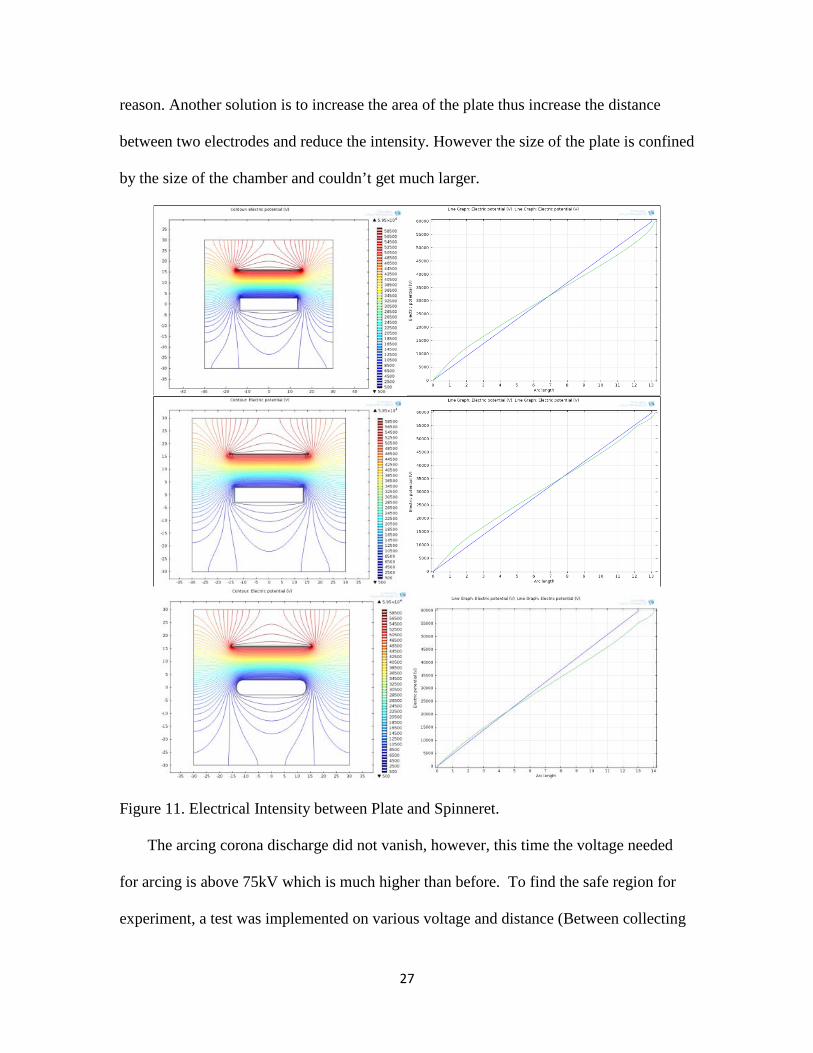
27
reason. Another solution is to increase the area of the plate thus increase the distance
between two electrodes and reduce the intensity. However the size of the plate is confined
by the size of the chamber and couldn’t get much larger.
Figure 11. Electrical Intensity between Plate and Spinneret. The arcing corona discharge did not vanish, however, this time the voltage needed
for arcing is above 75kV which is much higher than before. To find the safe region for
experiment, a test was implemented on various voltage and distance (Between collecting
28
plate and spinneret). Results (See appendix A) show that safe region is: when voltage
below 60 kV distance should be above 10 cm, when voltage over 60 kV distance should
be above 11.5 kV.
Even though there is no corona discharge, the fiber is not successfully fabricated. If
the plate is low and the voltage is high, which means the electric intensity is high enough,
the jetting could happen and fibers are spun to the plate. However, these fibers stay in the
air so short that they don't have time to whip or elongate itself and are not solidified
enough thus when they reach the plate they can only form a layer of solution or low
quality fiber. Raising voltage, changing polymer type, molecular weight, concentration,
work distance, adding salt, adding volatile solvent, adding air flow speed were all tried
yet none had solved the problem. Knowing that concentrated electric field on spinneret is
crucial in generation of Tylor cone and jets [33]. The question is how to get high electric
intensity on the spinneret and increase the distance while decrease or at least maintain the
electric intensity on collecting plate so no arcing would happen.
Researchers have worked on different types of spinnerets [34]. Niu et al [5]
systematically studied needleless electrospinning using different spinneret electrodes
(disc, cylinder, spiral coil and ball). They found that the key to initiate and maintain
consistent electrospinning and eventually get uniform nanofiber is to create highly
concentrated and evenly distributed electric field [8]. The formation of jets in free surface
of spinneret is highly dependent on electric field intensity and the electric field profile
(electric field gradient respectively [34]). Considering the current spinneret is a cylinder
with 3 inch diameter, a new spinneret is needed. Superior designs are usually impractical
to build in lab such as wires and spirals while easy-to-build designs usually have poor
29
performance such as cylinder and ball. Adding chain ball on cylinder didn’t help much in
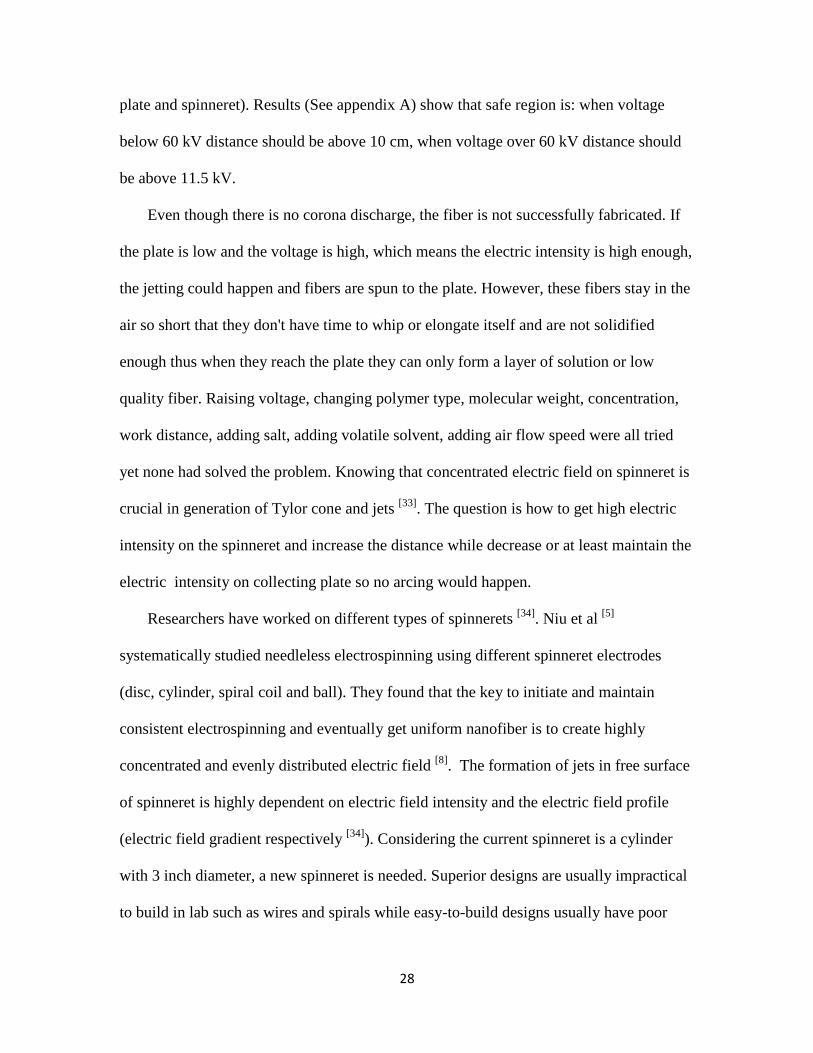
spinning. Electric simulation in Comsol shows that reducing the diameter of cylinder
spinneret and thus increasing the curvature could efficiently increase the electric intensity
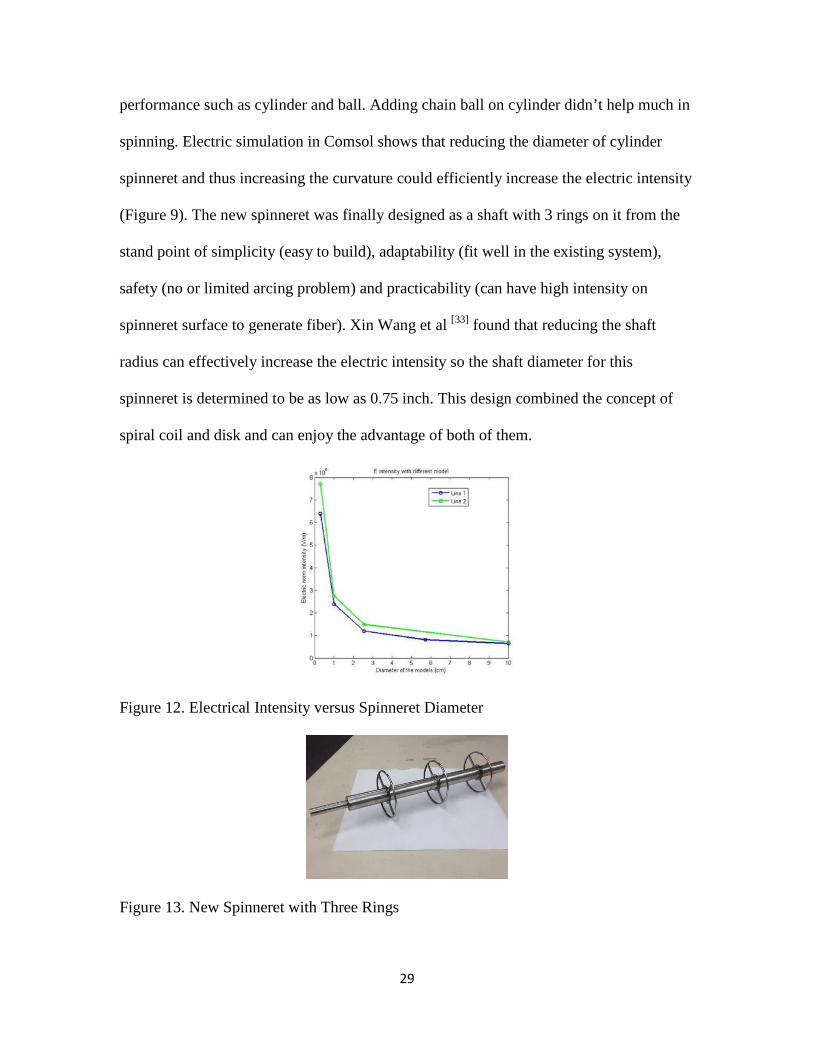
(Figure 9). The new spinneret was finally designed as a shaft with 3 rings on it from the
stand point of simplicity (easy to build), adaptability (fit well in the existing system),
safety (no or limited arcing problem) and practicability (can have high intensity on
spinneret surface to generate fiber). Xin Wang et al [33] found that reducing the shaft
radius can effectively increase the electric intensity so the shaft diameter for this
spinneret is determined to be as low as 0.75 inch. This design combined the concept of
spiral coil and disk and can enjoy the advantage of both of them.
Figure 12. Electrical Intensity versus Spinneret Diameter
Figure 13. New Spinneret with Three Rings
30
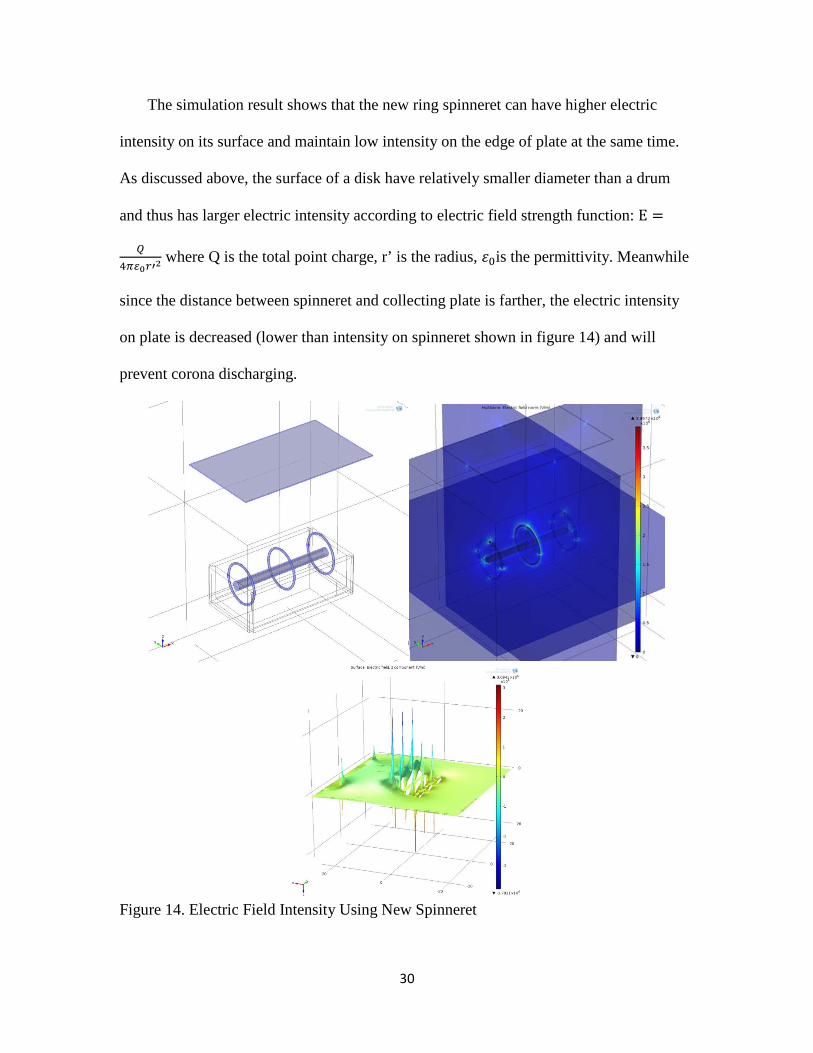
The simulation result shows that the new ring spinneret can have higher electric
intensity on its surface and maintain low intensity on the edge of plate at the same time.
As discussed above, the surface of a disk have relatively smaller diameter than a drum
and thus has larger electric intensity according to electric field strength function: E =
𝑄4𝜋𝜀0𝑟′2
where Q is the total point charge, r’ is the radius, 𝜀0is the permittivity. Meanwhile
since the distance between spinneret and collecting plate is farther, the electric intensity
on plate is decreased (lower than intensity on spinneret shown in figure 14) and will
prevent corona discharging.
Figure 14. Electric Field Intensity Using New Spinneret
31
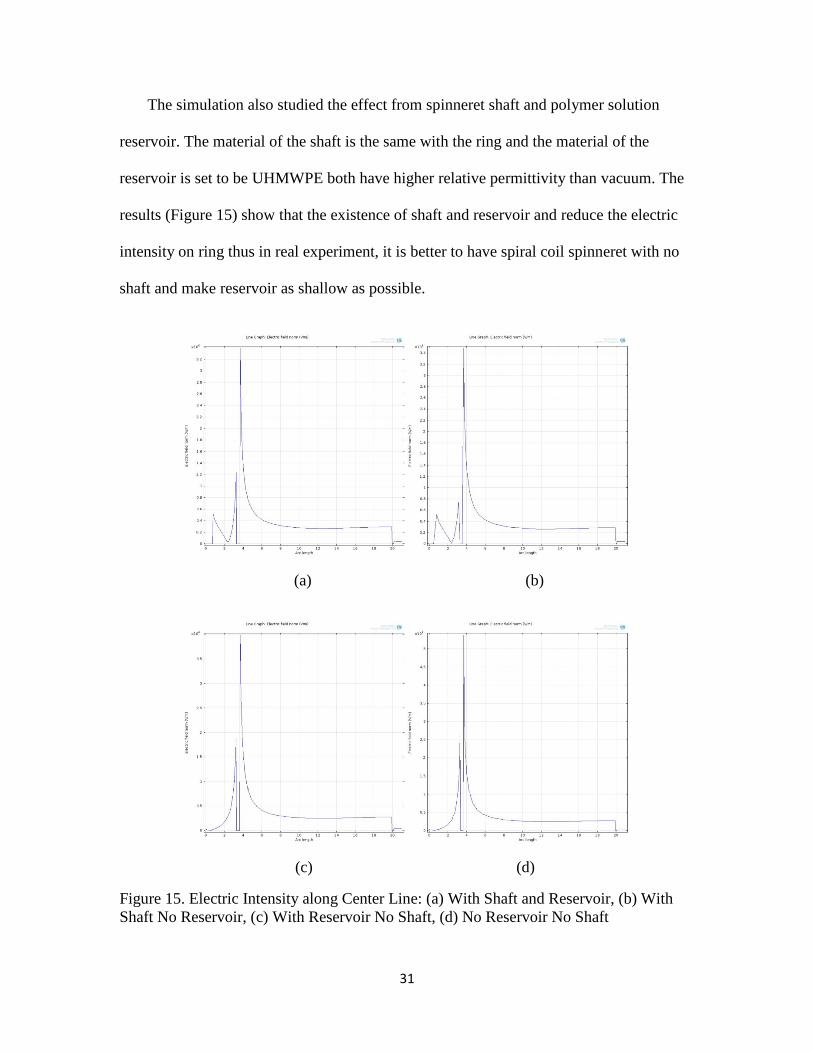
The simulation also studied the effect from spinneret shaft and polymer solution
reservoir. The material of the shaft is the same with the ring and the material of the
reservoir is set to be UHMWPE both have higher relative permittivity than vacuum. The
results (Figure 15) show that the existence of shaft and reservoir and reduce the electric
intensity on ring thus in real experiment, it is better to have spiral coil spinneret with no
shaft and make reservoir as shallow as possible.
(a) (b)
(c) (d)
Figure 15. Electric Intensity along Center Line: (a) With Shaft and Reservoir, (b) With Shaft No Reservoir, (c) With Reservoir No Shaft, (d) No Reservoir No Shaft
32
2.2 Capillary Action
Nanofiber mat with porosity of order of 90% can effectively fence liquid inside and
prevent drop receding [28]. Research done by Srikar et al[28] show that water in nanofiber
coated metal evaporate faster thus absorb more heat per unit time and cool the metal to
lower temperature than water on exposed metal under the same heating condition. Yet
nanofibers have great potential not only in spray cooling but in heat pipes.
The main limits of heat pipe nowadays are capillary limit, boiling limit, entrainment
limit, sonic limit and viscous limit. Among all these challenges, capillary limit and
boiling limit are the two most important limits and could cause dry-out in evaporator.
Dry-out is undesirable in heat pipe because it will terminate the work cycle.
According to capillary theory, due to the difference between the drawing force
(adhesion force between liquid and solid phase) and liquid surface tension, an amount of
liquid can be drawn up to a certain level of height in a tube with radius r until the two
forces are balanced. Capillary force and equations [29] are:
𝐹𝑑𝑟𝑎𝑤 = 𝛾2𝜋𝑟 (2.1)
𝐺𝑤𝑎𝑡𝑒𝑟 = 𝜌𝑔(ℎ𝜋𝑟2) (2.2)
𝐹𝑑𝑟𝑎𝑤 = 𝐺𝑤𝑎𝑡𝑒𝑟 (2.3)
𝑃𝑐 = 𝐹𝑑𝑟𝑎𝑤𝜋𝑟2
= 2𝛾𝑟
(2.4)
where 𝛾 is the surface tension, ρ is density of liquid, r is the radius of the tube, h is the
height of the liquid. Assume the contact angle is perfect wettability.
𝐹𝑑𝑟𝑎𝑤, the drawing force, is the most crucial force in heat pipe. Higher 𝐹𝑑𝑟𝑎𝑤 makes
heat pipe suitable to work under multiple orientation including anti-gravity position and
has higher flow rate or faster feeding rate to dry areas in heat pipe.
33
From equation above we can get equation for liquid height h = 2𝛾𝜌𝑟𝑔
which shows that
structure with smaller voids (smaller diameter) can draw liquid to higher level. While
copper wick in heat pipe has a solid particle diameter around 70~200um, nanofiber with
solid fiber diameter around 1~5um should has smaller voids and has can draw liquid to
much higher level which means per unit cross section area (same porosity) nanofiber can
draw up more liquid and thus bigger 𝐹𝑑𝑟𝑎𝑤/unit voids area ( or can say 𝑃𝑑𝑟𝑎𝑤 or 𝑃𝑐).
From another perspective, finer fiber with higher surface to mass ratio provide more
‘walls’ per unit void area which equal to increasing the term ‘2πr’ in equation 𝐹𝑑𝑟𝑎𝑤 =
𝛾2𝜋𝑟 and thus increase 𝐹𝑑𝑟𝑎𝑤 per unit void area. However, in real cases, porosity of
porous material varies thus media with small particle size doesn’t necessary have higher
capillary pressure. Thus, a new term ‘equivalent radius’ is introduced to describe porous
media.
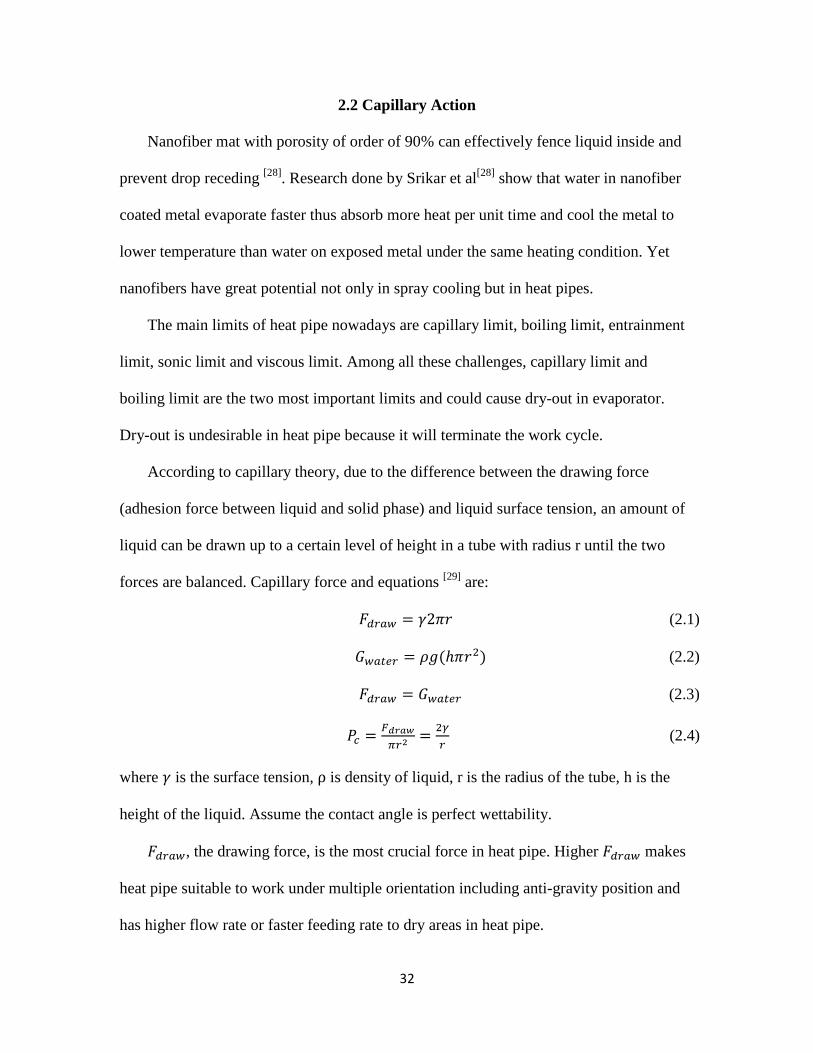
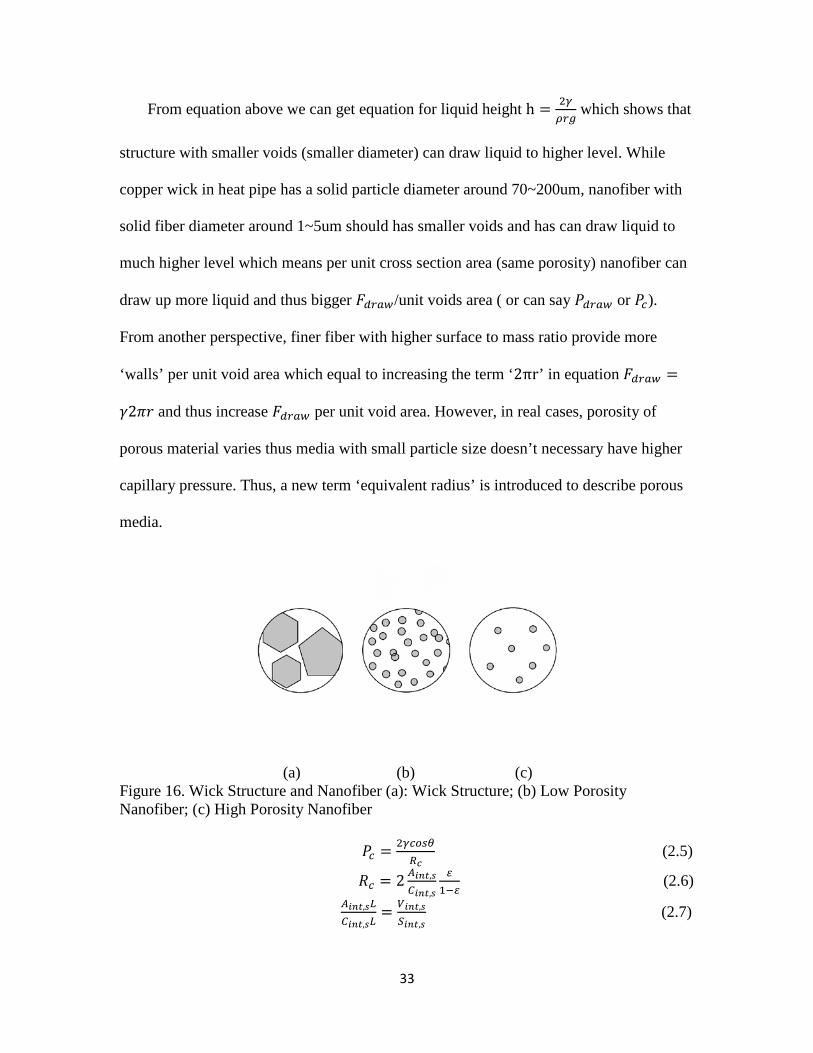
(a) (b) (c) Figure 16. Wick Structure and Nanofiber (a): Wick Structure; (b) Low Porosity Nanofiber; (c) High Porosity Nanofiber 𝑃𝑐 = 2𝛾𝑐𝑜𝑠𝜃
𝑅𝑐 (2.5)
𝑅𝑐 = 2 𝐴𝑖𝑛𝑡,𝑠𝐶𝑖𝑛𝑡,𝑠
𝜀1−𝜀
(2.6)
𝐴𝑖𝑛𝑡,𝑠𝐿𝐶𝑖𝑛𝑡,𝑠𝐿
= 𝑉𝑖𝑛𝑡,𝑠𝑆𝑖𝑛𝑡,𝑠
(2.7)
34
According to Young-Laplace equation shown above, 𝑃𝑐 is the capillary pressure, 𝑅𝑐
is the material’s equivalent radius of capillary, 𝐴𝑖𝑛𝑡,𝑠 is cross-section area of solid
particles, 𝐶𝑖𝑛𝑡,𝑠 is the parameter of solid particles and ε is the porosity of porous media at
the interface. For the same working liquid, the surface tension remains the same, also
assume contact angle between liquid and solid phase are the same, the capillary pressure
is then only dependent on equivalent tube radius. Now it becomes very obvious that in
order to obtain high capillary pressure, low equivalent radius is crucial. The accepted way
to determine the value of equivalent radius is generated by Masoodi and Pillai (2012) as
the equation shown above. Since the most recognizable feature of nanofiber is high
surface to volume (for one fiber, not mat) ratio, nanofiber can have the lowest equivalent
radius. Yet the porosity of nanofiber is usually high and could lead to bigger equivalent
radius.
𝐺𝑤𝑎𝑡𝑒𝑟𝜋𝑅𝑐2
= 𝑃𝑐 (2.8)
h = 2𝛾𝑐𝑜𝑠𝜃𝜌𝑔𝑅𝑐
(2.9)
For most wick structures, capillary pressure measurement is done by calculation
using equivalent radius or rising meniscus method however for porous media with
micro/nano scale feature, these methods are not practical [30]. Peter et al [30] presented
saturation visualization method using methanol, fluorescent dye, ultraviolet (UV) source
and UV filter camera to obtain information on wick capillary and permeability
performance of copper wick structure with particle size of 75um. The dye front shows a
saturation of 25mm high. Thus here, the capillary pressure of nanofiber is also measured
by saturation visualization using ethanol (noticing that ethanol and methanol have similar
surface tension and the contact angles are all close to 0o).
35
According to Darcy’s law [25] which is shown below, the total liquid discharge rate is
determined by multiple factors including media permeability κ, cross section area A,
capillary pressure drop ΔP, liquid viscosity 𝜐 and the length over which the pressure drop :
Q = −𝜅𝐴ΔP𝜐𝐿
(2.10)
In heat pipe operation, working liquid needs to reach the drying evaporator at a high
flow rate and this process is usually considered as a transient process. Thus a differential
form of Darcy’s Law is generated to get the transient liquid flow rate per unit cross
section area as:
𝑞𝑣 = 𝑄𝐴
= −𝜅𝜐𝑑𝑃𝑑𝐿
(2.11)
For now, it becomes clear that for the same working liquid and pressure drop, a
higher permeability can lead to high flow rate. Conan et al [24] provided a way to obtain
nanostructure’s effective permeability of Darcy’s Flow as κ = 𝑠3
12𝑑𝑛 where s is the lateral
spacing between nanostructures and 𝑑𝑛 is the diameter of the nanostructure. Bigger
lateral spacing and smaller diameter can provide high permeability. Yet big lateral
spacing can also leads to high porosity which will reduce the capillary pressure as
indicated above. So, controlling of the spacing between fibers (porosity) and fiber
diameter directly relates to the capillary pressure and permeability of the fiber mat. Thus
it is important to find the balance between capillary and permeability by controlling the
fiber diameter and porosity from optimum electrospinning processing parameter.
Heat pipe with traditional copper sinter wick structure from Thermacore and PVA
nanofiber fabricated onsite are chosen for capillary test via saturation. Working liquid is
chosen to be ethanol because ethanol is among the working fluid in heat pipe with
working temperature from 273K-403K [35] and is accessible on campus. Samples of
36
porous material were hung over a beaker filled with ethanol in tensiometer which under
wettability measurement mode. The weight of liquid absorbed are recorded thus flow rate
per unit cross section area can be calculated. In order to minimize the difference caused
by liquid wetting on back side of heat pipe wall and fiber holder, nanofiber was spun on
copper foil which is the same material with heat pipe wall thus the influence can be
minimized. All experiments are operated under same condition (same liquid, same
settings of tensiometer) for 10 minutes.
37
CHAPTER 3 RESULT AND DISCUSSION
3.1 Effect of Processing Parameters on Electrospinning
Pattern of PEO and PVA nanofiber can be reviewed in Scanning Electron
Microscope (SEM) image shown below. Images were taken using Hitachi Scanning
Electron Microscope with voltage of 1kV after the fiber sample was sputter coated with
Au-Pd to produce conductive surface. Voltage was set to be 1kV which is the lowest
value to protect the instrument from damage.
In order to obtain high capillary pressure, narrow fiber and low porosity is desired. In
order to obtain good flow rate, high capillary pressure and high permeability is desired.
Thus the fiber diameter and porosity (voids area) are key features to be studied. After
adjustment of image brightness, threshold and contrast ratio using ImageJ Analyzer
software [34], fiber diameter distribution and porosity of fiber mat can be measured.
Porosity, 𝜀𝑣, is the percentage of the volume of voids, 𝑉𝑣, to the total volume[29], 𝑉𝑡,
which is given by:
𝜀𝑣 = 𝑉𝑣𝑉𝑡
× 100 (3.1)
While the percent open area (POA), 𝜀𝐴, is defined as the percentage of open area, 𝐴𝑜, to
the total area [19], 𝐴𝑡, given by:
𝜀𝐴 = 𝐴𝑜𝐴𝑡
× 100 (3.2)
Nanofiber deposited on stationary collecting plate can be taken as 2 dimensional
isotropic [36]. While porosity is usually used to describe 3 dimensional structures such as
relatively thick nonwoven fabrics, POA can be taken equally as porosity on 2
dimensional woven fabric or thin nonwovens [19].
38
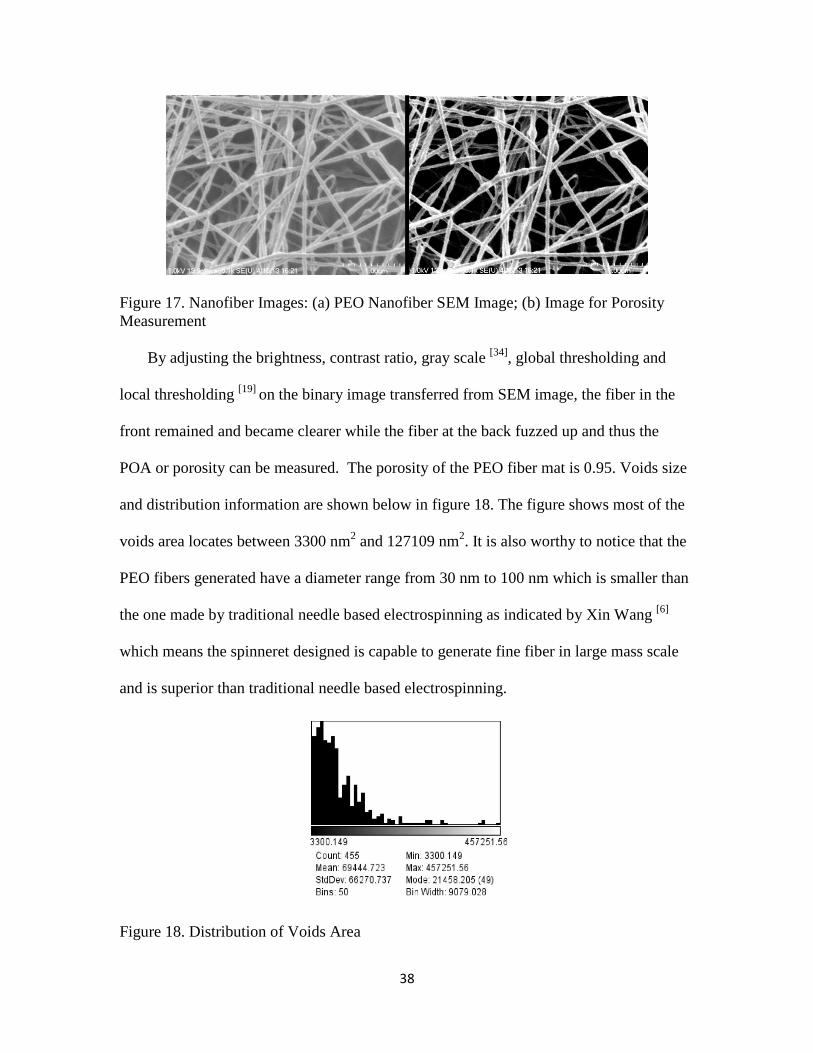
Figure 17. Nanofiber Images: (a) PEO Nanofiber SEM Image; (b) Image for Porosity Measurement By adjusting the brightness, contrast ratio, gray scale [34], global thresholding and
local thresholding [19] on the binary image transferred from SEM image, the fiber in the
front remained and became clearer while the fiber at the back fuzzed up and thus the
POA or porosity can be measured. The porosity of the PEO fiber mat is 0.95. Voids size
and distribution information are shown below in figure 18. The figure shows most of the
voids area locates between 3300 nm2 and 127109 nm2. It is also worthy to notice that the
PEO fibers generated have a diameter range from 30 nm to 100 nm which is smaller than
the one made by traditional needle based electrospinning as indicated by Xin Wang [6]
which means the spinneret designed is capable to generate fine fiber in large mass scale
and is superior than traditional needle based electrospinning.
Figure 18. Distribution of Voids Area
39
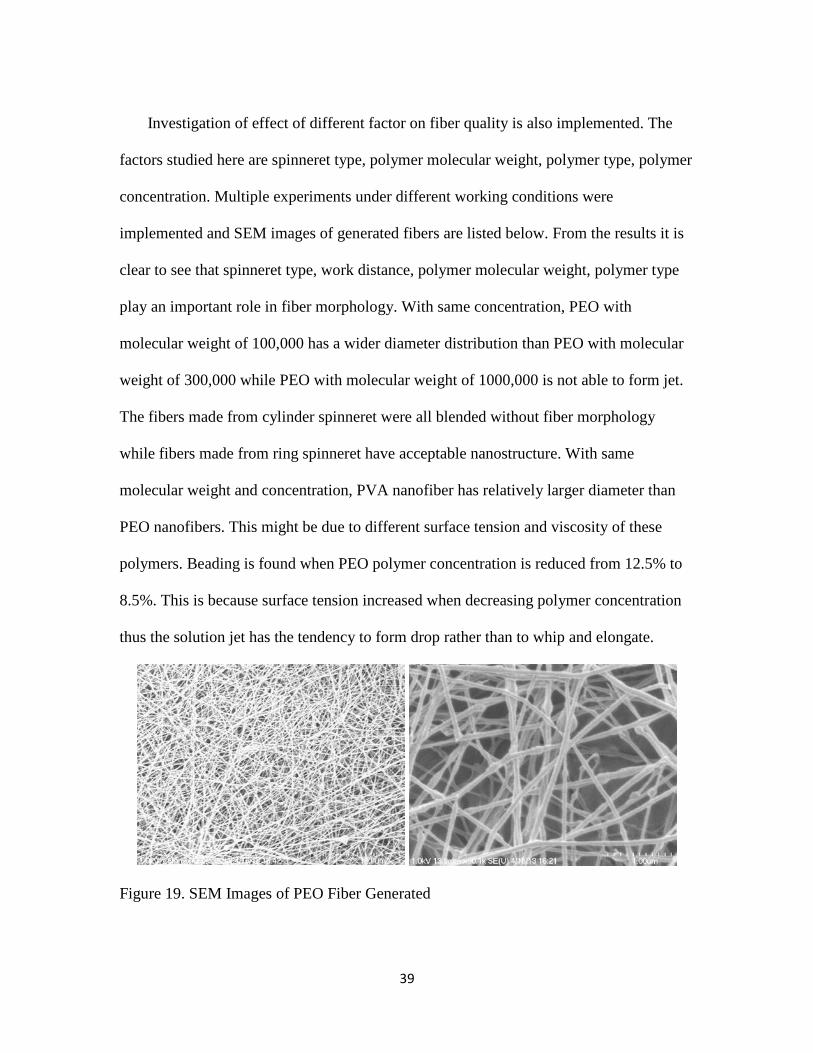
Investigation of effect of different factor on fiber quality is also implemented. The
factors studied here are spinneret type, polymer molecular weight, polymer type, polymer
concentration. Multiple experiments under different working conditions were
implemented and SEM images of generated fibers are listed below. From the results it is
clear to see that spinneret type, work distance, polymer molecular weight, polymer type
play an important role in fiber morphology. With same concentration, PEO with
molecular weight of 100,000 has a wider diameter distribution than PEO with molecular
weight of 300,000 while PEO with molecular weight of 1000,000 is not able to form jet.
The fibers made from cylinder spinneret were all blended without fiber morphology
while fibers made from ring spinneret have acceptable nanostructure. With same
molecular weight and concentration, PVA nanofiber has relatively larger diameter than
PEO nanofibers. This might be due to different surface tension and viscosity of these
polymers. Beading is found when PEO polymer concentration is reduced from 12.5% to
8.5%. This is because surface tension increased when decreasing polymer concentration
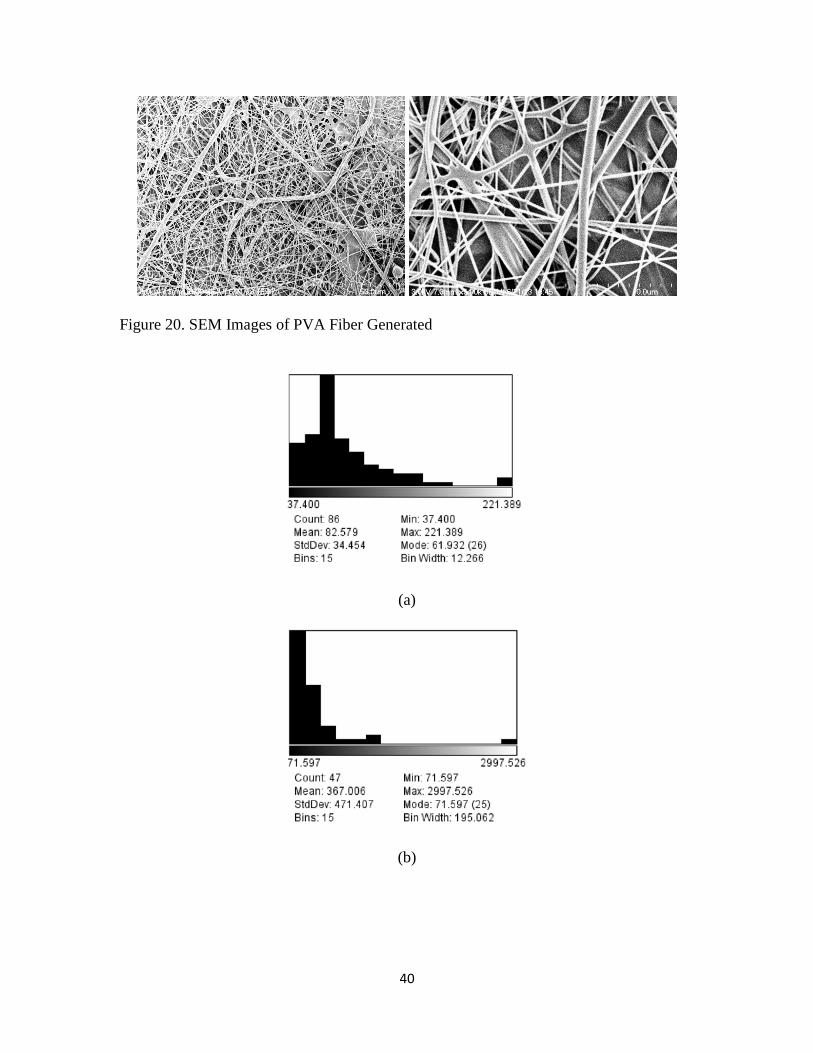
thus the solution jet has the tendency to form drop rather than to whip and elongate.
Figure 19. SEM Images of PEO Fiber Generated
40
Figure 20. SEM Images of PVA Fiber Generated
(a)
(b)
41
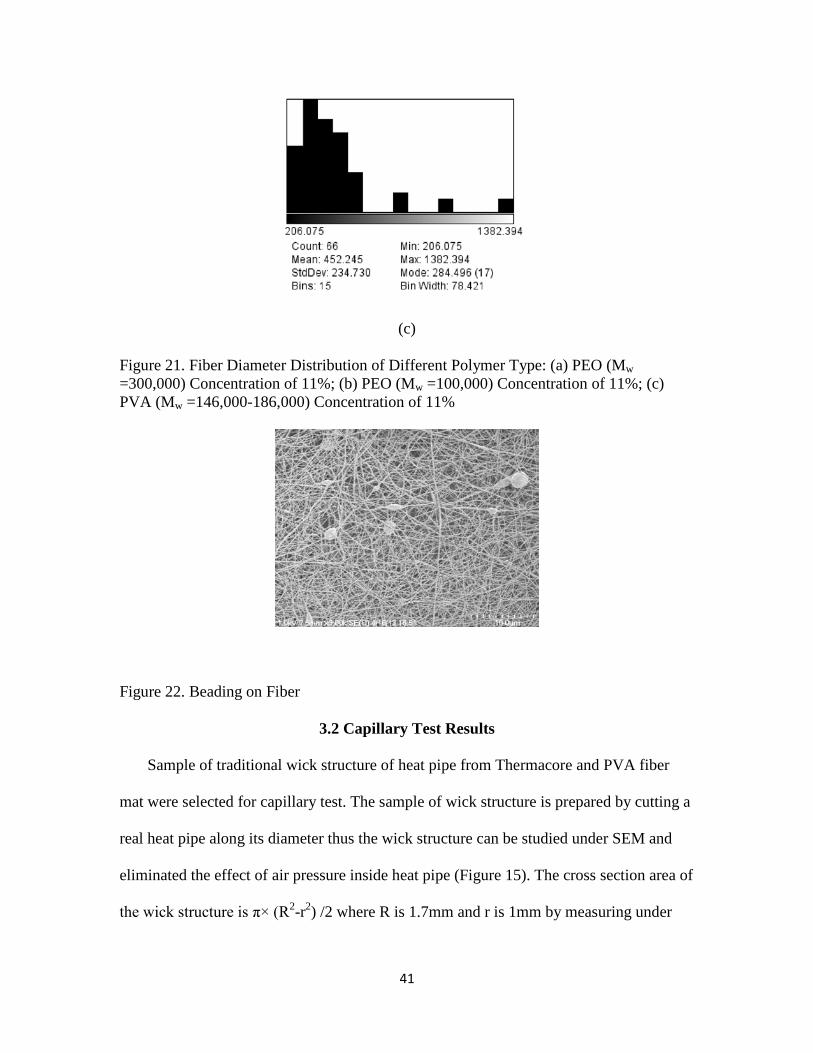
(c)
Figure 21. Fiber Diameter Distribution of Different Polymer Type: (a) PEO (Mw =300,000) Concentration of 11%; (b) PEO (Mw =100,000) Concentration of 11%; (c) PVA (Mw =146,000-186,000) Concentration of 11%
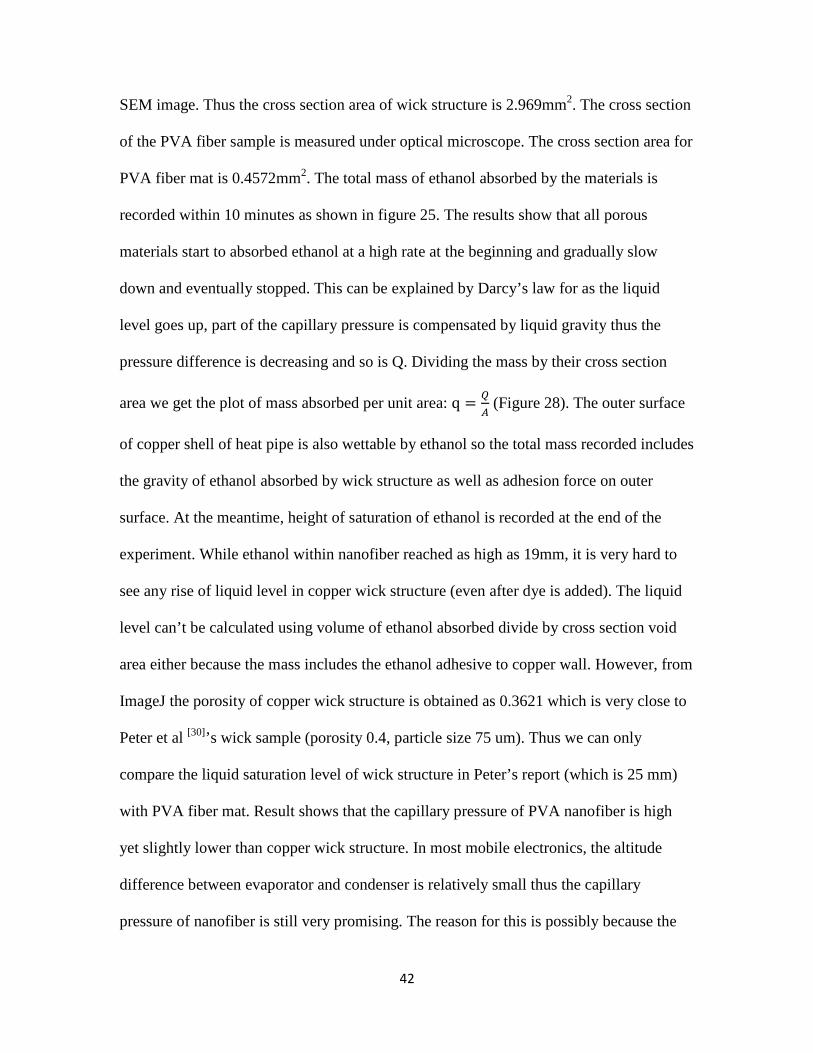
Figure 22. Beading on Fiber
3.2 Capillary Test Results
Sample of traditional wick structure of heat pipe from Thermacore and PVA fiber
mat were selected for capillary test. The sample of wick structure is prepared by cutting a
real heat pipe along its diameter thus the wick structure can be studied under SEM and
eliminated the effect of air pressure inside heat pipe (Figure 15). The cross section area of
the wick structure is π× (R2-r2) /2 where R is 1.7mm and r is 1mm by measuring under
42
SEM image. Thus the cross section area of wick structure is 2.969mm2. The cross section
of the PVA fiber sample is measured under optical microscope. The cross section area for
PVA fiber mat is 0.4572mm2. The total mass of ethanol absorbed by the materials is
recorded within 10 minutes as shown in figure 25. The results show that all porous
materials start to absorbed ethanol at a high rate at the beginning and gradually slow
down and eventually stopped. This can be explained by Darcy’s law for as the liquid
level goes up, part of the capillary pressure is compensated by liquid gravity thus the
pressure difference is decreasing and so is Q. Dividing the mass by their cross section
area we get the plot of mass absorbed per unit area: q = 𝑄𝐴
(Figure 28). The outer surface
of copper shell of heat pipe is also wettable by ethanol so the total mass recorded includes
the gravity of ethanol absorbed by wick structure as well as adhesion force on outer
surface. At the meantime, height of saturation of ethanol is recorded at the end of the
experiment. While ethanol within nanofiber reached as high as 19mm, it is very hard to
see any rise of liquid level in copper wick structure (even after dye is added). The liquid
level can’t be calculated using volume of ethanol absorbed divide by cross section void
area either because the mass includes the ethanol adhesive to copper wall. However, from
ImageJ the porosity of copper wick structure is obtained as 0.3621 which is very close to
Peter et al [30]’s wick sample (porosity 0.4, particle size 75 um). Thus we can only
compare the liquid saturation level of wick structure in Peter’s report (which is 25 mm)
with PVA fiber mat. Result shows that the capillary pressure of PVA nanofiber is high
yet slightly lower than copper wick structure. In most mobile electronics, the altitude
difference between evaporator and condenser is relatively small thus the capillary
pressure of nanofiber is still very promising. The reason for this is possibly because the
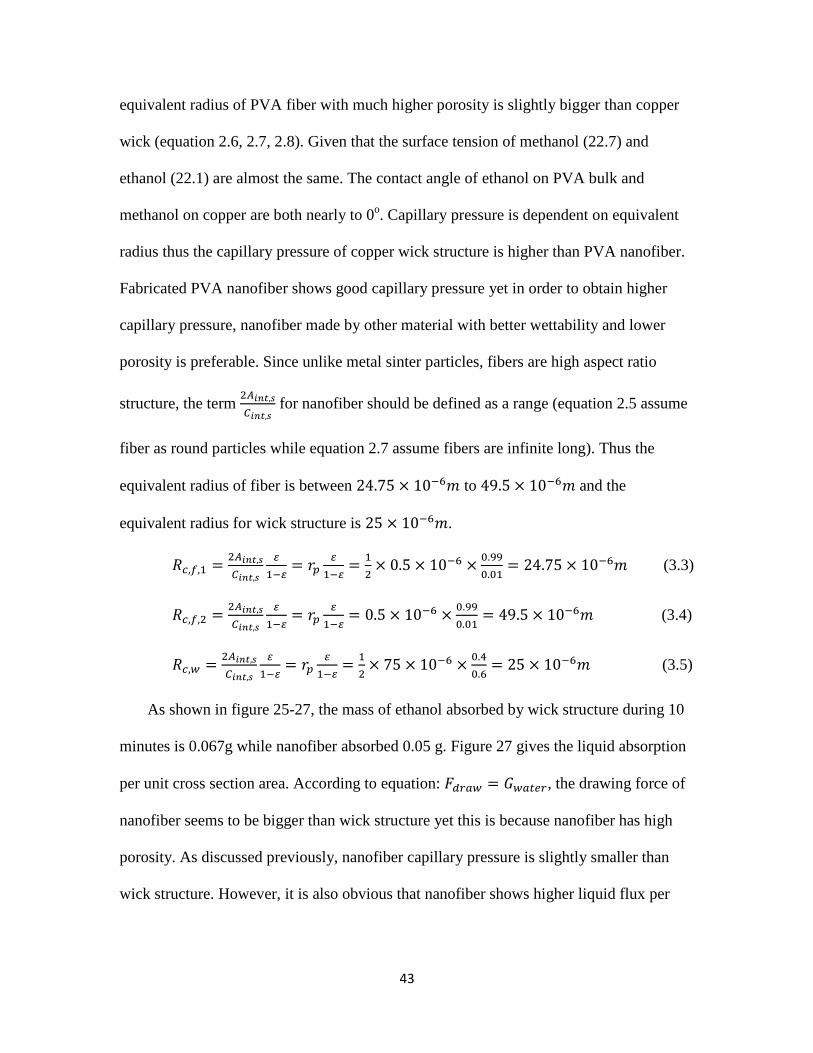
43
equivalent radius of PVA fiber with much higher porosity is slightly bigger than copper
wick (equation 2.6, 2.7, 2.8). Given that the surface tension of methanol (22.7) and
ethanol (22.1) are almost the same. The contact angle of ethanol on PVA bulk and
methanol on copper are both nearly to 0o. Capillary pressure is dependent on equivalent
radius thus the capillary pressure of copper wick structure is higher than PVA nanofiber.
Fabricated PVA nanofiber shows good capillary pressure yet in order to obtain higher
capillary pressure, nanofiber made by other material with better wettability and lower
porosity is preferable. Since unlike metal sinter particles, fibers are high aspect ratio
structure, the term 2𝐴𝑖𝑛𝑡,𝑠𝐶𝑖𝑛𝑡,𝑠
for nanofiber should be defined as a range (equation 2.5 assume
fiber as round particles while equation 2.7 assume fibers are infinite long). Thus the
equivalent radius of fiber is between 24.75 × 10⁻⁶𝑚 to 49.5 × 10⁻⁶𝑚 and the
equivalent radius for wick structure is 25 × 10−6𝑚.
𝑅𝑐,𝑓,1 = 2𝐴𝑖𝑛𝑡,𝑠𝐶𝑖𝑛𝑡,𝑠
𝜀1−𝜀
= 𝑟𝑝𝜀
1−𝜀= 1
2× 0.5 × 10−6 × 0.99
0.01= 24.75 × 10⁻⁶𝑚 (3.3)
𝑅𝑐,𝑓,2 = 2𝐴𝑖𝑛𝑡,𝑠𝐶𝑖𝑛𝑡,𝑠
𝜀1−𝜀
= 𝑟𝑝𝜀
1−𝜀= 0.5 × 10−6 × 0.99
0.01= 49.5 × 10⁻⁶𝑚 (3.4)
𝑅𝑐,𝑤 = 2𝐴𝑖𝑛𝑡,𝑠𝐶𝑖𝑛𝑡,𝑠
𝜀1−𝜀
= 𝑟𝑝𝜀
1−𝜀= 1
2× 75 × 10−6 × 0.4
0.6= 25 × 10−6𝑚 (3.5)
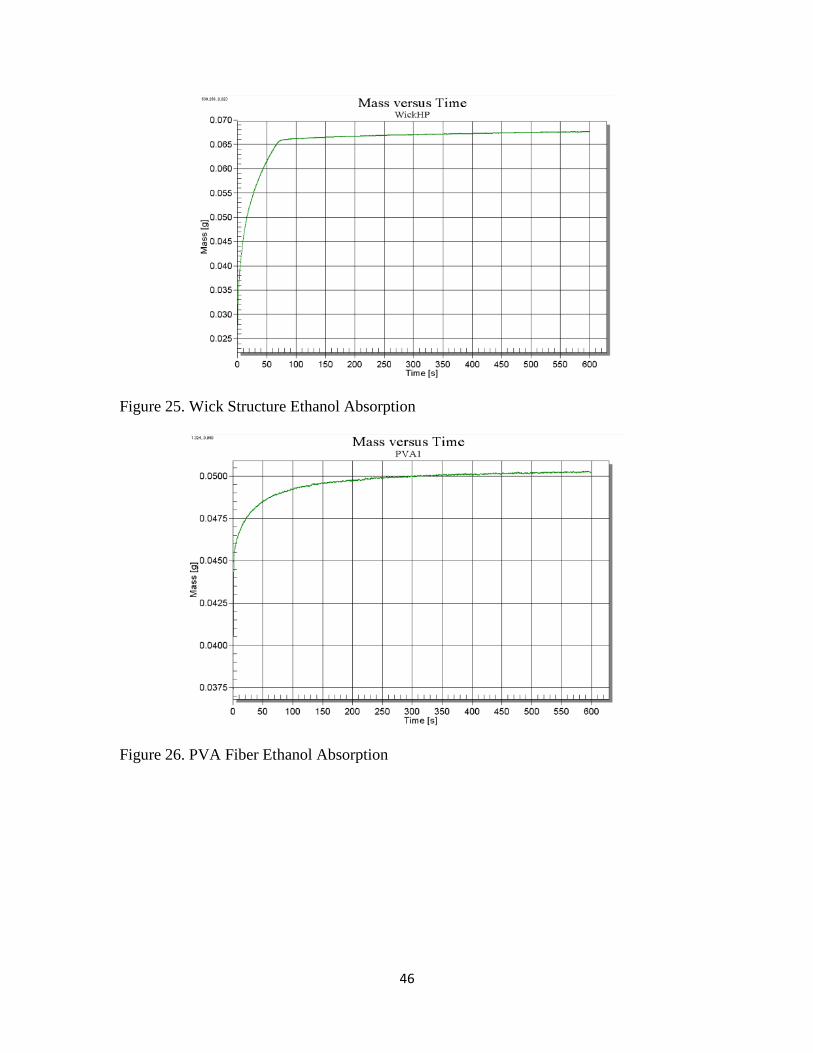
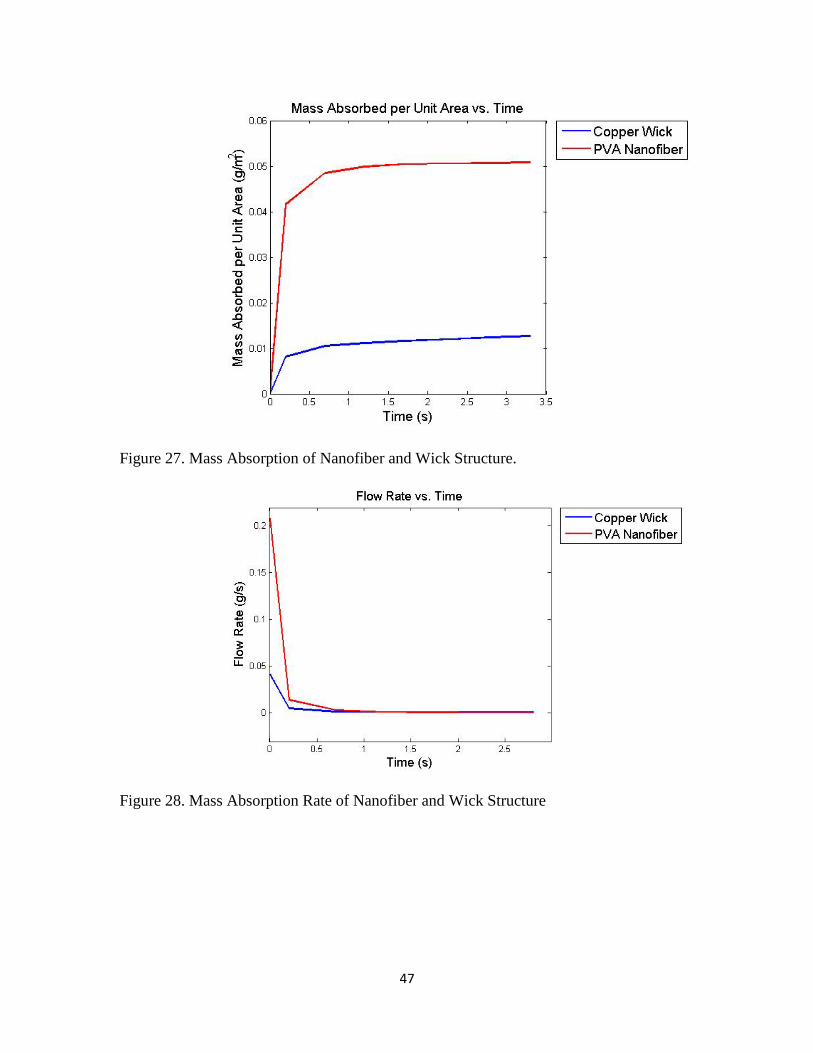
As shown in figure 25-27, the mass of ethanol absorbed by wick structure during 10
minutes is 0.067g while nanofiber absorbed 0.05 g. Figure 27 gives the liquid absorption
per unit cross section area. According to equation: 𝐹𝑑𝑟𝑎𝑤 = 𝐺𝑤𝑎𝑡𝑒𝑟, the drawing force of
nanofiber seems to be bigger than wick structure yet this is because nanofiber has high
porosity. As discussed previously, nanofiber capillary pressure is slightly smaller than
wick structure. However, it is also obvious that nanofiber shows higher liquid flux per
44
unit area which means it is easier for nanofiber to transport large amount of working
liquid from faraway condenser to evaporator than traditional wick structure.
As shown in figure 28-30, nanofiber shows higher absorption rate than wick structure
at the very beginning and reached the maximum amount earlier (figure 30). Taking time
derivation of the trend line in figure 28 gives the absorption rate per unit area. It shows
the capillary flow rate of nanofiber is higher (higher 𝑞𝑣) than wick structure at the first
1.5 second. Now if infinite small time step is taken at the very beginning of the test,
discharge rate per unit area is 𝑞𝑣 = 𝑄𝐴
= −𝜅𝜐𝑑𝑃𝑑𝐿
. As discussed above, nanofiber has higher
𝑞𝑣 while it has a lower 𝑑𝑃𝑑𝐿
thus the permeability of nanofiber is higher than wick structure.
Since nanofiber has higher porosity with larger void lateral space and smaller solid
particle diameter, according to κ = 𝑠3
12𝑑𝑛, 𝜅𝑓 is much higher than 𝜅𝑤. This can explain the
reason nanofiber has higher liquid discharge. Working liquid transportation within porous
material has to overcome friction, liquid viscosity and liquid gravity. Heat pipe with high
discharge rate is always welcome in electronic packaging especially for portable devices
like mobile phones and tablets for the heat pipes within these devices sometimes have to
work anti-gravity under high local heat dissipation. The heat dissipation rate of mobile
electronic is remarkable and focused on small area thus the local heat flux is very high
and sometimes cause dry out. Nanofiber with higher liquid discharge can effectively
remit this situation if applied in heat pipe.
Overall, the results show that nanofiber has high potential in making heat pipe
because liquid can transport quickly from condenser zone to evaporator zone at a higher
discharge rate to prevent drying out in the evaporator. For high rate heat dissipation
package, evaporate zone is usually big and working liquid can easily dry out. Higher
45
liquid transportation rate per unit area is the key to solve this problem. Also the higher
transportation rate of nanofiber shows that the low friction factor and viscosity of liquid
compensated the capillary pressure. In order to obtain optimum capillary pressure and
capillary flow rate, fiber diameter and porosity need to be carefully controlled. This can
be achieved by adjusting certain electrospinning process parameters.
All tests were carried out twice to ensure reproducibility [28] . The results are shown
below.
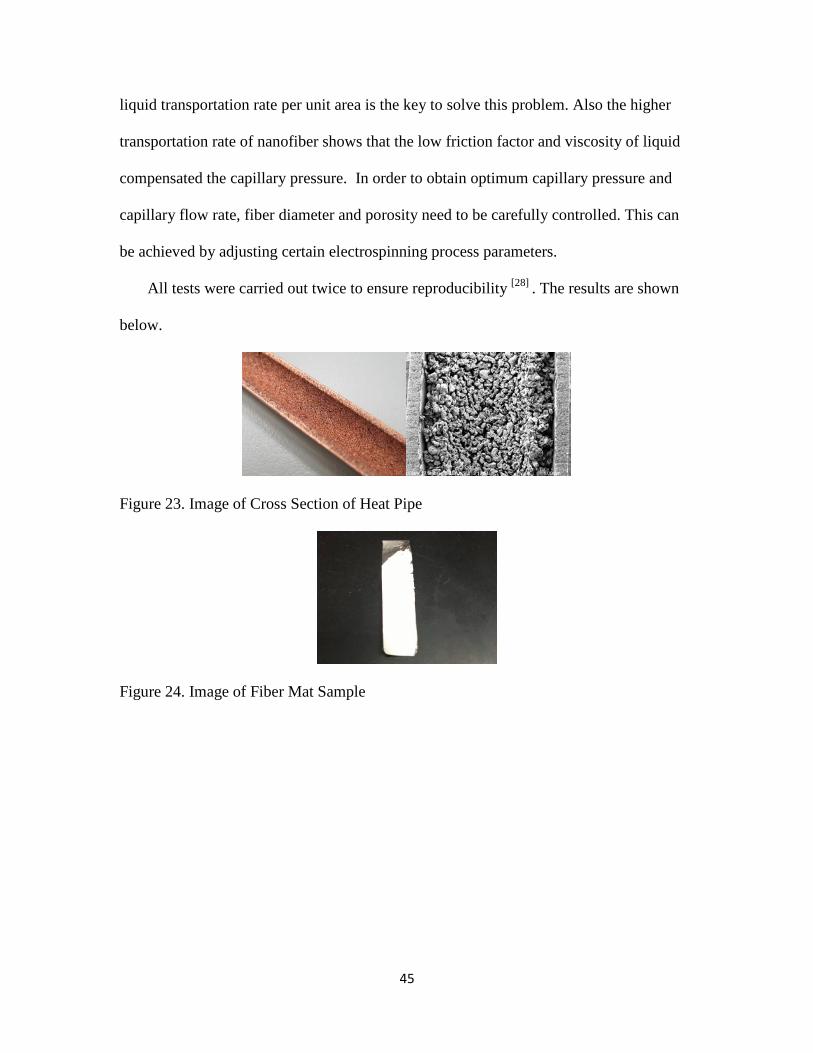
Figure 23. Image of Cross Section of Heat Pipe
Figure 24. Image of Fiber Mat Sample
46
Figure 25. Wick Structure Ethanol Absorption
Figure 26. PVA Fiber Ethanol Absorption
47
Figure 27. Mass Absorption of Nanofiber and Wick Structure.
Figure 28. Mass Absorption Rate of Nanofiber and Wick Structure
48
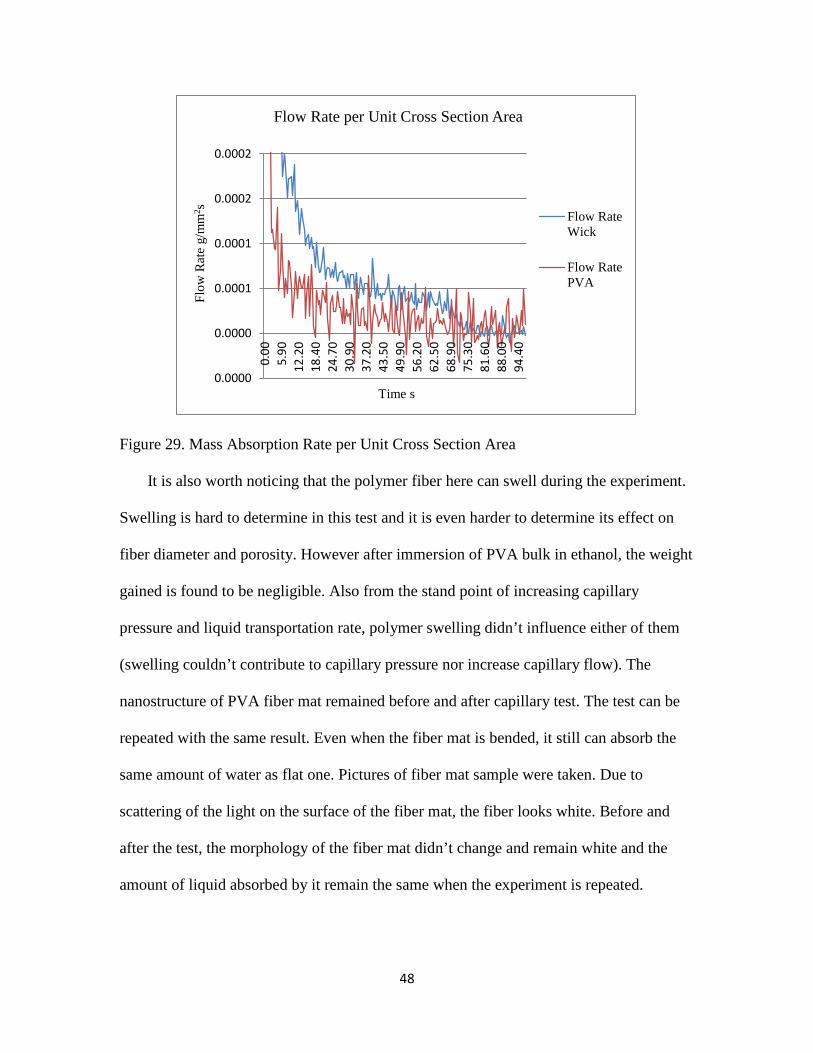
Figure 29. Mass Absorption Rate per Unit Cross Section Area It is also worth noticing that the polymer fiber here can swell during the experiment.
Swelling is hard to determine in this test and it is even harder to determine its effect on
fiber diameter and porosity. However after immersion of PVA bulk in ethanol, the weight
gained is found to be negligible. Also from the stand point of increasing capillary
pressure and liquid transportation rate, polymer swelling didn’t influence either of them
(swelling couldn’t contribute to capillary pressure nor increase capillary flow). The
nanostructure of PVA fiber mat remained before and after capillary test. The test can be
repeated with the same result. Even when the fiber mat is bended, it still can absorb the
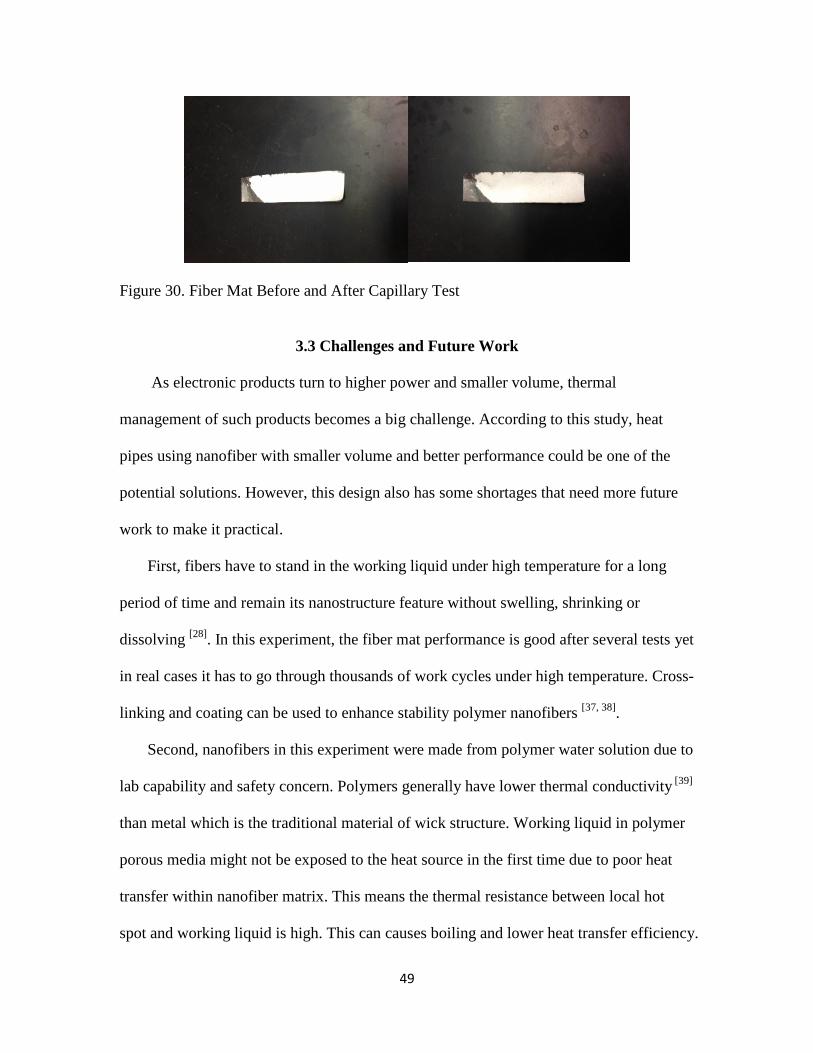
same amount of water as flat one. Pictures of fiber mat sample were taken. Due to
scattering of the light on the surface of the fiber mat, the fiber looks white. Before and
after the test, the morphology of the fiber mat didn’t change and remain white and the
amount of liquid absorbed by it remain the same when the experiment is repeated.
0.0000
0.0000
0.0001
0.0001
0.0002
0.0002
0.00
5.90
12.2
018
.40
24.7
030
.90
37.2
043
.50
49.9
056
.20
62.5
068
.90
75.3
081
.60
88.0
094
.40
Flow
Rat
e g/
mm
2 s
Time s
Flow Rate per Unit Cross Section Area
Flow RateWick
Flow RatePVA
49
Figure 30. Fiber Mat Before and After Capillary Test
3.3 Challenges and Future Work
As electronic products turn to higher power and smaller volume, thermal
management of such products becomes a big challenge. According to this study, heat
pipes using nanofiber with smaller volume and better performance could be one of the
potential solutions. However, this design also has some shortages that need more future
work to make it practical.
First, fibers have to stand in the working liquid under high temperature for a long
period of time and remain its nanostructure feature without swelling, shrinking or
dissolving [28]. In this experiment, the fiber mat performance is good after several tests yet
in real cases it has to go through thousands of work cycles under high temperature. Cross-
linking and coating can be used to enhance stability polymer nanofibers [37, 38].
Second, nanofibers in this experiment were made from polymer water solution due to
lab capability and safety concern. Polymers generally have lower thermal conductivity [39]
than metal which is the traditional material of wick structure. Working liquid in polymer
porous media might not be exposed to the heat source in the first time due to poor heat
transfer within nanofiber matrix. This means the thermal resistance between local hot
spot and working liquid is high. This can causes boiling and lower heat transfer efficiency.
50
Transferring nanofiber into carbon nanofiber, adding carbon nanotube or metal particle
into polymer solution before spinning and coating nanofiber with metal [39] can effectively
increase the thermal conductivity [40]. Electrospinning of melted metal including copper
and silver is possible according to Hui Wu et al [41] who successfully made copper
nanofiber with good thermal conductivity and mechanical properties via electrospinning
method.
51
CHAPTER 4 CONCLUSION
To meet the requirement of thermal management of model electronics, new type of
heat pipe need to be developed with thinner structure, lighter weight, higher capillary
pressure, better discharge flux and flexibility. At this time, nanofiber shows great
potential to be used to solve these problems. At the same time, needleless electrospinning
of nanofiber technology has been proved with large scale nanofiber manufacturing
capability. The aim of this thesis is to build up an onsite needleless electrospinning
nanofiber fabrication device to make sample nanofiber mats and test its capillary
performance thus provide a possible approach of utilizing nanofiber in heat pipe. The
result shows that spinneret type, polymer type and polymer concentration are strongly
related to fiber generation and morphology. The PVA nanofiber mat shows high capillary
pressure and high capillary flow rate.
During the electrospinning experiment, multiple processing parameters were
evaluated. Different types of spinnerets, different type and concentration of polymer
solution and different working conditions were used to make nanofiber. Results show that
spinneret type, working distance, polymer type and polymer concentration are strongly
related to formation of Tylor cone. In order to make spinning happen, spinneret should
have sharp curve or spikes to achieve high electric field intensity/ potential gradient thus
obtain big electric force. Also in order to obtain high quality nanofiber, a uniform electric
field is required. Thus a new type of spinneret is designed with three rings to generate
high quality fiber.
PVA nanofiber shows good capillary performance. The result is compared with
traditional copper wick structure. The capillary pressure of nanofiber is almost the same
52
with the one of copper sinter wick while at the same time polymer nanofiber is much
lighter and thinner than wick structure. This makes nanofiber superior as a new wick
structure. In this study, the capillary flow rate is also analyzed and pointed out that the
flow rate within nanofiber is higher than copper wick structure due to higher permeability.
This study also points out that the nanofiber also has many challenges to be used in heat
pipe such as stability and thermal conductivity.
53
REFERENCES [1] Haitao Niu. Tong Lin. 2012. Review article: Fiber generation in needleless electrospinning. Journal of Nanomaterials, vol (2012): 13
[2] Oldrich Jirsak, Stanislav Petrik. 2010. Needleless electrospinning- history, present and future. 7th International Conferenc- TEXSCI 2010, September 6-8
[3] V. Kirichenko, Y. Filatov and A. Budyka. 2007. Electrospinning of micro-and naonofibers: Fundamentals in separation and filtration processes. Moscow: Begell House
[4] S. Ramakrishna, K. Fujihara and W. Teo, T. Lim, and Z. Ma. 2005. An introduction to electrospinning and nanofibers. Singapore: World Scientific.
[5] H. Fong, I. Chun, and D. H. Reneker. 1999. Beaded nanofibers formed during electrospinning. Polymer. vol. 40 (1999): 4585-4592
[6] Xin Wang, Weilin Xu. 2011. Effect of experimental parameters on needleless electrospinning from a conical wire coil. Journal of Applied Polymer Science. Vol. 123 (2012): 3707-37097
[7] Jirsak, O., Sanetrnik, F., Lukas, D., Kotek, V., Martinova, L., Chaloupek, J. 2005. A method of nanofibers production from a polymer solution using electrostatic spinning and a device for carrying out the method. The Patent Cooperation Treaty WO 2005/024101
[8] Feng-Lei Zhou, Rong-Hua Gong, Isaac Porat. 2009. Needle and needleless electrospinning for nanofibers. Journal Applied Polymer Science. Vol. 115 (2010): 2591-2598
[9] R. Srikar, T. Gambaryan-Roismanb,c, C. Steffes, P. Stephan, C. Tropea, A.L. Yarin. 2009. Nanofiber coating of surface for intensification of drop or spray impact cooling. International Journal of Heat and Mass Transfer. vol. 52(2009): 5814-5826.
[10] V. Thavasi, G. Singh, S. Ramakrishna. 2008. Electrospun nanofibers in energy and environmental applications. Energy and Environmental Science. Vol. 1 (2008): 205-221
[11] David Lukas, Arindam Sarkar, Pavel Pokorny, 2012, Self-organization of jets in electrospinning from free liquid surface: A generalized approach, Journal of Applied Physics, vol 103 084309 (2008)
[12] D. Li and Y. Xia. 2004. Electrospinning of nanofibers: reinventing the wheel?. Advanced Materials. vol. 16 (2004):1151-1170
[13] G. Taylor. 1964. Disintegration of water drops in an electric field. Proc. R. Soc. Lond. A. Math. Phys. Sci., vol. 280 (July 1964): 383-397
[14] G. Taylor. 1969. Electrically driven Jets. Proc. R. Soc. Lond. A. Math. Phys. Sci. vol. 313 (December 1969): 453-475
54
[15] F. Cengiz, O. Jirsak. 2009. The effect of salt on roller electrospinning of polyurethane nanofibers. Fibers and Polymers. Vol. 10 (2009): 177-184
[16] Chitral J. Angammana, Shesha H. Jayaram. 2011. Analysis of the effects of solution conductivity on electrospinning process and fiber morphology. IEEE Transactions on industry applications. vol. 47 NO. 3 (MAY/JUNE 2011): 1109-1117
[17] Stanislav Petrik, Miroslav Maly. Production nozzle-less electrospinning nanofiber technology. Elmarco s.r.o.
[18] E. Kostakova, L. Meszaros, J. Gregr. 2009. Composite nanofibers produces by modified needleless elestrospinning. Material Letters. Vol. 63 (2009): 2419-2422
[19] Chang-Mou Wu, Hua-Geng Chiou, Siang-Ling Lin, Jian Min Lin. 2012. Effects of electrostatic polarity and the types of electrical charging on electrospinning behavior. Journal of Aplied Polymer Science. Vol. 126 (2012): E89-E87
[20] Ying Yang, Zhidong Jia, Qiang Li, Zhicheng Guan. 2006. Experimental investigation of governing parameters in the electrospinning of polyethylene oxide solution. IEEE. (Feb 13 2006): 1070-9878
[21] Oldrich Jirsak, Stanislav Petrik. 2010. Needleless electrospinning- history, present and future. 7th International Conferenc- TEXSCI 2010, September 6-8
[22] J.M. Deitzel, J. Kleinmeyer, D. Harris, N.C. Beck Tan. The effect of processing variables on the morphology of electrospun nanofibers and textiles. Polymer. Vol. 42 (2001): 261-272
[23] Shan Tang, Yongchun Zeng, Xinhou Wang. 2010. Splashing needleless electrospinning of nanofibers. Polymer Engineering and Science.
[24] Conan Zhang, Carlos H. Hidrovo, 2009, Investigation of nanopillar wicking capacities for heat pipes applications, Proceeding of the ASME 2009 2nd Micro/Nano scale Heat&Mass transfer InternationalConference, MNHMT 2009, December 18-21, 2009, Shanghai
[25] Benton Bakke, Brooks Dagen, Weston Melby, Jason Weyer, Xiangfa Wu, Iskander Akhatov, 2011, Design of a needleless electrospinning device for mass-production of continuous nanofibers, Semester report
[26] Faghri, Amin, 1995, Heat pipe science and technology, US: Taylor & Francis
[27] Nouman Zahoor Ahmed, Pawan K. Sinh, Isam Janajreh, Youssef Shatilla. 2011. Simulation of flow inside heat pipe: sensitivity study, conditions and configuration. Proceedings of the ASME 2011 th International Conference on Energy Sustainability. ES2011-54295
[28] R. Srikar, T. Gambaryan-Roismanb,c, C. Steffes, P. Stephan, C. Tropea, A.L. Yarin. 2009. Nanofiber coating of surface for intensification of drop or spray impact cooling. International Journal of Heat and Mass Transfer. vol. 52(2009): 5814-5826.
55
[29] Reza Masoodi, Krishna M. Pillai. 2013. Wicking in porous materials traditional and modern modeling approaches. Boca Raton FL: Taylor & Francis group, 2013
[30] H. Peter J. de Bock, Kripa Varanasi, Pramod Chamarthy, Tao Deng, Ambarish Kulkarni, Brian M. Rush, Boris A. Russ, Stanton E. Weaver, Frank M. Gerner, 2008, Experimental investigation of micro/nano heat pipe wick structures, Proceeding of the ASME International mechanical engineering congress and exposition, IMECE2008-67288
[31] Haitao Niu, Xungai Wang, Tong Lin. 2012. Large scale electrospinning of polymer nanofibers using needleless nozzle. Proceedings of 38th Textile Research Symposium, (3-5 September 2009): 117-122
[32] Eva Kostakova, Laszlo Meszaros, Jan Gregr. 2009. Composite nanofibers produced by modified needleless electrospinning. Materials Letters. vol 63 (7 August 2009): 2419-2422
[33] Xin Wang, Xungai Wang, Tong Lin. 2012. Electric field analysis of spinneret design and needleless electrospinning of nanofibers. Materials Research Society. Vol. 27 No. 23 (Dec 14 2012)
[34] Nagarajan Muthuraman Thoppey, Jason R. Bochinski, Laura I. Clarke, Russell E. Gorga. 2010. Unconfined fluid electrospun into high quality nanofibers from a plate edge. Polymer. vol 51 (2010): 4928-4936.
[35] Mani Annamalai, Somasundaram Dhanabal. Experimental studies on porous wick flat plate heat pipe. International Refrigeration and Air Conditioning Conference. Purdue University, 2010
[36] Jihoon Lee, Yulin Deng. Increased mechanical properties of aligned and isotropic electrospun PVA nanofiber webs by cellulose nanowhisker reinforcement. Macromolecular Research. Vol, 20 (2012): 76-83
[37] Anh Tuan Dao, Oldrich JIRSAK. 2010. Effect of cross-linking agent on electrospinning of poly(vinyl) alcohol. 7th International Conference- TEXSCI 2010, September 6-8
[38] Dayong Yang, Xing Liu, Yu Jin, Ying Zhu, Dongdong Zeng, Xingyu Jiang, Hongwei Ma. 2009. Electrospinning of poly(dimethylsiloxane)/poly(methylmethacrylate) nanofibers memberane: fabrication and application in protein microarrays. Biomacromolecules. vol. 10 (2009): 3335-3340
[39] Mark Crawfor. Thermally conductive polymers improved nanofibers. ASME.org. https://www.asme.org/engineering-topics/articles/nanotechnology/thermally-conductive-polymers-improve-nanofibers (accessed January 2013).
[40] Nayandeep K. Mahanta, Alexis R. Abramson, Max L. Lake, David J. Burton, John C. Chang, Helen K. Mayer, Jessica L. Ravine. Thermal conductivity of carbon nanofiber mats. Carbon. Volume 48 (December 2010): 4457-4465.
56
[41] Hui Wu, Liangbing Hu, Micheal W. Rowell, Desheng Kong, Judy J. Chan, James R. McDonough, Jia Zhu, Yuan Yang, Micheal D. McGehee, Yi Cui. 2010. Electrospun metal nanofiber webs as high-performance transparent electrode. Nano Lett. Vol.10 (August 2010): 4242-4248
Top Related