


Languages
Pages
Legal

MEMORANDUM TO: Ms. Laura Mehiel, PE DATE: June 18, 2015
COMPANY: A. Morton Thomas & Associates, Inc.
SUBJECT: Pohick Church – Ambient Vibration Monitoring
ADDRESS: 12750 Twinbrook Parkway Rockville, MD 20852
PROJECT NAME/NO.:
US Route 1 Improvements / 13612045.04
FROM: Ben Like, PG CC: Ed Drahos, PE (Schnabel Engineering)
This memorandum provides ambient vibration data recorded at the Pohick Church (PC) site on June 4, 2015. Services discussed/provided in this memorandum include:
Recorded the ambient vibration levels at the site for a 13-hour period. Installed four (4) crack monitoring gauges, according to the Pre-construction Survey and Vibration Monitoring
Plan report recommendations, dated August 8, 2014. Discussion of the ambient vibration levels recorded at the site, prior to active construction in the area of the
church on Route 1. Mr. Ben Like visited the PC site on Thursday, June 4, 2015, located southwest of the intersection of Telegraph Road / Old Colchester Road (State Route 611) and Richmond Highway (US Route 1) at 9301 Richmond Highway in Lorton, VA. We recorded the ambient vibrations at three locations adjacent to the PC building, the exterior of the Vestry House (VH), and the brick wall along Richmond Highway (to the north of the church building). The three locations were chosen to get an average of the vibration levels across the site. Station 2 is nearest the recommended location for monitoring during construction, from the Schnabel Vibration Monitoring Memorandum dated January 10, 2014. See the seismograph location sketch, Figure 1. The sensors were spiked into the ground at the surface, just below the root mat. Proposed construction in the vicinity of the PC site consists of milling and resurfacing of the pavement located along Richmond Highway immediately adjacent to the PC site and construction of a new (i.e., full depth pavement) turning lane northwest of the intersection of Telegraph Road/Old Colchester Road (State Route 611) and Richmond Highway (US Route 1). Milling and resurfacing of the pavement will be within about 70-ft. of the PC building; construction of the new turning lane will be within about 200-ft. of the PC building. The seismographs were located as follows:
Station 1: near the northwest corner of the PC building (away from the air handling units at the corner), Station 2: adjacent to / inside the perimeter wall, approximately at the midpoint of this section of the wall between
the PC and VH buildings, and Station 3: adjacent to / outside the perimeter wall on the east side of the VH building.
The peak vibrations were recorded from about 6:00 AM to 7:00 PM, to encompass the morning and evening rush hour periods. The weather was rainy all day, which likely caused the vehicles to be travelling a bit slower than when there is no
SENT VIA: First Class Mail Overnight Service Email Other
1504 Woodlawn Drive Baltimore, MD 21207
T/ 410-944-6170 F/ 410-944-1162

A. Morton Thomas & Associates, Inc. US Route 1 Improvements
Project 13612045.04 / June 18, 2015 Page 2 Schnabel Engineering
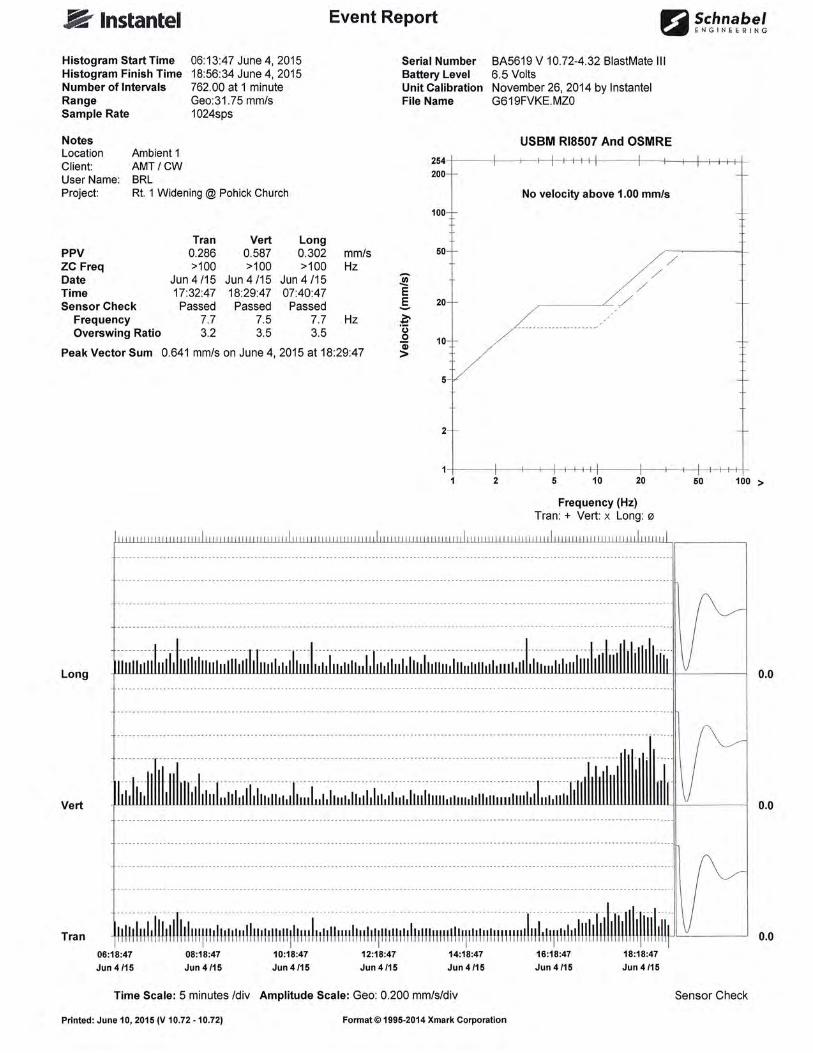
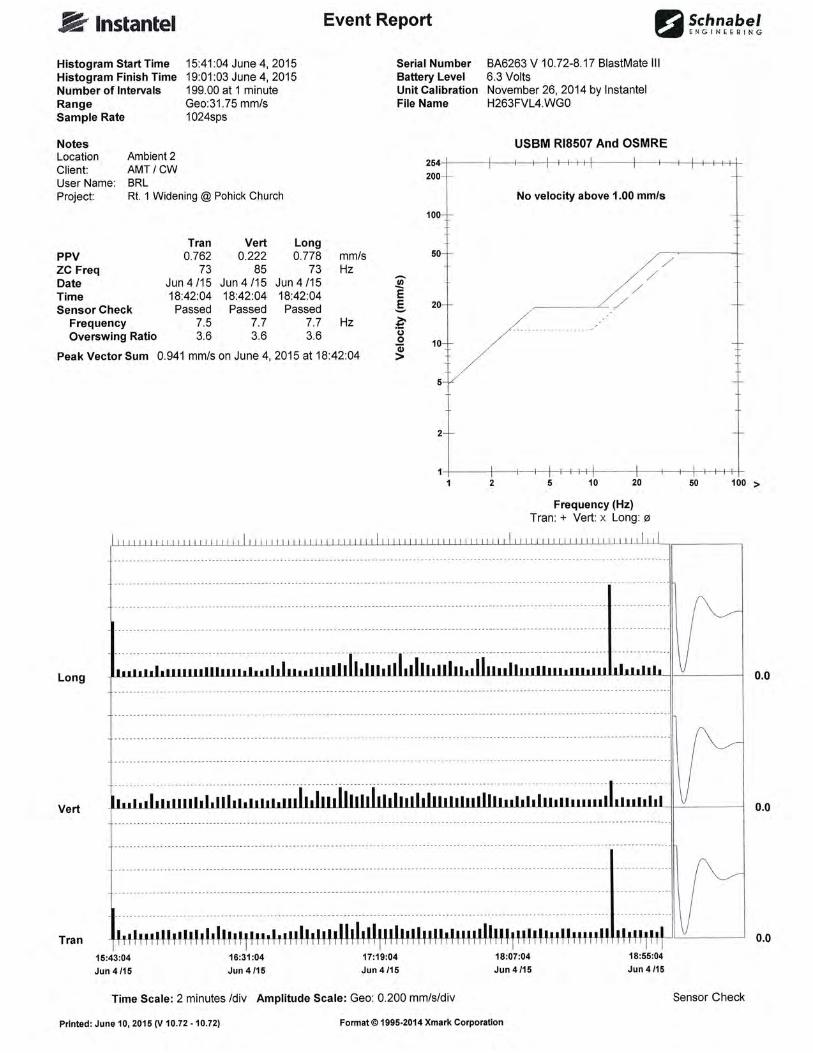
precipitation, and therefore possibly generating slightly reduced the vibration levels. The orientation of the sensors at Stations 1 and 2 was North-South, toward the Route 1 roadway. The sensor at Station 3 was oriented toward Old Colchester Road (East-West). The recorded vibration data has been summarized by location and sensor orientation in Table 1. We found that the vibrations were quite sensitive to the operator walking near the equipment, possibly due to the ground being saturated from rainwater. The maximum vibration recorded for the day (2.38 millimeters per second (mms)) occurred at Station 3 at 11:11 AM, and was likely generated by the operator walking within 20-feet of the sensor. The dominant frequency for Stations 1 and 2 was 100 Hz. The dominant frequencies for Station 3 were typically from 1 to 6 Hz. in the vertical axis, and 100 Hz. when oriented toward the roadway.
Table 1 – Vibration Data Summary
Station Sensor Orientation
Average Peak Vibration Level / Average Frequency
North-South Axis (mms/Hz)
Vertical Axis (mms/Hz)
East-West Axis (mms/Hz)
1 North-South 0.06 / 96 0.09 / 84 0.08 / 73 2 North-South 0.06 / 92 0.06/ 85 0.07 / 75 3 East-West 0.12 / 4 0.10 / 9 0.06 / 87 Overall Average 0.08 0.08 0.07
The Schnabel Vibration Monitoring Memorandum recommended that the maximum allowable vibration threshold should be 0.1 inches per second, which converts to 2.54 mms. The overall average recorded ambient vibrations were about 3 percent of the threshold. The peak recorded vibration was 94 percent of the threshold. As discussed above, the peak recorded vibration was isolated and did not appear to be from ambient roadway traffic. Recommendations For the construction monitoring, we recommend that the seismograph sensor(s) be buried about six-inches below the surface of the ground. The sensor(s) should not be attached to any of the structures. This will help to avoid some sensitivity to people walking near the monitoring station(s). While this will not totally prevent these false high vibrations from occurring, the contractor will need to be able to discern between trigger events generated by their activities and those of people who may be walking near the monitoring station(s). The contractor’s Vibration Monitoring Plan (VMP) should include some language regarding equipment setup and programming. As described above, the VMP should address how the contractor will address exceeding the maximum allowable vibration threshold. This recommendation is based on the fact that steady-state and pseudo-steady-state vibrations are more likely to cause damage to an (historic) structure than transient or isolated vibrations. Examples of these vibrations are:
Type of Vibration Construction Activities Steady-State (Continuous)
Vibratory pile driving, soil compaction with vibratory roller, tracked excavator running across the site, hoeram
Pseudo-Steady-State H-pile driving, hoeram Transient Excavation, blasting, dropping equipment or materials
In general, the contractor should stop their vibration-generating activity when notified that they exceeded the threshold criteria and evaluate what the activity is that generated the trigger event. To avoid work stoppages from false event
A. Morton Thomas & Associates, Inc. US Route 1 Improvements
Project 13612045.04 / June 18, 2015 Page 3 Schnabel Engineering
triggers, we recommend basing the stoppage criteria on the activity that generated the excessive vibrations combined with the duration of the activity that generated the exceedance. Therefore, if the vibrations are more continuous in nature and will last longer than one (1) minute, the contractor shall stop the activity and develop another strategy to conduct their work. We have endeavored to complete the services identified herein in a manner consistent with the level of care and skill ordinarily exercised by members of the profession currently practicing in the same locality and under similar conditions as this project. No other representation, express or implied, is included or intended, and no warranty or guarantee is included or intended in this memorandum or any other instrument of service. We appreciate the opportunity to be of service to you for this project. Please contact us if you have any questions regarding this memorandum.
SIGNED:
Attachments: 1. Seismograph Location Sketch (Figure 1) 2. Vibration Reports for Stations 1-3 3. Photos of the Crack Monitoring Gauge Initial Readings
BRL:EGD G:\2013 Projects\Sterling\13612045.04 Route 1 Widening Ft Belvoir\Ambient Vibration Study rev.docx


ROUTE 1 WIDENING A. Morton Thomas & Associates
Lorton, Virginia PROJECT NO. 13612045.04
© Schnabel Engineering South, P.C. 2015 All Rights Reserved
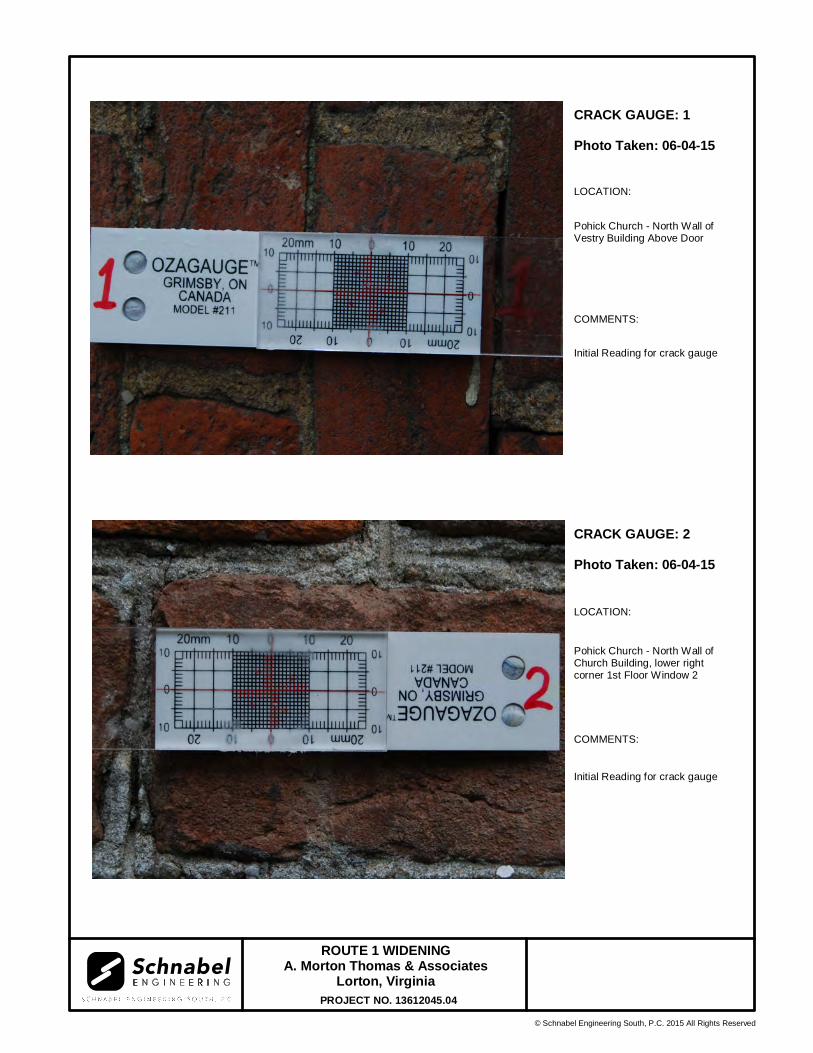
CRACK GAUGE: 1 Photo Taken: 06-04-15
LOCATION:
Pohick Church - North Wall of Vestry Building Above Door
COMMENTS:
Initial Reading for crack gauge
CRACK GAUGE: 2 Photo Taken: 06-04-15
LOCATION:
Pohick Church - North Wall of Church Building, lower right corner 1st Floor Window 2
COMMENTS:
Initial Reading for crack gauge
ROUTE 1 WIDENING A. Morton Thomas & Associates
Lorton, Virginia PROJECT NO. 13612045.04
© Schnabel Engineering South, P.C. 2015 All Rights Reserved
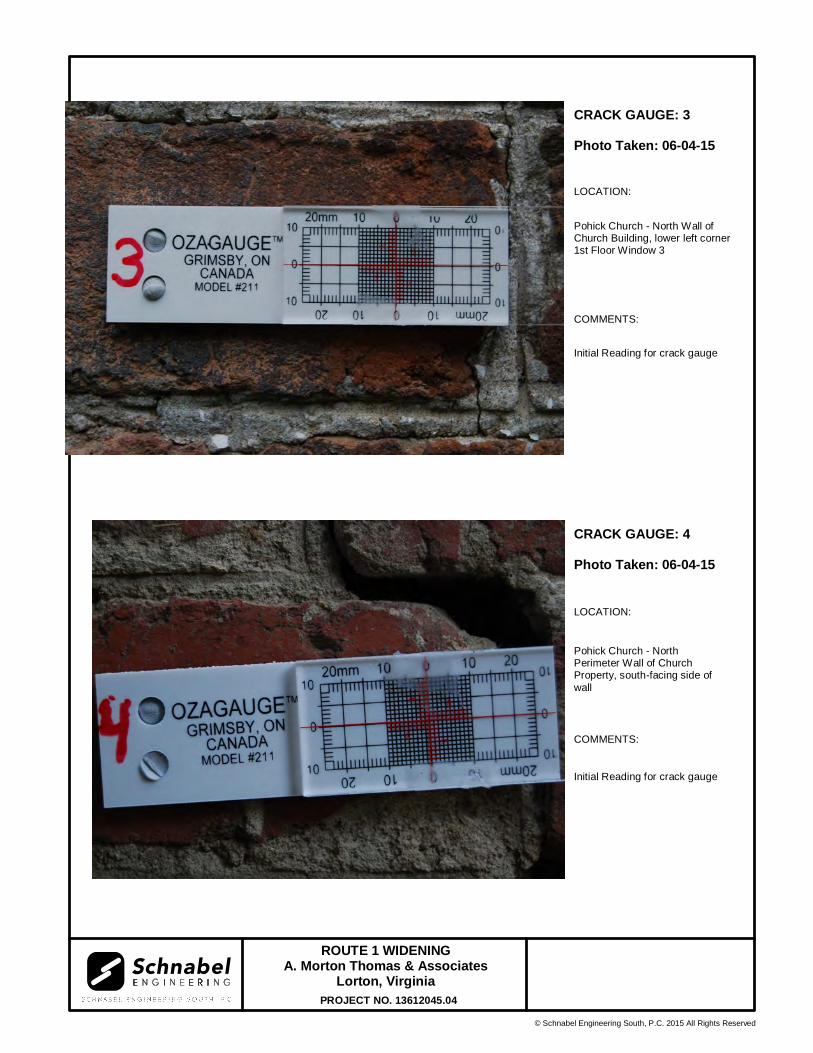
CRACK GAUGE: 3 Photo Taken: 06-04-15
LOCATION:
Pohick Church - North Wall of Church Building, lower left corner 1st Floor Window 3
COMMENTS:
Initial Reading for crack gauge
CRACK GAUGE: 4 Photo Taken: 06-04-15
LOCATION:
Pohick Church - North Perimeter Wall of Church Property, south-facing side of wall
COMMENTS:
Initial Reading for crack gauge
Top Related