


Languages
Pages
Legal


NCAPPA Conference - 2016
Steve Sharpe, PE, CEM
Energy Manager
The University of North Carolina at Wilmington
???

Agenda
� Overview of UNCW CREST Research Park/MARBIONC Building
� Design Intent for Plant Operations
� Chiller Plant Controls & Optimization
� Optimization – How do we know it works?
� Value of Continuous Commissioning & Preventative Maintenance
� Q&A
Facility Overview
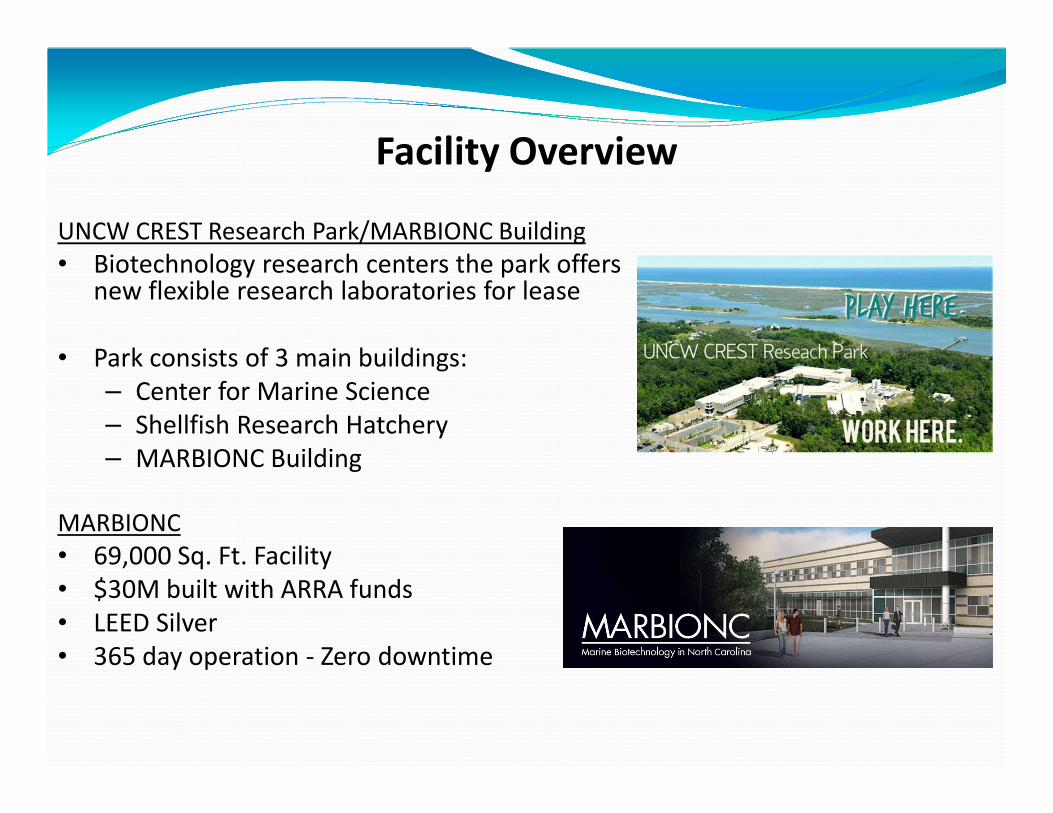
UNCW CREST Research Park/MARBIONC Building
• Biotechnology research centers the park offers new flexible research laboratories for lease
• Park consists of 3 main buildings:
– Center for Marine Science
– Shellfish Research Hatchery
– MARBIONC Building
MARBIONC
• 69,000 Sq. Ft. Facility
• $30M built with ARRA funds
• LEED Silver
• 365 day operation - Zero downtime

Energy & Design Intent for Chiller Plant Operations
� High energy performance system – Energy efficiency
� Superior level of redundancy – 24/7/365 operations
� Assured reliability for Critical Cooling - A large fresh air requirement meant the
applied design must perform well under all conditions
� Verifiable results – Track and measure progress
� Optimized Operations - High performance components do not operate at peak
performance by themselves
� Optimized Operations - Individual equipment requirements as well as a total system
level requirements
• Design engineer to develop sequence of operation � Simple
sequence that doesn’t optimize the operation.
• Previous optimization software installation was a ‘black box’ � No
verification that it was actually optimizing. This system was removed
and replaced when it went down.
• What was needed was a system that would:
• Provide optimization
• Makes sense
• Not be a black box
• Be verifiable
Lessons Learned - Past Attempts at Optimization
for Chiller Plant Operations

2x 750Ton Mag Bearing Oil Free Chillers2x 750Ton Mag Bearing Oil Free Chillers
2x Variable Primary Chw Pumps2x Variable Primary Chw Pumps
1x Low Approach Tower with large flow range1x Low Approach Tower with large flow range
Variable speed condenser water pumpingVariable speed condenser water pumping
HVAC System optimization/ condition monitoringHVAC System optimization/ condition monitoring
The Solution – Overview of Chiller Plant Equipment

Optimization, Automated Reporting & Condition Monitoring

Kiltech - CPECS Optimization System
� Handles plant control:
� Hard wired input/ outputs.
� Communication to chillers, VFD’s, air handlers, BAS and BTU meters.
� Delivers total system energy approach sequence of operations.
� Includes full measurement & verification system.
� Inbuilt enterprise SQL database stores 7yrs data onsite and can be backed up offsite.

The System Approach
� High performance components do not necessarily operate at peak
performance by themselves.
� Control strategy needs to understand individual equipment
requirements as well as a total system level energy consumption.
� Air side integration a must � The left hand needs to know what the
right hand is doing!

Brute Force Optimization strategy or BFO for short:
� This approach is equipment model driven and is customized to the plant and operations.
� At the heart of the software is an algorithm that is computing all possible chiller, pump and cooling tower sequencing permutations, modified flows, set points and load limits.
� These calculations find the combination of equipment and speeds that result in the lowest kW input and/or the lowest instantaneous cost of production (driven by a cost of operation goal seek algorithm as an electric device minimal kW search).
The System Approach

The System Approach
Brute Force
Optimizer
Chw & Cw Pumps
Cooling Towers

Optimization - Strategies Applied
� Variable primary pumping control with reset based on weighted AHU & FCU valve position.
� Optimized cooling tower temperature control that utilizes chiller load data and actual cooling tower off design correlations (merkelequations).
� Optimized sequencing of chillers & pumps using 15min buffered data and actual equipment models.
� Variable speed condenser water control for part load optimization.
� Chilled water reset based on AHU fan power, discharge air set point and percentage cooling valve position.

Variable Primary Pumping ΔP Reset
� Looks at all the AHU & FCU valves in the system.
� Attempt to maintain valves between 80% and 90% open.
� Moves the system curve continuously!
� Resets must take place at a controlled rate and upper and lower limits need to be set.
� Error conditions such as a stuck open valve need to be detected and handled.
� Should be implemented along side an air side optimization program that includes AHU condition monitoring.

Variable Primary Pumping ΔP Reset
Maintain at 80% to 90%
Via dp reset strategy.

Variable Primary Pumping ΔP Reset
Reduced head – moving system curve
limits the system valve throttling and
unnecessary pump work.
New System Curve
Optimized Tower Control
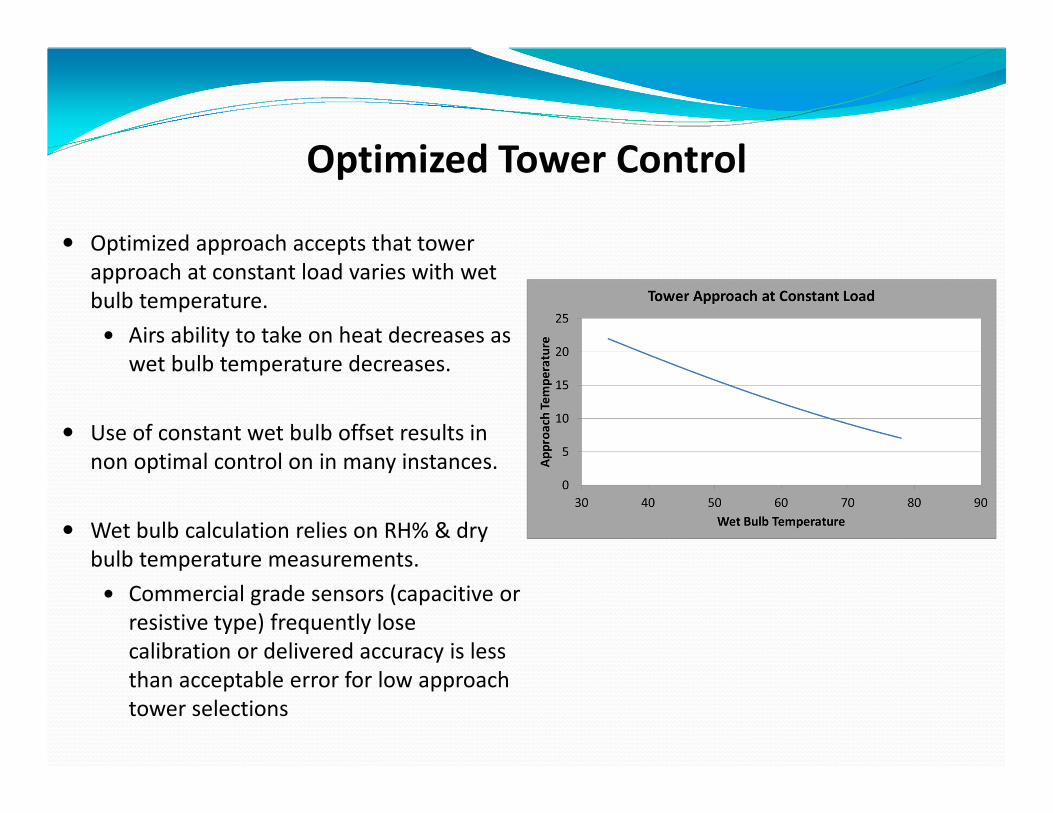
� Optimized approach accepts that tower
approach at constant load varies with wet
bulb temperature.
� Airs ability to take on heat decreases as
wet bulb temperature decreases.
� Use of constant wet bulb offset results in
non optimal control on in many instances.
� Wet bulb calculation relies on RH% & dry
bulb temperature measurements.
� Commercial grade sensors (capacitive or
resistive type) frequently lose
calibration or delivered accuracy is less
than acceptable error for low approach
tower selections

Optimized Tower Control

Finding the Energy Sweet Spot

Optimized Chiller Sequencing
� When applied to variable speed chillers algorithm needs to accept
that chiller performance on a VFD centrifugal varies greatly with lift
(CWRT – CHWST). Constantly changing sequence point!
� Compressor operation at higher lift have smaller operating envelopes
(compressors run closer to the surge line).
� Optimized sequencing needs to look at load, condenser water flow
rate and lift.

Optimized Chiller Sequencing
� CPECS uses a multivariate regression model to predict chiller
performance based on:
� CHWST
� CWST
� CWRT
� Power Input
� Evaporator and Condenser Approach temperatures.
CAPFT = a + b*CHWS + c*CHWS^2 + d*CWRT + e*CWRT^2 +
f*CHWS*CWRT
EIRFT = a + b*CHWS + c*CHWS^2 + d*CWRT + e*CWRT^2 +
f*CHWS*CWRT
EIRFPLR = a + b*PLR + c*PLR^2 + d*dT + e*dT^2 + f*PLR*dT

Typical Chiller Performance Model at fixed leaving
chilled water temperature

Modified Model – Accepts variable CW flow &
changing CHWST
• 27 coefficients
• Requires additional modeling
and data handling tools
• Each different chiller must be
modeled.
• CPECS currently has models
for:
• Turbocor based chillers
• Many york chillers (Const
Speed & VFD)
• Carrier VFD machines
• Trane VFD machines

Optimized Chiller Sequencing – Putting the
chiller performance models to work
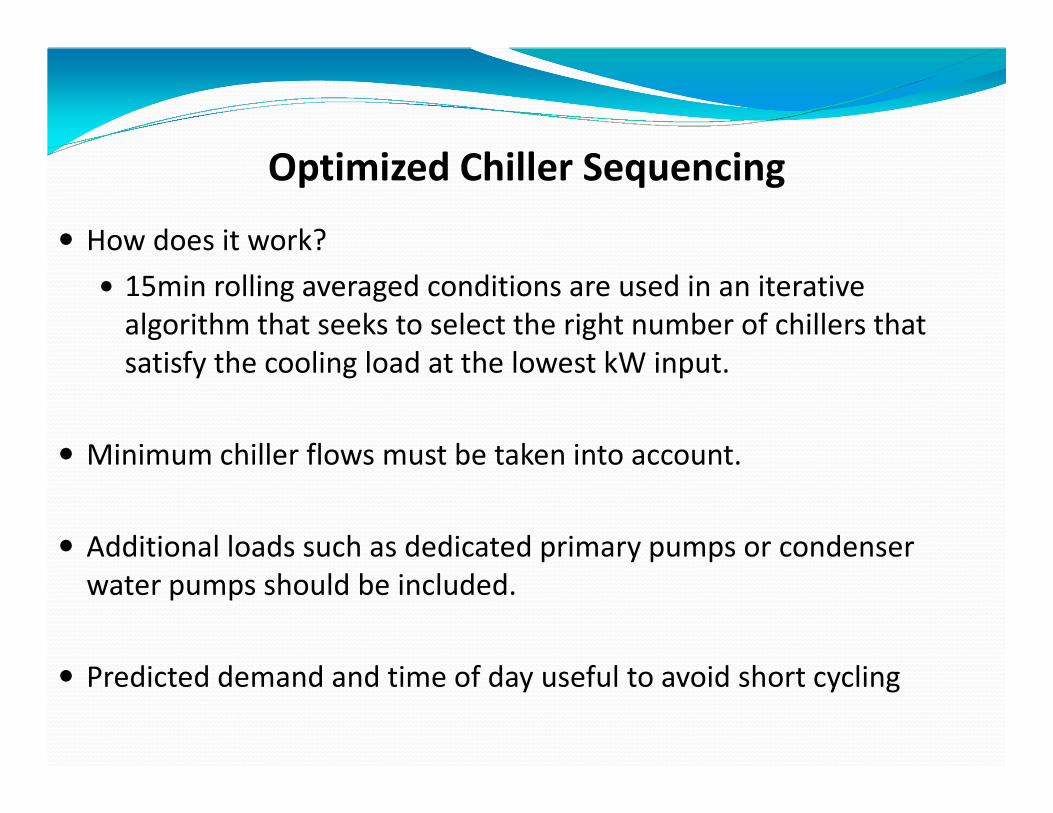
Optimized Chiller Sequencing
� How does it work?
� 15min rolling averaged conditions are used in an iterative
algorithm that seeks to select the right number of chillers that
satisfy the cooling load at the lowest kW input.
� Minimum chiller flows must be taken into account.
� Additional loads such as dedicated primary pumps or condenser
water pumps should be included.
� Predicted demand and time of day useful to avoid short cycling

Variable Speed Condenser Water Pumping
� Needs to be carefully analyzed against load profile prior to selection of strategy.
� 30% of surveyed applications should not adopt this.
� Needs to be made in conjunction with tower control optimization strategy.
� 15% error on flow can result in operation less efficient than constant speed pumping.
� Tower minimum flow (fill coverage) needs to be closely adhered to.
� Chiller minimum flow and fouling avoidance needs to be taken into account – know your condenser design tube velocity.
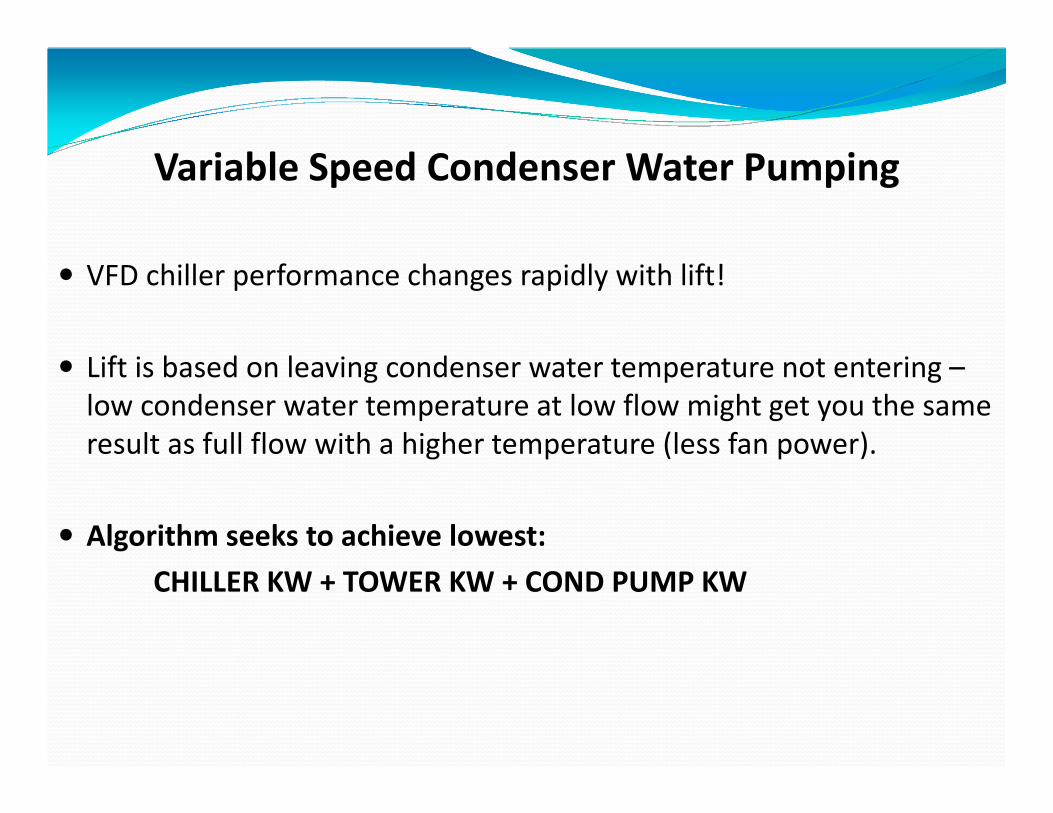
Variable Speed Condenser Water Pumping
� VFD chiller performance changes rapidly with lift!
� Lift is based on leaving condenser water temperature not entering –
low condenser water temperature at low flow might get you the same
result as full flow with a higher temperature (less fan power).
� Algorithm seeks to achieve lowest:
CHILLER KW + TOWER KW + COND PUMP KW

Adaptive Chilled Water SP Reset
� Chilled water reset is adaptively reset based on an energy trade off
algorithm between AHU fan energy and chiller energy.
� Such a strategy requires full integration from the central plant to the
AHU and AHU variable speed drive.
� Initial set point typically set to 2F above base set point, adaptive
algorithm takes effect after 20min of plant operation.

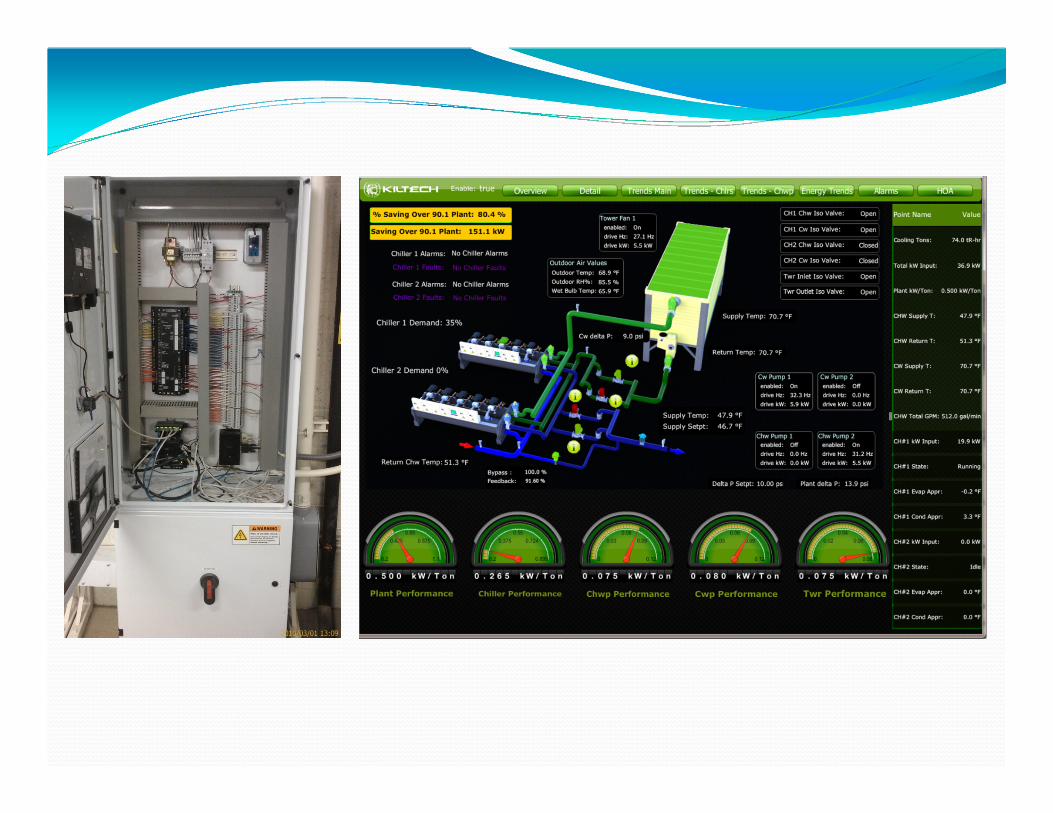
Putting it all together

DETAIL PAGE – INSERT SCREEN CAPTURE GRAPHIC

OVERVIEW PAGE – INSERT SCREEN CAPTURE INCL. REPORTING
GRAPHICS
Optimization – How do we know it works?
� Continuous feedback – self-monitoring
� Displayed target values.
� Visual Real-time Comparison to baseline performance models.
� Reporting with traceable accuracies.
� Beware of the “green washers”
Optimization – How do we know it works?
UNCW MARBIONC Results
� Energy saved over baseline to date (Placeholder) as of Jan 1 2013
when system started
� Financial figures (Placeholder)
� Reporting overview & demo
� Live demonstration

Optimization Issues
� Complex algorithms and equipment models that are not necessarily
accessible to the controls community.
� Additional engineering costs to implement.
� Relatively new market with few players:
� Tom Hartman
� Taylor Engineering
� Philip Kennedy
� Burt Rishell
� Siemens demand flow

� Most commercial optimization providers have adopted a “black box”
approach to chilled water plant and air side optimization as a means
to protect their investment. Some vendors even requesting NDA’s just
to talk about their product.
� Black box approach has led to skepticism and limited adoption in the
field.
� Industry wide adoption has the potential to reduce building HVAC
energy use by as much as 24% worldwide.
� Legislation, education and greater number of open publications
required to promote technologies/ engineering methods.
Optimization Issues

Keeping the performance up
• Most buildings continuously evolve in terms of use and function
• Consequently, while commissioning an existing HVAC system to the design intent
generally improves comfort and efficiency significantly, it is still likely to result in a
sub-optimal system set-up.
• Continuous commissioning - explicitly considers current functions and uses of the
building and requirements on its systems and attempts to optimize the efficiency of
the systems for the current application.
• Examples: Six buildings on the Texas Tech University campus, several buildings at
Penn State University, the major buildings on the Texas A&M University campus, the
Texas A&M International campus at Laredo, Brooke Army Medical Center, and others
� 15 to 25% annual energy savings from retrofitted buildings, from newer
buildings, or from older, existing buildings.
Value of Continuous Commissioning

Value of Preventative Maintenance
Jones Lang LaSalle surveyed approximately 12 percent of the company’s entire
portfolio of 119 million square feet. For this 14 million square feet of mixed property
types:
Source: Jones Lang LaSalle. ‘Determining the Economic Value of Preventative Maintenance’

Value of Preventative Maintenance
Source: Jones Lang LaSalle. ‘Determining the Economic Value of Preventative Maintenance’

Steve Sharpe PE, CEM
Energy Manager
The University of North Carolina at
Wilmington
Phone: 910-962-7454
Email: [email protected]
Thank you.
Questions?
???
Local Sales Representation: Thermal Resource Sales
888-996-2220
Top Related