


Languages
Pages
Legal

October - What Occurred
National Weather Service Grand Forks
Weather & Climate Review
October-November 2019
Temperature
Table 1 October Temperature and Precipitation Statistics
Figure 1
October Daily
Departure from
Normal
Temperatures at
Baudette, MN
Blue Bars = Colder than Normal Days & Red Bars = Warmer than Normal Days
Precipitation
Figure 2 CPC Temp Outlook Figure 4 CPC Pcpn Outlook Figure 3 Observed Temp Figure 5 Observed Pcpn
The October temperature (Figure 2) and precipitation (Figure 4) outlooks issued by the Climate Prediction Center (CPC) in late Sep-
tember are shown above. Compare these with the observed October departures from normal temperatures (Figure 3) and precipi-
tation (Figure 5). There was a higher probability for below normal temperatures at Devils Lake, which turned out correct.
Table 1 shows the October average temperature (AveT), departure from normal temperature (TDept), precipitation (Pcpn), depar-
ture from normal precipitation (PDept), and snowfall (Snow) for our 5 main climate sites (Devils Lake (DVL), NWS Grand Forks (NWS
GF), Fargo (FAR), Baudette (BDE), and Park Rapids (PKD)). Every site ended with below normal temperatures, and all but Devils Lake
had above normal precipitation. Snowfall amounts at the NWS in Grand Forks and Fargo were similar to last October. Figure 1 plots
the daily departure from normal temperatures in October 2019 at Baudette, MN. Although more days were cooler than normal
(blue bars), there were also a few warm days as well (red bars).
The precipitation total of 3.78 inches at Fargo was the 10th wettest October on record. The snowfall total of 4.5 inch-
es at Fargo tied for the 5th most October snow. The daily snowfall amount of 4.1 inches at Fargo on the 11th set a
new daily record.
Figure 6 Monthly Departures from
Normal Temps at Fargo, ND
Figure 7 Monthly Departures from
Normal Pcpn at Fargo, ND
As an example, Figure 6 shows that in the past 6 months, 3 months
have been above normal and 3 months have been below normal (for
temperatures) at Fargo. Figure 7 shows that precipitation amounts at
Fargo during July, August, September, and October were all above
normal. Fargo missed several heavy rain events that hit areas further
north, so other areas were even wetter than Fargo.
Overall, October 2019 was cool and wet. Looking at just the Fargo climate site (FAR), Figures 6 and 7 show how Octo-
ber 2019 fits into the previous 5 months. Figure 6 plots the monthly departures from normal temperatures at Fargo.
The blue bars represent months that were colder than normal, while the red bars represent months that were warm-
er than normal. Figure 7 plots the monthly departures from normal precipitation at Fargo. The green bars represent months that
were wetter than normal, while the brown bars represent months that were drier than normal.
Records
6 Month
Trend
The latest Climate Prediction Center (CPC) temperature (Figure 15) and
precipitation (Figure 16) outlooks for November are shown to the left. For
eastern North Dakota and the northwest quarter of Minnesota, the CPC is
forecasting higher probabilities for below normal temperatures and equal
chances for above, normal, or below normal precipitation.
Figure 15 Temperature Figure 16 Precipitation
Figure 11 October 10-12, 2019 Snowfall
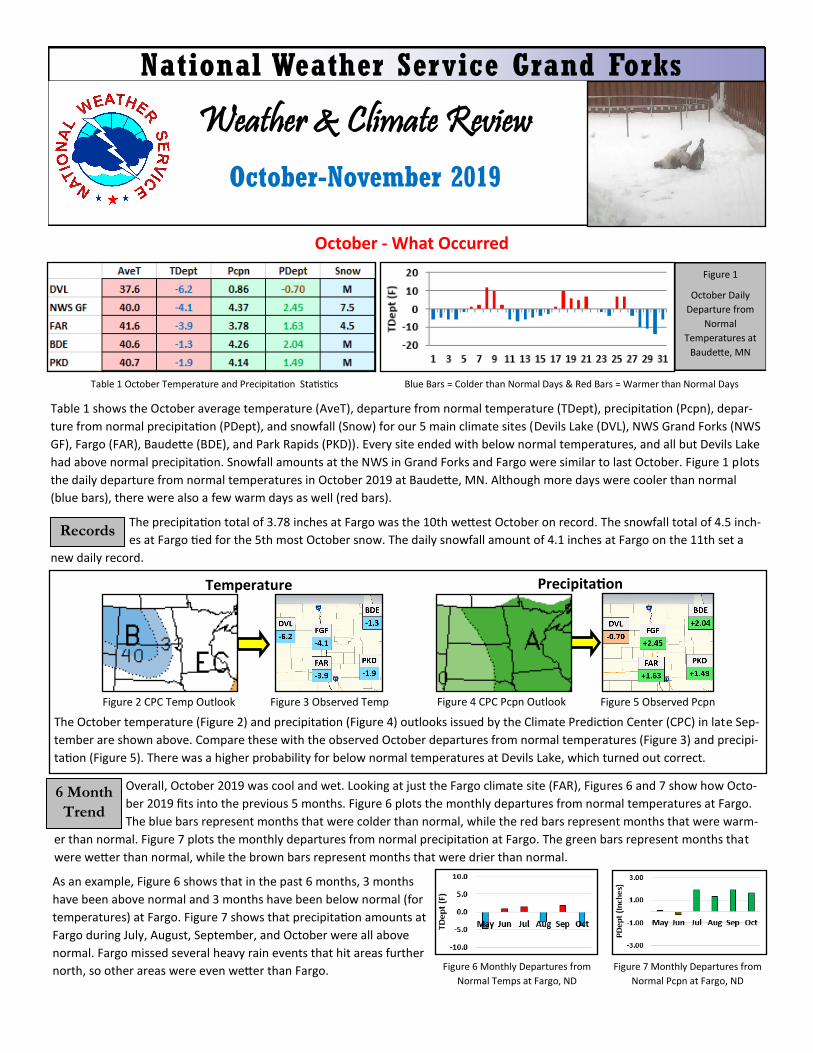
As far as high impact weather goes, no severe convective warnings were issued in October 2019, or the year be-
fore, in October 2018. However, in October 2019, winter weather once again made an early impact on the area. A
Winter Storm Warning was issued for portions of the area from October 10th-12th (Figure 8), then portions of it
transitioned to a Blizzard Warning from October 11th-12th (Figure 9). Coincidentally, in 2018, an early season
Winter Storm Warning was issued on the same initial date, October 10th (Figure 10).
The winner of our October photo contest was Brad Lykins, who submitted a photograph of a dog enjoying the October 10-12 snow
(Page 1, top right). This storm had huge impacts on the region. Figure 12 shows a tree destroyed by the weight of the heavy, wet
snow, Figure 13 shows the high waters of the Middle River, and Figure 14 shows a flooded sugar beet field.
November - Looking Ahead
Figure 10 October 10, 2018
Warnings
Figure 12 Downed Tree in Grand Forks Figure 13 Middle River at the Old Mill State Park MN Figure 14 Waterlogged Sugar Beet Field
Photographs
Storm of the Month
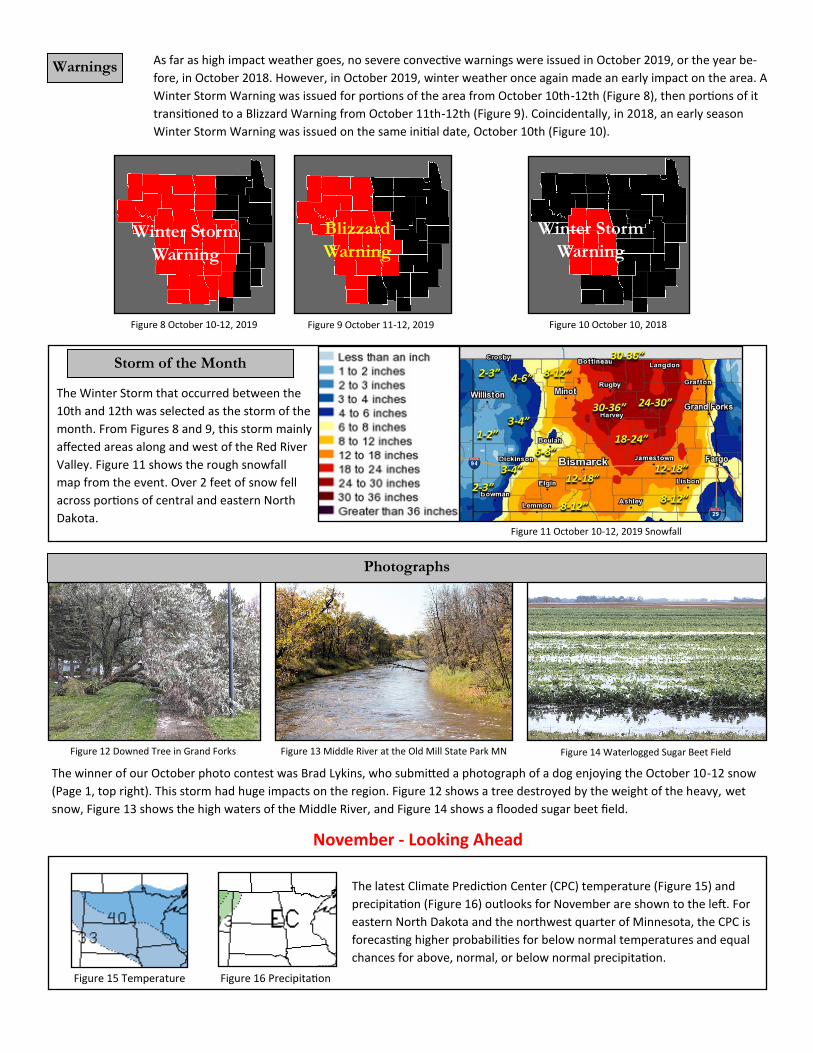
The Winter Storm that occurred between the
10th and 12th was selected as the storm of the
month. From Figures 8 and 9, this storm mainly
affected areas along and west of the Red River
Valley. Figure 11 shows the rough snowfall
map from the event. Over 2 feet of snow fell
across portions of central and eastern North
Dakota.
Winter Storm
Warning
Winter Storm
Warning
Blizzard
Warning
Figure 8 October 10-12, 2019 Figure 9 October 11-12, 2019

Miscellaneous
So what are normal temperatures in November? Figure 15 shows November normals for selected cities across eastern North Dako-
ta and northwest Minnesota. As an example, at Langdon on November 1st, the normal high is 41 and the normal low is 22. By No-
vember 30th at Langdon, the normal high falls to 23 and the normal low is 7. The normal rainfall at Langdon in November is 0.72
inches.
Figure 15 Normals for Selected Cities Figure 16 November 2018 Data
As a comparison to normal values, Figure 16 shows various ob-
served data from last year (2018). As an example, in Fargo (FAR),
0.61 inches of precipitation (green box) and 5.3 inches of snow (blue
box) fell. The highest temperature was 50 degrees (red number),
while the lowest temperature was –3 degrees (blue number).
In November 2018, no winter weather warnings were issued.
This has been a wet fall. Figure 17 shows the observed rainfall across the Northern Plains during October 2019. The red areas over
eastern North Dakota into Minnesota represent rainfall amounts greater than 5 inches. Normal amounts of rainfall in October
range from 1.49 inches at Langdon, 2.12 inches at Red Lake Falls, and 2.61 inches at Breckenridge. Figure 18 shows the October
precipitation totals as the percent of normal. The purple areas north of a Fargo to Baudette line are 200-400 percent of normal.
Figure 19 shows the observed rainfall during the past 60 days, which covers most of September and October. The green and yellow
areas over southeast North Dakota and the adjacent areas of west central Minnesota have seen the least rainfall (although still a
lot), with amounts ranging from 6 to 10 inches. Normal amounts of rainfall in September and October range from 3.30 inches at
Langdon, 4.95 inches at Red Lake Falls, and 5.46 inches at Breckenridge. Finally, Figure 20 shows the September-October precipita-
tion totals as the percent of normal. Again, most of northeast North Dakota into the corner of Northwest Minnesota have values
ranging from 300 to 600 percent of normal.
Figure 19 September-October Precipitation Totals
Figure 17 October Precipitation Totals Figure 18 October Precipitation Percent of Normal
Figure 20 September-October Precipitation Percent of Normal
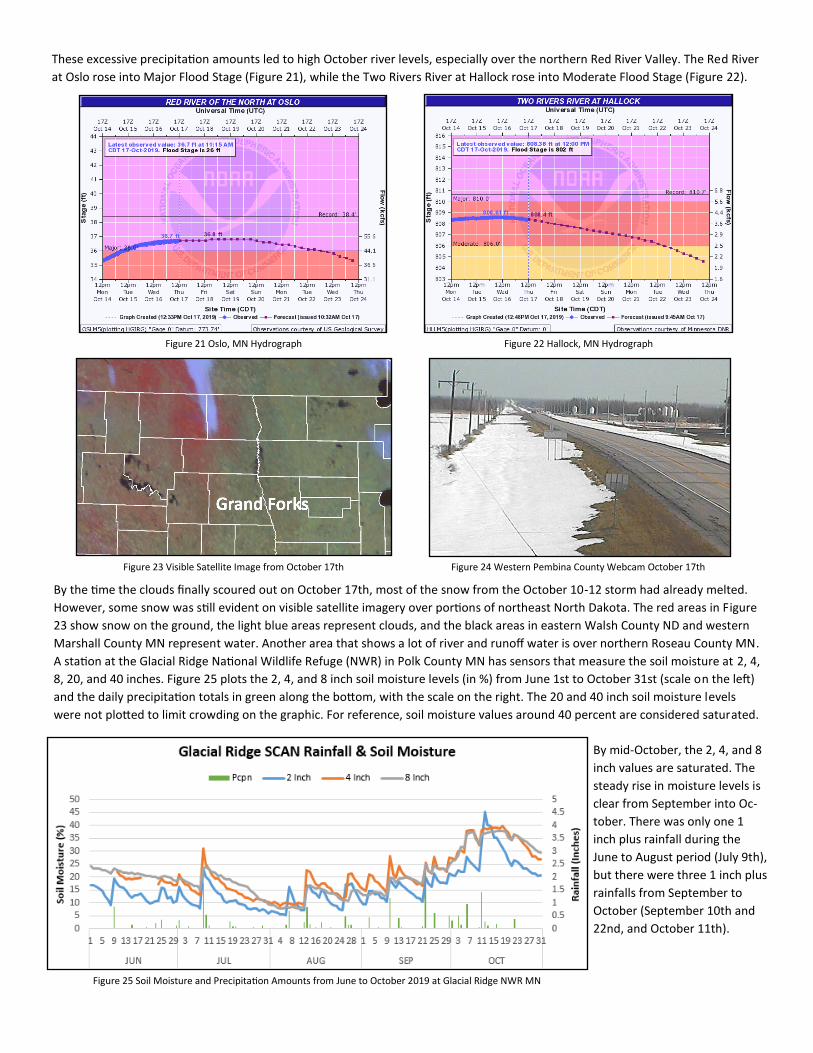
These excessive precipitation amounts led to high October river levels, especially over the northern Red River Valley. The Red River
at Oslo rose into Major Flood Stage (Figure 21), while the Two Rivers River at Hallock rose into Moderate Flood Stage (Figure 22).
Figure 21 Oslo, MN Hydrograph Figure 22 Hallock, MN Hydrograph
Figure 23 Visible Satellite Image from October 17th Figure 24 Western Pembina County Webcam October 17th
By the time the clouds finally scoured out on October 17th, most of the snow from the October 10-12 storm had already melted.
However, some snow was still evident on visible satellite imagery over portions of northeast North Dakota. The red areas in Figure
23 show snow on the ground, the light blue areas represent clouds, and the black areas in eastern Walsh County ND and western
Marshall County MN represent water. Another area that shows a lot of river and runoff water is over northern Roseau County MN.
A station at the Glacial Ridge National Wildlife Refuge (NWR) in Polk County MN has sensors that measure the soil moisture at 2, 4,
8, 20, and 40 inches. Figure 25 plots the 2, 4, and 8 inch soil moisture levels (in %) from June 1st to October 31st (scale on the left)
and the daily precipitation totals in green along the bottom, with the scale on the right. The 20 and 40 inch soil moisture levels
were not plotted to limit crowding on the graphic. For reference, soil moisture values around 40 percent are considered saturated.
By mid-October, the 2, 4, and 8
inch values are saturated. The
steady rise in moisture levels is
clear from September into Oc-
tober. There was only one 1
inch plus rainfall during the
June to August period (July 9th),
but there were three 1 inch plus
rainfalls from September to
October (September 10th and
22nd, and October 11th).
Figure 25 Soil Moisture and Precipitation Amounts from June to October 2019 at Glacial Ridge NWR MN
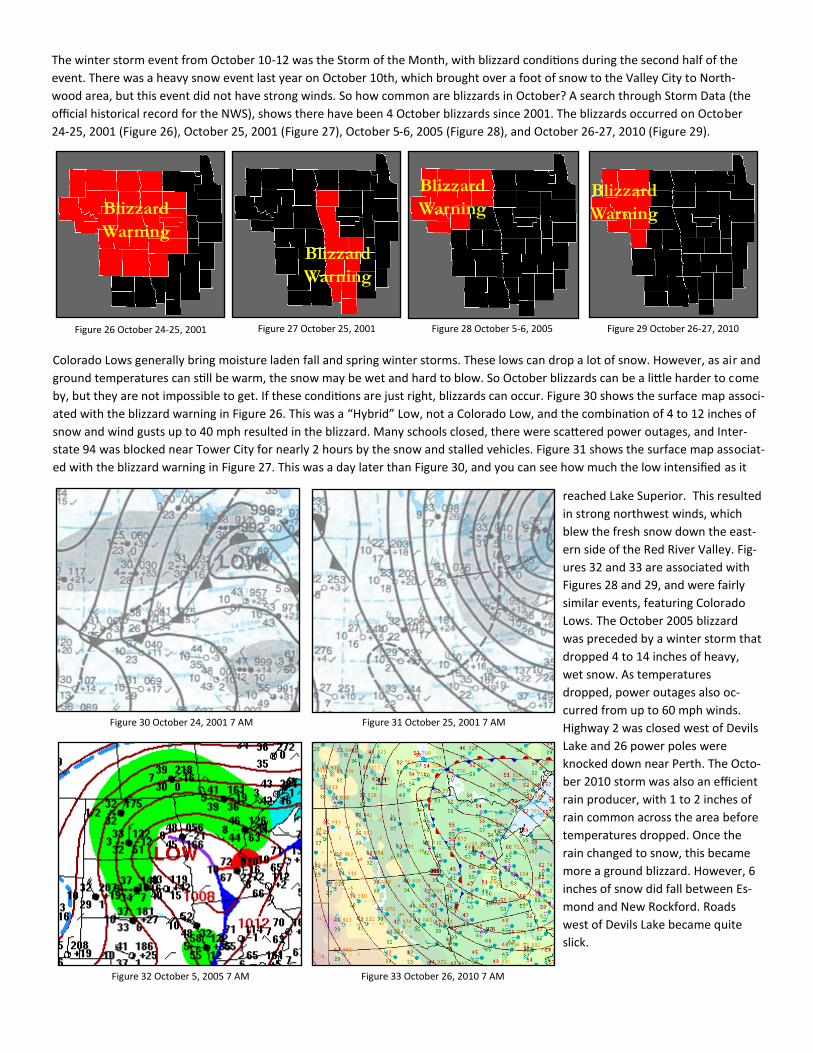
The winter storm event from October 10-12 was the Storm of the Month, with blizzard conditions during the second half of the
event. There was a heavy snow event last year on October 10th, which brought over a foot of snow to the Valley City to North-
wood area, but this event did not have strong winds. So how common are blizzards in October? A search through Storm Data (the
official historical record for the NWS), shows there have been 4 October blizzards since 2001. The blizzards occurred on October
24-25, 2001 (Figure 26), October 25, 2001 (Figure 27), October 5-6, 2005 (Figure 28), and October 26-27, 2010 (Figure 29).
Blizzard
Warning
Figure 26 October 24-25, 2001 Figure 27 October 25, 2001 Figure 28 October 5-6, 2005 Figure 29 October 26-27, 2010
Blizzard
Warning
Blizzard
Warning Blizzard
Warning
Colorado Lows generally bring moisture laden fall and spring winter storms. These lows can drop a lot of snow. However, as air and
ground temperatures can still be warm, the snow may be wet and hard to blow. So October blizzards can be a little harder to come
by, but they are not impossible to get. If these conditions are just right, blizzards can occur. Figure 30 shows the surface map associ-
ated with the blizzard warning in Figure 26. This was a “Hybrid” Low, not a Colorado Low, and the combination of 4 to 12 inches of
snow and wind gusts up to 40 mph resulted in the blizzard. Many schools closed, there were scattered power outages, and Inter-
state 94 was blocked near Tower City for nearly 2 hours by the snow and stalled vehicles. Figure 31 shows the surface map associat-
ed with the blizzard warning in Figure 27. This was a day later than Figure 30, and you can see how much the low intensified as it
Figure 30 October 24, 2001 7 AM Figure 31 October 25, 2001 7 AM
Figure 32 October 5, 2005 7 AM Figure 33 October 26, 2010 7 AM
reached Lake Superior. This resulted
in strong northwest winds, which
blew the fresh snow down the east-
ern side of the Red River Valley. Fig-
ures 32 and 33 are associated with
Figures 28 and 29, and were fairly
similar events, featuring Colorado
Lows. The October 2005 blizzard
was preceded by a winter storm that
dropped 4 to 14 inches of heavy,
wet snow. As temperatures
dropped, power outages also oc-
curred from up to 60 mph winds.
Highway 2 was closed west of Devils
Lake and 26 power poles were
knocked down near Perth. The Octo-
ber 2010 storm was also an efficient
rain producer, with 1 to 2 inches of
rain common across the area before
temperatures dropped. Once the
rain changed to snow, this became
more a ground blizzard. However, 6
inches of snow did fall between Es-
mond and New Rockford. Roads
west of Devils Lake became quite
slick.

The CPC Winter Outlook
EC
A
The Climate Prediction Center (CPC) temperature (Figure 15) and pre-
cipitation (Figure 16) outlooks for Winter (December-January-February)
are shown to the left. For eastern North Dakota and the northwest
quarter of Minnesota, the CPC is forecasting equal chances for above,
normal, or below normal temperatures and higher probabilities for
above normal precipitation.
Figure 34 Temperature Figure 35 Precipitation
Other Photographs of the October 10-12, 2019 Storm
Figure 36 Near Arvilla, ND Figure 37 Near Arvilla, ND Figure 38 Near Arvilla, ND
Figure 39 Near Arvilla, ND Figure 40 Turtle River State Park, ND Figure 41 Near Arvilla, ND
Figure 42 Near Arvilla, ND Figure 43 Near Arvilla, ND Figure 44 Near Arvilla, ND
Top Related