


Languages
Pages
Legal


May 7, 2020
1. Corporate Relationship DepartmentBSE Limited,Phiroze Jeejeebhoy Towers,Dalal Street,Mumbai - 400001.
2. Manager – ListingNational Stock Exchange of India Ltd.Exchange Plaza, C-1, Block G,Bandra Kurla Complex, Bandra (E),Mumbai - 400 051.
Sub.: Q4 FY 20 and FY20 Financial Results Conference Call – Investor Presentation
Ref.: 1. Regulation 30(6) of the Securities and Exchange Board of India (Listing Obligations and Disclosure Requirements) Regulations, 2015
2. Scrip Codes : BSE - 500165, NSE - KANSAINER
Dear Sirs,
Further to the intimation done by the Company on May 5, 2020, with respect to the Conference Call to be hosted by the Management of our Company on Friday, May 8, 2020 at 16.00 hrs (IST) to discuss Q4 FY 20 and FY20 Financial Results of the Company, we are enclosing herewith an Investor Presentation.
For KANSAI NEROLAC PAINTS LIMITED
G. T. GOVINDARAJAN COMPANY SECRETARY
1
1
2
All rights for this presentation are reserved with Kansai Nerolac Paints Limited.
• Investor Presentation(Update 19-20)
2
3

Disclaimer
This presentation may contain statements which reflect management’s current views and estimates and could be construed as forward making statements. The future involves certain risks and uncertainties that could cause actual results to differ materially from the current views being expressed. Potential risks and uncertainties include such factors as general economic conditions, foreign exchange fluctuations, competitive product and pricing pressures and regulatory developments
Investor PresentationMay 2020
4

All rights for this presentation are reserved with Kansai Nerolac Paints Limited.
• Business Environment FY 2019-20
4
Agenda
5
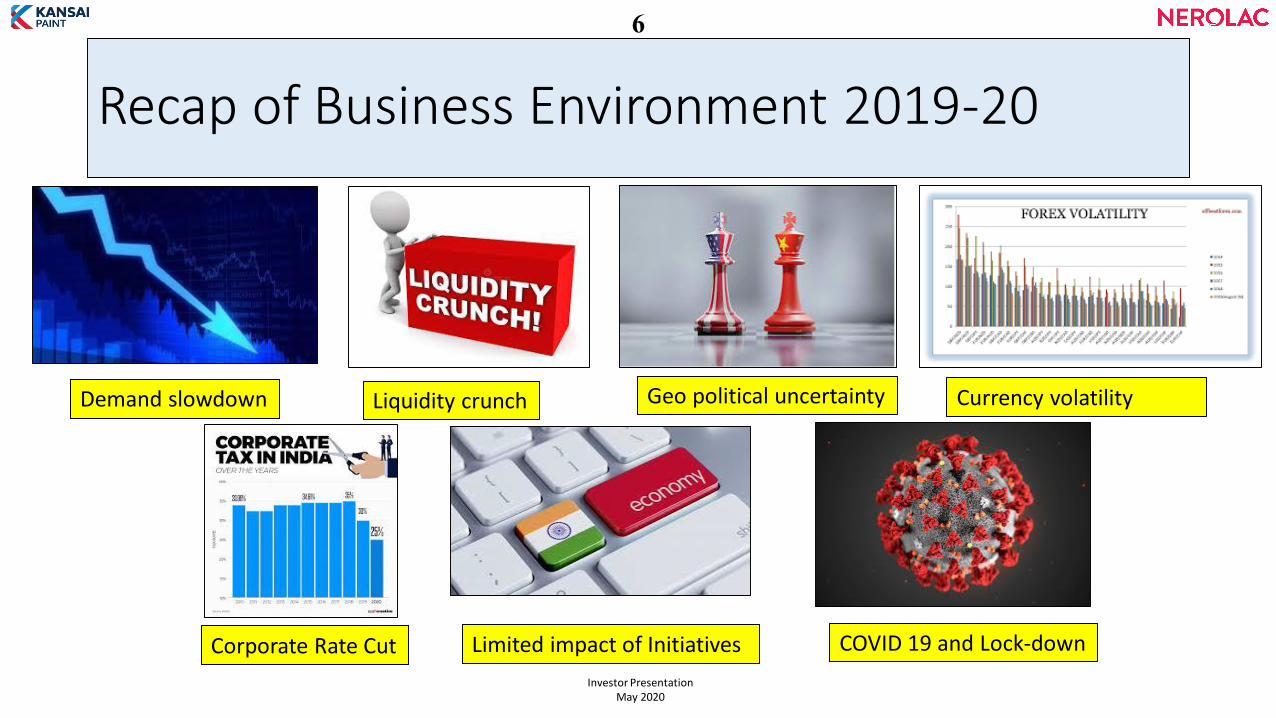
Recap of Business Environment 2019-20
Demand slowdown Liquidity crunch Geo political uncertainty Currency volatility
Corporate Rate Cut Limited impact of Initiatives COVID 19 and Lock-down
Investor PresentationMay 2020
6

All rights for this presentation are reserved with Kansai Nerolac Paints Limited.
• Financial Performance FY 2019-20
6
Agenda
7
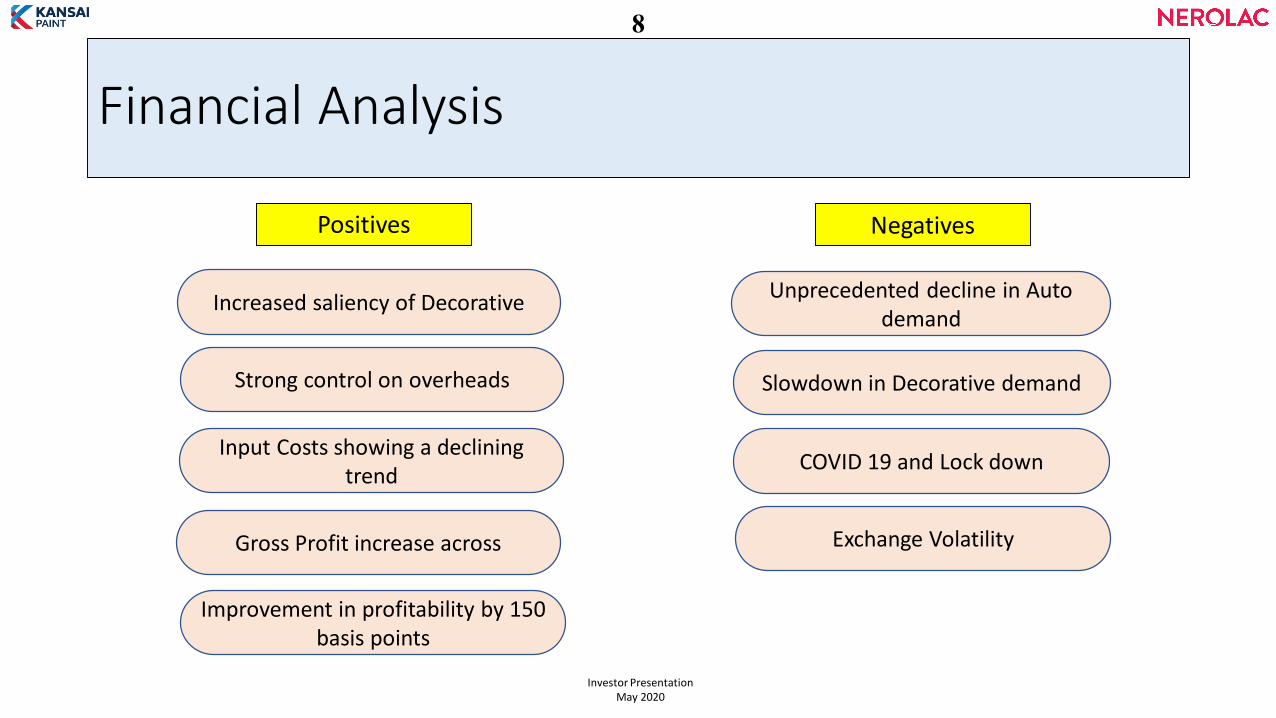
Financial Analysis
Increased saliency of Decorative
Strong control on overheads
Input Costs showing a declining trend
Gross Profit increase across
Positives
Improvement in profitability by 150 basis points
Negatives
Unprecedented decline in Auto demand
Slowdown in Decorative demand
COVID 19 and Lock down
Investor PresentationMay 2020
Exchange Volatility
8
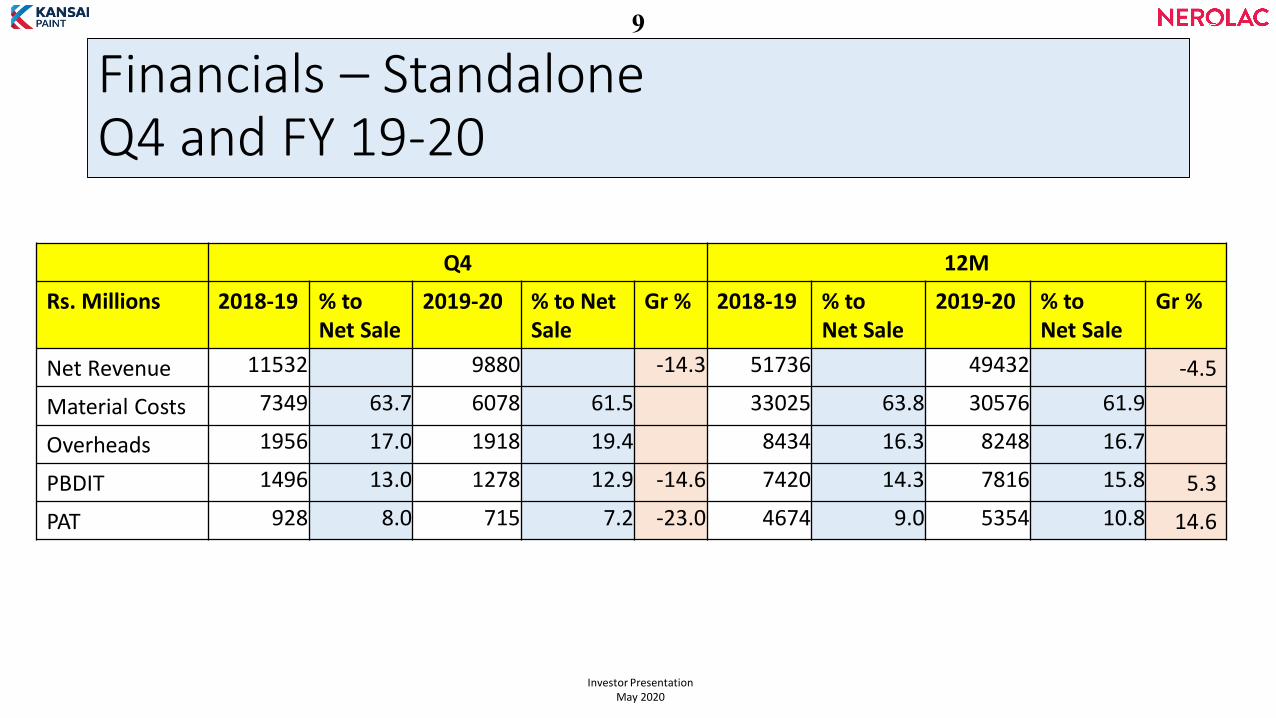
Financials – Standalone Q4 and FY 19-20
Investor PresentationMay 2020
Q4 12M
Rs. Millions 2018-19 % to Net Sale
2019-20 % to Net Sale
Gr % 2018-19 % toNet Sale
2019-20 % toNet Sale
Gr %
Net Revenue 11532 9880 -14.3 51736 49432 -4.5
Material Costs 7349 63.7 6078 61.5 33025 63.8 30576 61.9
Overheads 1956 17.0 1918 19.4 8434 16.3 8248 16.7
PBDIT 1496 13.0 1278 12.9 -14.6 7420 14.3 7816 15.8 5.3
PAT 928 8.0 715 7.2 -23.0 4674 9.0 5354 10.8 14.6
9

Financials – Consolidated Q4 and FY 19-20
Investor PresentationMay 2020
Q4 12M
Rs. Millions 2018-19 % to Net Sale
2019-20 % to Net Sale
Gr % 2018-19 % to Net Sale
2019-20 % toNet Sale
Gr %
Net Revenue 12212 10801 -11.6 54243 52800 -2.7
Material Costs 7779 63.7 6593 61.0 34620 63.8 32590 61.7
Overheads 2140 17.5 2267 21.0 9115 16.8 9263 17.5
PBDIT 1525 12.5 1342 12.4 -12.0 7525 13.9 8045 15.2 6.9
PAT 854 7.0 654 6.1 -23.4 4477 8.3 5158 9.8 15.2
10

Working Capital
Net Working Capital ➢ Absolute value reduction of Rs 991 M➢ Major reduction in inventory Rs.1227 M➢ Reduction in creditors Rs 1325 M.
Investor PresentationMay 2020
Rs Million FY 2018-2019 FY 2019-2020
WORKING CAPITAL Value NOD Value NOD
Inventories 10528 116 9301 111
Debtors 6740 37 6745 38
Loans & Advances 5627 4934
Cash & Bank balances (Excluding FD) 814 413
Total 23709 21393
Less: Curr. Liab. & Prov. 8781 72 7456 70
NET WORKING CAPITAL 14928 13937
11

11Investor PresentationMay 2020
Cash Flow
Particulars (Rs Million) 2018-19 2019-20
Profit Before tax 7134 6836
Add: Adjustment for Non-cash & non-operating items 400 1077
Operating Profit Before Working Capital Changes 7534 7913
Changes in Working capital (3452) (147)
Less : Direct tax paid (2978) (1560)
Operating Cash Flow 1104 6206
Less: Capital expenditure (5233) (2168)
Less: Investment in Subsidiaries (831) (412)
Less: Dividend paid (1689) (1689)
Less: Other payments (86) (230)
Free Cash Flow (6735) 1706
12
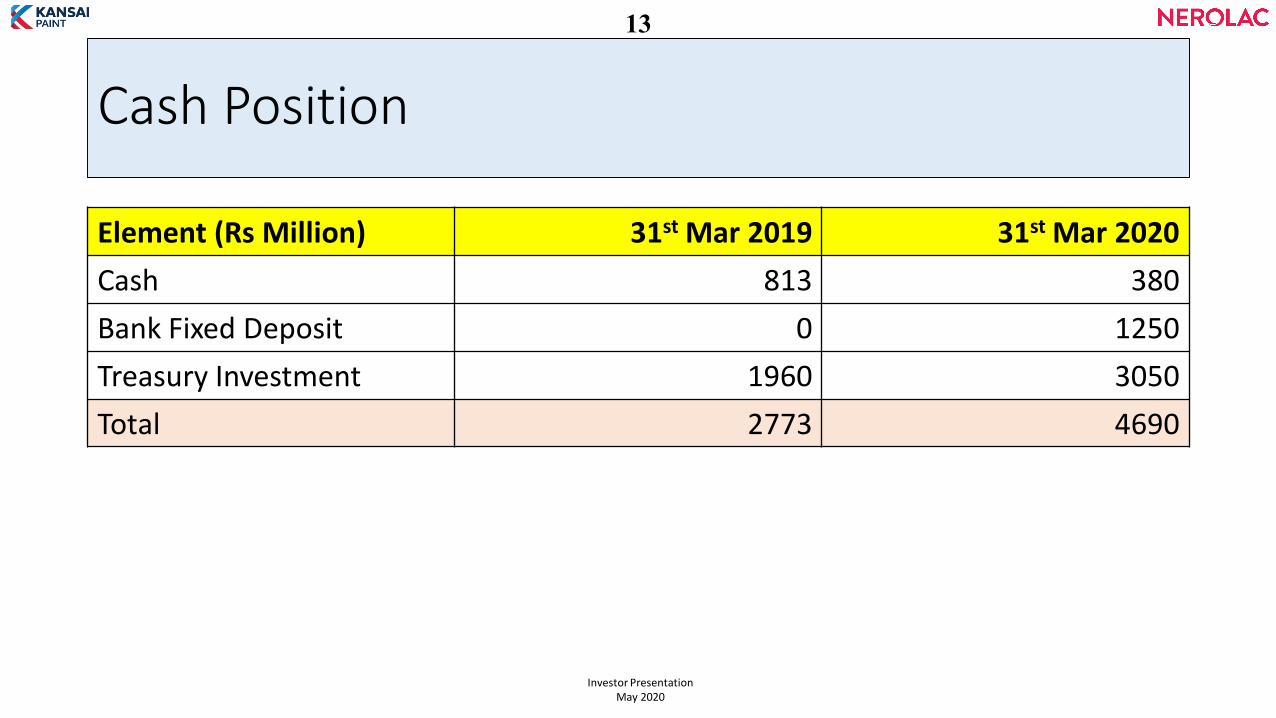
Cash Position
Element (Rs Million) 31st Mar 2019 31st Mar 2020
Cash 813 380
Bank Fixed Deposit 0 1250
Treasury Investment 1960 3050
Total 2773 4690
Investor PresentationMay 2020
13

Dividend
Investor PresentationMay 2020
Financial Year 2017-18 2018-19 2019-20
Dividend % 260 260 315
14

All rights for this presentation are reserved with Kansai Nerolac Paints Limited.
• Business Review FY 2019-20
14
Agenda
15
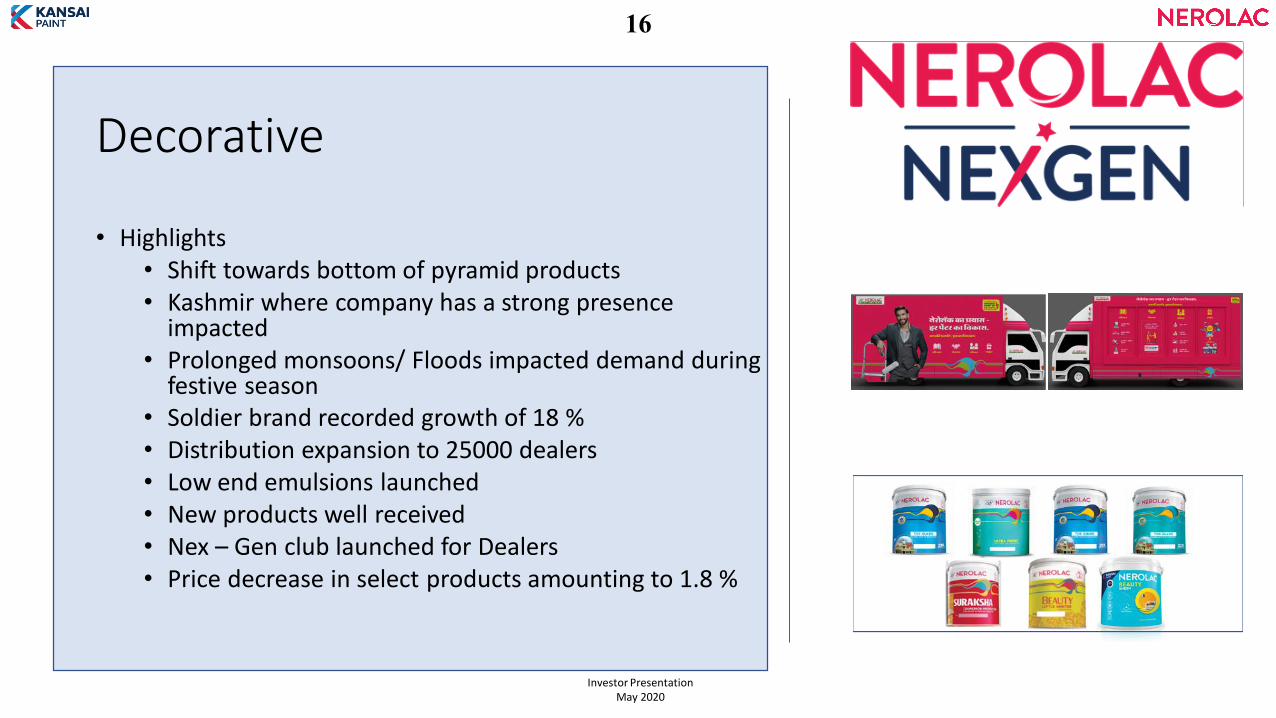
Decorative
• Highlights• Shift towards bottom of pyramid products• Kashmir where company has a strong presence
impacted• Prolonged monsoons/ Floods impacted demand during
festive season• Soldier brand recorded growth of 18 %• Distribution expansion to 25000 dealers• Low end emulsions launched• New products well received• Nex – Gen club launched for Dealers• Price decrease in select products amounting to 1.8 %
Investor PresentationMay 2020
16
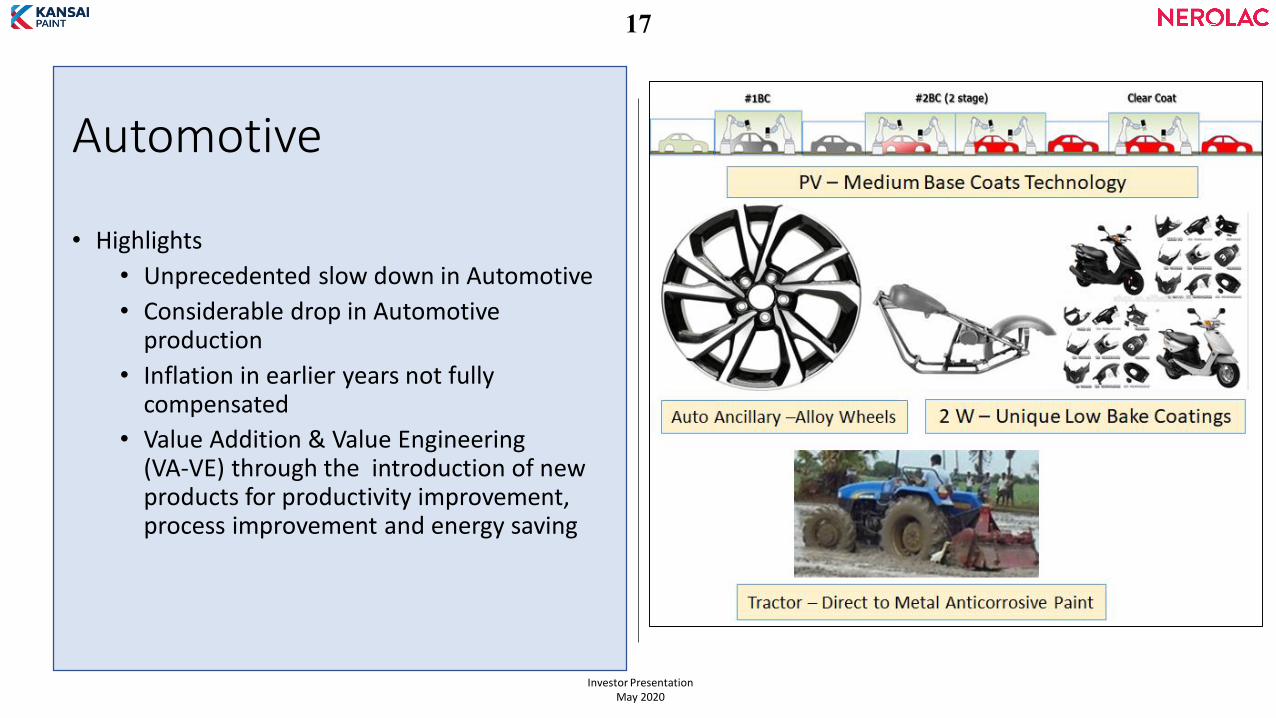
Automotive
• Highlights
• Unprecedented slow down in Automotive
• Considerable drop in Automotiveproduction
• Inflation in earlier years not fullycompensated
• Value Addition & Value Engineering(VA-VE) through the introduction of newproducts for productivity improvement,process improvement and energy saving
Investor PresentationMay 2020
17

Auto Refinish (Aftermarket)
• Highlights
• Business grew by 12 % in value terms
• “Cardea” PU system for Mid tier Retail segmentlaunched
• Approval from Major OEMs
• Training programs for dealerships
Investor PresentationMay 2020
18
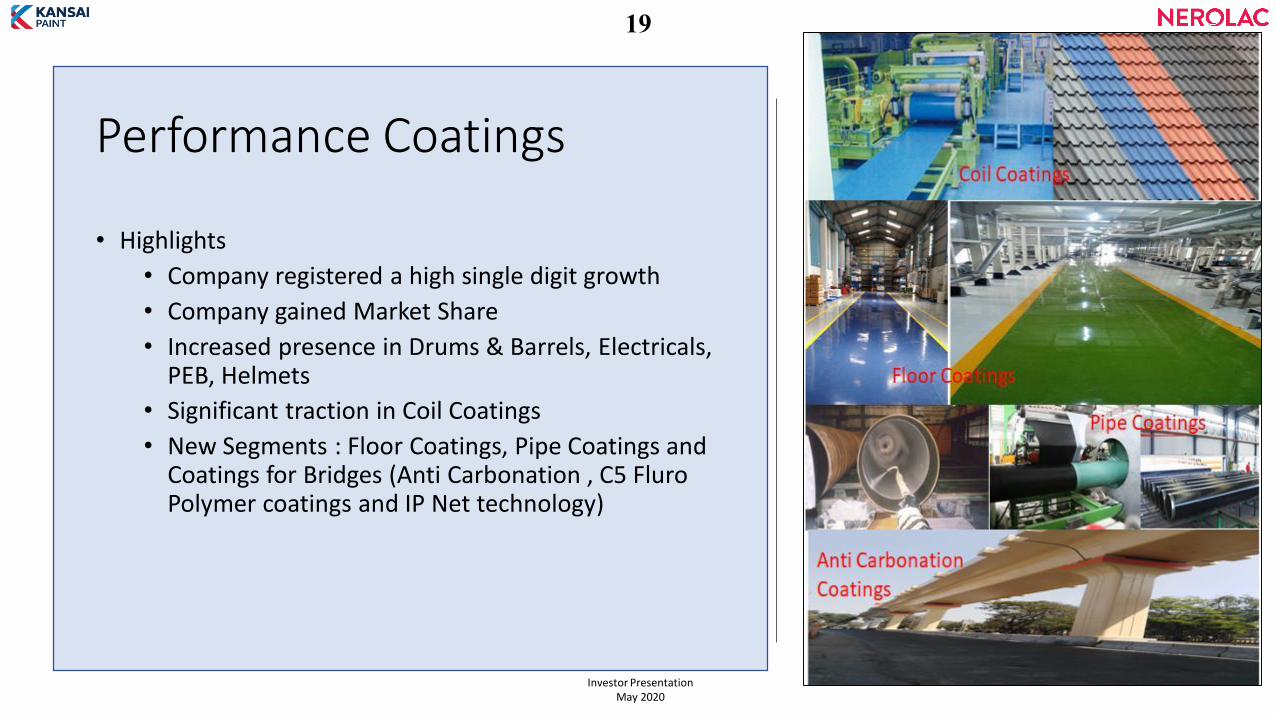
Performance Coatings
• Highlights
• Company registered a high single digit growth
• Company gained Market Share
• Increased presence in Drums & Barrels, Electricals, PEB, Helmets
• Significant traction in Coil Coatings
• New Segments : Floor Coatings, Pipe Coatings and Coatings for Bridges (Anti Carbonation , C5 Fluro Polymer coatings and IP Net technology)
Investor PresentationMay 2020
19

Powder Coatings
• Highlights
• Company gained Market Share
• Increased Presence in Auto Ancillary,Electricals, AC and Furniture
• Entry into Rebar Coating, Pipe Coatings,HR Powders for Auto Components,Bonded Metallic Powders & SuperDurable Powders
Investor PresentationMay 2020
20

Subsidiaries - Domestics
• Marpol (Powders)
• Overall growth at -7.4 %, affected due toslowdown in Automotive which contributessignificantly to the portfolio
• Planned capacity expansion completed forboth powders and Polyester resin for captiveconsumption.
• Capacity of FG increased by 15 % (460 MT)and of resin by 42 % (340MT)
• EBITDA % at 8.7 from 5.2 in the previous year
• Perma (Construction Chemicals)
• Expansion in retail
• Nerolac Perma Range launched
• EBITDA at 9 % from 6.4 %
• Nerofix (Adhesives)
• JV launched in Adhesives with Polygel
• New products launched
• Expansion in Distribution
Investor PresentationMay 2020
21
Subsidiaries – International
• Nepal
• Topline growth of 2 %
• Liquidity crisis
• SAP ERP implemented
• EBITDA at 16.4 % against LY 16.8 %
• Bangladesh
• Topline growth of 20 %
• EBITDA has turned positive and is at 1.8%
• Nerolac range launched in Jan 2020
• Sri-Lanka
• Topline growth of 3.5 %
• Challenging market condition through outthe year
• Changes in Taxation structure
• Company changed its Go-to-market approachwhich has started yielding results
• Brand re-launch as Kansai S-Lon
Investor PresentationMay 2020
22

Capacity
• State of art Digital factory(Goindwal - Punjab)
• Commercial productioncommenced at Goindwal(52.8 M L Annual capacity)
• Company has also commissioned aCED facility at its Saykha Plant,Gujarat (12 M L Annual capacity)
• Brown field projects proceeding onschedule
• Total capacity stands at 518 M L
Investor PresentationMay 2020
23
Strategic Initiatives
• Digital
• Machine Learning app withChatbots based on SAP Leonardoimplemented
• Pilot projects completed for IoT,RPA and Visual Analytics
• New Tie –ups
• Tied – up with ICRO TONE, anItalian Brand for High end Woodfinishes
Investor PresentationMay 2020
24

Transforming key assets
24
Investor PresentationMay 2020
25

New Corporate Identity
Investor PresentationMay 2020
PURPOSE
EXPRESSION
Create Environments for a healthy and beautiful future
Colors that care
PROMISERenew Life
26

Environment -1/2Water Management Waste Management : Haz. Waste reduction
Energy Management:
Carbon Footprint
1.56 1.56
1.49
1.58
1.4
FY 2015-16 FY 2016-17 FY 2017-18 FY 2018-19 FY 2019-20
Specific Water Consumption (SWC) (KL/KL of FG)
Health and Safety
Our recycled water consumptionincreased from 10% to 22% since 2015-16
Focus on Reduction at Source , co processing, recycle and reuse schemes etc
3.12 3.07 2.982.71 2.7
FY 2015-16 FY 2016-17 FY 2017-18 FY 2018-19 FY 2019-20
Specific Hazardous Waste Generation (SHWG) (Kg/KL of FG)
Bio-composting
82% 83%90% 92%
98%
FY 15-16 FY 16-17 FY 17-18 FY 18-19 FY 19-20
% of Process heat & steam from renewable sources
Roof Top Solar Panels Solid Fuel Boiler
• Shifted from HSD to environment friendly and low cost Solid Fuels and Biodiesel in boilers and for process heatgeneration.
• Captive wind turbine at Lote. Renewable Energy now at 23 % from 17% LY• By FY 2021-22, we aim to source 41% of our total energy consumption through renewable energy sources in Mfg.• Additional Solar Power capacity of 900 KW installed at Sayakha.
Sola Tubes Solar Lamps
Solar Battery
ChargersSolar Panels
Move towards Carbon Neutrality
Plants certified with ISO 45001 by an International Certification Agency
ZERO LIQUID DISCHARGE across all plants through installation of Ultrafiltration (UF), Reverse Osmosis (RO) & Multi-effect Evaporator (MEE) treatment systems
Bio-composting
27

Environment -2/2Emission Management
SCOPE 1 EMISSIONS (MT of CO2 eq)
6,886 6,449 5,461 4,111
1,419
FY 15-16 FY 16-17 FY 17-18 FY 18-19 FY 19-20
SCOPE 2 EMISSIONS (MT of CO2 eq)
36,532 38,273
40,228 40,672 36,721
FY 15-16 FY 16-17 FY 17-18 FY 18-19 FY 19-20
In FY 19-20, Scope 1 emissions decreased by 79% as compared to FY 15-16
Also, Scope 1 emission Intensity decreased from 0.026MT of CO2 eq/KL of FG to 0.005 MT of CO2 eq/KL of FG
Decrease in Scope 1 emissions is due to the transition from HSD to environment friendly cleaner fuels in our process
In FY 2019-20, Scope 2 emissions increased by 1% as compared to FY 2015-16
However, Scope 2 emission Intensity decreased by 12 % from 0.140 MT of CO2 eq/KL of FG to 0.123 MT of CO2 eq/KL of FG
Increase in Scope 2 emissions is due to change in base line (Increase in operational footprint)
In FY 2019-20, Scope 3 emissions increased by 9% as compared to FY 2015-16
But, Scope 3 emission Intensity decreased from 0.034 MT of CO2 eq/KL of FG to 0.032 MT of CO2 eq/KL of FG
Increase in Scope 3 emissions is due to the increase in change in base line (Increase in operational footprint and Depot-to-Depot transit of FG)
SCOPE 3 EMISSIONS (MT of CO2 eq)
8,752 9,702
6,242 6,733
9,558
FY 15-16 FY 16-17 FY 17-18 FY 18-19 FY 19-20
In FY 2019-20, total GHG emissions decreased by 9% as compared to FY 2015-16Also, total GHG emission Intensity decreased from 0.20 MT of CO2 eq/KL of FG to 0.16 MT of CO2 eq/KL of FG
Investor PresentationMay 2020
Sustainability disclosures complies to GRI 4.0 guidelines in totality
28

Society
Rural development/Community development(Project Annapurna)
Promoting Education (Near Plants)
Preventive Health Care & Sanitation (Near Plants) Ensuring Environmental Sustainability(Rain Water Harvesting)Investor Presentation
May 2020
29

Governance
Investor PresentationMay 2020
Internal Audit with Focus on Control Efficiency Index (CEI)
Robust Control Index (RCI)
Online Compliance Tracking through Legatrix Software
System enabled Enterprise Risk Management
Governance Compliance Risk
30

All rights for this presentation are reserved with Kansai Nerolac Paints Limited.
• Strategy
30
Agenda
31
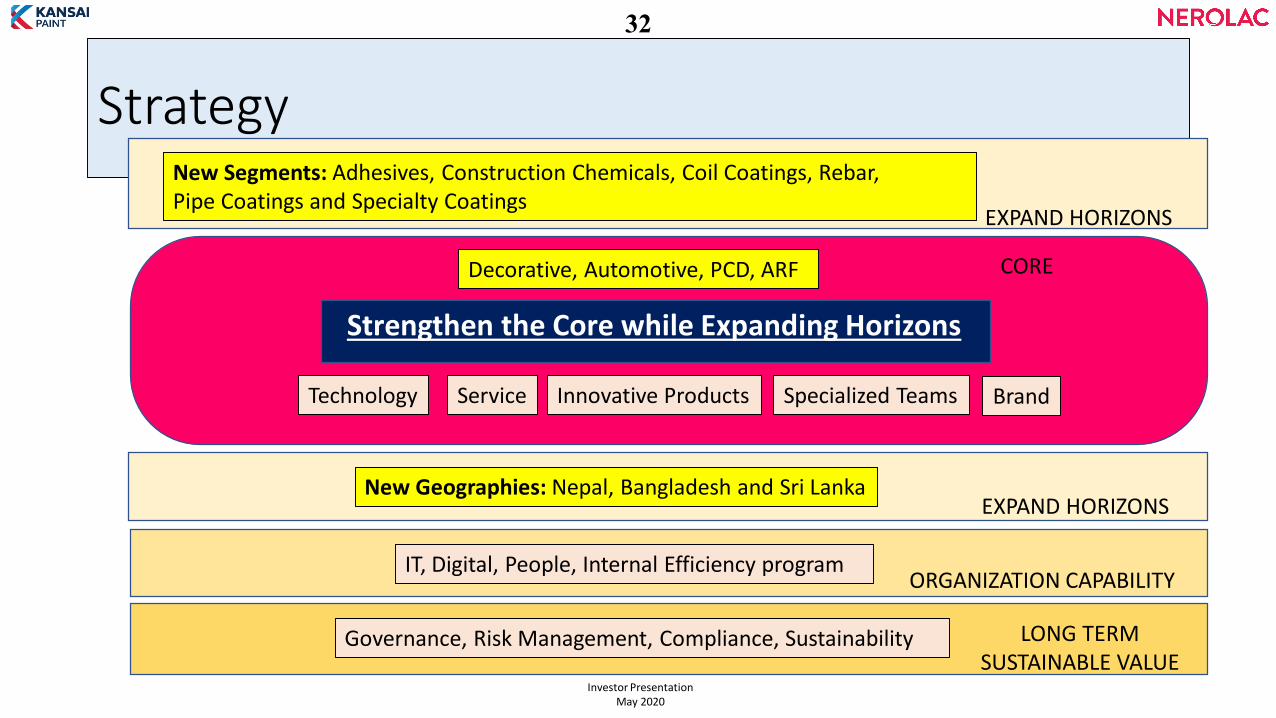
Strategy
Strengthen the Core while Expanding Horizons
Decorative, Automotive, PCD, ARF
Technology Service Innovative Products Specialized Teams Brand
CORE
EXPAND HORIZONS
EXPAND HORIZONS
New Segments: Adhesives, Construction Chemicals, Coil Coatings, Rebar, Pipe Coatings and Specialty Coatings
New Geographies: Nepal, Bangladesh and Sri Lanka
IT, Digital, People, Internal Efficiency program ORGANIZATION CAPABILITY
Investor PresentationMay 2020
Governance, Risk Management, Compliance, Sustainability LONG TERM SUSTAINABLE VALUE
32

ADOPT AND EMBED DIGITAL
VISION
VISION
VISION
VISION
VISION
CREATE DIGITAL ASSETS
AUTOMATION & CONTROL
INTELLIGENCE LAYER
SMART ENTERPRISE
EXPERIENCE LAYER DIGITALIZE LIFECYCLE OF STAKEHOLDERS
DEPLOY AI, ML BASED TOOLS
OUTSIDE IN PERSPECTIVE, PREDICTIVE, VISUAL
AUTOMATE FOR AVAILABILITY & RELIABILITY
INCORPORATE DATA & INFO WITHIN & OUTSIDE
Investor PresentationMay 2020
33
All rights for this presentation are reserved with Kansai Nerolac Paints Limited.
• COVID Risks and Organisation Response
33
Agenda
34

Fall out of Lock down (COVID 19)• Business at stand-still
from Mar 20• April NIL sales
• Factories of KNP have progressivelyopened progressively
• Few of the KNP depots have nowopened
• Security Protocols inplace
• BCP for its Call Center
• Safe shut-downprotocols activated forplants
• WFH protocols activated
Investor PresentationMay 2020
STAGE 1
STAGE 2
STAGE 3
STAGE 1
35
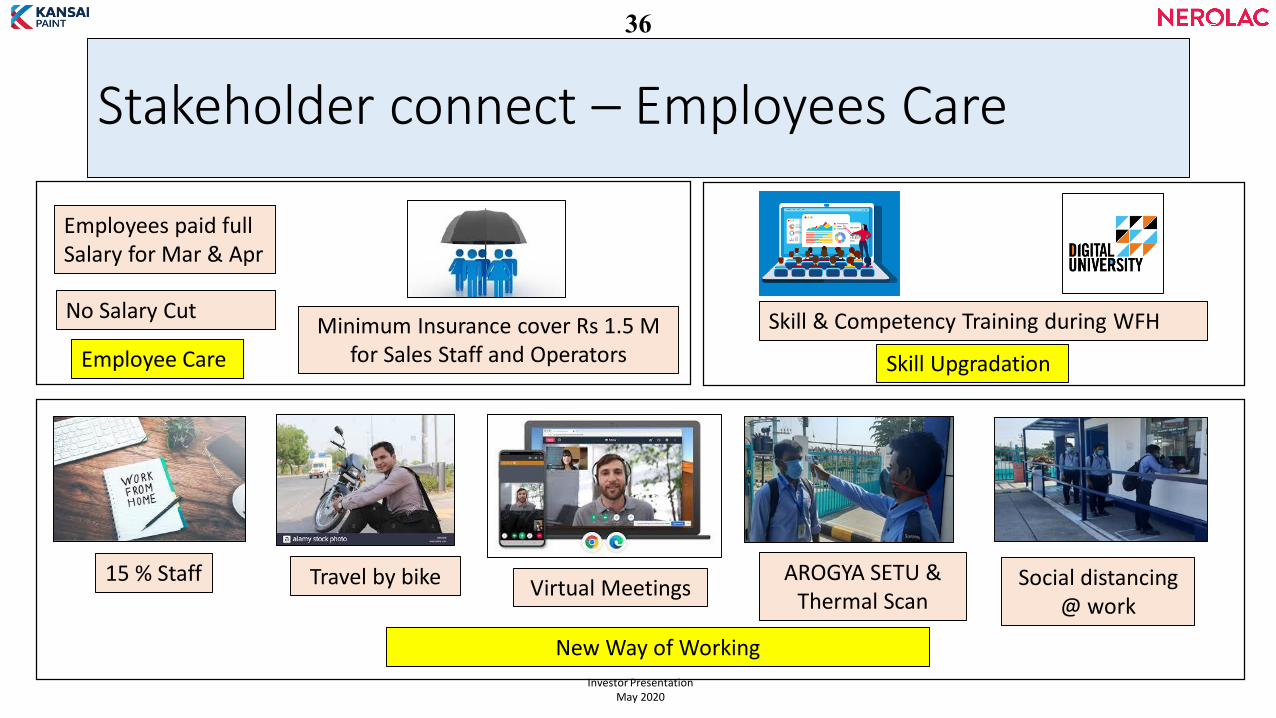
Stakeholder connect – Employees Care
15 % Staff
Employees paid fullSalary for Mar & Apr
No Salary CutMinimum Insurance cover Rs 1.5 M
for Sales Staff and Operators
Skill & Competency Training during WFH
Travel by bike AROGYA SETU & Thermal Scan
Social distancing @ work
Virtual Meetings
Skill Upgradation
New Way of Working
Employee Care
Investor PresentationMay 2020
36
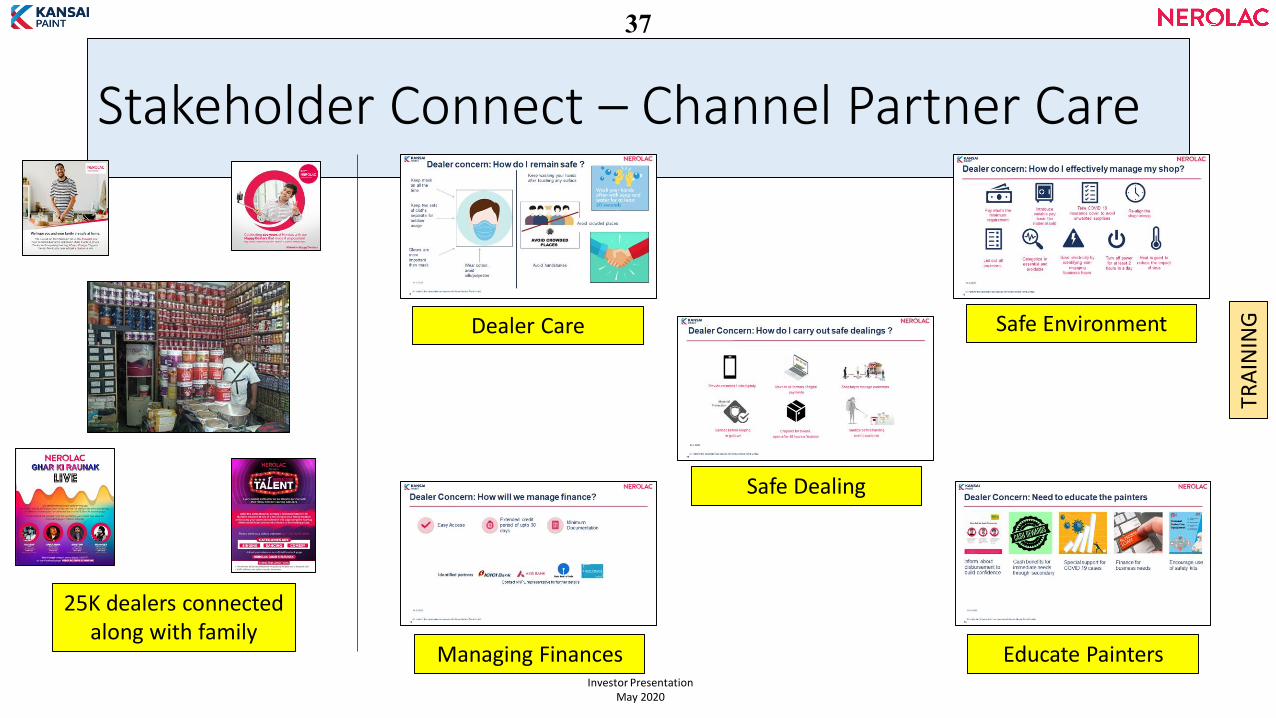
Stakeholder Connect – Channel Partner Care
25K dealers connectedalong with family
Dealer Care Safe Environment
Managing Finances Educate Painters
Safe Dealing
Investor PresentationMay 2020
TRA
ININ
G
37

Stake holder Connect – OEM Care
Safe Shut-down& Safe Start up
Responsive Supply ChainMulti – Plant
supportState of the Art R&D
Investor PresentationMay 2020
38

Stakeholder Connect – Product Care
Stop thumb scanning Sanitize all inward and outward material Sanitizer at all touch points
Safe RM Storage Warehouse and Truck SanitizationSafe Operations Investor Presentation
May 2020
39

Stakeholder Connect – Painter Care
Do’s and Don'ts Painter’s Pitch
Investor PresentationMay 2020
40

Stakeholder Connect – Consumer Care
All KNPL products are Heavy Metal Free
Most products are either low
VOC or Ultra low VOC
First company to take lead in
making products healthier
for its users
Investor PresentationMay 2020
New Product Pipeline
41
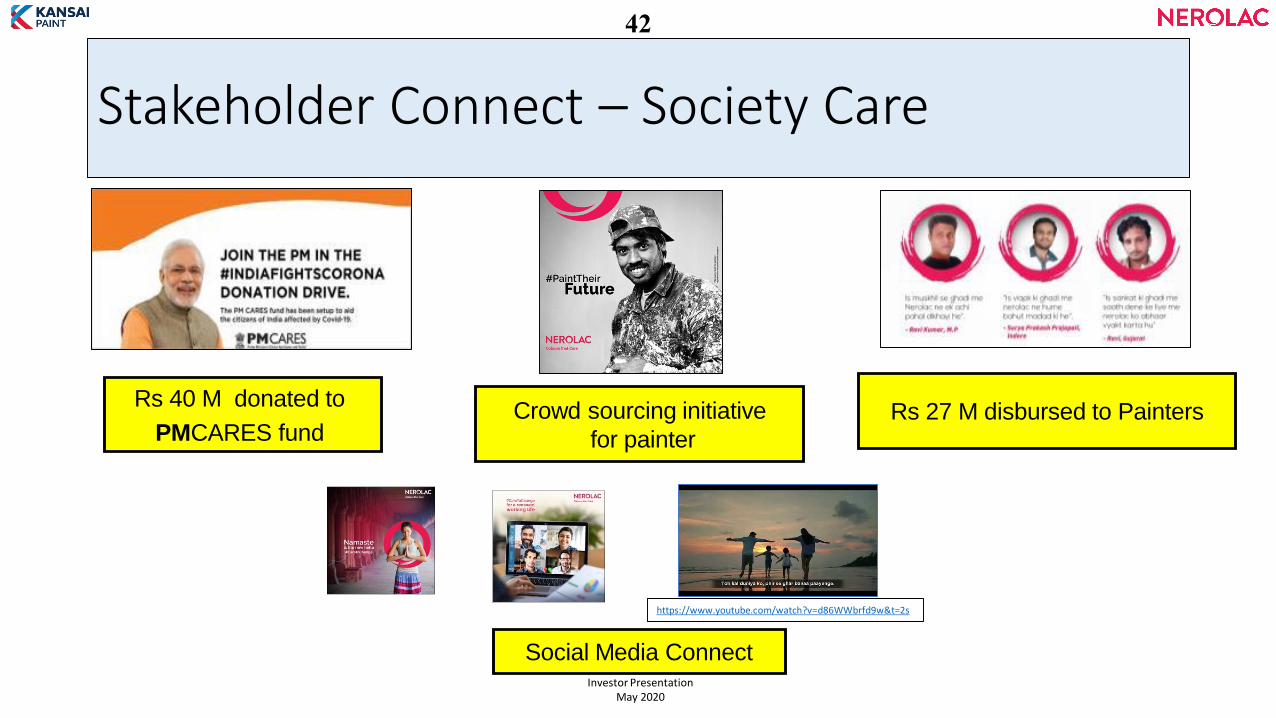
Stakeholder Connect – Society Care
Rs 40 M donated to
PMCARES fund Rs 27 M disbursed to PaintersCrowd sourcing initiative
for painter
Social Media ConnectInvestor Presentation
May 2020
https://www.youtube.com/watch?v=d86WWbrfd9w&t=2s
42
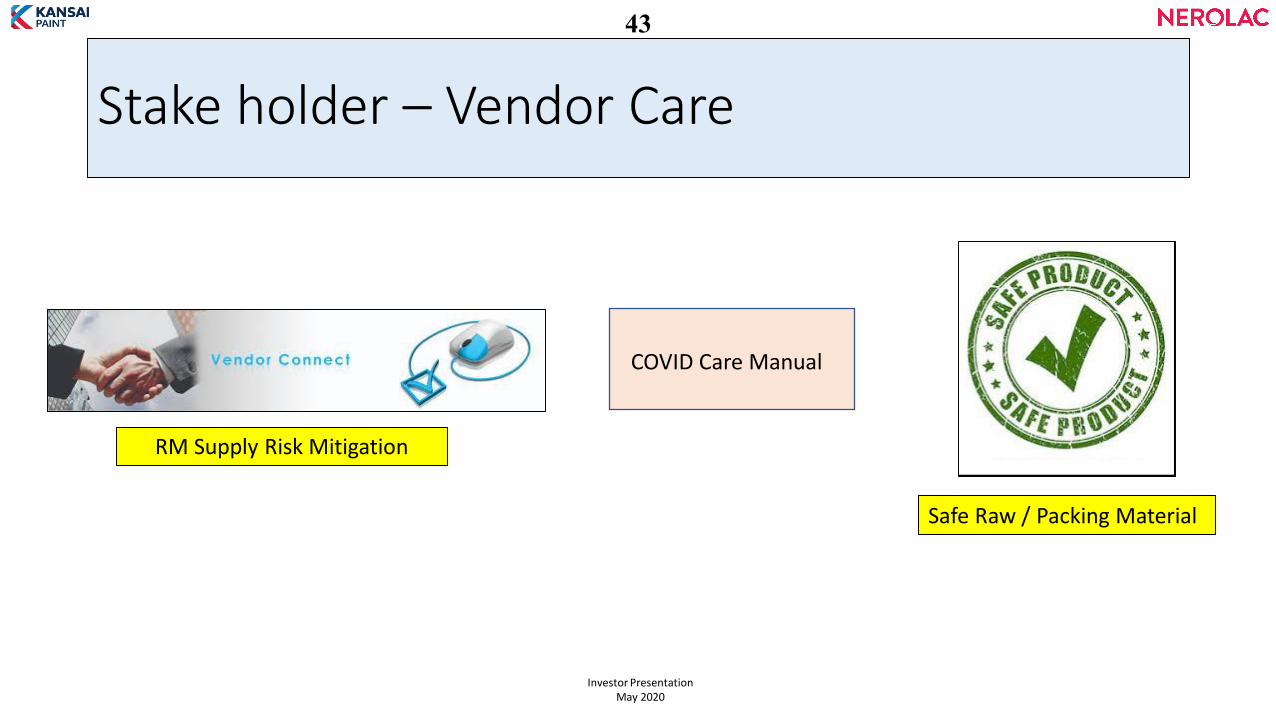
Stake holder – Vendor Care
RM Supply Risk Mitigation
COVID Care Manual
Safe Raw / Packing Material
Investor PresentationMay 2020
43

Stake holder – Shareholder Care
Conserve Cash Mitigate Risk Continuous Stress test
Overhead – ZBB Conserve Cash
Productivity of Assets & People Leverage DigitalInvestor Presentation
May 2020
2019-20 Dividend increased
44
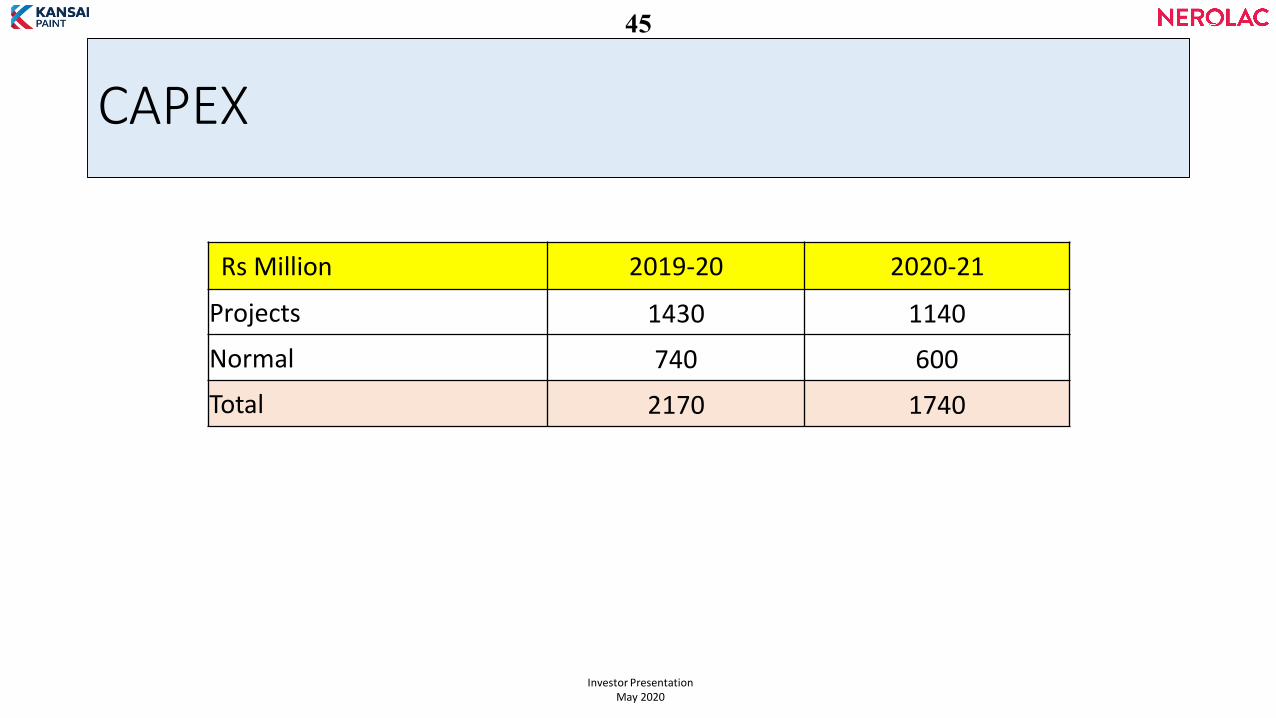
Rs Million 2019-20 2020-21
Projects 1430 1140
Normal 740 600
Total 2170 1740
Investor PresentationMay 2020
CAPEX
45

Operating Model
Focus on Cash Generation
Focus on collections
Optimize Working Capital
Optimize material consumption
Drive productivity & optimize capacity
Sweat assets and Postpone Capex
Safety and Liquidity of investments
Fueling growth
Re-allocate spends to get ROI
Leverage Healthy Home Paints Platform
Re-allocate manpower across portfolios
Reduce non essential spends across
Investor PresentationMay 2020
46

All rights for this presentation are reserved with Kansai Nerolac Paints Limited.
• Thank you
46
47
Top Related