


Languages
Pages
Legal

NATIONAL STATISTICS OFFICE OF GEORGIA
NATURAL RESOURCES OF
GEORGIA AND
ENVIRONMENTAL PROTECTION
2016
STATISTICAL PUBLICATION
TBILISI
2017
STATISTICAL PUBLICATION | 2016
Statistical Publication
Natural Resources of Georgia and Environmental Protection, 2016
Editor: Maia Guntsadze
Vasil Tsakadze
Persons responsible for the publication: Vasil Tsakadze
Nino Kverghelidze
Prepared by: Nino Kverghelidze © National Statistic Office of Georgia, 2017
30, Tsotne Dadiani Str., 0180, Tbilisi, Georgia
Phone/Fax: (+995 32) 2 36 72 10 (500)
E-mail: [email protected]
Web page: http://www.geostat.ge

STATISTICAL PUBLICATION | 2016
Foreword
The present statistical publication, “Natural Resources of Georgia and Environmental Protection” provides
information about use and protection of land, forest and water resources, protected areas, natural hazards and vio-
lations of law related to environemtnal protection. It also presents some methodological explanations and infor-
mation from different scientific sources.
The data given in the publication reflect the main trends in the field of natural resources of Georgia and envi-
ronmental protection activities in 1995-2016.
Notation keys:
... No data - Event does not exist 0.0 Negligible magnitude The discrepancy between the totals and the sum in some cases can be explained by using rounded data. The data in this publication do not cover uccupied territories of Autonomous Republic of Abkhazia and Tskhinvali region.
1 | FOREWORD
STATISTICAL PUBLICATION | 2016
2 | CONTENT
Table of contents
Geographic location and natural resources of Georgia ------------------------------------------------------ 4
1. Land resources ---------------------------------------------------------------------------------------------------- 8
1.1 Land cover by tenure and agricultural land categories -------------------------------------------------- 10
1.2 Sown area of agricultural crops ------------------------------------------------------------------------------- 11
1.3 Agricultural land operated by agricultural holdings according to land use type ------------------- 11
1.4 Non-agricultural land operated by agricultural holdings and its structure --------------------------- 12
2. Forest resources and its protection ------------------------------------------------------------------------ 13
2.1 Forest area --------------------------------------------------------------------------------------------------------- 18
2.2 Forest area of Georgia by regions ---------------------------------------------------------------------------- 18
2.3 Area of Georgia covered by forest---------------------------------------------------------------------------- 19
2.4 Number of employees and operating costs of the National Forestry Agency ---------------------- 19
2.5 Forest and field fires --------------------------------------------------------------------------------------------- 19
2.6 Forest and field fires by regions ------------------------------------------------------------------------------- 20
2.7 Forest restoration ------------------------------------------------------------------------------------------------- 20
2.8 Forest seeding and planting ----------------------------------------------------------------------------------- 21
2.9 Facilitating natural recovery of forest ------------------------------------------------------------------------ 21
2.10 Volume of felled timber ---------------------------------------------------------------------------------------- 22
2.11 Illegal logging ---------------------------------------------------------------------------------------------------- 22
2.12 Export of non-processed timber ----------------------------------------------------------------------------- 23
2.13 Import of non-processed timber ----------------------------------------------------------------------------- 24
3. Protected areas---------------------------------------------------------------------------------------------------- 25
3.1 Structure of protected areas of Georgia --------------------------------------------------------------------- 28
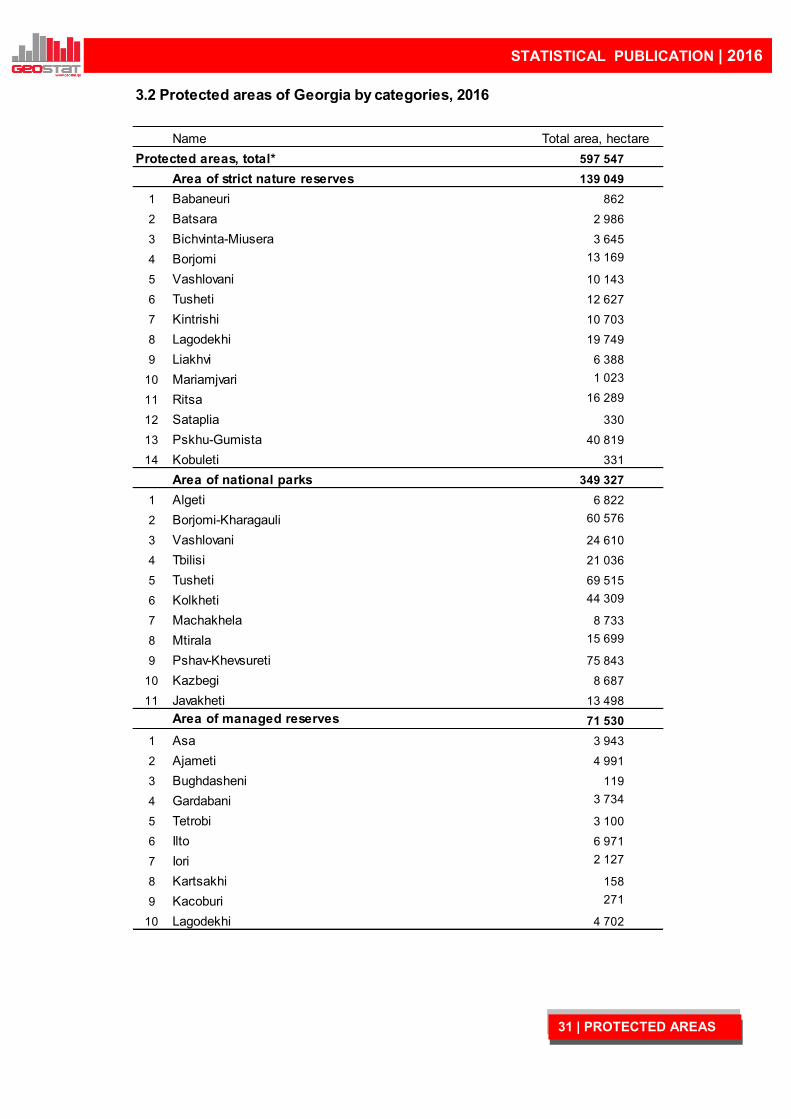
3.2 Protected areas of Georgia by categories ------------------------------------------------------------------ 31
3.3 Area and categories of protected areas of Georgia ------------------------------------------------------ 33
3.4 Number of main animal species preserved in the protected areas ---------------------------------- 34
3.5 Number of main bird species preserved in the protected areas --------------------------------------- 35
3.6 Expenses on the maintenance of protected areas and number of employees -------------------- 36
4. Water resources -------------------------------------------------------------------------------------------------- 37
4.1 Big and medium rivers of Georgia ---------------------------------------------------------------------------- 40
4.2 Main lakes and reservoirs of Georgia ----------------------------------------------------------------------- 41
4.3 Main indicators for water supply industry and wastewater collection -------------------------------- 42
4.4 Main indicators for protection and use of water resources -------------------------------------------- 42
STATISTICAL PUBLICATION | 2016
3 | CONTENT
5. Ambient air protection ------------------------------------------------------------------------------------------ 43
5.1 Number of stationary sources emitting hazardous substances --------------------------------------- 46
5.2 Main indicators of generation of hazardous substances in stationary sources and protection
of atmospheric air------------------------------------------------------------------------------------------------------ 46
5.3 Captured and emitted hazardous substances generated in stationary sources ------------------- 47
5.4 Capture and emission of hazardous substances generated in stationary sources by regions 49
5.5 Captured and emitted hazardous substances generated in stationary sources by cities ------- 51
5.6 Emission of hazardous substances from road transport by type of substances ------------------ 51
6. Natural hazards and violations of law --------------------------------------------------------------------- 52
6.1 Number of occurred geological phenomena (landslide, mudflow), human fatalities and
vulnerable objects ----------------------------------------------------------------------------------------------------- 54
6.2 Number of occurred hydrometeorological hazards ------------------------------------------------------- 55
6.3 Revealed violations of law related to environmental protection by regions and violation
types ---------------------------------------------------------------------------------------------------------------------- 56

STATISTICAL PUBLICATION | 2016
Geographic location and natural resources of georgia
(Brief overview)
Georgia is located in the Central and western part of the South Caucasus. Total length of the border of
Georgia is 2 148 kilometres, out of these 1 839 kilometres on land. To the west Georgia is bounded by the Black
Sea – between the estuary of the river Psou and village Sarpi, to the north – by the Russian Federation, to the
east – by Azerbaijan, to the south – by Armenia, and to the south west - by Turkey. The extreme west and east
borders go through eastern latitude 40°05’ and 46°44’, and north and south borders – through north longitude 41°
07’ and 43°35’.
The territory of Georgia is spread up vertically to 5 068.8 m from sea level (peak Shkhara). Geor-
gia is distinguished with complexity of relief – about 2/3 of its territory is mountainous. Along the north border, more
than 1/3 of the country area is occupied by the Caucasus Mountain System. The relief of Georgia is represented by
high, medium and low mountains, uplands and plains. There are following principal orographic units in Georgia: the
Caucasus Mountains, the intermountain plains divided by Likhi Ridge into Kolkheti and Iveria Valleys and Trialeti
Ridges (part of the Small Caucasus Mountain System). Some of the peaks of the main watershed ridge of the Cau-
casus Mountains in Georgia are higher than 5 000 m.
Georgia is characterized by almost every climate zone existing on the earth, from humid sub
tropical climate to eternal snow and glaciers zone. Diversity of the climate in Georgia is determined by its location
on the northern border of the subtropical zone between the Black and the Caspian Seas on the one hand and by
complexity of its relief on the other hand. Average temperature in January is +3°C (on Kolkheti Valley), and in Au-
gust – +23°C - +26°C. The ridges of various direction and height play an important role in climate formation.
A local climate is determined by the Caucasus Mountains which protects Georgia from cold air masses
incursion and by the Black Sea which makes the temperature moderate and facilitates to greater precipitation, es-
pecially in western Georgia, where annual amount of precipitation is 2 800 mm, while in eastern Georgia it is only
300 mm.
Due to its location on a relatively lower longitude and temperate cloudiness, Georgia receives a significant
warmth form the sun. Average annual sunshine is 1 350 – 2 520 hours.
There are plenty of mineral resources available in Georgia; out of them the following have
industrial importance: oil, coal, non ferrous and rare metals, mining and chemical raw materials, inert materials and
other mines.
Ground waters have a great importance in the mineral treasure of Georgia. They are very
important for development of national economy of the country is highly dependent on the ground water. Georgia is
also rich in thermal waters that can have a wide range of use in agriculture and energy sector.
There is a big amount of fresh ground water resources in Georgia and its total natural debit is 21.7 cuboc
kilometres (23% of the precipitation on the country territory). Its distribution is very non-homogeneous – it increas-
es from the east to the west.
Relief
Climate
4 | BRIEF OVERVIEW
Mineral Resources
Ground Waters

STATISTICAL PUBLICATION | 2016
River network in Georgia is unequally distributed: out of 26 060 rivers with total length of about
60 000 km, 18 109 rivers are in western Georgia, and 7 951 rivers – in eastern Georgia. Length of 25 923 rivers is
less than 25 km, of 121 rivers – about 25-100 km, and of 16 rivers – 100-500 km. The rivers of Georgia belong to
the Black and the Caspian Sea basins. Almost all rivers of eastern Georgia form the entire system of the Kura Riv-
er and flow into the Caspian Sea, while the rivers of western Georgia independently join the Black Sea. The rivers
of Georgia are fed by glaciers, snow, rain and ground waters. Water resources of Georgia are not equally distribut-
ed. Run-off of the rivers of western Georgia (together with transit) compiles 49.8 cubic kilometres, and run-off of
eastern Georgia – 16.5 cubic kilometres. The most voluminous river is Rioni; Mtkvari is much less voluminous, its
run-off near Georgian-Azerbaijan border is 8.3 cubic kilometres. The following rivers - Enguri, Kodori, Bzipi, Tsk-
henistskali, Kvirila, Liakhvi, Aragvi, Ktsia-Khrami, and Alazani - are worth mentioning as well.
There are about 860 lakes in Georgia. Most of them are very small; therefore a total area of the
lakes does not exceed 170 square kilometres (0.24% of the country territory). The lakes of Georgia are remarkable
with their diverse origins. The majority of lakes in Georgia are fresh water, and part of them contains very little salt.
The largest lake in area in Georgia is Lake Paravani, in volume – Lake Tabatskuri, in depth – Lake Ritsa, that it is
the deepest lake in the South Caucasus.
There are 44 reservoirs on the territory of Georgia, their total area is 163 square kilometres,
and the total volume of water is 3 315 million cubic metres.
There are 734 glaciers in Georgia and they all are located in the Caucasus Mountains. Their cumulative
area is 511 square kilometres that is 0.7 % of the country territory.
Wetlands in Georgia are located on the Kolkheti Valley and its total area is 627 square kilometres. Geor-
gia is bounded to the west by the Black Sea. The length of the coastline is 330 km. Within the territory of Georgia
the following rivers flow into the Black Sea: Rioni, Bzipi, Kodori, Enguri and Chorokhi.
Winter is mild and warm on the coast of the Black Sea. An average temperature in January is + 4-7°C.
The amount of precipitation is large during all seasons; South part of Kolkheti is especially rainy, where the annual
precipitation is more than 2 500 mm.
An average value of surface layer salinity of water in an open sea fluctuates from 17.80/00 (in spring) to
18.30/00 (in winter). From the surface to the depth of 200 metres the salinity increases up to 21.3
0/00. Rivers of
Georgia make the sea significantly fresher near the coast, especially in spring and in the first half of summer. How-
ever, water stays salty beyond 2-4 miles from the coast.
Due to diversity of physical-geographic and climatic conditions, the flora of Georgia is very rich
and miscelanous. Diversification of relief and complex configuration of mountain ringes caused geographic and
ecological isolation of ecosystems in Georgia and high level of local endemism. There are preserved some species
in Georgian flora that became extinct in west Eurasia million years ago.
There is a rich and diverse fauna in Georgia, mainly represented by the elements of sub district
of Mediterranean Sea of Pale arctic district, but in north part of the country the representatives of European and
Siberian sub districts are also frequently met, while in south east district – species of Central Asian sub district fau-
na or others similar to them.
Rivers
5 | BRIEF OVERVIEW
Lakes
Reservoirs
Flora
Fauna
STATISTICAL PUBLICATION | 2016
There are around 100 mammal species, more than 330 bird species, about 48 reptile species, 11 amphibi-
an species, and 160 fish species known in Georgia. Thousands of invertebrate species are met, but an exact num-
ber is not determined yet. Animals are distributed by zones, but the species with a great ecologic valence inhabit in
several zones.
The idea about necessity of nature protection in Georgia was formed in ancient past followed by a gradual
development of legal norms. Old Georgian sources provide interesting information concerning a legal protection of
single objects of nature. “The forest guards” are mentioned in the Book of King Tamar, dated 1189, and “the senior
guardians” are mentioned even earlier in 1078. Norms regulating the use of water and pastures are provided in the
document of the XVIII century (“Dasturmali”). One of the articles of this document protects hawks’ and peregrines’
nests. King Vakhtang’s Book of Laws also takes into account protecting water, forest and pastures. In Ioane Bagra-
tioni’s Book of Laws (the project of public reforms in Kartl-Kakheti Kingdom) the following is mentioned: “there
should be a person responsible for hunting forests and fields; nobody can hunt in the royal hunting lands without
their permission”. Hunting was prohibited in a reproduction period of birds and animals.
6 | BRIEF OVERVIEW

STATISTICAL PUBLICATION | 2016
Definition of terms
Atmosphere The gaseous mass or envelope surrounding the earth or any other celestial body.
Climate The meteorological conditions, including temperature, precipitation, and wind that
characteristically prevail in a particular region.
Debit Amount of liquid or gas, which is generated by the source in a given amount of
time.
Ecology Social science, studies interrelations of human and nature and technical economic
aspects of mentioned process.
Endemic A plant or animal peculiar to a particular geographic area.
Fauna Animal life. Animals, characteristic of a region, period, or special environment.
Flora All the plants that live in a particular area, time, period, or environment.
Genesis The origination.
Hydrosphere The aqueous envelope of the earth (oceans, seas, lakes, rivers).
Meteorite A stony or metallic mass of matter that has fallen to the earth surface from cosmic
space.
Mile A unit of length, employed mainly for marine navigation. The International Nautical
Mile equals to 1.85 km.
Phitocenosis Unity of such plants that grow together and have close relations with one another
and environment. A plant community.
Photosynthesis The process by which a green plant turns water and carbon dioxide into food when
the plant is exposed to light.
Promile, 0/00 A tenth of a percent or one part per thousands.
Radiation Emission of electromagnetic energy by a particular body.
7 | TERMINOLOGY
STATISTICAL PUBLICATION | 2016
1. LAND RESOURCES1. LAND RESOURCES
8 | LAND RESOURCES

STATISTICAL PUBLICATION | 2016
Land resources play an important role in human life and activities. While using the land, man uses its
chemical, physical and biological features. Thus, final result of the land cultivation – harvest - depends on thick-
ness of the fertile layer, its mechanical composition, availability of chemical substances, i.e. soil fertility. Land
represents the territorial-spatial basis in industrial activities (except the mining industry), in construction and infra-
structure sectors.
Land is one of the main national wealth that needs special care and protection; almost half of natural
wealth of Georgia counts on soil.
Georgia is a highland country. Lowland zone covers only 46% of the country territory. The land re-
sources are characterized by a high level of agricultural utilization and high natural fertility of arable lands. Terri-
torial distribution of lands in Georgia, similarly to other components, is subject to the rule on vertical zoning:
I zone (up to 250 m above sea level) – mainly characterized by sub tropical cultures of western Georgia.
II zone (250-500 m) – area of horticulture, viticulture, market-gardening and intensive field activities.
III zone (500-1 000 m) – dominates cereals, arable lands, and animal husbandry.
IV zone (1 000-1 500 m) - grasslands; field activities are weakly developed;
V zone (1 500-2 000 m) – mainly grasslands.
VI zone (above 2 000 m) – agriculture does not exist.
The territory of Georgia can be divided into three parts according to utilization types:
1. Agricultural land – 15.8%;
2. Natural – farming area (forest, shrubbery, hay pastures) – 70.6%;
3. Land not used in agriculture – 13.6%.
Agricultural land id subject to permanent changes in structure and quality, determined by cultivating new
areas, intensive melioration activities, and others. Moreover, erosion processes, land salinity or bogging or flood-
ing and other unfavourable conditions cause decreasing the size of agricultural land and worsening its quality.
Thus, land resources are under permanent quantitative and qualitative changes.
9 | LAND RESOURCES

STATISTICAL PUBLICATION | 2016
10 | LAND RESOURCES
To
tal
are
a
N
on
-ag
ricu
ltu
ral
lan
d
A
gri
cu
ltu
ral
lan
d
Ara
ble
land
Perm
anent
cro
ps
Meadow
s
Pastu
res
Resid
ential or
farm
ing
facilitie
s a
nd y
ard
s
7 628.4 4 602.6 3 025.8 801.8 263.8 143.8 1 796.6 19.8
948.9 181.6 767.3 438.5 180.5 44.0 84.5 19.8
6 679.5 4 421.0 2 258.5 363.3 83.3 99.8 1 712.1 -
2 822.3 650.2 2 172.1 358.8 76.1 92.7 1 644.5 -
3 857.2 3 770.8 86.4 4.5 7.2 7.1 67.6 -
88.4 86.8 1.6 0.4 0.7 - 0.5 -
300.7 285.1 15.6 0.1 0.1 1.1 14.3 -
2 456.2 2 400.3 55.9 2.8 6.1 5.1 41.9 -
171.9 159.1 12.8 1.2 0.3 0.9 10.4 -
4.9 4.9 - - - - - -
835.1 834.6 0.5 - - - 0.5 -
Note: * Including inland waters and occupied territories of Autonomous Republic of Abkhazia and Tskhinvali region.
1.1 Land cover by tenure and agricultural land categories
(On April 1, 2004)
Thousand hectare
Forest
Settlements
Protected areas
Non-agricultural
Agricultural organizations
Total area*
State land
Source: State Department for Land Management of Georgia.
Religious organizations
Water (including inland waters)
Industry, transport,
communications, radio
broadcasting, TV, other media,
energy, defence and other
Private land
STATISTICAL PUBLICATION | 2016
11 | LAND RESOURCES
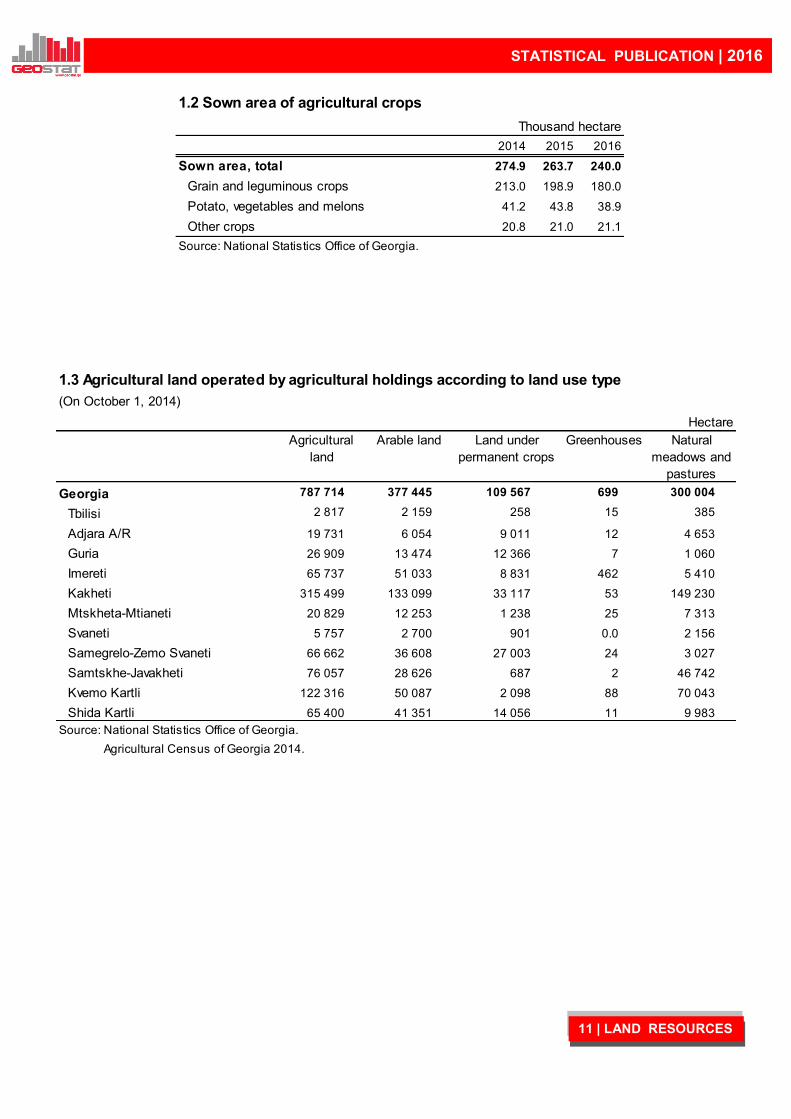
2014 2015 2016
Sown area, total 274.9 263.7 240.0
Grain and leguminous crops 213.0 198.9 180.0
Potato, vegetables and melons 41.2 43.8 38.9
Other crops 20.8 21.0 21.1
Thousand hectare
Source: National Statistics Office of Georgia.
1.2 Sown area of agricultural crops
Hectare
Agricultural
land
Arable land Land under
permanent crops
Greenhouses Natural
meadows and
pastures
Georgia 787 714 377 445 109 567 699 300 004
Tbilisi 2 817 2 159 258 15 385
Adjara A/R 19 731 6 054 9 011 12 4 653
Guria 26 909 13 474 12 366 7 1 060
Imereti 65 737 51 033 8 831 462 5 410
Kakheti 315 499 133 099 33 117 53 149 230
Mtskheta-Mtianeti 20 829 12 253 1 238 25 7 313Racha-Lechkhumi and Kvemo
Svaneti 5 757 2 700 901 0.0 2 156
Samegrelo-Zemo Svaneti 66 662 36 608 27 003 24 3 027
Samtskhe-Javakheti 76 057 28 626 687 2 46 742
Kvemo Kartli 122 316 50 087 2 098 88 70 043
Shida Kartli 65 400 41 351 14 056 11 9 983
1.3 Agricultural land operated by agricultural holdings according to land use type
Source: National Statistics Office of Georgia.
(On October 1, 2014)
Agricultural Census of Georgia 2014.
STATISTICAL PUBLICATION | 2016
12 | LAND RESOURCES
Hectare
Non-
agricultural
land
Buildings and
yards
Woodland Reservoirs for
aquaculture
Other non-
agricultural
land
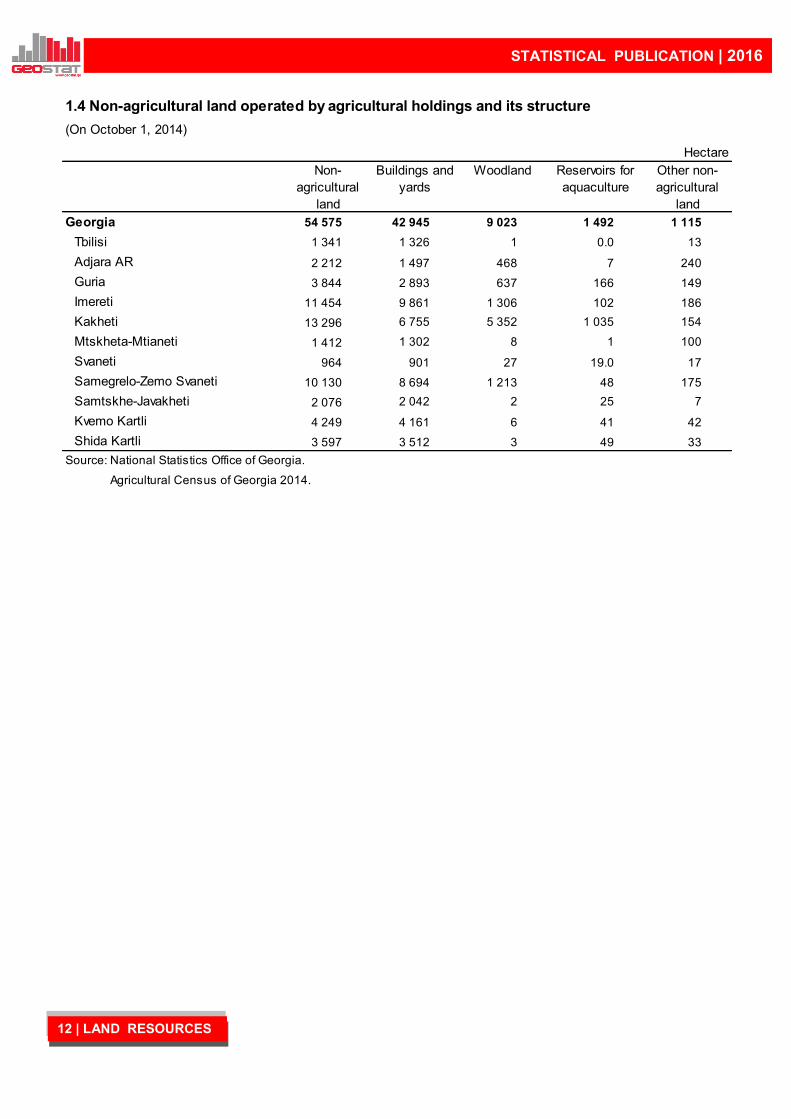
Georgia 54 575 42 945 9 023 1 492 1 115
Tbilisi 1 341 1 326 1 0.0 13
Adjara AR 2 212 1 497 468 7 240
Guria 3 844 2 893 637 166 149
Imereti 11 454 9 861 1 306 102 186
Kakheti 13 296 6 755 5 352 1 035 154
Mtskheta-Mtianeti 1 412 1 302 8 1 100Racha-Lechkhumi and Kvemo
Svaneti 964 901 27 19.0 17
Samegrelo-Zemo Svaneti 10 130 8 694 1 213 48 175
Samtskhe-Javakheti 2 076 2 042 2 25 7
Kvemo Kartli 4 249 4 161 6 41 42
Shida Kartli 3 597 3 512 3 49 33
1.4 Non-agricultural land operated by agricultural holdings and its structure
(On October 1, 2014)
Source: National Statistics Office of Georgia.
Agricultural Census of Georgia 2014.

STATISTICAL PUBLICATION | 2016
2. FOREST RESOURCES AND2. FOREST RESOURCES AND
ITS PROTECTIONITS PROTECTION
13 | FOREST RESOURCES

STATISTICAL PUBLICATION | 2016
Forest is one of the important components of the biosphere. Forest area is 4.1 billion hectares in the world,
i.e. about half of the total land cover. World reserve of wood is around 360 billion cubic metres, and annual growth
– 3 200 million cubic metres. There are about 30 000 species of timber and shrubs, and thousands of bird and ani-
mal species. According to modern understanding, forest is a part of geographic landscape, unity of trees, bushes,
grass, animals, birds and micro organisms which are biologically interconnected in the process of their develop-
ment and affect one another and environment.
A quantitative accumulation of wood species creates new qualitative features in a forest. This ecological
complex has significant and versatile impact on the environment. A forest differs from parks and gardens since the
trees in a forest create a specific functional interconnections.
There are several tiers in a forest that are developed according to the species composition, the biological
features of the basic plants, their age and the particular physical geographic conditions. In complex forests of mod-
erate zone the following tiers are identified: the first one consists of trees that develop first value forest (pine,
spruce, fur, beech, oak, etc.); the second one is developed by second value trees (lime, maple, hornbeam, elm,
etc.); the third or under wood one is composed by bushes (nut, cornel, hawthorn and so on, etc.); the fourth and
fifth ones consist of grass and moss cover. One can meet climbing plants and mosses, mushrooms and algae on
the branches in the different tiers of forest.
Forests become non-homogenous on a relatively big territory. Forests differ in species composition (pure –
of one species or mixed – composed with several species), form (simple – one tier and complex – multi tier), age
(one aged and various aged), origin (seeds and vegetation), frequency, productivity, etc.
The species composition and ecological features of forest vegetation change sharply according to the geo-
graphic longitudes, i.e. horizontal zones.
Georgia is a highland country, thus almost all forest (97.7%) are located on the mountain slopes. In west-
ern Georgia forests begin from sea level and cover lowlands and foothill slopes up to 500 m above sea level. In
lowland swampy areas we meet willow, poplar in some places Imeretian oak, ash and beech; Elevated places and
foothills are covered by Colchis forests. In under wood rhododendron, bilberry, etc. are growing. There are lots of
climbing plants as well.
On lowlands and foothill slopes of dry regions of eastern Georgia (Shiraki, Eldari, Mtskheta, etc.), up to 400
– 600 m above sea level light forests are spread, mostly composed of Georgian maple, pomegranate, pistacia, ju-
nipoerus, etc. In lower zone of mountains (from 500 m to 900 – 1 000 m) there are oak and chestnut forests.
Chestnuts are met in both eastern (Kakheti) and western Georgia. On lime soils of western Georgia and dry dis-
tricts of eastern Georgia (Kartli, Gare Kakheti) oaks and hornbeams are spread instead of chestnuts. Medlar, haw-
thorn, cornel, nuts, etc. grow in lower zone of mountains. In middle zone of mountains (from 900 m – 1 000 m to 1
500 m– 1 600 m) beech is growing in some cases purely and in some cases mixed with hornbeam, field maple,
lime, spruce, etc.
In Georgia one cannot find the beech zone only in Samtskhe-Javakheti, here it is replaced by spruce, fir
and pine. High zone of mountain is represented by dark coniferous forests. In western Georgia it begins from 1 400
m and often reaches high margin of forest distribution. These forests are composed with the Eastern spruce and
Caucasian fir, that form multiaged, highly productive, diverse pure and mixed zones. Beeches, elms, limes as well
as pines are also growing here. Great number of pines is also distributed in the mountainous part of Tusheti, Mes-
kheti and Trialeti ridge. In the districts where there are no spruces and firs (Gare and Shida Kakheti) beeches are
14 | FOREST RESOURCES

STATISTICAL PUBLICATION | 2016
spread. Upper zone of mountain (from 1 900 m – 2 100 m to 2 400 m) is covered by subalpine forests. Crooked
forests that are spread in all districts are mainly presented by birches and beeches. Subalpine light is more typical
for western Georgia and is composed with highland maple, highland oak.
Forest is a global and vital factor for the entire ecological system of the earth. It is one of the live substance
accumulators on our planet, as it retains a large amount of chemicals and water in the biosphere. A forest actively
interrelates with the troposphere and determines the level of oxygen and carbon balance. Land vegetation and its
main component – forest, provide more than 60% of the oxygen in the biosphere. One hectare mixed forest ab-
sorbs 13-17 tons of carbon dioxide and generates 10-15 tonnes of oxygen. Forest is the most productive formation
of our planet and is characterised by the highest intensity of the biological circle. A biomass accumulated in the
forest considerably exceeds the biomass of grass and other vegetations. Annual growth of one hectare forest
phitomass is 10-30 tonnes on average, of vegetation – 9 tonnes and of tundra – 2 tonnes.
Forest has various functions: forest is a strong accumulator of the solar energy. It has a significant influ-
ence on climate formation, on water turnover in nature, and air circulation in the atmosphere; thus, forest ensures
the conditions necessary for human life. The starting point of this circle is the process of photosynthesis that gener-
ates oxygen. While in 30-50s forest was generating just 30% of planet’s oxygen, now forest provides 60% of bio-
logically active oxygen, the rest is supplied by marine and oceanic plankton, and field and garden plants. Oxygen
generated by a forest is qualitatively different from marine and ocean oxygen, since it is full of negative ions. This
significantly increases biological features of forest, since a positive influence of negative ions on the human organ-
ism is proved by scientists. Ionization of forest oxygen is 2-3 times more than marine one and 5-10 times more
than ionization of urban atmosphere.
Forest cleans the air form dust. One hectare forest filters 50-70 tonnes of dust annually, and consequently
forests of Georgia filter about 135-190 million tonnes of dust.
Forest regulates intensity of snow melting, significantly reduces speed of air circulation and protects useful
fauna and microorganisms. A lot of forest plants restrain disease-causing organisms and make the environment
healthier. Forest is a powerful sanitary factor that ensures human life and health.
Water protecting function of forest is very important. It facilitates normal and equal supply of water to the
rivers and other water resources (lakes, springs, etc.), prevents floods, improves water quality and protects it from
pollution. The role of forest is also important for increasing the soil fertility and protecting it from water and wind
erosion. A majority of the arable lands are located in unstable and insufficient humidity zones. A protective forest
planting belongs to the activities directed against draught and erosion. Forest is distributed on all continents, ex-
cept Antarctica. In the past times forest was spread over a larger area, part of which was later occupied by agricul-
tural lands, cities and industrial complexes.
Forest is a source of many resources: timber, bark, branches, leaves, fruit, seeds, mushrooms, etc. It is
widely used in industry and other sectors. Forest is one of the biological resources that have regeneration ability. It
has biochemical function, participates in formation of diverse landscapes, has a great water preserving, soil pro-
tecting, climate regulating and sanitary hygienic importance; thus, protection of forest and its rational use has a
great economic and vital importance.
15 | FOREST RESOURCES

STATISTICAL PUBLICATION | 2016
The main purpose of the forestry is meeting the demand for forest products of national economy and popu-
lation, without exhausting the forest resources. This problem should be solved without reducing the forest area,
preserving forest productivity, and protecting its environmental, sanitary-hygienic and other useful characteristics.
Forestry, as a production sector, has a peculiarity – a significantly long period of forest growth. One turnover of
forestry takes as much time as necessary for 80 – 150 turnovers of agriculture. Changes in the forestry are basical-
ly unnoticeable for one generation.
Forest is a renewable natural resource – in case of a rational use, it retains and improves its natural fea-
tures and ensures a proper change of generations. A miscellaneous importance, the length of growth, and the
need for a rational use of forest determine specificity of relations between human and forest. Timber logging should
be done carefully in order to encourage development of highly productive forests.
Lack of adequate road infrastructure hinders proper logging in Georgia. Road construction in mountainous
regions is very expensive, thus agencies interested in a complex utilization of highland areas should cooperate.
Protecting forests from fire has a great ecological importance – fire destroys young trees and burns vege-
tation; this of course worsens physical – chemical, water preserving, and soil protecting features of soil. Danger of
wind and water erosion also increases. In the past wildfire was quite frequent in Georgia and was spread on large
areas. For example, there was a strong forest fire in 1884, named “Gujareti”. It covered 30 thousand hectares of
forest from Tsaghvery-Bakuriani to ravine of the River Tana. The wildfire was active for several months, population
of Kartli and the military forces were mobilized for its localization. Implementation of forestry activities is very im-
portant for fighting against forest fires. Fire brigades should be organized and properly equipped, public awareness
should be improved concerning these issues.
16 | FOREST RESOURCES
STATISTICAL PUBLICATION | 2016
Definition of terms used in tables
Forest Part of geographic landscape which consists of trees, land, bushes, grass,
animals and others that belong to forest according to legislation and that are
biologically connected and have an impact on one another and on the envi-
ronment.
Area covered by
forest
Area of 0.3 hectare and more, covered with trees higher that 2 meter or with
bushes higher than 1.5 meter. Their canopy should cover 30 percent or more
of the total area.
Forest restoration Forestry related activity that aims at forest restoration on the areas of forest
not covered by trees . Forest restoration activities include forest planting and
seeding, as well as facilitating its natural recovery.
Facilitating natural
recovery of forest
Set of activities that facilitate natural recovery of forest: fencing the forest
areas with a purpose of protecting the trees from livestock grazing, treating
natural growing, etc.
Forest area Set of state forest, its land, forest under other types of ownership and their
resources. Forest area consists of areas covered by forest and areas not
covered by forest. The last includes fields, meadows, pastures, swamps,
cliffs, glaciers, etc.
Timber felling Removing trees and shrubs from natural environment of forest.
Illegal logging Felling the trees without permission.
Operational
expenses of the
National Forestry
Agency
Expenditures on operation of the National Forestry Agency, such as: forest
arrangements, forest restoration, development of forest protection lines, pro-
tecting forest form fire, pests, diseases, etc. as well as expenses on the of-
fice of the agency.
17 | TERMINOLOGY
STATISTICAL PUBLICATION | 2016
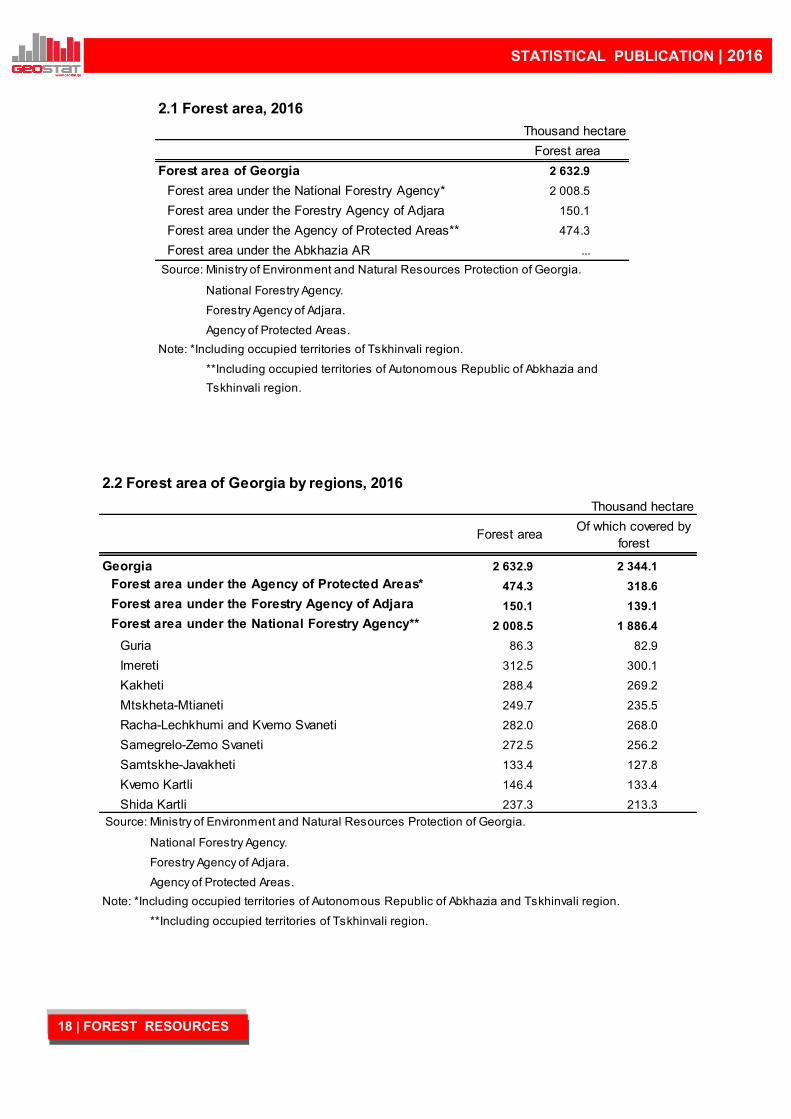
18 | FOREST RESOURCES
Thousand hectare
Forest areaOf which covered by
forest
Georgia 2 632.9 2 344.1
Forest area under the Agency of Protected Areas* 474.3 318.6
Forest area under the Forestry Agency of Adjara 150.1 139.1
Forest area under the National Forestry Agency** 2 008.5 1 886.4
Guria 86.3 82.9
Imereti 312.5 300.1
Kakheti 288.4 269.2
Mtskheta-Mtianeti 249.7 235.5
Racha-Lechkhumi and Kvemo Svaneti 282.0 268.0
Samegrelo-Zemo Svaneti 272.5 256.2
Samtskhe-Javakheti 133.4 127.8
Kvemo Kartli 146.4 133.4
Shida Kartli 237.3 213.3
National Forestry Agency.
Forestry Agency of Adjara.
Agency of Protected Areas.
Note: *Including occupied territories of Autonomous Republic of Abkhazia and Tskhinvali region.
2.2 Forest area of Georgia by regions, 2016
**Including occupied territories of Tskhinvali region.
Source: Ministry of Environment and Natural Resources Protection of Georgia.
Thousand hectare
Forest area
Forest area of Georgia 2 632.9
Forest area under the National Forestry Agency* 2 008.5
Forest area under the Forestry Agency of Adjara 150.1
Forest area under the Agency of Protected Areas** 474.3
Forest area under the Abkhazia AR ...
National Forestry Agency.
Forestry Agency of Adjara.
Agency of Protected Areas.
Tskhinvali region.
Source: Ministry of Environment and Natural Resources Protection of Georgia.
2.1 Forest area, 2016
Note: *Including occupied territories of Tskhinvali region.
**Including occupied territories of Autonomous Republic of Abkhazia and

STATISTICAL PUBLICATION | 2016
19 | FOREST RESOURCES
2000 2.77 39.7
2005 2.77 39.7
2010 2.77 39.7
2015 2.71 38.9
2016 2.69 38.6
Source: Ministry of Environment and Natural Resources Protection of Georgia.
Note: * Including occupied territories of Abkhazia AR and Tskhinvali regions.
National Forestry Agency.
Forestry Agency of Adjara.
Agency of Protected Areas.
2.3 Area of Georgia covered by forest
Year Percentage share in the
country territoryArea, million hectare
Area covered by forest*
1995 2000 2005 2010 2015 2016
Number of Employees (thousand persons) 3.5 7.4 2.0 0.7 1.0 1.0
Operating costs (thousand GEL) 2 081 940 3 237 6 574 15 529 17 345
National Forestry Agency.
1995 2000 2005 2010 2015 2016
Number of fire cases (unit) 1 34 23 21 72 42
Area covered by fire (hectare) 7 85 45 371 205 184
National Forestry Agency.
Note: Table includes forest area under the National Forestry Agency only.
2.4 Number of employees and operating costs of the National Forestry Agency
2.5 Forest and field fires
Source: Ministry of Environment and Natural Resources Protection of Georgia.
Source: Ministry of Environment and Natural Resources Protection of Georgia.

STATISTICAL PUBLICATION | 2016
20 | FOREST RESOURCES
Year Forest restoration Forest seeding and
planting
Facilitating natural
recovery of forest
1995 13 912 1 002 12 910
2000 1 158 258 900
2005 74 10 64
2010 165 111 54
2015 142 21 121
2016 178 50 128
Source: Ministry of Environment and Natural Resources Protection of Georgia.
Forestry Agency of Adjara.
2.7 Forest restoration
Heactare
National Forestry Agency.
Number of fire
cases, unit
Area covered by fire,
hectare
Guria - -
Imereti 24 133
Kakheti - -
Mtskheta-Mtianeti - -
Racha-Lechkhumi and Kvemo Svaneti 7 32
Samegrelo-Zemo Svaneti 4 8
Samtskhe-Javakheti - -
Kvemo Kartli 1 0.0
Shida Kartli 6 11
Note: Table includes forest area under the National Forestry Agency only.
2.6 Forest and field fires by regions, 2016
Source: Ministry of Environment and Natural Resources Protection of Georgia.
National Forestry Agency.
STATISTICAL PUBLICATION | 2016
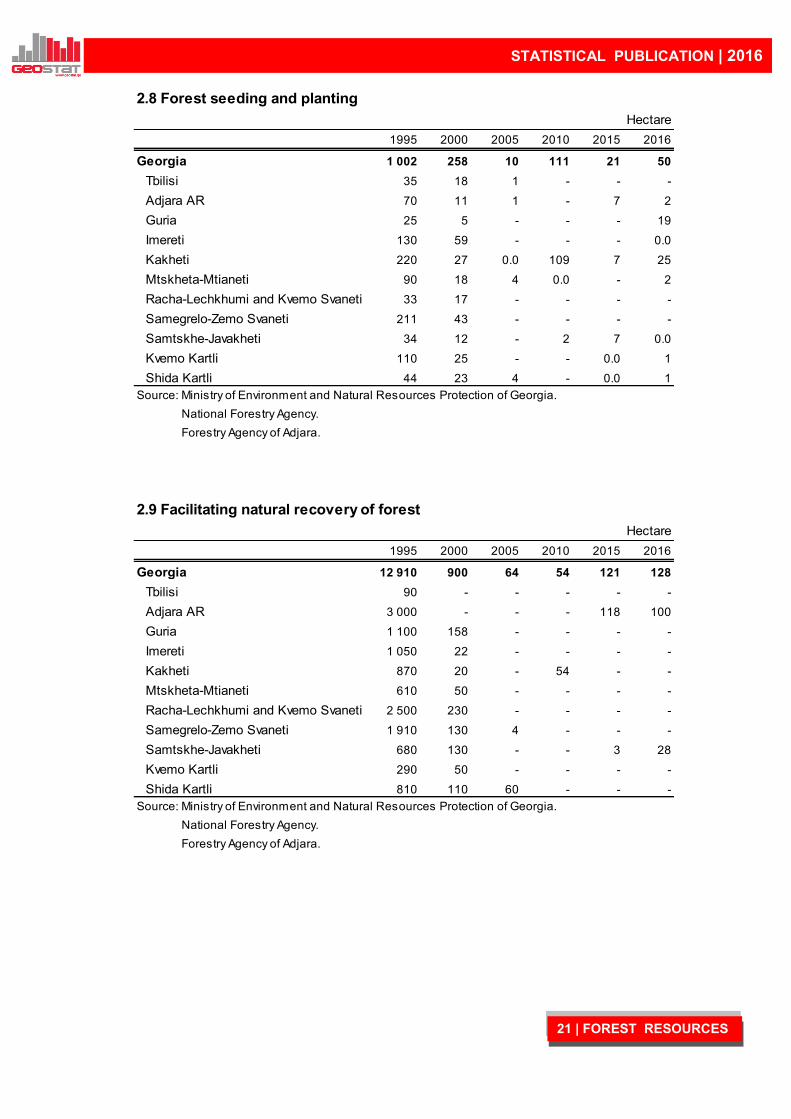
21 | FOREST RESOURCES
1995 2000 2005 2010 2015 2016
Georgia 1 002 258 10 111 21 50
Tbilisi 35 18 1 - - -
Adjara AR 70 11 1 - 7 2
Guria 25 5 - - - 19
Imereti 130 59 - - - 0.0
Kakheti 220 27 0.0 109 7 25
Mtskheta-Mtianeti 90 18 4 0.0 - 2
Racha-Lechkhumi and Kvemo Svaneti 33 17 - - - -
Samegrelo-Zemo Svaneti 211 43 - - - -
Samtskhe-Javakheti 34 12 - 2 7 0.0
Kvemo Kartli 110 25 - - 0.0 1
Shida Kartli 44 23 4 - 0.0 1
Source: Ministry of Environment and Natural Resources Protection of Georgia.
1995 2000 2005 2010 2015 2016
Georgia 12 910 900 64 54 121 128
Tbilisi 90 - - - - -
Adjara AR 3 000 - - - 118 100
Guria 1 100 158 - - - -
Imereti 1 050 22 - - - -
Kakheti 870 20 - 54 - -
Mtskheta-Mtianeti 610 50 - - - -
Racha-Lechkhumi and Kvemo Svaneti 2 500 230 - - - -
Samegrelo-Zemo Svaneti 1 910 130 4 - - -
Samtskhe-Javakheti 680 130 - - 3 28
Kvemo Kartli 290 50 - - - -
Shida Kartli 810 110 60 - - -
Source: Ministry of Environment and Natural Resources Protection of Georgia.
Hectare
2.9 Facilitating natural recovery of forest
National Forestry Agency.
Forestry Agency of Adjara.
2.8 Forest seeding and planting
Hectare
National Forestry Agency.
Forestry Agency of Adjara.

STATISTICAL PUBLICATION | 2016
22 | FOREST RESOURCES
1995 2000 2005 2010 2015 2016
Georgia 289 712 442 140 810 615 876 749 712 336 628 035
Except for protected areas
Tbilisi 19 192 4 741 6 278 ... ... ...
Adjara A/R 24 464 44 648 73 007 77 868 75 510 65 422
Samegrelo-Zemo Svaneti 4 952 24 463 56 384 16 193 12 269 8 526
Guria 19 098 45 270 103 718 97 440 80 775 57 443
Imereti 44 890 61 893 119 479 181 706 140 086 121 773
Racha-Lechkhumi and Kvemo Svaneti 20 341 36 029 68 938 86 944 74 956 63 545
Shida Kartli 16 509 52 706 52 713 37 148 60 919 59 145
Mtskheta-Mtianeti 22 175 55 923 110 376 91 524 29 019 39 538
Kakheti 71 916 72 483 123 253 94 374 89 170 79 784
Kvemo Kartli 32 552 20 757 44 100 89 704 52 496 44 222
Samtskhe-Javakheti 13 623 23 227 52 369 103 848 76 661 71 284
Protected areas ... ... ... ... 20 475 17 353
Source: Ministry of Environment and Natural Resources Protection of Georgia.
National Forestry Agency.
Forestry Agency of Adjara.
Agency of Protected Areas.
2.10 Volume of felled timber
Cubic metre
2013 2014 2015 2016
Georgia 6 039 45 915 44 612 28 586
Except for protected areas
Tbilisi … … … …
Adjara A/R 1 671 1 895 1 880 1 044
Samegrelo-Zemo Svaneti 225 474 729 647
Guria 1 182 9 105 3 087 3 958
Imereti 432 565 18 686 9 568
Racha-Lechkhumi and Kvemo Svaneti 102 20 498 1 576 993
Shida Kartli 268 802 1 993 320
Mtskheta-Mtianeti 236 2 291 1 766 2 119
Kakheti 752 1 583 10 648 7 170
Kvemo Kartli 229 6 636 1 783 1 738
Samtskhe-Javakheti 188 1 596 1 581 845
Protected areas 756 472 883 185
Source: Ministry of Environment and Natural Resources Protection of Georgia.
National Forestry Agency.
Forestry Agency of Adjara.
Agency of Protected Areas.
2.11 Illegal logging
Cubic metre

STATISTICAL PUBLICATION | 2016
23 | FOREST RESOURCES
2.12 Export of non-processed timber
2000 2005 2010 2015 2016
Thousand USD
Total export 3 065.3 49.5 - 6.1 11.9
USA - 0.2 - - -
United Kingdom 1.2 - - - -
Germany 26.8 - - 0.2 -
Spain 77.8 - - - -
Turkey 2 694.3 - - - 11.9
Iran - 5.6 - - -
Israel 8.9 - - - -
Italy 87.5 - - - -
Latvia 1.6 - - - -
Russia 9.6 - - - -
Greece 60.3 - - - -
Armenia - 43.7 - 5.9 -
Ukraine 1.7 - - - -
Switzerland 1.0 - - - -
China 94.6 - - - -
Cubic metre
Total export 39 033 559 - 33 15
USA - 1 - - -
United Kingdom 17 - - - -
Germany 251 - - 0.0 -
Spain 588 - - - -
Turkey 35 693 - - - 15
Iran - 71 - - -
Israel 64 - - - -
Italy 755 - - - -
Latvia 24 - - - -
Russia 78 - - - -
Greece 721 - - - -
Armenia - 487 - 33 -
Ukraine 42 - - - -
Switzerland 13 - - - -
China 787 - - - -
Source: National Statistics Office of Georgia.

STATISTICAL PUBLICATION | 2016
24 | FOREST RESOURCES
2000 2005 2010 2015 2016
Total import 7.7 632.3 2 222.8 4 058.4 3 043.7
United Kingdom - - - 20.2
Germany - - - 1.8 -
Turkey - - - - 221.9
Russia 7.7 43.9 - 12.8 -
Slovakia - - - 15.8
Ukraine - 588.4 1 655.8 4 043.8 2 785.8
Czech Republic - - 567.0 - -
Total import 212 8 430 18 803 27 052 23 114
United Kingdom - - - 169
Germany - - - 3 -
Turkey - - - - 1 130
Russia 212 429 - 32 -
Slovakia - - - - 32
Ukraine - 8 001 17 915 27 017 21 783
Czech Republic - - 888 - -
Cubic metre
2.13 Import of non-processed timber
Source: National Statistics Office of Georgia.
Thousand USD
STATISTICAL PUBLICATION | 2016
3. PROTECTED AREAS3. PROTECTED AREAS
25 | PROTECTED AREAS
STATISTICAL PUBLICATION | 2016
26 | PROTECTED AREAS
Georgia, as a part of Caucasus, is recognized as one of the special regions regarding biodiversity. It is
considered to be a “hotspot” of biodiversity as its nature is special with diversity of species, high level of ende-
mism and ecosystems with global importance. Protected areas are key instrument for biodiversity conservation.
The larger the territory under the protected areas, there are better conditions for preserving and protecting species
and habitats under the threat of extinction.
The first protected area in Georgia was established in 1896 as Ajameti reserve. The reserve was for spe-
cial purpose, the aim of its establishment was the protection of oak trees in Kolkheti and Imereti lowlands from the
local population. Only a certain number of trees could be cut down in these forests for developing wine-
making. However, the establishment of Ajameti reserve had a progressive meaning, as in those years of hard-
ship, against the background of spontaneous development of capitalism, the forests of Imereti lowland sur-
vived from the mass felling of timber.
Establishment of protected areas in Georgia aims at preserving natural and cultural environment and its
components, protecting conditions for mental and physical health of humans and creating one of the important
fundaments for civilized development of the society. Protected areas in Georgia are created for protecting and
restoration of important national heritage – unique and rare ecosystems, plant and animal species, cultural areas
and for using them for scientific, educational and recreational purposes. There are following categories of protect-
ed areas in Georgia: strict nature reserves, national parks, managed nature reserves, natural monuments, protect-
ed landscapes and multiple use areas.
The main purpose of establishing protected areas is restoration and protection of natural ecosystems,
landscapes and living organisms, gene pool of threatened Red List species of wild animals and plants, unique and
rare organic and nonorganic natural components and territories under threat of flooding, landslides and ava-
lanches, and areas of surface and ground water formation.
STATISTICAL PUBLICATION | 2016
Definition of terms used in tables
Biocenosis Unity of plants and animals which exist in more or less similar conditions (animals
and plants of particular field or coast).
Managed
reserve
Protected area established for the purpose of protecting natural conditions for
preservation of wild species, biocenosis and non organic formations of national
importance, which from humans’ side requires special restoration and care activi-
ties. In reserve it is allowed to use particular renewable recourses in conditions of
strict control and supervision.
National park Protected area established for preservation of relatively big and wonderful ecosys-
tems, of national and international importance, as well as for recreational activities,
where not or less damaged ecosystems, biocenosis and species included in the
red list of Georgia are presented.
Natural
monument
A relatively small area of national importance, represented by ecosystems of rare,
unique and highly aesthetic features, specific geographical and hydrological for-
mations, and individual samples of plants or fossils of living organisms. Natural
Monument can be a cave, a valley, river deltas, wood groves, etc.
Protected area Land territory or area of water having a special importance for preservation of cul-
tural phenomena involved in biological diversity, natural resources and natural en-
vironment, which is protected and managed under long-term and solid legal
grounds. Categories of protected areas are the following: restricted area, natural
monument, national park, public reserve, and protected landscape.
Protected
landscape
Protected area established for protecting natural cultural landscape developed as a
result of harmonic interaction of human and nature, preservation of vital environ-
ment, recreational, tourism and traditional activities.
Strict nature
reserve
Strict nature reserves are established in order to maintain nature, natural process-
es and genetic resources in a dynamic and pristine condition, and to conduct sci-
entific research and studies, with a minor impact, for educational and environmen-
tal monitoring purposes.
Travertine Dense, banded rock composed of calcium carbonate, formed by the evaporation of
river and spring waters.
27 | TERMINOLOGY

STATISTICAL PUBLICATION | 2016
Name
1 Administration of Borjomi-Kharagauli National Park
Protected areas under supervision:
Borjomi Strict Nature Reserve
Borjomi-Kharagauli National Park
Tetrobi Managed Reserve
Nedzvi Managed Reserve
Ktsia-Tabatskuri Managed Reserve
2 Administration of Tusheti Protected Areas
Protected areas under supervision:
Tusheti Strict Nature Reserve
Tusheti National Park
Under the supervision of Local Municipality:
Tusheti Protected Landscape
3 Administration of Vashlovani Protected Areas
Protected areas under supervision:
Alazani Floodplains National Monument
Eagle Gorge Natural Monument
Vashlovani National Park
Vashlovani Strict Nature Reserve
Takhti-Tepa Natural Monument
4 Administration of Kintrishi Protected Areas
Protected areas under supervision:
Kintrishi Protected Landscape
Kintrishi Strict Nature Reserve
5 Administration of Lagodekhi Protected Areas
Protected areas under supervision:
Lagodekhi Managed Reserve
Lagodekhi Strict Nature Reserve
6 Administration of Mariamjvari Strict Nature Reserve
Protected areas under supervision:
Iori Managed Reserve
Mariamjvari Strict Nature Reserve
Korughi Managed Reserve
7 Administration of Kazbegi National Park
Protected areas under supervision:
Abano Mineral Water Lake Natural Monument
Truso Travertine National Monument
Sakhiznari Natural Monument
Kazbegi National Park
Keterisi Mineral Vaucluse Natural Monument
Jvari Overpass Travertine Natural Monument
3.1 Structure of protected areas of Georgia, 2016
28 | PROTECTED AREAS
STATISTICAL PUBLICATION | 2016
8 Administration of Kobuleti Protected Areas
Protected areas under supervision:
Kobuleti Managed Reserve
Kobuleti Strict Nature Reserve
9 Administration of Imereti Caves Protected Areas
Protected areas under supervision:
Sataplia Strict Nature Reserve
Sataplia Managed Reserve
Prometheus Natural Monument
White Cave Natural Monument
Khomuli Cave Natural Monument
Tsutskhvati Cave Natural Monument
Navenakhevi Cave Natural Monument
Nagarevi Cave Natural Monument
Jason’s Cave Natural Monument
Sakazhia Cave Natural Monument
Tskaltsitela Gorge Natural Monument
Gabzaruli Lake Natural Monument
Satsurblia Cave Natural Monument
Solkota Cave Natural Monument
Didghele Cave Natural Monument
Melouri Cave Natural Monument
Bgheri Cave Natural Monument
Ghliana Cave Natural Monument
10 Administration of Martvili and Okatse Natural Monument
Protected areas under supervision:
Abasha Waterfall Natural Monument
Baldi Canion Natural Monument
Gochkadila Canion Natural Monument
Martvili Canyon Natural Monument
Motena Cave Natural Monument
Nazodelao Cave Natural Monument
Okatse Canyon Natural Monument
Okatse Waterfall Natural Monument
Oniore Waterfall and the Tobas's First Cave Natural Monument
Ochxamuri Waterfall Natural Monument
Toba Waterfall and Arsen Okrojanashvili Natural Monument
Jortsku Cave Natural Monument
11 Administration of Mtirala National Park
12 Administration of Algeti National Park
Protected areas under supervision:
Birtvisi Natural Monument
Dashbashi Canyon Natural Monument
Samshvilde Canyon Natural Monument
continued
29 | PROTECTED AREAS
STATISTICAL PUBLICATION | 2016
13 Administration of Batsara-Babaneuri Protected Areas
Protected areas under supervision:
Babaneuri Strict Nature Reserve
Batsara Strict Nature Reserve
Ilto Managed Reserve
14 Administration of Tbilisi National Park
Protected areas under supervision:
Gardabani Managed Reserve
Tbilisi National Park
15 Administration of Kolkheti National Park
Protected areas under supervision:
Katsoburi Managed Reserve
Kolkheti National Park
16 Administration of Ajameti Managed Reserve
17 Administration of Chachuna Managed Reserve
18 Administration of Javakheti Protected Areas
Protected areas under supervision:
Bughdasheni Lake Managed Reserves
Kartsakhi Lake Managed Reserves
Madatapa Managed Reserves
Sulda Managed Reserves
Khanchali Lake Managed Reserves
Javakheti National Park
19 Admiinistrations of Machakhela National Park
20 Administration of Pshav-Khevsureti National Park
Protected areas under supervision:
Asa Managed Reserve
Roshka Natural Monument
Pshav-Khevsureti National Park
21 Administration of Liakhvi Strict Nature Reserve
22 Administration of Pskhu-Gumista Strict Nature Reserve
Protected areas under supervision:
Gumista Strict Nature Reserve
Skurchi Strict Nature Reserve
Pskhu Strict Nature Reserve
23 Administration of Ritsa Strict Nature Reserve
24 Administration of Bichvinta-Miusera Strict Nature Reserve
Protected areas under supervision:
Bichvinta Strict Nature Reserve
Lidzava Strict Nature Reserve
Miusera Strict Nature Reserve
Source: Ministry of Environment and Natural Resources Protection of Georgia.
Agency of Protected Areas.
continued
30 | PROTECTED AREAS
STATISTICAL PUBLICATION | 2016
Name Total area, hectare
597 547
Area of strict nature reserves 139 049
1 Babaneuri 862
2 Batsara 2 986
3 Bichvinta-Miusera 3 645
4 Borjomi 13 169
5 Vashlovani 10 143
6 Tusheti 12 627
7 Kintrishi 10 703
8 Lagodekhi 19 749
9 Liakhvi 6 388
10 Mariamjvari 1 023
11 Ritsa 16 289
12 Sataplia 330
13 Pskhu-Gumista 40 819
14 Kobuleti 331
Area of national parks 349 327
1 Algeti 6 822
2 Borjomi-Kharagauli 60 576
3 Vashlovani 24 610
4 Tbilisi 21 036
5 Tusheti 69 515
6 Kolkheti 44 309
7 Machakhela 8 733
8 Mtirala 15 699
9 Pshav-Khevsureti 75 843
10 Kazbegi 8 687
11 Javakheti 13 498
Area of managed reserves 71 530
1 Asa 3 943
2 Ajameti 4 991
3 Bughdasheni 119
4 Gardabani 3 734
5 Tetrobi 3 100
6 Ilto 6 971
7 Iori 2 127
8 Kartsakhi 158
9 Kacoburi 271
10 Lagodekhi 4 702
3.2 Protected areas of Georgia by categories, 2016
Protected areas, total*
31 | PROTECTED AREAS

STATISTICAL PUBLICATION | 2016
11 Madatapa 1 398
12 Nedzvi 9 213
13 Sataplia 34
14 Sulda 309
15 Kobuleti 466
16 Ktsia-Tabatskuri 22 000
17 Korughi 2 068
18 Chachuna 5 200
19 Khanchali 727
Area of natural monuments** 2 932
1 Abano Mineral Lake 0.0
2 Alazani Floodplain Forests 204
3 Artsivi Gorge 100
4 Balda Canyon 6
5 Bodorna Rock Columns 18
6 Birtvisi 561
7 Bgheri Cave ...
8 Gabzaruli Lake ...
9 Goderdzi Pertified Forest 36
10 Dashbashi Canyon 669
11 Didghele Cave ...
12 Tetri Cave 2
13 Truso Travertines 4
14 Iazoni Cave ...
15 Martvili (Gochkadila) Canyon 13
16 The River Abasha Waterfall 99
17 Melouri Cave ...
18 Motena Cave 2
19 Mukhura Waterfall 14
20 Nagarevi Cave ...
21 Navenakhevi Cave ...
22 Nazodealo Cave 12
23 Okatse Canion 71
24 Okatse Waterfall ...
25 Oniore Waterfall and the First Toba Cave 33
26 Ochkhomuri Waterfall 9
27 Prometheus Cave 47
28 Roshka 122
29 Sakazhia Cave ...
30 Samshvilde Canyon 475
31 Satsurblia Cave 0.0
continued
32 | PROTECTED AREAS

STATISTICAL PUBLICATION | 2016
Number, unit Area, hectare
Strict nature reserves 14 139 049
National parks 11 349 327
Managed nature reserves 19 71 530
Natural monuments 42 2 932
Protected landscapes 2 34 708
3.3 Area and categories of protected areas of Georgia, 2016
Source: Ministry of Environment and Natural Resources Protection of Georgia.
Agency of Protected Areas
Note: Including occupied territories of Autonomous Republic of Abkhazia and Tskhinvali region.
33 | PROTECTED AREAS
32 Sakhizari Cliff 336
33 Solkota Cave 0.0
34 Takhti-Tepa 10
35 Toba Waterfall and Arsen Okrojanashvili Cave 73
36 Keterisi Mineral Vaucluse 1
37 Ghliana Cave ...
38 Tsutskhvati Cave ...
39 Tskaltsitela Gorge 12
40 Khomuli Cave ...
41 Jvari Overpass Travertine 3
42 Jortsku Cave 2
Area of protected landscapes 34 708
1 Tusheti 31 518
2 Kintrishi 3 190
areas.
Note: * Including occupied territories of Autonomous Republic of Abkhazia and Tskhinvali region.
** Covers only areas of natural monuments with marked and registered borderds and
Source: Ministry of Environment and Natural Resources Protection of Georgia.
Agency of Protected Areas
continued
STATISTICAL PUBLICATION | 2016
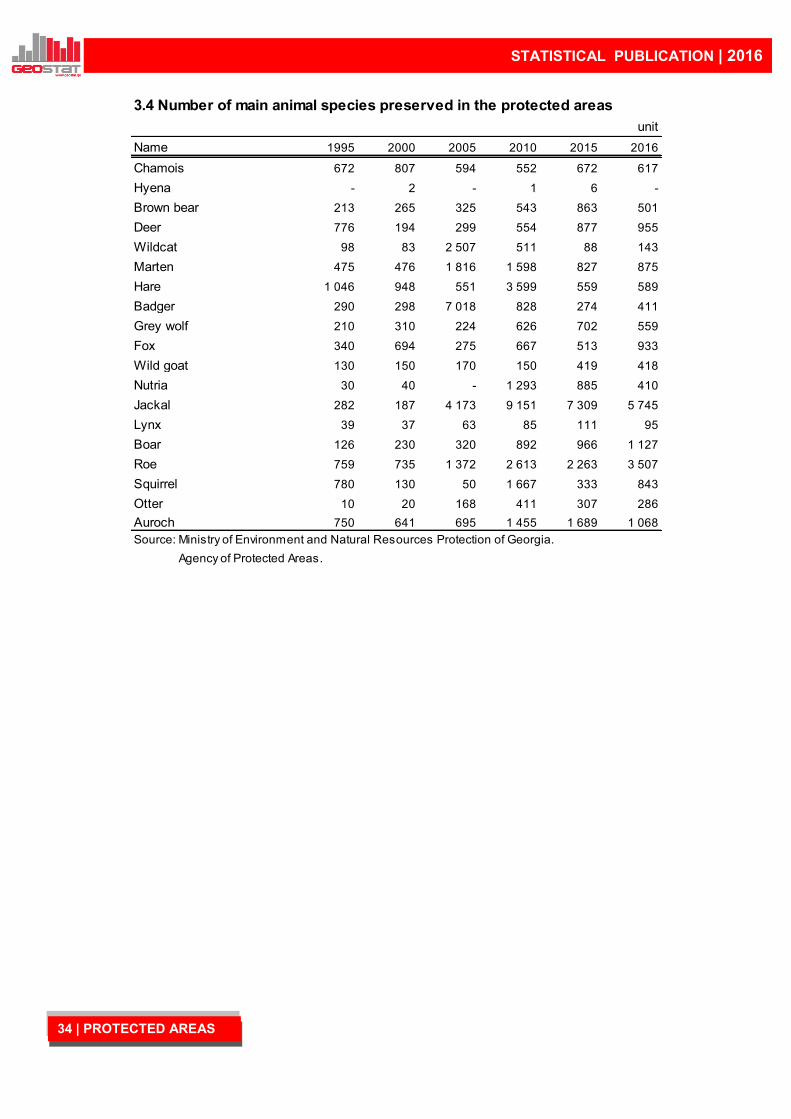
Name 1995 2000 2005 2010 2015 2016
Chamois 672 807 594 552 672 617
Hyena - 2 - 1 6 -
Brown bear 213 265 325 543 863 501
Deer 776 194 299 554 877 955
Wildcat 98 83 2 507 511 88 143
Marten 475 476 1 816 1 598 827 875
Hare 1 046 948 551 3 599 559 589
Badger 290 298 7 018 828 274 411
Grey wolf 210 310 224 626 702 559
Fox 340 694 275 667 513 933
Wild goat 130 150 170 150 419 418
Nutria 30 40 - 1 293 885 410
Jackal 282 187 4 173 9 151 7 309 5 745
Lynx 39 37 63 85 111 95
Boar 126 230 320 892 966 1 127
Roe 759 735 1 372 2 613 2 263 3 507
Squirrel 780 130 50 1 667 333 843
Otter 10 20 168 411 307 286
Auroch 750 641 695 1 455 1 689 1 068
3.4 Number of main animal species preserved in the protected areas
unit
Agency of Protected Areas.
Source: Ministry of Environment and Natural Resources Protection of Georgia.
34 | PROTECTED AREAS

STATISTICAL PUBLICATION | 2016
Name 1995 2000 2005 2010 2015 2016
Gorge eagle ... 2 10 46 54 51
Field eagle ... 10 10 ... … 158
Mountain eagle 79 55 38 51 36 44
Owl 176 419 531 30 198 212
Nightingale 60 90 40 ... … …
Grey partridge ... ... 100 ... … …
Partridge 890 365 2 120 4 670 2 235 …
Woodpecker 2 894 449 504 2 311 871 15 788
Sparrowhawk 46 97 75 403 96 2 741
Gyps 15 28 80 116 114 167
Caucasian grouse 412 780 982 845 966 966
Cinereous vulture ... 12 42 184 159 116
Eurasian woodcock 252 692 528 950 3 300 7 727
Black ring dove 670 ... 375 362 ... 1 190
Hawk 60 75 35 608 380 301
Black stork ... ... 10 20 1 084 215
Crow 90 310 150 35 2 000 2 674
Blackbird 2 970 1 930 1 842 3 652 5 000 11 151
Falcon 12 ... 16 18 62 83
Caucasian snowcock 641 702 766 645 886 505
Mistle thrush 2 340 1 380 1 100 210 1 000 68
Eurasian jay 1 440 1 100 779 2 158 1 900 669
Black kite ... ... 50 17 39 33
Pheasant 20 45 166 647 700 …
3.5 Number of main bird species preserved in the protected areas
Unit
Source: Ministry of Environment and Natural Resources Protection of Georgia.
Agency of Protected Areas.
35 | PROTECTED AREAS
STATISTICAL PUBLICATION | 2016
Tota
l num
ber
of
em
plo
yees
H
ead o
f adm
inis
tration
S
pecia
list
of
natu
ral re
sourc
es
S
ecurity
sta
ff
O
ther
sta
ff
Tota
l expenses o
n m
ain
tenance o
f
pro
tecte
d a
reas
F
rom
sta
te b
udget
F
rom
oth
er
sourc
es
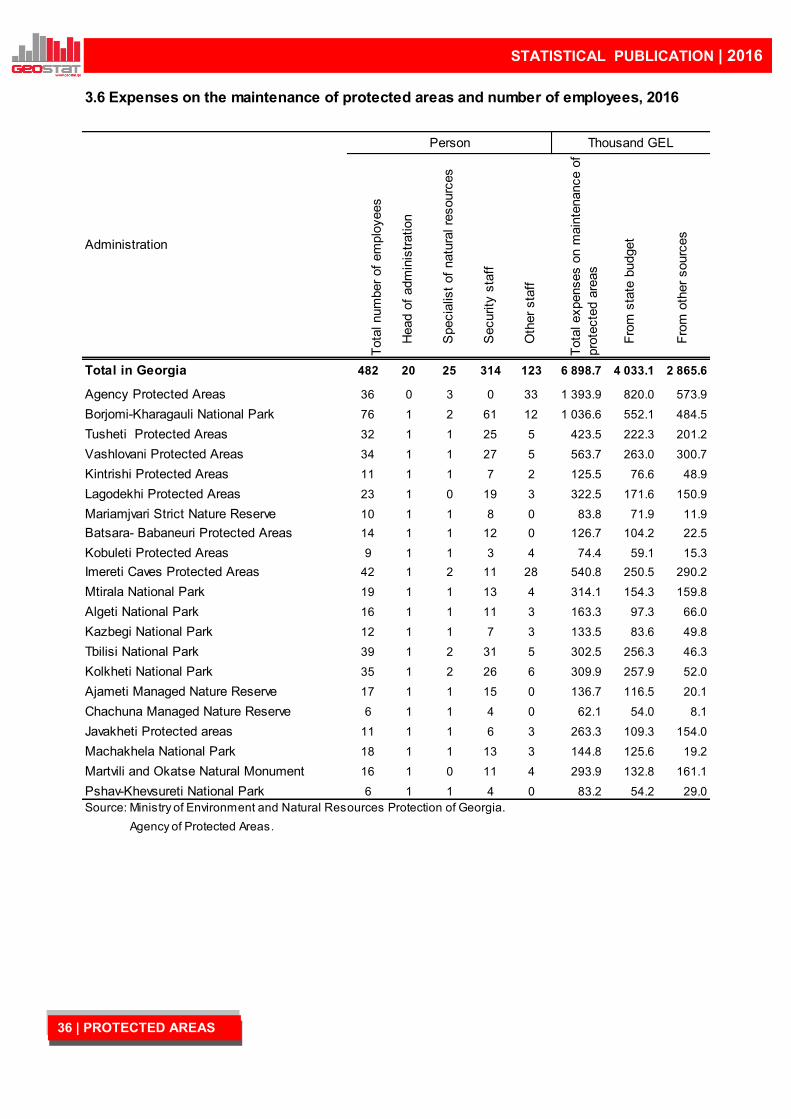
Total in Georgia 482 20 25 314 123 6 898.7 4 033.1 2 865.6
Agency Protected Areas 36 0 3 0 33 1 393.9 820.0 573.9
Borjomi-Kharagauli National Park 76 1 2 61 12 1 036.6 552.1 484.5
Tusheti Protected Areas 32 1 1 25 5 423.5 222.3 201.2
Vashlovani Protected Areas 34 1 1 27 5 563.7 263.0 300.7
Kintrishi Protected Areas 11 1 1 7 2 125.5 76.6 48.9
Lagodekhi Protected Areas 23 1 0 19 3 322.5 171.6 150.9
Mariamjvari Strict Nature Reserve 10 1 1 8 0 83.8 71.9 11.9
Batsara- Babaneuri Protected Areas 14 1 1 12 0 126.7 104.2 22.5
Kobuleti Protected Areas 9 1 1 3 4 74.4 59.1 15.3
Imereti Caves Protected Areas 42 1 2 11 28 540.8 250.5 290.2
Mtirala National Park 19 1 1 13 4 314.1 154.3 159.8
Algeti National Park 16 1 1 11 3 163.3 97.3 66.0
Kazbegi National Park 12 1 1 7 3 133.5 83.6 49.8
Tbilisi National Park 39 1 2 31 5 302.5 256.3 46.3
Kolkheti National Park 35 1 2 26 6 309.9 257.9 52.0
Ajameti Managed Nature Reserve 17 1 1 15 0 136.7 116.5 20.1
Chachuna Managed Nature Reserve 6 1 1 4 0 62.1 54.0 8.1
Javakheti Protected areas 11 1 1 6 3 263.3 109.3 154.0
Machakhela National Park 18 1 1 13 3 144.8 125.6 19.2
Martvili and Okatse Natural Monument 16 1 0 11 4 293.9 132.8 161.1
Pshav-Khevsureti National Park 6 1 1 4 0 83.2 54.2 29.0
Agency of Protected Areas.
Source: Ministry of Environment and Natural Resources Protection of Georgia.
3.6 Expenses on the maintenance of protected areas and number of employees, 2016
Administration
Person Thousand GEL
36 | PROTECTED AREAS
STATISTICAL PUBLICATION | 2016
4. WATER RESOURCES4. WATER RESOURCES
37 | WATER RESOURCES

STATISTICAL PUBLICATION | 2016
Area of the earth surface is 510.0 million square kilometres, its 71%, that is 362.1 million square kilome-
tres, is occupied by the ocean that creates illusion of abundance of water resources. In fact 97.5% of the total hy-
drosphere reserve (1 353.3 million cubic kilometres) is almost useless for economic activities, due to its salinity
(the World Ocean, the salty lakes and the wetlands). Share of the fresh water that exists in form of rivers, glaciers,
ground waters, lakes, reservoirs and wetlands, is just 2.5% or 34.7 million cubic metres. Today only 12% of total
fresh water stock, or 4.16 cubic metres is being used, that clearly demonstrates problem of fresh water deficit.
According to internal waters (rivers, lakes, ground waters, glaciers, and wetlands) Georgia was one of the
leading countries in the Soviet Union. However, rivers are unequally distributed between eastern and western
Georgia. In western Georgia run-off of rivers (together with transit run-off) is 49.8 km3, and in eastern Georgia –
16.5 km3.
The problem of water consumption has a great importance among the factors having an impact on the river
ecosystem, since using of water for economic activities, especially for irrigation causes lowering the water level, i.e.
reduction of water resources.
Increasing level of hydrosphere pollution is even more important and problematic. The main reasons for
worsening water quality are the following: irrigation, melioration of salty soils, wastewater, and improperly arraigned
reservoir caves. Importance of this problem can be justified by the following general examples: even those
wastewaters which, after treatment return to the primary sources, require 15 fold dilutions with clean water in order
to restore natural quality of water.
Annual volume of wastewater of any types pollutes 12-15 times more natural water in general, that is a
significant part of river run-off. Quality of river and reservoir water of Georgia is alarming. Even in 1986 pollution
level per unit of river run-off was 17 times more than an average world index.
Sharp decrease in industrial production in recent years implied only one positive result: amount of hazard-
ous substances emitted into the atmosphere and pollution level in wastewaters decreased.
Inland water resources located on the country territory are the state property and can be used only on the
basis of the licenses issued by authorized agencies. Ownership of the land does not imply permission for water
use. Throwing or burring industrial, household, toxic, radioactive and other hazardous waste into the water bodies
or nearby areas is prohibited as well as discharge of wastewater without having an appropriate license.
Despite of great importance of administrative-legislative policies, economically grounded scientific-
technical activities play decisive role in environmental protection. For example, rational allocation of industrial ob-
jects according to availability of water resources and its quality and implementing the technologies, that ensures
getting the production with minimal consumption of natural resources and minimizing hazardous waste.
38 | WATER RESOURCES
STATISTICAL PUBLICATION | 2016
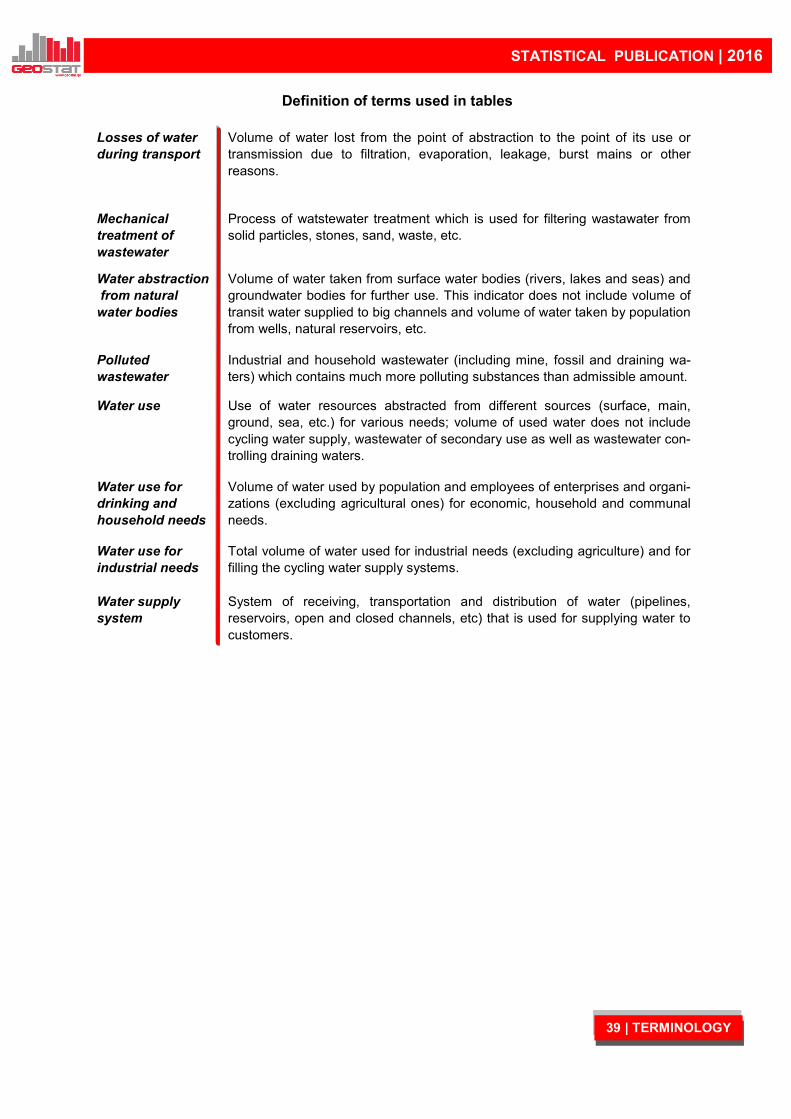
Definition of terms used in tables
Losses of water
during transport
Volume of water lost from the point of abstraction to the point of its use or
transmission due to filtration, evaporation, leakage, burst mains or other
reasons.
Mechanical
treatment of
wastewater
Process of watstewater treatment which is used for filtering wastawater from
solid particles, stones, sand, waste, etc.
Water abstraction
from natural
water bodies
Volume of water taken from surface water bodies (rivers, lakes and seas) and
groundwater bodies for further use. This indicator does not include volume of
transit water supplied to big channels and volume of water taken by population
from wells, natural reservoirs, etc.
Polluted
wastewater
Industrial and household wastewater (including mine, fossil and draining wa-
ters) which contains much more polluting substances than admissible amount.
Water use Use of water resources abstracted from different sources (surface, main,
ground, sea, etc.) for various needs; volume of used water does not include
cycling water supply, wastewater of secondary use as well as wastewater con-
trolling draining waters.
Water use for
drinking and
household needs
Volume of water used by population and employees of enterprises and organi-
zations (excluding agricultural ones) for economic, household and communal
needs.
Water use for
industrial needs
Total volume of water used for industrial needs (excluding agriculture) and for
filling the cycling water supply systems.
Water supply
system
System of receiving, transportation and distribution of water (pipelines,
reservoirs, open and closed channels, etc) that is used for supplying water to
customers.
39 | TERMINOLOGY
STATISTICAL PUBLICATION | 2016
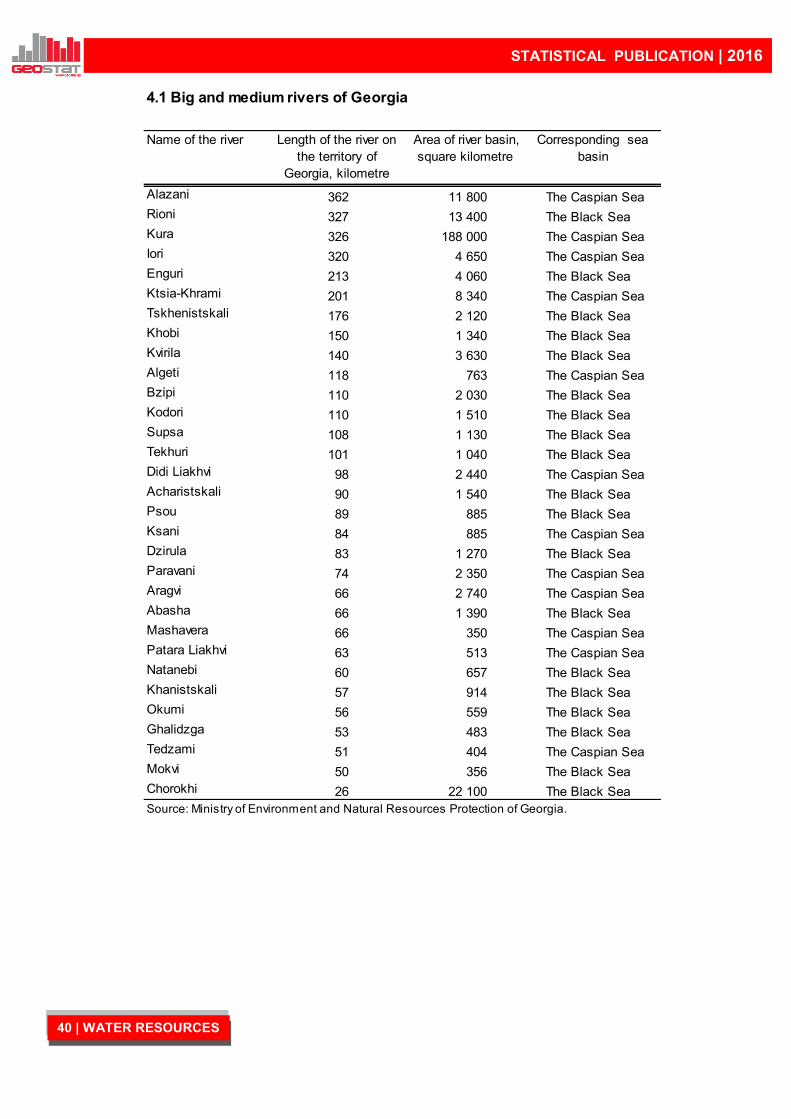
Name of the river Length of the river on
the territory of
Georgia, kilometre
Area of river basin,
square kilometre
Corresponding sea
basin
Alazani 362 11 800 The Caspian Sea
Rioni 327 13 400 The Black Sea
Kura 326 188 000 The Caspian Sea
Iori 320 4 650 The Caspian Sea
Enguri 213 4 060 The Black Sea
Ktsia-Khrami 201 8 340 The Caspian Sea
Tskhenistskali 176 2 120 The Black Sea
Khobi 150 1 340 The Black Sea
Kvirila 140 3 630 The Black Sea
Algeti 118 763 The Caspian Sea
Bzipi 110 2 030 The Black Sea
Kodori 110 1 510 The Black Sea
Supsa 108 1 130 The Black Sea
Tekhuri 101 1 040 The Black Sea
Didi Liakhvi 98 2 440 The Caspian Sea
Acharistskali 90 1 540 The Black Sea
Psou 89 885 The Black Sea
Ksani 84 885 The Caspian Sea
Dzirula 83 1 270 The Black Sea
Paravani 74 2 350 The Caspian Sea
Aragvi 66 2 740 The Caspian Sea
Abasha 66 1 390 The Black Sea
Mashavera 66 350 The Caspian Sea
Patara Liakhvi 63 513 The Caspian Sea
Natanebi 60 657 The Black Sea
Khanistskali 57 914 The Black Sea
Okumi 56 559 The Black Sea
Ghalidzga 53 483 The Black Sea
Tedzami 51 404 The Caspian Sea
Mokvi 50 356 The Black Sea
Chorokhi 26 22 100 The Black Sea
4.1 Big and medium rivers of Georgia
Source: Ministry of Environment and Natural Resources Protection of Georgia.
40 | WATER RESOURCES

STATISTICAL PUBLICATION | 2016
Lake Paravani 37.5 90.8 2.4 3.3
Tsalka Reservoir 33.7 312.0 9.3 25.0
Lake Khozapini 26.3 19.3 0.7 1.0
Lake Paliastomi 18.2 52.0 2.1 3.2
Lake Tabatskuri 14.2 221.0 15.6 40.0
Jvari Reservoir 13.5 1 092.0 115.0 230.0
Shaori Reservoir 13.2 90.0 6.8 11.5
Lake Jandara 12.5 52.0 4.6 7.2
Sioni Reservoir 12.0 325.0 25.4 67.5
Samgori Reservoir 11.8 308.0 26.2 45.0
Jinvali Reservoir 11.5 52.0 50.0 98.0
Tkibuli Reservoir 11.5 84.0 16.0 32.0
Gali Reservoir 8.0 145.0 17.0 52.0
Lake Saghamo 4.8 7.7 1.6 2.3
Lake Ritsa 1.5 94.0 63.1 101.0
Lake Bazaleti 1.2 5.6 4.5 7.0
Lake Lisi 0.5 1.2 2.6 4.0
Source: Ministry of Environment and Natural Resources Protection of Georgia.
4.2 Main lakes and reservoirs of Georgia
Surface area,
square kilometre
Volume, million
cubic metre
Name Average depth,
metre
Maximum depth,
metre
41 | WATER RESOURCES

STATISTICAL PUBLICATION | 2016
2015 2016
Population connected to water supply industry 57.7 61.0
Population connected to a wastewater collecting system 44.3 46.5
Population connected to wastewater treatment facilities 32.2 34.0
Population connected to wastewater mechanical treatment facilities 28.6 29.4
Gross volume of water supplied by water supply industry 683.2 676.0
Losses of water during transport 403.9 428.9
Net volume of water supplied by water supply industry 279.2 247.1
Water supplied to households by water supply industry 243.3 207.9
Million cubic metre
4.3 Main indicators for water supply industry and wastewater collection
Percentage
Source: National Statistics Office of Georgia.
2012 2013 2014 2015 2016
2 412.0 2 117.0 2 070.0 1 863.0 1 826.0
368.0 403.2 399.0 498.5 479.9
1 772.0 1 617.0 1 583.0 1 393.0 1 215.0
330.2 448.2 434.4 381.5 340.8
362.5 293.5 315.0 354.8 262.4
1 079.3 875.3 833.6 656.7 611.8
597.9 593.6 661.2 634.0 358.8
475.3 438.2 477.7 457.2 159.0
640.0 500.0 487.0 470.0 611.0
224.0 309.0 316.0 226.8 190.3
Note: Water for hydroelectricity generation purposes is excluded.
Water use, total
Household needs
Polluted wastewater
Losses of water during transport
Cycling and secondary water supply
Industrial needs
Other needs
Wastewater discharge into surface water bodies, total
Source: Ministry of Environment and Natural Resources Protection of Georgia.
Million cubic metre
4.4 Main indicators for protection and use of water resources
Water abstraction from natural water bodies, total
Water abstraction from groundwater bodies
42 | WATER RESOURCES

STATISTICAL PUBLICATION | 2016
5. AMBIENT AIR PROTECTION 5. AMBIENT AIR PROTECTION
43 | AIR PROTECTION
STATISTICAL PUBLICATION | 2016
Atmospheric air that surrounds the earth is one of the main components of environment and represents
source of life on our planet. Atmosphere protects the earth from destructive impact of meteorites: most of them
burn while flying through the dense layers of atmosphere; it also detains a large share of ultraviolet radiation and
ensures life existence on the earth. Atmosphere basically consists of nitrogen (78.084%) and oxygen (20.976%).
Carbon dioxide has a very small share in the atmosphere (0.0314%), but plays a special role since it absorbs and
releases long wave radiation. Moreover, carbon dioxide is essential for plants.
Atmosphere always contains water steam in different quantities and its role is significant in atmospheric
events: water steam condensation causes creation of clouds and precipitation, and its transformation is followed by
absorption or emission of big amount of warmth. It is well known that a person daily consumes about 1 kg food, 1.5
litre water and 12 kg air in relaxed condition. It is possible to check the quality of water or food and treat them when
needed, but the air is consumed as it is in the environment. This is a good example for realizing importance of pro-
tecting of atmospheric air form hazardous substances.
Air pollution is spread in several kilometres vertically. During the last decades the amount of polluting sub-
stances into atmospheric air increased twenty times. Atmosphere is highly polluted by the enterprises of black and
coloured metallurgy, and chemical industry that emit sulphur gases, carbon dioxide, dust and other substances.
Transport emissions have a significant share in total air pollution. One of the alternatives for reducing
transport emission can be improvement of internal combustion engine and petrol quality, use of electro mobiles,
etc. In the near future the substance substituting mentioned types of fuel will be hydrogen, which is cheaper and
more flexible than electricity. In combustion process it mixes with oxygen and without smoke develops steam in
insignificant amount.
Greening industrial sites and development of forestry economy has a great importance for implementation
of measures aiming protection of atmospheric air. One hectare forest filters about 50 – 70 tonnes of dust per year.
The forest is directly connected to improvement of the health of atmospheric air and protection of water resources,
since oxygen is basically filled by photosynthesis. 1 hectare forest emits 10-15 times more oxygen than any phito-
cenosis.
44 | AIR PROTECTION

STATISTICAL PUBLICATION | 2016
Definition of terms used in tables
Captured
hazardous
substances
Amount of hazardous substances captured with gas cleaning and dust col-
lection equipment from hazardous substance generated in stationary
sources. It does not include hazardous substances used in technological
processes of production in form of raw materials or intermediate products.
Hazardous
substances emitted
into the
atmosphere from
stationary sources
Total amount of all hazardous substances emitted into the atmosphere as a
result of incomplete filtration and cleaning by abatement equipment. This
does not include hazardous materials generated as a result of erosion, for-
est fire, etc.
Stationary sources
emitting hazardous
substances into the
atmosphere
These sources can be organized and non-organized; organized sources are
immobile sources out of which hazardous substances are emitted from gas
and air discharging systems (chimneys, ventilation devices, etc.). The sys-
tem gives possibility to use gas cleaning and dust collection equipment, for
decontamination of hazardous substances. The source is considered non-
organized when hazardous substances directly go into the atmosphere due
to non-hermetic protection of technological aggregates, loading systems (for
example: places for loading cement, etc.).
45 | TERMINOLOGY

STATISTICAL PUBLICATION | 2016
1995 2000 2005 2010 2015 2016
Number of stationary sources 132 117 153 1 099 2 695 2 891
1995 2000 2005 2010 2015 2016
Hazardous substances generated in
stationary sources, total 30.4 28.7 57.3 661.0 802.2 772.5
Captured hazardous substances 15.0 10.0 33.2 630.7 757.3 728.0
Share of captured hazardous substances in
total generated hazardous substances (%) 49.3 35.0 57.9 95.4 94.4 94.2
Unit
5.1 Number of stationary sources emitting hazardous substances
5.2 Main indicators of generation of hazardous substances in stationary
sources and protection of atmospheric air
Source: Ministry of Environment and Natural Resources Protection of Georgia.
Source: Ministry of Environment and Natural Resources Protection of Georgia.
46 | AIR PROTECTION
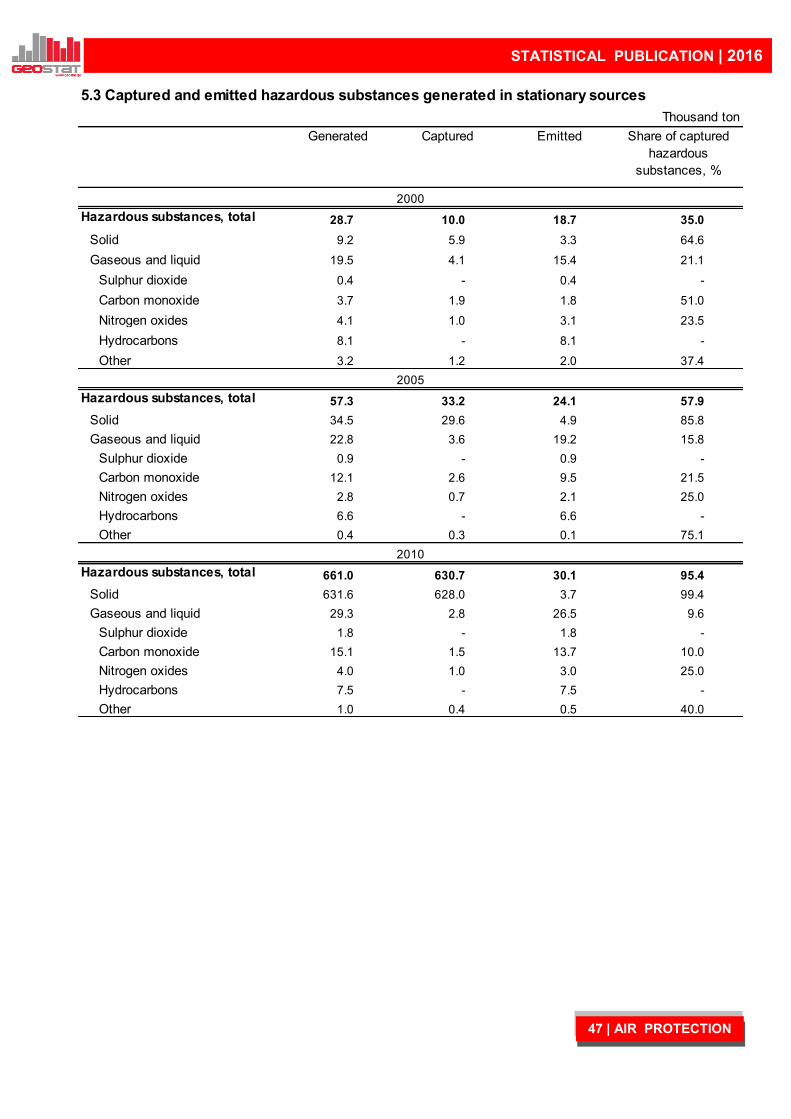
STATISTICAL PUBLICATION | 2016
Generated Captured Emitted Share of captured
hazardous
substances, %
Hazardous substances, total 28.7 10.0 18.7 35.0
Solid 9.2 5.9 3.3 64.6
Gaseous and liquid 19.5 4.1 15.4 21.1
Sulphur dioxide 0.4 - 0.4 -
Carbon monoxide 3.7 1.9 1.8 51.0
Nitrogen oxides 4.1 1.0 3.1 23.5
Hydrocarbons 8.1 - 8.1 -
Other 3.2 1.2 2.0 37.4
Hazardous substances, total 57.3 33.2 24.1 57.9
Solid 34.5 29.6 4.9 85.8
Gaseous and liquid 22.8 3.6 19.2 15.8
Sulphur dioxide 0.9 - 0.9 -
Carbon monoxide 12.1 2.6 9.5 21.5
Nitrogen oxides 2.8 0.7 2.1 25.0
Hydrocarbons 6.6 - 6.6 -
Other 0.4 0.3 0.1 75.1
Hazardous substances, total 661.0 630.7 30.1 95.4
Solid 631.6 628.0 3.7 99.4
Gaseous and liquid 29.3 2.8 26.5 9.6
Sulphur dioxide 1.8 - 1.8 -
Carbon monoxide 15.1 1.5 13.7 10.0
Nitrogen oxides 4.0 1.0 3.0 25.0
Hydrocarbons 7.5 - 7.5 -
Other 1.0 0.4 0.5 40.0
5.3 Captured and emitted hazardous substances generated in stationary sources
Thousand ton
2010
2005
2000
47 | AIR PROTECTION
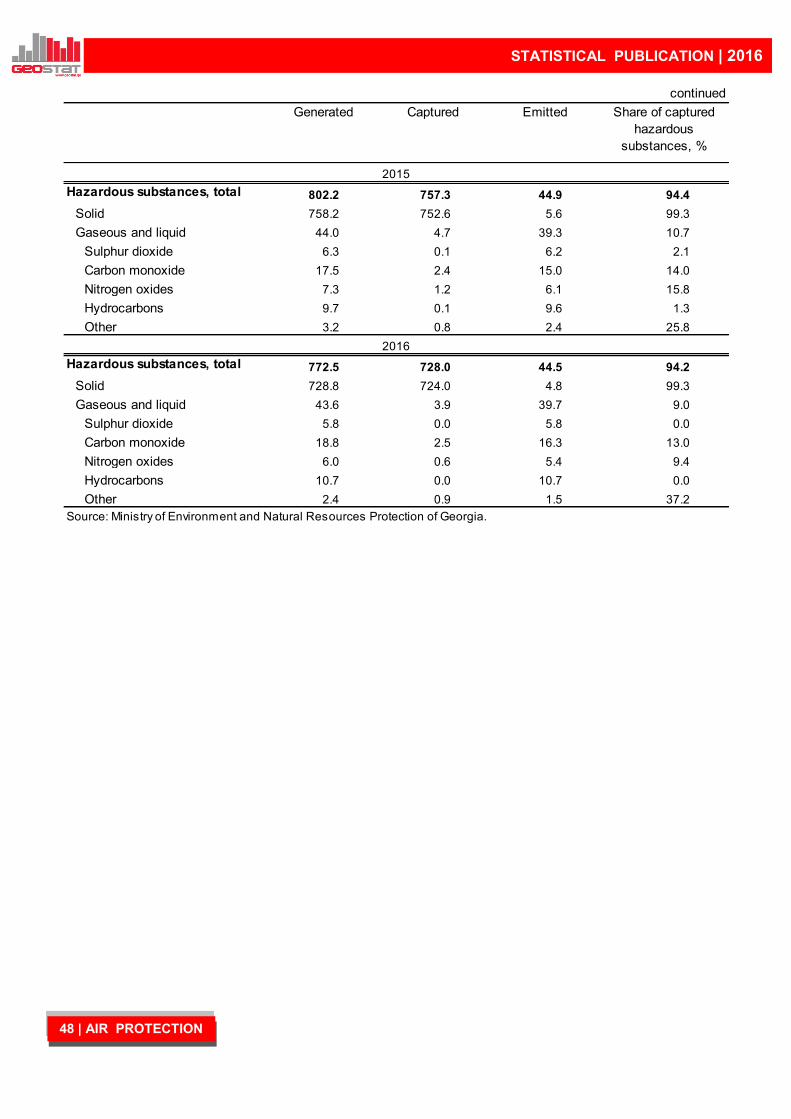
STATISTICAL PUBLICATION | 2016
Generated Captured Emitted Share of captured
hazardous
substances, %
Hazardous substances, total 802.2 757.3 44.9 94.4
Solid 758.2 752.6 5.6 99.3
Gaseous and liquid 44.0 4.7 39.3 10.7
Sulphur dioxide 6.3 0.1 6.2 2.1
Carbon monoxide 17.5 2.4 15.0 14.0
Nitrogen oxides 7.3 1.2 6.1 15.8
Hydrocarbons 9.7 0.1 9.6 1.3
Other 3.2 0.8 2.4 25.8
Hazardous substances, total 772.5 728.0 44.5 94.2
Solid 728.8 724.0 4.8 99.3
Gaseous and liquid 43.6 3.9 39.7 9.0
Sulphur dioxide 5.8 0.0 5.8 0.0
Carbon monoxide 18.8 2.5 16.3 13.0
Nitrogen oxides 6.0 0.6 5.4 9.4
Hydrocarbons 10.7 0.0 10.7 0.0
Other 2.4 0.9 1.5 37.2
Source: Ministry of Environment and Natural Resources Protection of Georgia.
2016
2015
continued
48 | AIR PROTECTION

STATISTICAL PUBLICATION | 2016
Generated Captured Emitted
Georgia 28.7 10.0 18.7
Tbilisi 0.8 0.2 0.6
Adjara AR 9.8 0.0 9.8
Guria 0.0 0.0 0.0
Imereti 3.6 3.1 0.5
Kakheti 0.0 0.0 0.0
Mtskheta-Mtianeti 0.2 - 0.2
Racha-Lechkhumi and Kvemo Svaneti - - -
Samegrelo-Zemo Svaneti 0.5 0.0 0.4
Samtskhe-Javakheti 0.0 - 0.0
Kvemo Kartli 13.5 6.7 6.8
Shida Kartli 0.2 0.1 0.1
Georgia 57.3 33.2 24.1
Tbilisi 3.0 0.1 2.9
Adjara AR 4.1 0.0 4.0
Guria - - -
Imereti 27.8 19.2 8.6
Kakheti 0.0 0.0 0.0
Mtskheta-Mtianeti 0.8 0.4 0.4
Racha-Lechkhumi and Kvemo Svaneti - - -
Samegrelo-Zemo Svaneti 0.3 - 0.3
Samtskhe-Javakheti 0.0 0.0 0.0
Kvemo Kartli 10.2 5.4 4.8
Shida Kartli 11.0 8.2 2.8
Georgia 661.0 630.7 30.1
Tbilisi 26.0 24.8 1.2
Adjara AR 4.2 2.1 2.1
Guria 0.0 - 0.0
Imereti 20.5 5.7 14.8
Kakheti 3.8 3.3 0.5
Mtskheta-Mtianeti 8.7 8.3 0.4
Racha-Lechkhumi and Kvemo Svaneti 0.0 - 0.0
Samegrelo-Zemo Svaneti 5.4 4.3 1.1
Samtskhe-Javakheti 0.5 0.4 0.1
Kvemo Kartli 355.0 349.0 6.0
Shida Kartli 237.0 232.8 4.2
Thousand ton
5.4 Capture and emission of hazardous substances generated in stationary sources by
regions
2000
2010
2005
49 | AIR PROTECTION
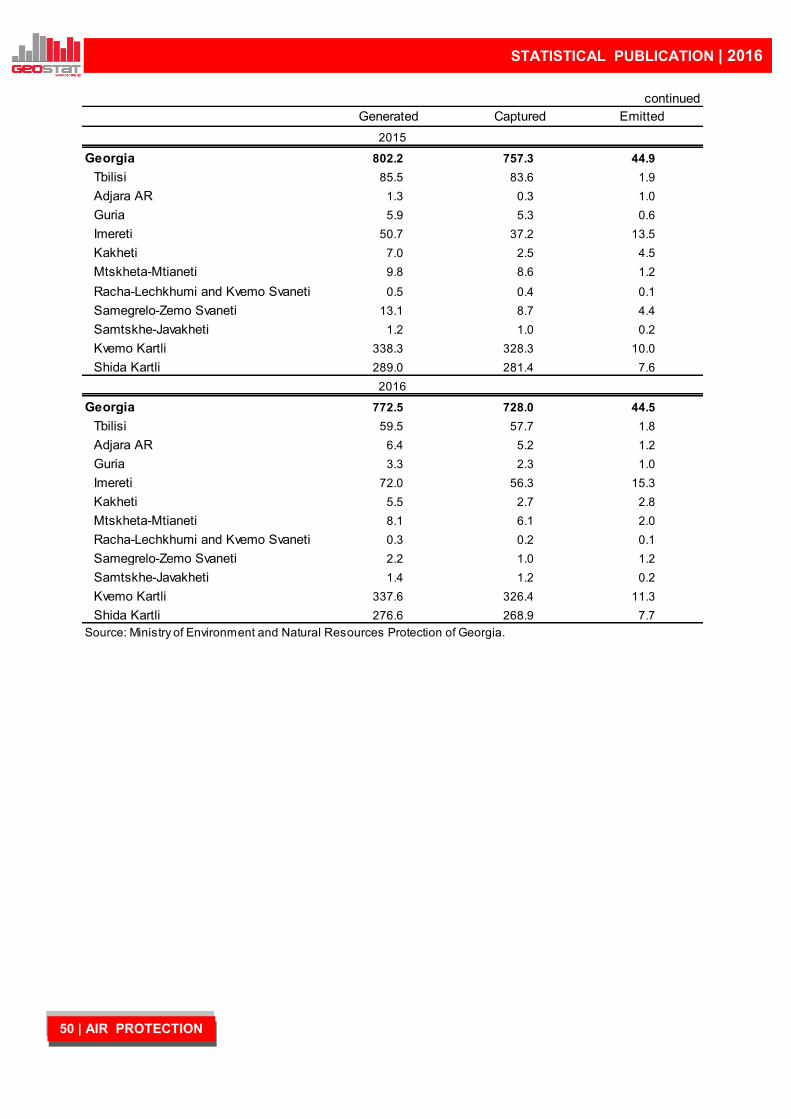
STATISTICAL PUBLICATION | 2016
Generated Captured Emitted
Georgia 802.2 757.3 44.9
Tbilisi 85.5 83.6 1.9
Adjara AR 1.3 0.3 1.0
Guria 5.9 5.3 0.6
Imereti 50.7 37.2 13.5
Kakheti 7.0 2.5 4.5
Mtskheta-Mtianeti 9.8 8.6 1.2
Racha-Lechkhumi and Kvemo Svaneti 0.5 0.4 0.1
Samegrelo-Zemo Svaneti 13.1 8.7 4.4
Samtskhe-Javakheti 1.2 1.0 0.2
Kvemo Kartli 338.3 328.3 10.0
Shida Kartli 289.0 281.4 7.6
Georgia 772.5 728.0 44.5
Tbilisi 59.5 57.7 1.8
Adjara AR 6.4 5.2 1.2
Guria 3.3 2.3 1.0
Imereti 72.0 56.3 15.3
Kakheti 5.5 2.7 2.8
Mtskheta-Mtianeti 8.1 6.1 2.0
Racha-Lechkhumi and Kvemo Svaneti 0.3 0.2 0.1
Samegrelo-Zemo Svaneti 2.2 1.0 1.2
Samtskhe-Javakheti 1.4 1.2 0.2
Kvemo Kartli 337.6 326.4 11.3
Shida Kartli 276.6 268.9 7.7
Source: Ministry of Environment and Natural Resources Protection of Georgia.
2016
2015
continued
50 | AIR PROTECTION
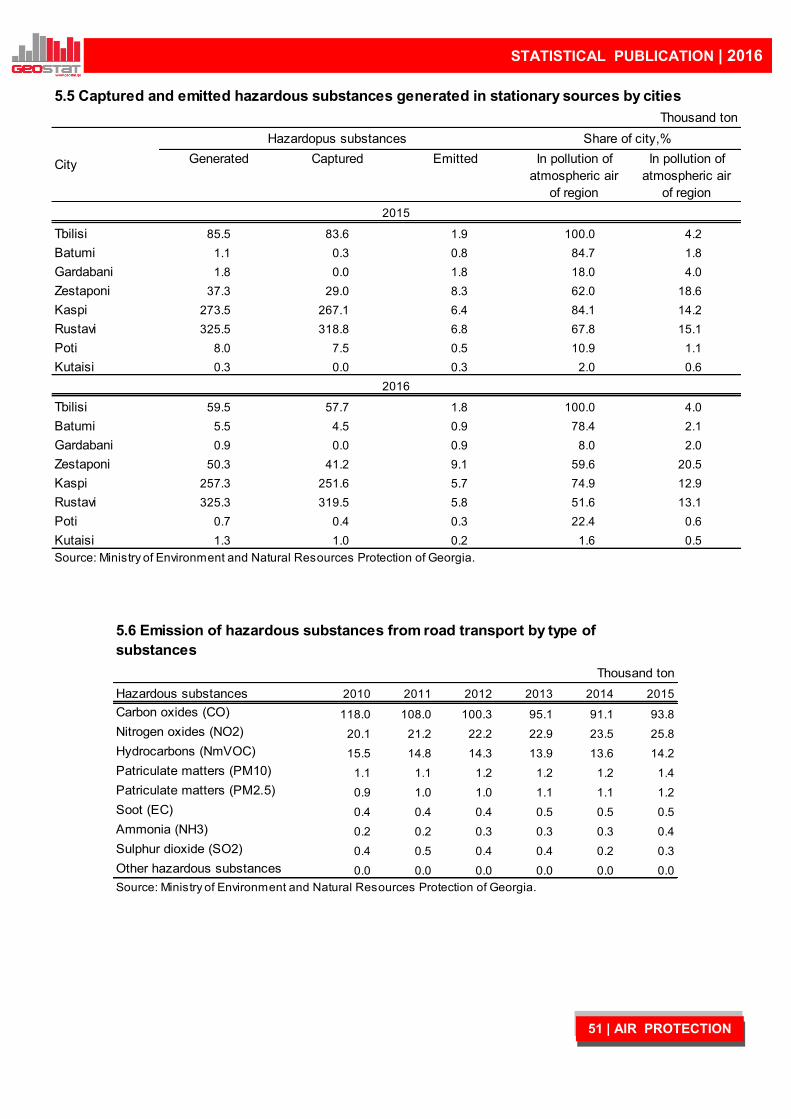
STATISTICAL PUBLICATION | 2016
Generated Captured Emitted In pollution of
atmospheric air
of region
In pollution of
atmospheric air
of region
Tbilisi 85.5 83.6 1.9 100.0 4.2
Batumi 1.1 0.3 0.8 84.7 1.8
Gardabani 1.8 0.0 1.8 18.0 4.0
Zestaponi 37.3 29.0 8.3 62.0 18.6
Kaspi 273.5 267.1 6.4 84.1 14.2
Rustavi 325.5 318.8 6.8 67.8 15.1
Poti 8.0 7.5 0.5 10.9 1.1
Kutaisi 0.3 0.0 0.3 2.0 0.6
Tbilisi 59.5 57.7 1.8 100.0 4.0
Batumi 5.5 4.5 0.9 78.4 2.1
Gardabani 0.9 0.0 0.9 8.0 2.0
Zestaponi 50.3 41.2 9.1 59.6 20.5
Kaspi 257.3 251.6 5.7 74.9 12.9
Rustavi 325.3 319.5 5.8 51.6 13.1
Poti 0.7 0.4 0.3 22.4 0.6
Kutaisi 1.3 1.0 0.2 1.6 0.5
Source: Ministry of Environment and Natural Resources Protection of Georgia.
2015
2016
5.5 Captured and emitted hazardous substances generated in stationary sources by cities
Share of city,%
Thousand ton
City
Hazardopus substances
Hazardous substances 2010 2011 2012 2013 2014 2015
Carbon oxides (CO) 118.0 108.0 100.3 95.1 91.1 93.8
Nitrogen oxides (NO2) 20.1 21.2 22.2 22.9 23.5 25.8
Hydrocarbons (NmVOC) 15.5 14.8 14.3 13.9 13.6 14.2
Patriculate matters (PM10) 1.1 1.1 1.2 1.2 1.2 1.4
Patriculate matters (PM2.5) 0.9 1.0 1.0 1.1 1.1 1.2
Soot (EC) 0.4 0.4 0.4 0.5 0.5 0.5
Ammonia (NH3) 0.2 0.2 0.3 0.3 0.3 0.4
Sulphur dioxide (SO2) 0.4 0.5 0.4 0.4 0.2 0.3
Other hazardous substances 0.0 0.0 0.0 0.0 0.0 0.0
Source: Ministry of Environment and Natural Resources Protection of Georgia.
5.6 Emission of hazardous substances from road transport by type of
substances
Thousand ton
51 | AIR PROTECTION
STATISTICAL PUBLICATION | 2016
6. NATURAL HAZARDS AND 6. NATURAL HAZARDS AND VIOLATIONS OF LAWVIOLATIONS OF LAW
52 | NATURAL HAZARDS AND VIOLATIONS OF LAW

STATISTICAL PUBLICATION | 2016
Definition of terms used in tables
Avalanche A rapid flow of snow or land down a sloping surface.
Flash Flood A sudden raise f water level caused by heavy rains and intensive snow melting.
Flood An overflow of river water that submerges land (during heavy rains or melting of snow).
Hail A form of solid precipitation that consists of ball or irregular lumps of ice.
Hurricane Very strong wind, velocity of which exceeds 20 mpc and which causes strong storm on
the sea and damage of buildings on the ground.
Landslide A geological phenomenon which includes a wide range of ground movements, such as
rockfalls and deep failure of slopes. Its primary driving force is the action of gravity.
Mudflow A downhill movement of soft wet and debris, made fluid by rain or melted snow and often
building up a great speed.
Squall Short hurricane.
53 | TERMINOLOGY

STATISTICAL PUBLICATION | 2016
Num
ber
of
landslid
es
(activate
d o
r new
ly
occurr
ed)
Num
ber
of
hum
an
fata
litie
s
Num
ber
of
mudflow
s
(activate
d o
r new
ly
occurr
ed)
Num
ber
of
hum
an
fata
litie
s
Aff
ecte
d a
gricultura
l la
nd
Num
ber
of
hum
an
sett
lem
ents
Num
ber
of
build
ings
1995 670 6 250 12 179 274 195
1996 610 3 165 5 232 403 626
1997 871 2 335 7 337 458 227
1998 543 5 173 6 230 370 159
1999 56 1 27 - 138 157 314
2000 65 1 23 - 162 240 207
2001 75 - 26 - 128 191 127
2002 69 1 23 2 148 203 193
2003 71 3 28 - 107 90 207
2004 949 4 258 2 16 289 755 6 042
2005 603 - 155 4 7 590 473 3 682
2006 356 1 63 - 3 173 531 2 066
2007 136 - 104 - 1 389 269 707
2008 311 10 126 8 1 388 392 1 198
2009 323 1 193 3 8 232 521 2 696
2010 250 3 81 2 1 155 366 822
2011 94 3 37 8 652 181 463
2012 325 1 88 5 1 255 239 845
2013 336 - 93 - 1 413 739 1 269
2014 727 - 141 10 … 1 041 962
2015 936 4 167 19 … 931 1 014
2016 780 - 208 - … 1 421 1 084
National Environmental Agency.
6.1 Number of occurred geological phenomena (landslide, mudflow), human fatalities and
vulnerable objects
Landslide Mudflow Vulnerable objects
Year
Source: Ministry of Environment and Natural Resources Protection of Georgia.
54 | NATURAL HAZARDS AND VIOLATIONS OF LAW
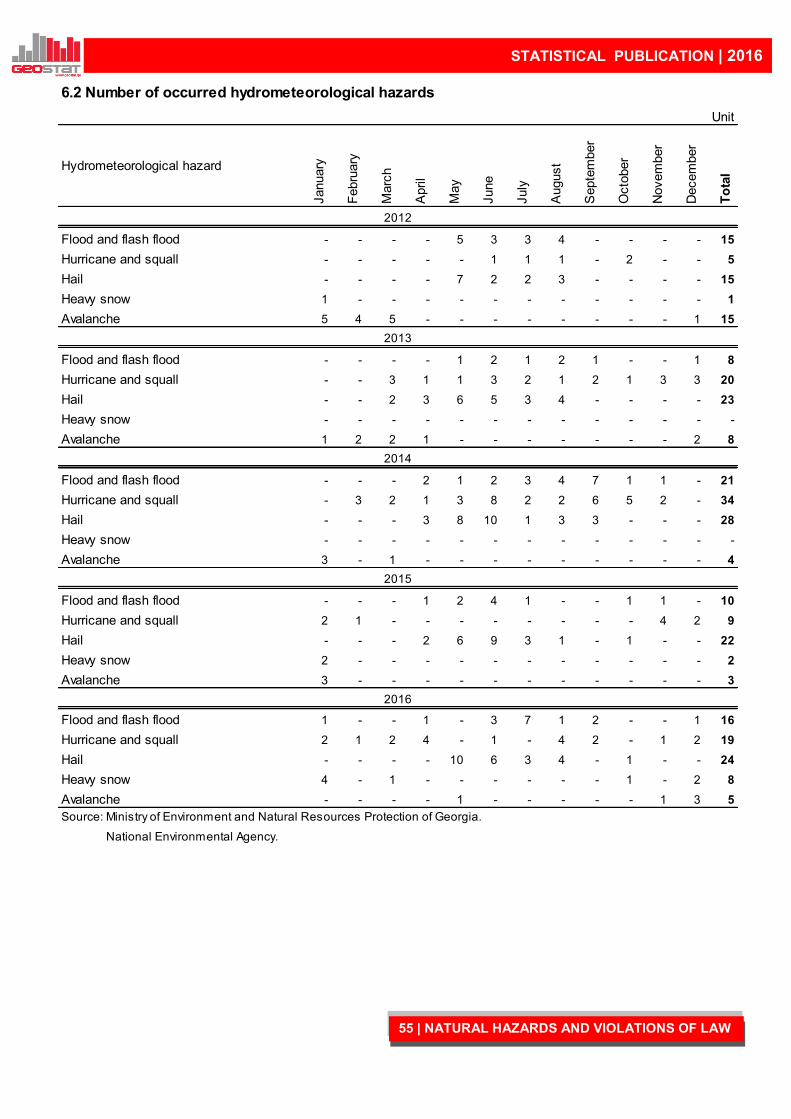
STATISTICAL PUBLICATION | 2016
Hydrometeorological hazard
January
Febru
ary
Marc
h
April
May
June
July
August
Septe
mber
Octo
ber
Novem
ber
Decem
ber
To
tal
Flood and flash flood - - - - 5 3 3 4 - - - - 15
Hurricane and squall - - - - - 1 1 1 - 2 - - 5
Hail - - - - 7 2 2 3 - - - - 15
Heavy snow 1 - - - - - - - - - - - 1
Avalanche 5 4 5 - - - - - - - - 1 15
Flood and flash flood - - - - 1 2 1 2 1 - - 1 8
Hurricane and squall - - 3 1 1 3 2 1 2 1 3 3 20
Hail - - 2 3 6 5 3 4 - - - - 23
Heavy snow - - - - - - - - - - - - -
Avalanche 1 2 2 1 - - - - - - - 2 8
Flood and flash flood - - - 2 1 2 3 4 7 1 1 - 21
Hurricane and squall - 3 2 1 3 8 2 2 6 5 2 - 34
Hail - - - 3 8 10 1 3 3 - - - 28
Heavy snow - - - - - - - - - - - - -
Avalanche 3 - 1 - - - - - - - - - 4
Flood and flash flood - - - 1 2 4 1 - - 1 1 - 10
Hurricane and squall 2 1 - - - - - - - - 4 2 9
Hail - - - 2 6 9 3 1 - 1 - - 22
Heavy snow 2 - - - - - - - - - - - 2
Avalanche 3 - - - - - - - - - - - 3
Flood and flash flood 1 - - 1 - 3 7 1 2 - - 1 16
Hurricane and squall 2 1 2 4 - 1 - 4 2 - 1 2 19
Hail - - - - 10 6 3 4 - 1 - - 24
Heavy snow 4 - 1 - - - - - - 1 - 2 8
Avalanche - - - - 1 - - - - - 1 3 5
National Environmental Agency.
Source: Ministry of Environment and Natural Resources Protection of Georgia.
2016
6.2 Number of occurred hydrometeorological hazards
2012
2013
2014
2015
Unit
55 | NATURAL HAZARDS AND VIOLATIONS OF LAW
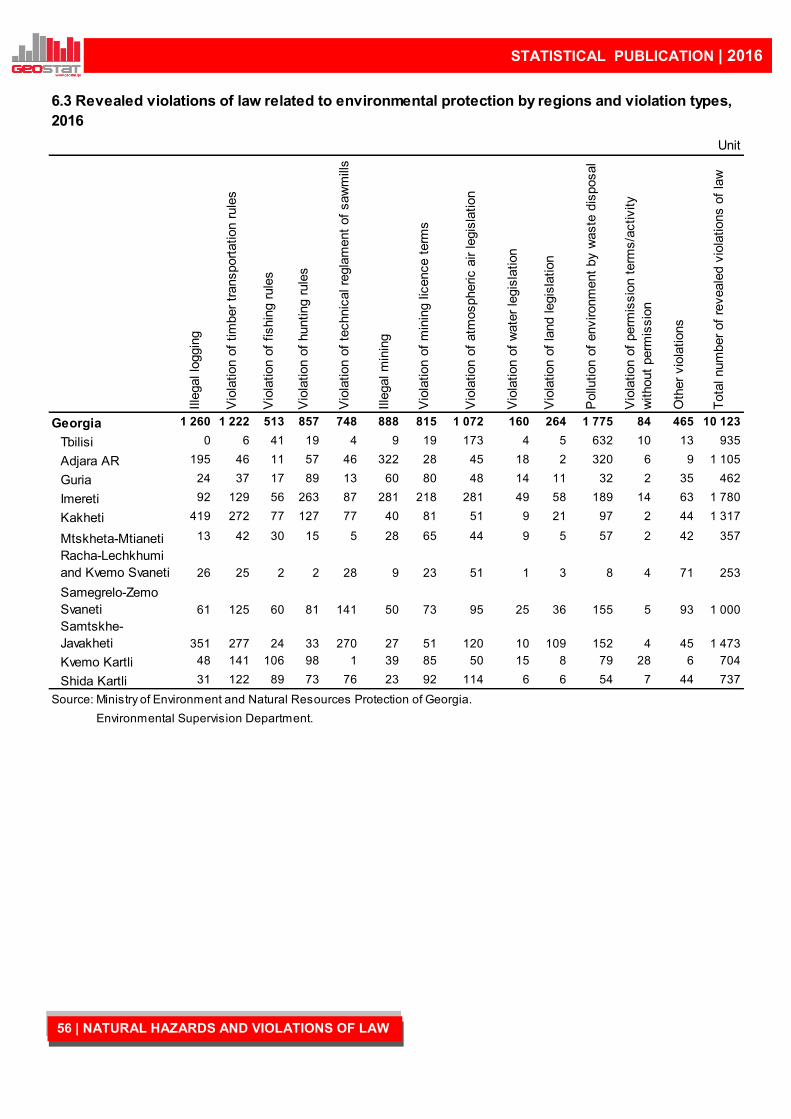
STATISTICAL PUBLICATION | 2016
Ille
gal lo
ggin
g
Vio
lation o
f tim
ber
transport
ation r
ule
s
Vio
lation o
f fishin
g r
ule
s
Vio
lation o
f hunting r
ule
s
Vio
lation o
f te
chnic
al re
gla
ment
of
saw
mill
s
Ille
gal m
inin
g
Vio
lation o
f m
inin
g lic
ence t
erm
s
Vio
lation o
f atm
ospheric a
ir legis
lation
Vio
lation o
f w
ate
r le
gis
lation
Vio
lation o
f la
nd legis
lation
Pollu
tion o
f environm
ent
by w
aste
dis
posal
Vio
lation o
f perm
issio
n t
erm
s/a
ctivity
without
perm
issio
n
Oth
er
vio
lations
Tota
l num
ber
of
reveale
d v
iola
tions o
f la
w
Georgia 1 260 1 222 513 857 748 888 815 1 072 160 264 1 775 84 465 10 123
Tbilisi 0 6 41 19 4 9 19 173 4 5 632 10 13 935
Adjara AR 195 46 11 57 46 322 28 45 18 2 320 6 9 1 105
Guria 24 37 17 89 13 60 80 48 14 11 32 2 35 462
Imereti 92 129 56 263 87 281 218 281 49 58 189 14 63 1 780
Kakheti 419 272 77 127 77 40 81 51 9 21 97 2 44 1 317
Mtskheta-Mtianeti 13 42 30 15 5 28 65 44 9 5 57 2 42 357
Racha-Lechkhumi
and Kvemo Svaneti 26 25 2 2 28 9 23 51 1 3 8 4 71 253
Samegrelo-Zemo
Svaneti 61 125 60 81 141 50 73 95 25 36 155 5 93 1 000
Samtskhe-
Javakheti 351 277 24 33 270 27 51 120 10 109 152 4 45 1 473
Kvemo Kartli 48 141 106 98 1 39 85 50 15 8 79 28 6 704
Shida Kartli 31 122 89 73 76 23 92 114 6 6 54 7 44 737
Source: Ministry of Environment and Natural Resources Protection of Georgia.
6.3 Revealed violations of law related to environmental protection by regions and violation types,
2016
Unit
Environmental Supervision Department.
56 | NATURAL HAZARDS AND VIOLATIONS OF LAW
Top Related