


Languages
Pages
Legal


National Conference
6TH & 7th March 2013
DEPARTMENT OF AGRICULTURE
GOVERNMENT OF BIHAR

Proposed Production- 232.40 L MT(2013-14)
Expected Production - 184 .00 L MT (2012-13)
Highest Production - 177.61 L MT(2011-12)
Food Grain Production-ProgressProposed ProductionTarget for 2016-17 - 252.01 L MT
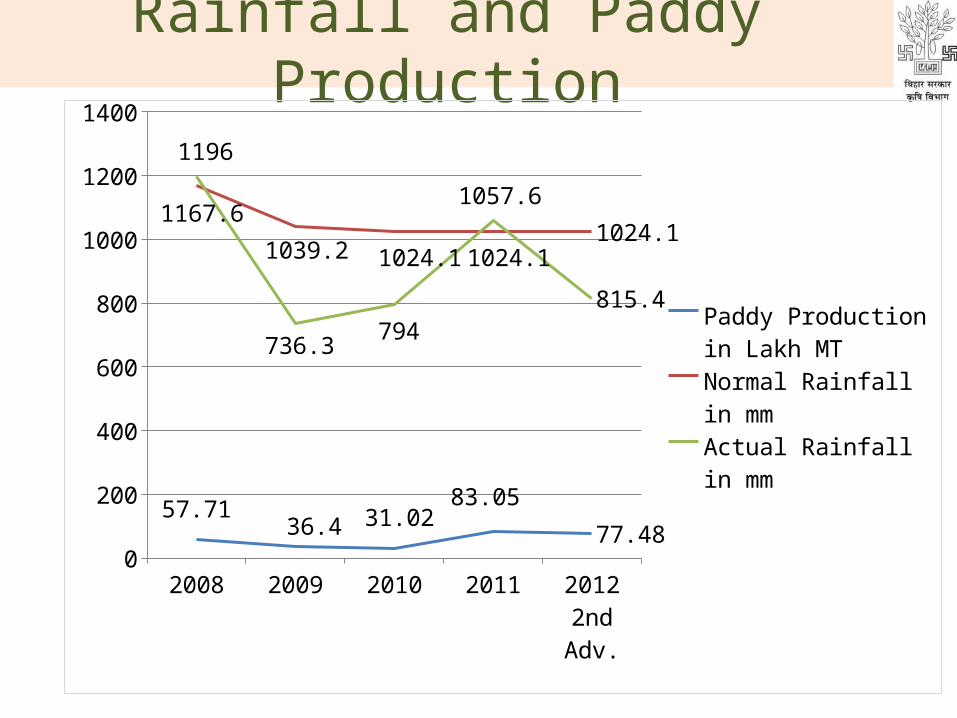
Rainfall and Paddy Production
2008 2009 2010 2011 2012 2nd Adv.
0
200
400
600
800
1000
1200
1400
57.7136.4 31.02
83.05
77.48
1167.6
1039.2 1024.1 1024.11024.1
1196
736.3794
1057.6
815.4 Paddy Production in Lakh MT
Normal Rainfall in mm
Actual Rainfall in mm

Production & Productivity of Rice
0102030405060708090
44.73
57.71
36.4 31.02
83.05
77.48
12.88
16.51
11.65 10.95
24.8925.38
Rice ProductionProductivity
Production In L MT Productivity in Qtl / Ha
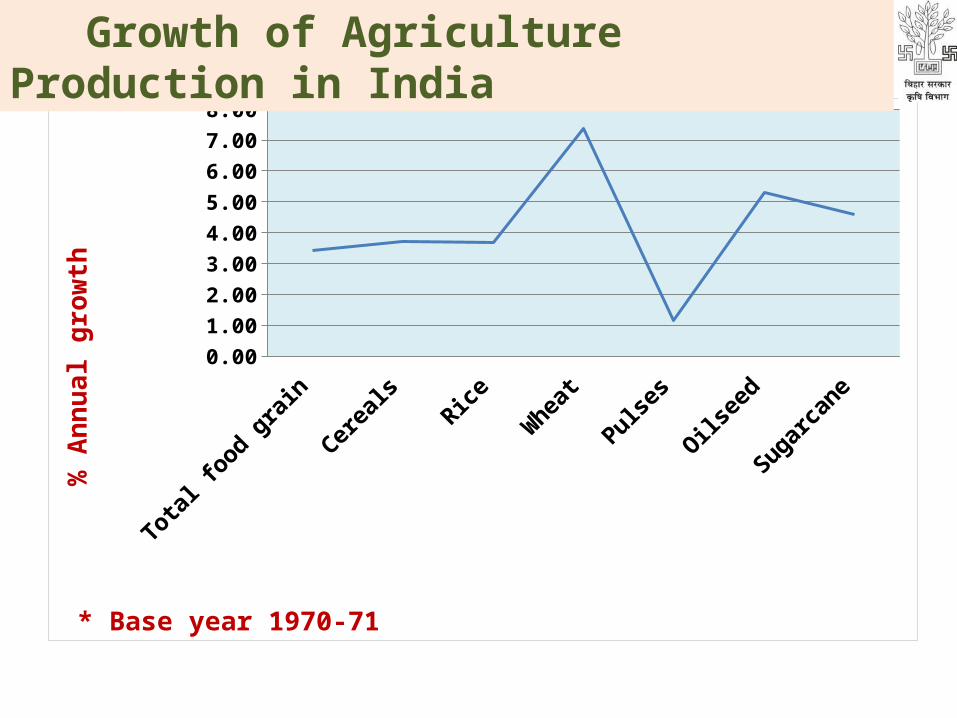
Total food gr
ain
Cereals
Rice
Wheat
Pulses
Oilseed
Suga
rcane
0.00
1.00
2.00
3.00
4.00
5.00
6.00
7.00
8.00
* Base year 1970-71
% A
nnua
l gro
wth
Growth of Agriculture Production in India

Pulse Production in Bihar
Year Kharif Rabi Summer Total2007-08 5.81 3.47 1.56 10.84
2008-09 5.75 3.54 1.54 10.83
2009-10 5.52 3.34 1.50 10.36
2010-11 5.38 3.26 1.50 10.14
2011-12 5.24 3.21 1.47 9.92
Year Kharif Rabi Summer Total2007-08 4.73 2.99 0.94 8.66
2008-09 5.27 3.58 1.00 9.85
2009-10 5.60 3.21 0.65 9.46
2010-11 4.67 3.16 0.81 8.64
2011-12 5.20 3.62 0.88 9.7
Production(L MT)
Area(L Ha)
Average Production- 9.262 L MT

Additional Pulse Production in Bihar(Summer)
Pulses Crop Area Production*
Green Manuring-Moong 6.50 1.30
Area Expansion-Moong 0.38 0.15
Demonstration-Moong 0.08 0.06 Area Expansion- Arhar on Bund 0.012 0.02
Demonstration -Arhar 0.15 0.15
Total 7.13 1.68
Area in L Ha, Production in L MT
Average Production 9.262Increase in production 1.68% increase 18.14% increase in summer 196

Crop Target Seed Required
Quality of Seed
Moong 6.50 1.30 CertifiedDhaincha 5.00 1.00 TL SeedMaize (Fodder)
1.00 0.20 Certified
Hari Chadar YojnaTarget in L Ha/ Seed in L Qtl
Summer Campaign

Time line for Summer programmeDate Activities
5 March Training of Resource Person at District level/ Selection of beneficiaries in advance
20 March Seed Availability at District/Seed Sampling/Seed Analysis
05-20 March Training cum Input Distribution at block level7-31 March Sowing 07-30 April Plant Protection MeasuresMay- June Crop cutting & Documentation
Close monitoring all critical activities at Directorate Level Distribution of Inputs only in Camps at Block Level
KHARIF 2013 STRATEGY

Major initiatives in Kharif 2013
GREEN
MANURING
SRI
TECHNIQUE
HYBRID RICE
Moong- 6.5 L HaDhaincha- 5.00 L Ha
10 L Ha
4.40 L Ha
2013 (Target)
Moong – 5.00 L Ha
2012 ( Achievement)
4.28 L Ha
5.40 L Ha

Kharif ProgrammeInterventions Area (in Lakh ha.)
Demo Other than demo
Total
SRI Paddy 2.00 8.00 10.00
Hybrid Paddy 3.40 2.00 5.40
Mechanized Transplanting 0.20 0.20 0.40
Changing Cropping Pattern to mitigate climate effect
0.70 - 0.70
Arhar/ Urad on Bund 2.00 - 2.00
Ground Nut Demonstration 0.10 - 0.10

SRI Paddy
Unit in Lakh ha.
Beneficiaries of SRI demo - 2.00
SRI by beneficiaries other than demo - 2.20
Beneficiaries of Hybrid paddy - 3.40
Beneficiaries of last years - 2.40
Total - 10.00

Timeline for KharifDate Activities
22-23rd March SRI Sabha in all Panchayat
Up to 8th April Selection of cluster & beneficiaries in advance
25-30 April Farmer’s quiz contest for General Awareness/Motivation/Identification of Resource persons for future endeavours
02-10 May District Level Kharif Conference
14-25 May Block level Kharif Training
15-31 May Input Distribution Camps at Block Level
25 May – 7th July Transplanters Training at Government Farms/Progressive Farmers Filelds
25 May- 15 July Hands-on training at farmers field
Sep- Oct. Result Demonstration & Extension
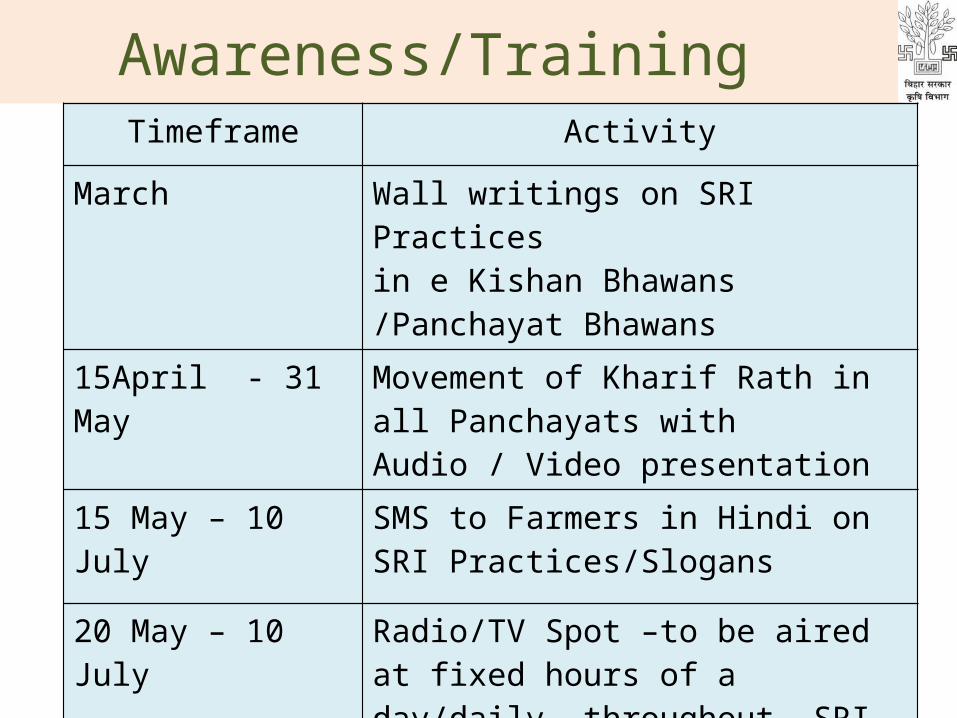
Awareness/Training Timeframe Activity
March Wall writings on SRI Practicesin e Kishan Bhawans /Panchayat Bhawans
15April - 31 May Movement of Kharif Rath in all Panchayats withAudio / Video presentation
15 May – 10 July SMS to Farmers in Hindi on SRI Practices/Slogans
20 May – 10 July Radio/TV Spot –to be aired at fixed hours of a day/daily- throughout SRI period

Trans planter’s training

Progress in Schemes (2012-13)
S. N.
Scheme Target Achievement %
1 RKVY 605.88 483.36 802 NFSM 107.01 71.41 673 BGREI 119.25 88.77 754 ISOPOM 17.81 6.41 36
Unit in Rs. Crore

Demand based targets for many implements
Power tiller, Land laser leveler, Combined Harvester, Zero tillage machines, Seed drill machines
Unit in Rs. crore
Farm Mechanization
2008-09 2009-10 2010-11 2011-12 2012-13 0
50
100
150
200
250
300
350
400
162 154
293
237
342
98128 127
210259
Target Achievement
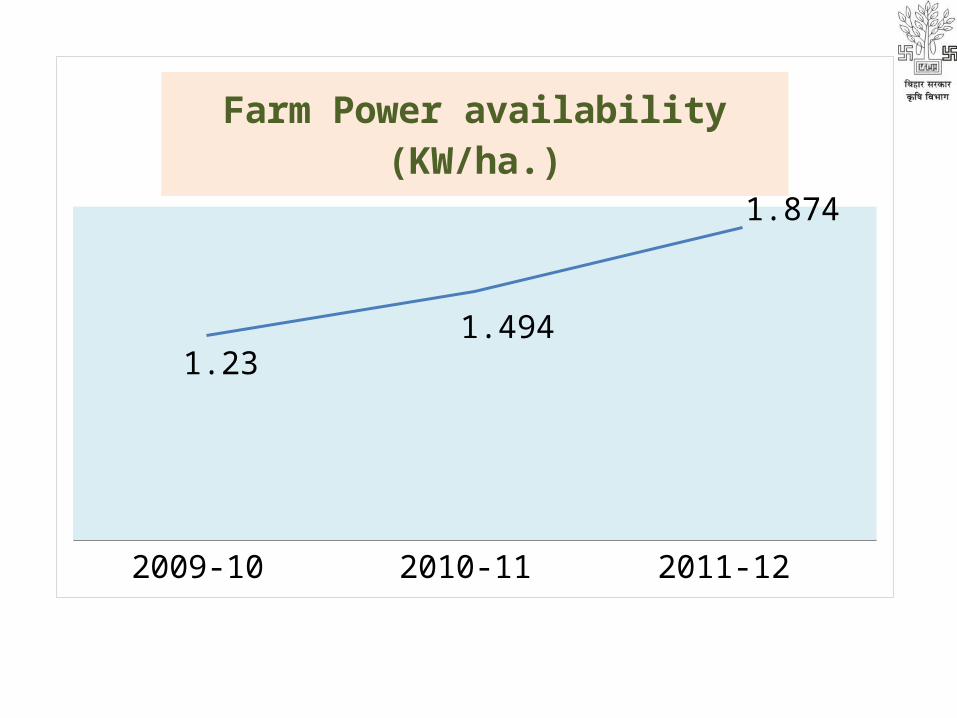
2009-10 2010-11 2011-12
1.231.494
1.874Farm Power availability (KW/ha.)
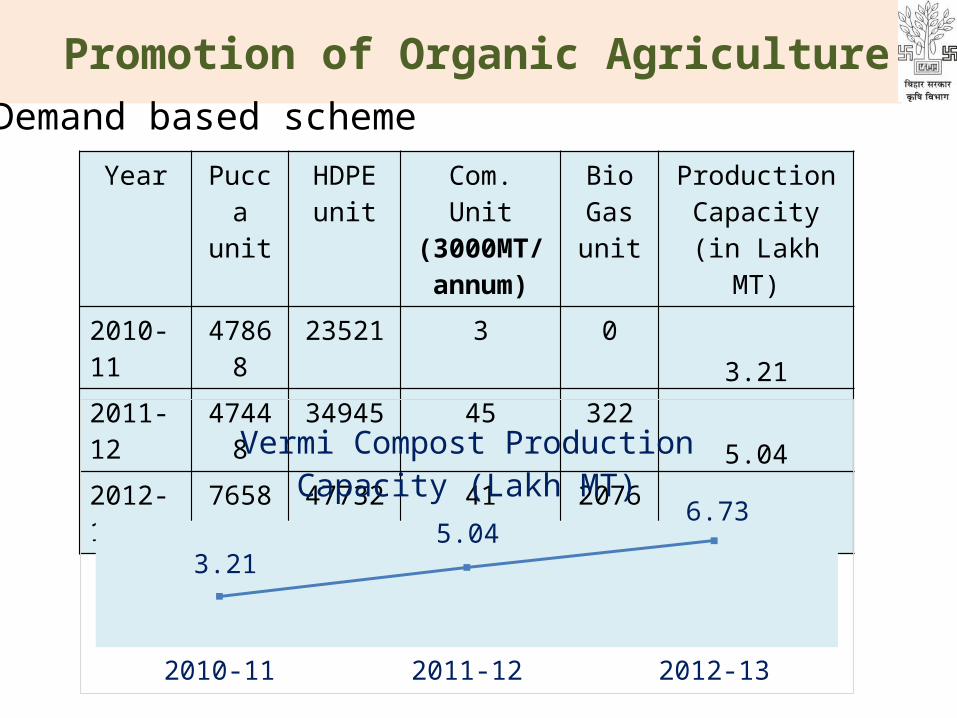
Promotion of Organic Agriculture
Year Pucca unit
HDPE unit
Com. Unit (3000MT/annum)
Bio Gas unit
Production Capacity
(in Lakh MT)2010-11 47868 23521 3 0 3.212011-12 47448 34945 45 322 5.042012-13 76584 47732 41 2076 6.73
Demand based scheme
2010-11 2011-12 2012-13
3.21
5.046.73
Vermi Compost Production Capacity (Lakh MT)

Fertilizer consumption
2008 2009 2010 2011 2012 2013*0.00
2.00
4.00
6.00
8.00
10.00
12.00
8.347.59
6.64
7.989.03 10.00
2.94 2.583.56 3.30 3.16 4.25
1.06 0.57 0.56 0.15 0.45 0.80
UreaDAP/NPKMOP
Uni
t in
Lakh
MT

Fertilizers-Issues
•Change in price policy and impact on consumption•Different Sales Tax Policy in Different states and impact on
quality and price•Timely supply & supply of allotted quantity •Rake restriction•Rake congestion-ICT intervention to minimize human errors

Issues
1. Increased Seed subsidy
2. Improvement in dibbler / power dibbler for encouraging cultivation through SWI in large scale
3. Uniform subsidy norms for farm implements
4. Establishment of FMTTI in Bihar
5. Central intervention in Promoting Farm Machinery Manufacturing Units
6. First release be made in April and Second in September to effectively implement Kharif & Rabi Programme.
7. Increase allocation as per Agriculture Road Map
8. Allocation of Central schemes have not been communicated, which impedes advance planning.

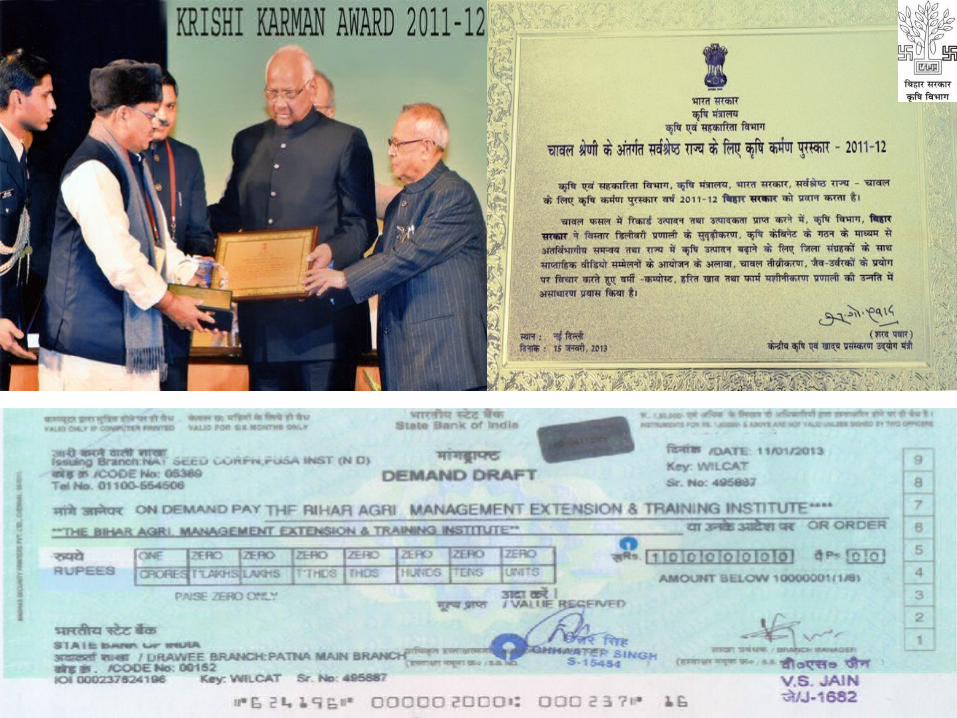
ACHIEVEMENTKRISHI KARMAN AWARD ON RICE

THANK YOU
Top Related