


Languages
Pages
Legal


Malawi Government
National Agricultural Investment Plan (NAIP)
Prioritised and Coordinated Agricultural Transformation Plan for Malawi: FY 2017/18-2022/23
January 2018


National Agricultural Investment Plan (NAIP)
Prioritised and Coordinated Agricultural Transformation Plan for Malawi: FY 2017/18-2022/23
January 2018

Ministry of Agriculture, Irrigation and Water DevelopmentP.O.Box 30134
Lilongwe 3Malawi

v
Table of Contents
List Of Acronyms ........................................................................................................................ ix
Foreword ................................................................................................................................. xiiiPreface .................................................................................................................................... xvAcknowledgements ................................................................................................................ xviiExecutive Summary ................................................................................................................. xixChapter 1: Introduction ............................................................................ .............................. 1
1.1 Background ................................................................................................................................ 1
1.2 Purpose of the NAIP..................................................................................................................... 1
1.3 Development of the NAIP ........................................................................................................... 2
1.4 Structure of the Document ........................................................................................................ 2
Chapter 2: Country and Sector Context ........................................................................................3
2.1 Overview .................................................................................................................................... 3
2.2 The Agricultural Sector .............................................................................................................. 4
2.3 Natural Resource Degradation and Climate Change .................................................................. 5
2.4 Rural Livelihoods, Gender and Youth .........................................................................................6
2.5 Recent Agricultural Sector Performance ................................................................................... 7
2.6 The Agricultural Sector Expenditure .......................................................................................... 9
2.7 Policy Context ........................................................................................................................... 10
2.8 Key Stakeholders ...................................................................................................................... 12
Chapter 3: Detailed NAIP Description .......................................................................................15
3.1 Objectives and Scope .............................................................................................................. 15
3.2 Additional Strategic Considerations ........................................................................................ 19
3.3 NAIP Architecture .................................................................................................................... 21
3.4 NAIP Programs ......................................................................................................................... 26
3.5 The Intervention Areas .............................................................................................................32
IA1: Policy, Program and Stakeholder Coordination and M&E ...................................................... 32
IA2: Strengthening Farmer Organisations ...................................................................................... 34
IA3: Public Agricultural Services Delivery ....................................................................................... 35
IA4: Diversification, availability and consumption of Nutritious Foods ........................................ 37
IA5: Food Safety and Quality Standards ......................................................................................... 38
IA6: Empowerment and Tenure Security ........................................................................................ 39
IA7: Disaster Risk Management Systems ....................................................................................... 41
IA8: Pest and Disease Management ............................................................................................... 43
IA9: Agricultural Innovation Systems ............................................................................................. 44
Table of Contents

vi
IA10: Access to Inputs ..................................................................................................................... 47
IA11: Sustainable Natural Resource Management and Climate Resilience ................................... 49
IA12: Sustainable Irrigation Development ..................................................................................... 51
IA13: Mechanisation ...................................................................................................................... 52
IA14: Agricultural Markets and Trade ............................................................................................. 53
IA15: Inclusive Private Investments in Agribusiness ...................................................................... 55
IA16: Access to a Broader Range of Agri-Financial Services Enhanced ......................................... 56
Chapter 4: Budget and Financing .............................................................................................. 59
4.1 Methodology ............................................................................................................................ 59
4.2 Budget Overview ...................................................................................................................... 60
4.3 Financing Availability ............................................................................................................... 64
4.4 Funding Mechanisms ............................................................................................................... 73
Chapter 5: Governance, Implementation and Coordination ...................................................... 75
5.1 Overall governance and Implementation Structure ................................................................ 75
5.2 Key Actors’ Roles and Responsibilities ..................................................................................... 77
National Government Agencies .................................................................................................... 77
NSAs and the Private Sector .......................................................................................................... 80
5.3 Coordination Arrangements .................................................................................................... 81
General ........................................................................................................................................... 81
Existing Coordination Structures ................................................................................................... 82
Inter-Sectoral and Inter-Ministerial Coordination ......................................................................... 82
Intra-Ministerial Coordination Arrangements ............................................................................... 86
Coordination at Decentralised Levels............................................................................................. 88
Private Sector Coordination ............................................................................................................ 90
5.4 Risks and Risk Mitigation .................................................................................................... 92
Chapter 6: Alignment, Mutual Accountability and Monitoring .................................................. 95
6.1 Alignment ................................................................................................................................. 95
6.2 Mechanisms for Mutual Accountability ................................................................................... 96
6.3 The NAIP M&E System .............................................................................................................. 97
Annex 1: High-level Results Framework and Program Structure ................................................. 102
Annex 2: Key Performance Indicators .......................................................................................... 116
Annex 3: NAIP Budget by Program ............................................................................................... 121
Program A ..................................................................................................................................... 121
Program B .................................................................................................................................... 128
Program C ..................................................................................................................................... 132
Program D ..................................................................................................................................... 135

vii
Annex 4: NAIP Budget by Intervention Areas .............................................................................. 140
Intervention Area 1 ...................................................................................................................... 140
Intervention Area 2 .......................................................................................................................141
Intervention Area 3 ...................................................................................................................... 142
Intervention Area 4 ...................................................................................................................... 143
Intervention Area 5 ...................................................................................................................... 144
Intervention Area 6 ....................................................................................................................... 145
Intervention Area 7 ....................................................................................................................... 146
Intervention Area 8 ....................................................................................................................... 147
Intervention Area 9 (part 1 - Relevant, evidence-based extension advice delivered) ................ 148
Intervention Area 9 (Part 2 – Efficient research partnerships) .................................................... 150
Intervention Area 10 .................................................................................................................... 151
Intervention Area 11 .....................................................................................................................153
Intervention Area 12 .................................................................................................................... 154
Intervention Area 13 .................................................................................................................... 155
Intervention Area 14 ..................................................................................................................... 156
Intervention Area 15 .................................................................................................................... 158
Intervention Area 16 .................................................................................................................... 159
Annex 5: DCAFS Funded Projects ............................................................................................ 160
DCAFS Pipeline Projects .............................................................................................................. 163
Appendix 5.1: Mapping of DCAFS projects by NAIP pillar .......................................................... 164
Appendix 5.2: Priorities of Larger (USD 10 million +) DCAFS Financed Projects ......................... 170
Appendix 5.3: DoNUTS funded projects .................................................................................. 171
Appendix 5.4: Projects Supporting TIP SWAP .............................................................................. 171
Annex 6: Policy and Institutional Framework .......................................................................... 172
Appendix 6.1: Linkages between the National Resilience Plan (NRP) and the NAIP .................. 188
Appendix 6.2: Linkages between the Joint Sector Plan and the NAIP ........................................ 191
Appendix 6.3: Linkages between the Climate Change Investment Plan (CCIP) and the NAIP ................................................................................................................................. 194
Annex 7: Value Chain Prioritisation ..........................................................................................195
Annex 8: List of Organisations Consulted ................................................................................ 200
Annex 9: References .............................................................................................................. 202
Exchange RateUSD 1.00 = Malawi Kwacha (MWK) 720


ix
List of Acronyms
ADD Agriculture Development DivisionADMARC Agricultural Development and Marketing CorporationAEDO Agriculture Extension Development Officer AgPER Agricultural Sector Public Expenditure ReviewAPES Agricultural Production Estimate SurveyASP Area Stakeholder PanelASWAp Agricultural Sector-Wide ApproachASWG Agricultural Sector Working GroupAU African UnionCAADP Comprehensive Africa Agriculture Development ProgramCAETS Controller of Agricultural Extension and Technical ServicesCAP-F Country Agribusiness Partnership FrameworkCAS Controller of Agricultural Services and InstitutionsCCA Country Cooperative AgreementCFA Core Functional AnalysisCGE Computable General EquilibriumCGIAR Consultative Group on International Agricultural ResearchCISANET Civil Society Agriculture NetworkCOMESA Common Market for Eastern and Southern AfricaCONGOMA Council for Non-Governmental Organizations in MalawiCSO Civil Society OrganisationDADO District Agricultural Development OfficerDAECC District Agriculture Extension Coordinating CommitteeDAES Department of Agriculture Extension ServicesDAHLD Department of Animal Health and Livestock DevelopmentDAPS Department of Agricultural Planning ServicesDARS Department of Agricultural Research ServicesDCAFS Donor Committee in Agriculture and Food SecurityDCG Development Cooperation GroupDEC District Executive CommitteeDP Development PartnerDSP District Stakeholder PanelEIF Enhanced Integrated FrameworkEMC Executive Management CommitteeEPA Extension Planning AreaFAO Food and Agriculture OrganisationFISP Farm Input Subsidy ProgramFNS Food and Nutrition SecurityFO Farmer OrganisationFUM Farmers Union of MalawiGA Grow Africa
List of Acronyms

x
GAPs Good Agricultural PracticesGBA Green Belt AuthorityGBI Green Belt InitiativeGEF Global Environment FacilityGoM Government of MalawiHACCP Hazard Analysis Critical Control PointHLF High Level ForumIA Intervention AreaICT Information and Communications TechnologyIFAD International Fund for Agricultural DevelopmentIFPRI International Food Policy Research InstituteINDC Intended Nationally Determined ContributionsIO Intermediate OutcomeIPDM Integrated Pest and Disease ManagementIPM Integrated Pest ManagementJICA Japan International Cooperation AgencyJSR Joint Sector ReviewLA Lead AgencyM&E Monitoring and EvaluationMBS Malawi Bureau of StandardsMCCCI Malawi Confederation of Chambers of Commerce and IndustryMCCIP Malawi Climate Change Investment PlanMDTF Multi-Donor Trust FundMGDS Malawi Growth and Development StrategyMITC Malawi Investment and Trade CentreMNSSP Malawi National Social Support ProgramMoAIWD Ministry of Agriculture, Irrigation and Water DevelopmentMoEST Ministry of Education, Science and TechnologyMoFAIC Ministry of Foreign Affairs and International CooperationMoFEP&D Ministry of Finance, Economic Planning and DevelopmentMoGCDSW Ministry of Gender, Children, Disability and Social Welfare MoHP Ministry of Health and PopulationMoITT Ministry of Industry, Trade and Tourism. MoLGRD Ministry of Local Government and Rural DevelopmentMoLHUD Ministry of Lands, Housing and Urban DevelopmentMoLYSMD Ministry of Labour, Youth, Sports and Manpower DevelopmentMoNREM Ministry of Natural Resources, Energy and MiningMoTPW Ministry of Transport and Public WorksMTEF Medium-Term Expenditure FrameworkMVAC Malawi Vulnerability Assessment Committee NAFSN New Alliance for Food Security and NutritionNAIP National Agricultural Investment PlanNAMIS National Agricultural Management Information SystemNAP National Agricultural Policy

xi
NAPA National Adaptation Program of ActionNAPAS New Alliance Policy Acceleration SupportNASFAM National Smallholder Farmers Association of MalawiNCCIP National Climate Change Investment PlanNEPAD New Partnership for Africa’s DevelopmentNES National Export StrategyNFRA National Food Reserve AgencyNGO Non-Government OrganisationNRP National Resilience PlanNSA Non-State ActorNSO National Statistics OfficeNSSP National Social Support PolicyODA Official Development AssistanceOPC Office of the President and CabinetORT Other Recurrent TransactionPAF Performance Assessment FrameworkPBB Program-Based BudgetingPIU Project/Program Implementation UnitPPA Policy Priority Area PPP Public-Private PartnershipPRAI Principles of Responsible Agricultural InvestmentPS Principal SecretaryRBM Reserve Bank of MalawiSACCO Savings and Credit CooperativeSADC Southern African Development CommunitySDGs Sustainable Development GoalsSGR Strategic Grain ReserveSME Small and Medium EnterpriseSMT Senior Management TeamTA Technical AssistanceTIP-SWAp Trade, Industry and Private Sector Development, Sector Wide ApproachTWG Technical Working GroupUNDP United Nations Development ProgramUNFCCC United Nations Framework Convention on Climate ChangeUSAID United States Agency for International DevelopmentVAC Village Agricultural CommitteeWB World BankWFP World Food ProgramWTO World Trade OrganisationWUA Water User Association

xii
HIS EXCELLENCY PROF. ARTHUR PETER MUTHARIKA
PRESIDENT OF THE REPUBLIC OF MALAWI

xiii
FOREWORD
The Malawi Government places highest priority on the agriculture sector due to its critical contri-butions towards socio-economic development and livelihoods of the population. Government recent-ly (2016) developed the National Agriculture Policy (NAP) to provide clear and comprehensive policy guidance in agriculture development. The policy provides clear direction and guides all players to-wards addressing challenges in the agriculture sec-tor and increasing production, productivity and farm incomes. The NAP has been aligned to Malawi’s Vi-sion 2020 and the Malawi Growth and Development Strategy III, which are the overarching long-term and medium-term development strategies, respectively. This policy sets out the agricultural transformation agenda by providing guidance through a process by which individual farm households shift their agri-cultural related activities from subsistence-oriented towards more specialized and market-oriented pro-duction.
The Government has consequently prepared the National Agriculture Investment Plan (NAIP) to op-
erationalize the NAP by guiding investment focus in the sector to accelerate agriculture transfor-mation, economic growth and poverty reduction. The NAIP is second generation framework under CAADP and is aligned to the African Union Malabo Declaration on Accelerated Agricultural Growth and Transformation for Shared Prosperity and Improved Livelihoods. It is also aligned to the global Sustainable Development Goals (SDGs), a global agenda for inclusive and equitable growth and sev-eral other International and Regional Policy Frameworks. Due to the nature of the commitments in the Malabo Declaration and the SDGs, the NAIP will require close collaboration at the level of imple-mentation with key policies and strategies in other key sectors.
Successful implementation of the NAIP will entail close coordination and collaboration between stakeholders and proper harmonization of investments and alignment of programming. Govern-ment is committed to provide leadership and coordination in the implementation of this investment plan and will facilitate other stakeholder participation. I therefore urge all stakeholders including farmers and development partners, civil society and private sector to cooperate with the govern-ment in driving the NAIP agenda forward. Fellow development players, I earnestly appeal to each one of you to shift from treating this NAIP as “Business as Usual” to embracing it as a means of ac-celerating an agricultural transformation agenda in Malawi.
Together, we can transform agriculture, transform the economy and transform lives.
HIS EXCELLENCY PROF. ARTHUR PETER MUTHARIKAPRESIDENT OF THE REPUBLIC OF MALAWI


xv
PREFACEThe National Agriculture Investment Plan (NAIP) is a medium-term investment framework for the agricultural sector to be implemented over a five year period (2017/18- 2022/23). It is the second Malawi NAIP, building on achievements and lessons from its predecessor, the Agriculture Sector Wide Approach (ASWAp) which was implemented between 2010/11 and 2014/15. The NAIP like its predecessor, is aligned to the Comprehensive Africa Agriculture Development Program (CAADP) and the African Union Malabo Declaration on Accelerated Agricultural Growth and Transformation for Shared Prosperity and Improved Livelihoods. It is also aligned to the national development policy blue print, the Malawi Growth and Development Strategy (MGDS III) and serves as the main implementation vehicle for the 2016 National Agriculture Policy (NAP).
NAP is linked to policy and strategic frameworks in adjacent sectors like trade, nutrition, resilience, climate change, lands etc. Following its linkage to the Malabo Declaration, MGDS III, the NAP and other sector policies, its implementation goes beyond the mandate of the Ministry of Agriculture, Irrigation and Water Development (MoAIWD) and requires the commitments, inputs and strategic partnerships of several other ministries, along with Non State Actors (NSAs) including the private sector. The NAIP implementation, therefore, will involve coordination of a broad range of players including: Government; Non State Actors (NSAs) such as Non-Governmental Organisations (NGOs) and Civil Society Organisations (CSOs), the private sector (including farmers, farmer organisations and private sector companies), research and academia, and Development Partners (DPs). The NAIP development process involved extensive consultative process of all key sector stakeholders at various levels including: Government and its agencies, civil society, farmers’ organizations, private sector and development partners. The NAIP has also gone through a number of validation meetings within government and wider stakeholders and, therefore, it contains common agreed sector priorities, targets and investments aspirations. It is my strong belief, therefore, that the same commitment spirit and collective effort demonstrated during the preparation of the NAIP will be extended to its implementation. While Government is committed on its part to financing and implementing this NAIP, I wish to appeal to all stakeholders: the Development Partners, Farmers, Farmer Organizations, Civil Society and Non-Governmental Organizations and Private Sector to harmonize and align their programming to the objectives of the NAIP and wider government development objectives. Furthermore, I would like to appeal for enhanced and coordinated tracking of results to NAIP targets and indicators. Government is committed to providing leadership and coordination to the NAIP implementation and would like to ask all players to work with and support the established institutional structures of the NAIP. This among others require mutual accountability by all players with regard to resource inputs, alignment to priorities, and more importantly results of our efforts.
May God bless Malawi.
Hon. Joseph M. Mwanamvekha, MPMINISTER OF AGRICULTURE, IRRIGATION AND WATER DEVELOPMENT


xvii
ACKNOWLEDGEMENTSThe Ministry of Agriculture Irrigation and Water Development (MoAIWD) provided central leadership in the formulation of the NAIP. A number of individuals and organizations were engaged and involved in the process in one way or another. The Ministry therefore wishes to express its appreciation to all of them for their dedication and commitment to this exerciseThe Ministry wishes to single out the following:• Food and Agriculture Organization of the United
Nations for technical support: The FAO Country Representative Ms. Florence Rolle is commended for facilitating mobilization of the expert team from the FAO Investment Centre, led by Ms. Linny Kaspersen, Mr. Frank Hollinger and a team of national consultants.
• The Government of Germany for the financial support through the Enhanced Capacities for Effective Mobilization and use of Resources for Food Security & Nutrition Projects implemented by FAO. This included various stakeholder workshops, Government planning and coordination meetings, and the mobilization of FAO Technical Expert and consultants.
• The Department of planning, (MoAIWD), under the leadership of Mr. Alex Namaona for the facilitation and secretariat roles;
• The ASWAp Secretariat, MoAIWD, under the leadership of Nelson Mataka for guiding the Technical Team.
• Mr. Readwell Musopole, Deputy Director, Department of Planning, MoAIWD for the overall coordination of the exercise.
• The Technical Team which comprised all Technical Departments in the MoAIWD, other Government ministries and Departments, Development Partners, Farmers Organizations, Civil Society and Private Sector.
• All Directors, Programme Managers and DADOs for their expert input during the focused consultations.
• IFPRI and NAPAS team for their technical input on value chain studies and logistical support during the final editing of the NAIP.
• The AUC Independent Technical Team of reviewers led by Dr. Greenwell Matchaya.• The Director of Agriculture Extension Dr. Jerome Nkhoma and his team for final editing, design and
printing the document.The spirit demonstrated at the time of the NAIP preparation can only be wished to be extended during implementation and the result will be successful delivery of the investment plan.
Gray S.V.K. Nyandule - Phiri
SECRETARY FOR AGRICULTURE, IRRIGATION AND WATER DEVELOPMENT


xix
Executive Summary
The National Agriculture Investment Plan (NAIP) is the framework guiding investment in Malawi’s agricultural sector over the next five years. Its policy foundations are mainly the Malawi Growth and Development Strategy (MGDS), the National Agricultural Policy (NAP), the CAADP Compact and the Malabo Declaration.
The NAIP succeeds and builds on the achievements and lessons learned under the Agricultural Sector-Wide Approach (ASWAp). Whilst the Ministry of Agriculture, Irrigation and Water Development (MoAIWD) will be the lead implementing agency for the NAIP, other ministries, departments and agencies play important roles. The NAIP provides a framework to coordinate and prioritise investments by government agencies, development partners, civil society, farmer organizations and the private sector.
The NAIP focuses on public investments, while recognising that agricultural growth must be driven by investments of private actors. It therefore, supports critical policy, legal and regulatory reforms and will strengthen public institutions to fulfil their mandates. It further provides a framework for effective coordination within the public sector and between the public and private sectors.
The NAIP departs from its predecessor (the ASWAp), by adopting a matrix structure comprising four Programs and 16 Intervention Areas (IAs). The four Programs, their objectives and estimated costs (USD millions) are:
Program Objective USD m
A. Policies, institutions and coordination
To improve policy and regulatory environment , stakeholder coordination and accountability 372
B. Resilient livelihoods and agricultural systems
To strengthen resilience of livelihoods and natural resource base for agriculture. 925
C. Production and productivity To increase production and productivity of a more diversified agricultural sector 994
D. Markets, value addition, trade and finance
To enhance market access, value addition, trade, and access to finance 927
Total Cost USD millions 3,218
The 16 IAs cluster activities in technical areas that are needed to achieve the objectives of the NAIP. The IAs cut across the four Programs, with each IA contributing to more than one Program. The table below presents the intervention area, the corresponding outcome and budget.
Intervention Area Outcome USD m1. Policy, Program and Stakeholder
CoordinationEffective mechanisms for multi-sectoral and multi-stakeholder coordination to support Program implementation and M&E introduced
182
2. Farmer Organisations Strengthened performance and outreach of farmer organisations
16
3. Public agricultural services delivery
Strengthened MoAIWD’s capacity to provide Relevant, market-oriented agricultural extension services
93
4. Food and Nutrition Security Available diversified and nutritious foods consumed 209
5. Food safety and quality Food safety and quality standards established and mainstreamed
11
6. Empowerment and tenure security
Empowered Women and youth and enhanced land tenure security
33
Executive Summary

xx
Intervention Area Outcome USD m7. Disaster risk management Strengthened Capacity to manage disasters and reduce their
impact 413
8. Pest and disease management Major pests and diseases controlled and major outbreaks managed effectively
232
9. Agricultural innovation systems Demand-driven, pluralistic innovation systems for relevant technologies generated and disseminated
432
10. Access to inputs broader range of quality inputs at reasonable costs timely accessed by farmers
361
11. Natural resource management and Climate Change
Sustainably managed natural resources and enhanced climate resilience of production systems
65
12. Irrigation development Sustainably increased use of irrigation (increased use of sustainable irrigation?)
396
13. Mechanisation Improved access to and use of mechanisation services 55
14. Agricultural markets and trade Enhanced efficiency and inclusiveness of agricultural markets and trade
522
15. Investments in agribusiness Increased agro-processing, value addition and investments into the domestic markets
168
16. Access to financial services Improved access to agricultural finance by all target groups 31
Total Cost USD millions 3,219
The NAIP will build on funding mechanisms as was in the ASWAp and continue to move towards Program based approach and away from the project-based approach. The Development Partners have committed to provide harmonised support as part of a transition from short-term project financing to coordinated financing of the investment Program, making greater use of government systems. Several different financing scenarios are considered. The USD 3.219 billion cost of the NAIP is expected to be financed mainly from Government, the development partners and the private sector (under PPP arrangements). However, despite the available funding commitments, indications are that there is a funding gap of around USD 330-780 million, which is 10-24% of the total cost.
MoAIWD as the lead agency will be responsible for overall implementation of the plan, policy guidance, sectoral planning, coordination and M&E. However, other ministries, parastatals, and non-state actors will also have important roles to play. These roles will be performed within a well-defined framework for governance, management and coordination. The NAIP will be implemented within the government wide and sector specific decentralization framework taking into account the recommendations of the recent Core Function Analysis in MoAIWD. The Executive Management Committee (EMC) will act as the overall governing body of the NAIP while the NAIP Secretariat in the Planning Department shall provide overall coordination of the NAIP. The Plan defines the detailed coordination arrangements to be used within MoAIWD and between MoAIWD and the other participating ministries and agencies, non-state actors and the private sector.
To effectively monitor the NAIP, a robust Monitoring and Evaluation framework will be implemented. Specifically, the National Agriculture Management Information System shall be implemented to provide real time data for efficient decision making.

1
National Agricultural Investment Plan
Chapter 1: Introduction
1.1 Background1. Malawi is endowed with land suitable for both rain-fed and irrigated agriculture. However,
the agricultural sector operates far below its potential and the country faces periodic food shortages. Agriculture is critical for achieving national objectives such as broad-based growth, poverty reduction, food and nutrition security, resilience, climate change adaptation and trade development. A targeted and well-balanced portfolio of investments in the sector is key for achieving these objectives
1.2 Purpose of the NAIP2. The National Agricultural Investment Plan (NAIP) is the medium-term investment framework
for the agricultural sector covering a five-year period (FY2017/ 2018- FY2022/2023. The NAIP provides a framework to coordinate and prioritise investments by various government agencies, Development Partners (DPs) and None State Actors (NSA) in the sector. It is the successor framework , built on achievements and lessons learned under, the Agricultural Sector Wide Approach (ASWAp), which was implemented from 2011/2012 to 2015/2016 financial years. In particular, the NAIP is guided by the Malabo Declaration on Accelerated Agricultural Growth and Transformation for Shared Prosperity and Improved Livelihoods signed by the Heads of State in June 2014. NAIP is the main implementation vehicle for the National Agriculture Policy (NAP) and as such, it places emphasis on strengthening implementation capacities and coordination of various actors involved in its implementation. This includes alignment with related policies and investment frameworks in areas such as trade, resilience, climate change, nutrition and social protection; and also improved coordination within the agricultural sector as well as strengthening the prominent role of NSAsand the private sector. Whilst the Ministry of Agriculture, Irrigation and Water Development (MoAIWD) will be the lead implementing agency, other ministries will also play important roles in its implementation.
3. The NAIP focuses on public investments, while recognising that broad-based agricultural growth must be driven by investments of private actors, ranging from smallholder farmers to companies engaged in input supply, production and value addition. The NAIP recognises that willingness of these actors to invest depends on an enabling policy and investment environment. As such, the framework supports critical policy, legal and regulatory reforms. It will, therefore, strengthen public institutions to fulfil their mandates for services and public investments. The NAIP also creates appropriate coordination mechanisms within the public sector and between the public and private sectors, including farmers and NSAs. While private investments are critical to the success of the NAIP, they are very difficult to plan and budget over a five-year period in a volatile and diverse sector such as agriculture, and any such attempts would be highly speculative. Hence, private investments are only included in the NAIP budget and results framework to the extent in which they co-finance public investments and service provision under the plan, except for a few cases where clear private sector investment commitments do exist.
4. The NAIP ensures that sectoral growth is inclusive, environmentally sustainable and climate-smart. This requires close coordination across related policy areas, such as social protection, gender, youth, environment, climate change, nutrition and health in order to maximise synergies. The NAIP will therefore, supports well-coordinated investments at the boundaries between agriculture and other sectors, where this is necessary to achieve its objectives.

2
National Agricultural Investment Plan
1.3 Development of the NAIP5. The NAIP has been developed through an extensive consultative and participatory process
involving all key stakeholder groups. The process sufficiently built on lessons from terminal review of the predecessor investment framework (ASWAp), taking into account achievements made and recommendations going forward. The consultations were organized with different constituent groups such as technical departments of the Ministry of Agriculture, Irrigation and Water Development, other line Ministries, Private Sector as well as Civil Society Organisation Consultations were aimed at prioritizing and quantifying proposed interventions, costing, financial flows mapping and identifying value chains. Consequently, the budget was contributed by a range of stakeholders (i.e. MoAIWD technical departments, MoITT and MoLHUD).
6. The NAIP development process was facilitated with financial and technical support from the Food and Agriculture Organization of the United Nations working closely with the Technical Team comprising of MoAIWD, representatives of other ministries, civil society, farmers’ organizations and the private sector. The start of the formulation process coincided with the launch of the domestication exercise of the Malabo Declaration. This was crucial as the NAIP is the delivery mechanism of the continental aspirations as well as the newly approved National Agriculture Policy. To ensure that the NAIP is well informed by all subsector processes and also that it optimizes various technical inputs, different stakeholders were consulted and contributed their inputs towards various sections of the document. Just to mention a few, NAPAS Malawi1 conducted value chain studies and computable general equilibrium (CGE) modelling and Donor group contributed to the portfolio analysis of donor supported projects as captured in the database. Following production of the draft NAIP, a validation workshop was held, which provided an opportunity for various stakeholders to authenticate the plan. it. This was critical inorder to strengthening ownership, accountability and cultivating strong commitment to the NAIP implementation.
1.4 Structure of the Document7. The rest of the document is structured as follows: Chapter 2 provides an overview of the
country context including the agricultural sector, its recent performance and the key policies, implementation frameworks and actors. Chapter 3 is a detailed description of the NAIP. It first introduces the NAIP scope, objectives and expected results; supported by a narrative on the rationale (theory of change); as well as NAIP Programs and Interventions Areas. It then describes the Programs and IAs in detail including their focus, expected outcomes and outputs. Chapter 4 presents the aggregate NAIP budget organised by Program, IA, year, and budget classifiers. It is supported by a detailed budget file which visualises the budget from different angles. Chapter 5 describes the implementation arrangements including the governance structures, management and coordination. Finally chapter 6 discusses alignment and mutual accountability mechanisms. The document also includes a number of Annexes as follows:
• Annex 1 provides a detailed overview of the NAIP in tabular form including the high-level results framework, and the outputs organised by Program and Intervention Area.
• Annex 2 contains the impact and outcome indicators and related targets. • Annexes 3 and 4 provide the detailed budget by Intervention Area and Program. • Annex 5 provides an overview of donor financing for agricultural sector development.• Annex 6 provides a review of the policy and institutional framework.• Annex 7 describes the process of prioritising value chains.• Annex 8 provides a list of the organisations that participated in the consultations for
formulation of the NAIP.• Annex 9 provides a list of references.
1New Alliance Policy Acceleration Support implemented by Michigan State University (MSU) in collaboration with International Food Policy Research Institute (IFPRI).

3
National Agricultural Investment Plan
Chapter 2: Country and Sector Context
2.1 Overview
8. Malawi is one of the most densely populated countries in the world, with 178 persons per square kilometre of land, and 85% of the population living in rural areas. The majority of the country’s 16.8 million people live in the Central and Southern Regions (42%, and 45%) respectively (NSO, 2008). Malawi’s population is young, with 46% below 15 years of age, resulting in a youth bulge entering the labour market within the next decade. The UNDP Human Development Index2 of 2015 ranks Malawi 170th out of 188 countries, with an improvement of only one position in the rankings since 2010. According to the Integrated Household Survey (IHS3) of 2010/11, only 49% of the population was above the national poverty line and only 58% of the population was food secure. Poverty prevalence and severity is higher in the densely populated regions, especially in the South, in the extreme North, and areas along the lake shore (Mkandawire, 2015). Poverty is mainly rural, with 57% of persons in rural areas below the poverty line, against 17% in urban areas. The depth of poverty measured by the poverty gap index was also higher in rural than in urban areas (19.2% versus 7.1%, respectively)3 , with 28% of the rural population categorised as ultra-poor.
9. Malawi’s recent performance on key development indicators shows a mixed picture. While economic growth averaged 4.3% between 2000 and 2014, annual population growth rates of 3.1% reduced GDP growth per capita to 1.3% on average. Progress has been made on other indicators such as prevalence of vitamin A deficiency disorders that has reduced from 22% to 4%, increased access to primary education and infrastructure development. Despite this notable progress, levels of poverty and food insecurity have remained high and deteriorated with recent droughts. Approximately 70% of the population is still below the international poverty line (USD 1.90/day in 2011 PPP prices), down from 74% in 2004/054 . Food insecurity has worsened in recent years. In 2013, 84% of poor rural households were classified as food insecure, against 67% in 2010. Progress on nutrition varies among indicators: while stunting rates have fallen strongly from 47% in 2010/11 to 37% in 2015/16, the number of underweight children has only slightly decreased from 13% to 12% during the same period (NSO, 2017). Wasting of children under five is below the Malabo target for 2025 of 5%. The National Multisectoral Nutrition Policy also highlights micronutrient deficiency and underweight in women as major concerns.
10. Malawi is ranked 110th out of 190 on the World Bank’s Ease of Doing Business Index, a major improvement from 2016, when she was ranked 133. This improvement is mainly attributable to progress made on three indicators: access to credit, access to electricity, and ease of starting a business. The country scores relatively high on indicators related to construction permits (55), registering property (95) and paying taxes (102). Ratings are lowest on starting a business (150) and generating electricity (169) despite improvement in the indicators as well as on resolving insolvency (162). Malawi’s ranking in the Enabling the Business of Agriculture index compiled by the World Bank is 35 out of 62 countries. The index includes eight parameters: seed, fertiliser, machinery, finance, markets, transport, water and ICT. Malawi’s ranking is weighed down by poor scores on access to seed, fertiliser and ICT services. Issues related to seed and fertiliser
2 The Human Development Index (HDI) is a composite statistic of life expectancy, education, and income per capita indicators, which are used to rank countries into four tiers of human development. A country scores higher HDI when the life expectancy at birth is longer, the education period is longer, and the income per capita is higher3 Poverty gap is the average consumption shortfall of the population relative to the poverty line.4 Projections based on IHS 3 data.

4
National Agricultural Investment Plan
registration process stand out, as Malawi has the most expensive (Across the 62 countries sampled, the average cost to register a new fertilizer product is 171.7% of income per capita, and it is most expensive in Malawi (totalling 3030.5% of income per capita) and lengthiest fertiliser registration process of all 62 countries (913 days). Registering and releasing new seed varieties takes 579 days on average .
11. Despite recent improvements, access to finance remains a key constraint facing small firms and farmers. High interest rates, demanding collateral requirements and complex loan application procedures are the main access barriers. The second most important constraint relates to the high cost and unreliable electricity supply, especially in rural areas which undermines the development of agro-processing, cold storage and communications. For private sector development, access to land, fair and transparent market interventions, including import and export regulations, remain challenges, along with high transportation costs.
2.2 The Agricultural Sector12. Agriculture remains the backbone of the economy and vital for the livelihoods of most Malawians
including national food self-sufficiency and household food and nutrition security. Agriculture generated approximately 28% of GDP, 65% of employment, and 63% of export earnings in 2015, and is even more important if forward and backward linkages are factored in. Considering the linkages of agricultural production and processing with input supply, trade and transport service, the broader Agri-food system contributes 44% to GDP and generates 74% of employment5. Agriculture is also critical for Malawi’s trade. While balance of trade for agricultural products is positive, the country faces a large overall trade deficit importing more than twice of its exports. The main agricultural exports include tobacco followed by sugar, tea, coffee and cotton. In turn, agricultural products only accounted for 10% of total merchandise imports in 2015.
13. Crops dominate the agricultural sector, accounting for 17% of GDP in 2014 followed by forestry (9%). The country’s most significant agricultural commodities are maize, cassava, potato, peas, beans, rice, groundnuts, bananas, tobacco, and sugar, which together account for approximately 80% of Malawi’s agricultural production value. Livestock and fisheries sub-sectors are comparatively small, contributing 3% and 1% to national GDP and 10%, and 4% to agricultural GDP, respectively. However, their share in employment generation is much higher than their contribution to national GDP, and they are important sources of food and nutrition security.
14. Crop production is concentrated on one main food crop (maize) and one main cash crop (tobacco). Maize is by far the most dominant crop grown by almost every farmer in Malawi and accounting for about 50% of the entire planted area. As the main source of food, maize has been at the centre of agricultural policies and public expenditures for decades. At the same time, the maize-centred approach to food security has contributed to a limited dietary diversity at household and national levels such that only 25% of the population are able to meet the dietary diversity. Regarding livestock, around 4.5 million farmers are rearing different types of livestock with an average of 1.4 Tropical Livestock Units per household.
15. Tobacco has been the major cash and export crop since the 1980s, accounting for between a quarter and a half of Malawi’s exports. Initially restricted to estates, smallholder production now accounts for 95% of the total production. Under the Integrated Production System production, buyers provide finance, inputs and extension services to farmers. However, given the long term negative market trend of tobacco, efforts are underway to promote diversification into food and other cash crops, as well as steps into value addition.
5Computations based on the RIPA model developed by IFPRI and IFAD based on a Social Accounting Matrix and household survey data, 2017.

5
National Agricultural Investment Plan
16. The dominance of maize and tobacco renders the country vulnerable to production and market risks related to these two commodities, hence, diversification of production and exports has become a priority. The other food crops apart from maize are cassava, sweet potato, Irish potatoes, groundnuts, beans, pigeon peas, cow peas, rice, and a range of vegetables. Other cash crops include sugarcane, cotton, coffee, tea, macadamia nuts, soybeans, other oilseeds and chillies. Together, maize, potatoes and cassava account for two thirds of the caloric intake.
17. Despite the high dependence of the economy on agriculture, commercialisation of the sector is limited. Overall, it is characterised by low productivity, low levels of improved farm input use, limited private investment, and low mechanisation levels. The average added value per agricultural worker during 2005-12 amounted to USD 209, far below the Sub-Saharan average of USD 680.
18. Historically, Malawi had a dual agricultural structure: the smallholder sub-sector farming on communal land, and the estate sub-sector farming on leasehold and freehold land. The major proportion of estate subsector was created after independence when a million hectares were converted into leasehold and transferred to commercial farmers. On the other hand, there are about 2.6 million farmers on 3.3 million hectares under customary tenure. Reliable current data on land size distribution does not exist, as the latest agricultural census was conducted in 2006. However, recent studies suggest that larger farm sizes are often not associated with higher production and productivity. While larger farms and estates use modern inputs more frequently, the ratio of cultivated land area to total land holding size declines as farm size increases. Only 15% of land owned by estates was cultivated in 2006.
2.3 Natural Resource Degradation and Climate Change19. Agriculture is increasingly vulnerable to natural shocks and this is worsened with climate change.
High population growth compared to available cultivable land has led to increased pressure on land and other natural resources resulting in increased land fragmentation, degradation and deforestation. Agricultural practices are inadequately adapted to intensive land use and weather extremes. Loss of topsoil from agricultural land is substantial, largely because of inappropriate soil management practices. Climate change induced extreme weather events such as droughts and floods are increasingly affecting agricultural production and rural livelihoods. The country experienced consecutive severe droughts in 2014/15 and 2015/16, and floods in 2015/16. High rates of rural poverty mean that climatic shocks often have devastating and long-lasting impacts on the livelihoods of smallholder farmers. While on average, 1.5 million people required humanitarian support during the past five years, the number sharply increased to 6.8 million during 2016/176 .
20. Climate change is expected to increase temperatures by 1.1-3.0°C by the 2060s, and the intensity of dry and wet seasons will increase resulting in longer dry spells and more floods. Medium-term climate projections raise concerns for all key agricultural sub-sectors in Malawi. Maize is sensitive to temperature and precipitation change, meaning that most climate scenarios predict decreasing yields. Livestock productivity is likely to be impaired by heat stress, and reduced grazing availability will pose a feed issue if Malawi’s wetlands degrade or even dry out under new conditions, as some studies predict. Less frequent yet heavier rainfall is expected to give rise to higher incidences of livestock diseases. Climate change is also anticipated to impact fisheries, increased incidences of drought, changes in surface water temperature as well as pH levels and dissolved oxygen in Malawi’s five lakes and river systems .
21. The vulnerability of agricultural production to climate risks is exacerbated by the reliance on rain fed farming. While the country registers good rainfall levels in average years, and has substantial surface water resources, only about 107,000 hectares are currently developed for irrigation farming. This is about a quarter of the potential irrigable area identified in the Irrigation Master Plan. Slightly more than half of the irrigated land is cultivated by smallholders.
6 Based on data from the Malawi Vulnerability Assessment Committee (MVAC).

6
National Agricultural Investment Plan
2.4 Rural Livelihoods, Gender and Youth
22. Around 11 million Malawians live in rural areas, majority of them are poor and depend on agriculture for their livelihoods. Most of these rural households are engaged in subsistence farming, with less than a fifth producing marketable surpluses. This is mainly due to land and labour constraints. Land holdings average 0.8 hectares but 30% of farmers cultivate less than half a hectare. HIV remains one cause of labour constraints, with 7.4% of rural population aged 15-49 being positive. Around 70% of women managing farming plots are widowed, divorced, or separated, and have limited access labour or mechanisation. Most smallholder farmers cultivate customary land using hand tools and minimal inputs and technologies
23. Women represent 52% of the population and play an essential role in the household as food producers and carers, as well as engaging in small-scale trading activities. Over half of the farmers in Malawi (59%) are women. Around 30% of households are female headed and are particularly vulnerable to shocks as most of them do not have assets or savings. Women in Malawi produce up to 80% of the food which fetches low prices due to limited access to markets. Most women have only small plots and often sell labour to those who can afford to hire labour within their communities. . Women also have a wide range of chores in the household. Men play a key role in specific stages of the agricultural cycle such as preparing fields, marketing and deciding how to use income. Rural men tend to have increased involvement in cash crops and casual employment as agricultural labourers.
24. In general, Malawi’s female farmers are less productive (by 28 percent on average) compared to their male counterparts. This is so because women frequently have unequal access to key agricultural inputs such as land, labour, knowledge, fertiliser, improved seeds, and mechanization. However, according to “The Cost of the Gender Gap in Agriculture” Malawi stands to gain if women are more involved in the entire agricultural value chain. The report estimates that closing the gender gap would result in a 7.3% increase in crop production, USD 100 million increase in GDP and lift 238,000 people out of poverty.
25. Malawi ranks near the bottom of the UNDP Gender Inequality Index: 173rd of 188 countries ranked. The main dimensions of inequality include: (i) unequal workloads between men and women; (ii) control of productive assets is in the hands of men; (iii) limited participation in household and community decision-making; (iv) lower literacy rates (57% women versus 74% for men); (v) lower access to opportunities and services; and (vi) as the prime victims of gender-based violence. Plots of cultivated land among women-headed households are smaller than those of men. This is consistent with the fact that 57% of women-headed households live under the poverty line.
26. Youth (aged 10-35) constitute over 40% of the population. Custom and tradition entail the submission of youth to parents and other adults. Youth do not generally participate in household or community level decision-making processes and their views are unrepresented in wider societal circles. In rural areas, youth and younger households tend to be poorer than those headed by older adults due to limited access to assets particularly land. This typically leaves youth locked in unpaid or subsistence farming.
27. Youth development and empowerment are priority features of MGDS III, and the National Youth Policy of 2013 aims to stimulate the participation of youth in Malawi’s development. The policy recognises the role that youth play in rural development and the pressing need to render agriculture attractive to youth. Policies and programs contributing to rural development are expected to emphasise the need to involve youth for effective gender mainstreaming.

7
National Agricultural Investment Plan
2.5 Recent Agricultural Sector Performance
28. Agricultural growth has been highly volatile over the past five years. While growth rates at and above 6% were achieved in 2011, 2013 and 2014, lower or negative growth rates, driven largely by climatic conditions, were registered in other years. The sector was also affected by macroeconomic imbalances. After floating the exchange rate in 2012, the Kwacha depreciated by 50% making exports more competitive but increasing the costs of imports, such as fertilisers. Inflation has been above 20% between 2012 and 2016 but has recently receded significantly to single digit (9.8 percent as at March 2018). Reduced donor budget support triggered increased domestic borrowing and high Treasury bill rates have been crowding out bank lending. Macroeconomic instability has led to interest rates of 35% or more, further constricting growth. Furthermore, some unfavourable economic policies, have restricted private investment in export-oriented agriculture.
29. Overall, commercialisation of the agricultural sector is limited by poor market access, limited infrastructure and weak coordination of most agricultural value chains. However, there are some encouraging developments such as commodity exchanges and warehouse receipt systems (including related legal frameworks about to be enacted). There are also several value chain coordination platforms (cotton, rice, legumes, roots and tubers).
30. Crops: Agriculture crop production in Malawi can be categorised into food crops and cash crops. Maize, rice, millet, bananas and roots and tubers are Malawi’s food crops while tobacco, tea, sugar, coffee, cotton and grain legumes and oil seeds are the country’s cash crops. Maize is the main staple food grown by almost all farmers in Malawi. Its production has substantially increased. For example, maize production has increased from 1.7 million tonnes before 2005 to an average 3.3 million tonnes in 2015/16. This increase is attributed, among others, to the increased use of fertiliser, and use of improved maize seed varieties. Fertiliser use per hectare has increased from 30 to nearly 40 kg. This is largely attributed to the Farm Input Subsidy Program (FISP) providing subsidised seeds and fertiliser to farmers since 2005 – see Box 1. However, maize production has plateaued and remains highly correlated to rainfall patterns. The production has been fluctuating between 2.8 and 4.0 million tonnes since 2008. On the other hand, the country’s maize productivity between 2011 and 2016 increased slightly and remained far below the target of 3.3 tonnes/ha. Furthermore, hybrid maize seed use has increased slightly from 41% (2010) to 46% (2014). Whereas, production of cassava has expanded from 4.0 to 4.9 million tonnes from 2010 to 2014, with yields increasing from 17 tonnes/ha in 2000 to 23 tonnes/ha in 2014, following the introduction of new varieties. In addition to household food security, there has been growing commercialisation with fresh cassava being sold into urban market and processing into cassava flour.
31. On cash crops, with exception of few legumes, the production trend has not been impressive over time. Average production over the five years (2013-2017) for groundnuts and beans, for instance, stands at 307,790mt and 185,893mt per year, respectively. On the other hand cotton production has drastically reduced over time. Between 2013 and 2017 it has declined from 158,826mt to 29,545mt. However, in general there has been some progress in crop diversification, alongside tobacco, as the country’s main cash crop especially with increasing production of legumes over the period. For example, production of grain legumes has almost doubled, from 0.53 million tonnes in 2010/11 to 1.02 million tonnes in 2014/15. The commercialisation of grain legume production was supported through strengthening of farmer organisations, increased market linkages with processors and exporters, private investments in downstream segments, and increased trading levels on commodity exchanges and use of warehouse receipts. Nevertheless, the seed industry to support this diversification drive is not yet developed.

8
National Agricultural Investment Plan
Box 1: Farm Input Subsidy Program
Government introduced the Farm Inputs Subsidy Programme (FISP) in 2005 to increase smallholder farmers’ access to improved agricultural farm inputs – fertilizers and improved seeds and, therefore, attain food security at household and national levels. FISP has contributed to increased maize production with surpluses in especially years which experienced favourable weather. It has also contributed to yields increases from 0.8mt/ha to 2.1mt/ha; increased utilization of fertilizers from slightly above 100,000mt to over 300,000mtper year; and has contributed to private sector development in the agriculture sector. For instance, there were only 3 seed companies, but to-date have increased to 22. Despite the positive contribution of the program, there is a growing consensus on the need for Government to improve its efficiency and sustainability. On-going FISP reforms include: (i) improvement in targeting of productive poor smallholder farmers; (ii) the increasing involvement of the private sector in input distribution; (iii) Increased farmer contribution to the input; and (iv) the use of FISP as a tool to promote diversification through expansion towards other cereal seeds. These FISP reforms aim at reducing its financial burden in order to free resources for sustainable agriculture investment by the GOM.The re-orientation of the FISP requires harmonisation with other policies such as social cash transfers in terms of the Unified Beneficiary Registry and other tools. This requires a new targeting approach currently being piloted. The use of the Unified Beneficiary Registry developed under the MNSSP would help to improve targeting efficiency and ensure that various interventions are harmonised. The latter include other interventions under the NAIP, under Program B and IA 6, which target strata of the rural population that will no longer be eligible under the FISP.Further reforms should consider opportunities to address environmental and soil fertility issues requiring a more holistic approach to soil fertility management. The reform areas should include management practices such as use of organic fertiliser and provision of varied fertilisers depending on soil types and cropping systems; crop rotation and expanding the choice of seeds to include more legumes, cereals and oilseeds crops; and linking FISP eligibility to the adoption of good agricultural practices.
32. Strategic Grain Reserve (SGR): The Malawi Government established the SGR under the management of the National Food Reserve Agency (NFRA) to respond effectively to food insecurity and unpredictable shocks. NFRAs objectives at its establishment were; 1) to maintain the SGR; 2) stabilize the grain price; 3) and oversee grain importation and exportation on behalf of the Government of Malawi. It releases maize grain during emergencies for humanitarian support and for price stabilization purposes. It has an institutional set up that includes the SGR and Commercial Maize Committee, whose mandates include recommending and approving release of maize grain for humanitarian support or for commercial purposes. Several years of the SGR’s operations have revealed a lack of clear guidelines in terms of procurement, recycling, replenishment rules, and drawdown of grain, among others. This brought about uncertainties which undermined private investments in storage and the use of risk management and financing instruments such as warehouse receipts and, commodity exchanges. Hence, while strategic reserves are an important instrument to cope with disaster-induced food crises, management of such reserves need to be handled more carefully to manage trade-offs with other policy objectives, such as private investments in marketing and storage and the development of market-based risk management instruments. The new SGR guidelines that Government has adopted since December 2016 provide an effective tool for addressing gaps and outline practical rules for procurement, storage and drawdown of grain from the SGR without interruptions.
33. Livestock: Though the livestock sub-sector has shown a more positive performance, its growth is relatively slower than the country’s demand for livestock products. As such Malawi continues to import meat and meat products. Statistics indicate that the country has about 97 million chickens, 7 million goats and 4 million pigs. This increase is attributed to the pass-on schemes the country is implementing and improved management. The cattle population has doubled to

9
National Agricultural Investment Plan
1.5 million during the ASWAp implementation and includes 80,000 dairy cattle. The latter has led to an increase in milk production supported by improved breeds and advances in animal health. However, per capita milk consumption in Malawi is still one of the lowest in the world at about 4.9 litres per person per year (FAO Stat). The sub-sector has potential to grow and contribute to the economic wellbeing of Malawians and improve nutrition. However, it faces a number of challenges that include high disease prevalence, limited infrastructure development and investment and lack of breeding facilities.
34. Fisheries: The fish catch from Lake Malawi has surpassed previous targets of 60,000 tonnes per annum, oscillating between 81,000 and 116,000 tonnes. While this has improved the availability of fish, it exceeds the sustainable yield of the lake fishery. Aquaculture production has almost doubled, from 2,632 tonnes to 4,742 tonnes per year but still remains at a low-level compared to the capture fishery. However, according to FAO the fish supply per capita has steadily dwindled due to high population posing a real threat to food and nutrition security. Some estimates indicate that there is substantial decline in per capita fish consumption in the country, from 14 kg in the late 1990s to about 5.4 kg in 2017. This is the case despite the fact that country is endowed with vast fresh water and suitable land for upland fish production.
35. Exports: The value of agricultural exports increased from USD 839 million in 2010 to USD 925 million in 2015, with substantial fluctuations in between. The traditional export crops – tobacco, sugar, tea, coffee and cotton - have shown little dynamism in recent years, with fluctuating production and productivity levels. There has been a strong increase of some non-traditional export crops such as cow peas, macadamia nuts and spices (paprika and chillies). Other crops targeted under the National Export Strategy (NES) such as cotton, soybeans and sugar have not experienced major growth.
2.6 The Agricultural Sector Expenditure
36. Public spending in agriculture has traditionally been high in Malawi, averaging 16.3% of the total budget between 2007/8 and 2011/12, far above the CAADP Maputo target of 10%. Public expenditures in agriculture oscillated between USD 250 million and USD 365 million per annum during this period. At ASWAp design, the development budget was calculated at USD 2.2 billion over a four-year period, of which 29% and 17% were to be contributed by GoM and development partners respectively, leaving a funding gap of 54%. At the end of the ASWAp implementation period, USD 1.9 billion had been spent by MoAIWD and DPs that participate in the Donor Committee in Agriculture and Food Security (DCAFS), representing 85% of the identified financing need. GoM spent 52% of this amount and donors 29%, leaving a funding gap of 18% (USD 329 million). Hence, in terms of resource mobilisation and disbursement, the ASWAp was quite successful with average annual spending of almost USD 500 million.
37. Since ASWAp mostly focused on food security, expenditures were highly skewed towards pillar 1, Food Security and Risk Management. The pillar had 72% of the total expenditure under ASWAp and 93% of the GoM contribution. Within this pillar, 61% was spent on sub-Program 1.1 targeting maize production, mainly through the FISP. This left few resources for the other sub-Programs and pillars, with diversification of production receiving 10%, commercialisation 7%, technology generation and dissemination only 4%. Sustainable land management received 9% of resources. Irrigation development as a sub-programme lagged far behind with only USD 96 million spent out of USD 921 million budgeted.

10
National Agricultural Investment Plan
38. ASWAp spending was highly centralised. Only 1% of the funds spent by MoAIWD were transferred to the districts, where most capacity development and extension takes place. This is mainly attributable to the high share of the centrally-managed FISP in the budget including procurement of fertilizers and seeds which were actually used at district level. Moreover, only 4% of MoAIWD’s budget was allocated to development activities, with the remaining 96% being recurrent costs, known as Other Recurring Transactions (ORT). This included the FISP and other recurrent expenditures.
39. Some 60% of donor funding for the ASWAp was channelled through MoAIWD and 10% through other public entities, mainly through Project Implementation Units (PIUs). The remainder of donor funding was channelled through NSAs including NGOs/CSOs (18%), research entities (6%), private sector (5%) and UN Agencies (1%). Limited progress was made towards pooled funding, though this was one of the main envisaged implementation modalities. Only 6% of resources were disbursed through the Multi-Donor Trust Fund (MDTF), established in 2014, managed by the World Bank and contributed by several donors. The MDTF was nevertheless catalytic in improving inter-sectoral coordination and providing a predictable flow of funds. Some of the resources were transferred to other Ministries, including the Ministry of Industry, Trade and Tourism (MoITT), the Ministry of Transport and Public Works (MoTPW) through the Roads Funds Administration, and the Ministry of Lands, Housing and Urban Development (MoLHUD).
2.7 Policy ContextInternational Policy Frameworks
The NAIP has been informed by global, continental and regional policy frameworks. Its targets, therefore, are also aligned to the M&E and results frameworks.
40. Malawi is a signatory to international instruments related to agriculture, including the Sustainable Development Goals (2015) and the continental CAADP Compact. The CAADP which is Africa’s policy framework for agricultural transformation, wealth creation, food and nutrition security as well as inclusive economic growth. It helps to identify sources of pro-poor growth for the agriculture sector, build knowledge management systems and embrace peer review mechanisms to enhance collective responsibility and local ownership. Malawi signed the CAADP compact in 2010, setting the stage for joint sector reviews, budgetary and investment dialogue, and commitments to align, scale up and improve the quality of sector investment.
41. In 2014 African leaders renewed their commitment to the CAADP Compact through the Malabo Declaration on Accelerated Agricultural Growth and Transformation for Shared Prosperity and Improved Livelihoods. The Declaration constitutes a recommitment of African governments to the CAADP process and sets objectives and targets for the second CAADP decade. The Malabo declaration is based on a critical review of the achievements and challenges of the first phase of CAADP commitments, including the first generation NAIPs. The declaration strongly recommends strengthened coordination and alignment of agricultural investment Programs with other adjacent policy areas; with a stronger emphasis on implementation capacity; and a stronger role of the private sector. The Declaration has seven commitments as follows;
I. Recommitment to the principles and values of the CAADP process;II. Enhancing investment finance in agriculture;
III. Ending hunger in Africa by 2025;IV. Halving poverty by the year 2025, through inclusive agricultural growth and transformation;V. Boosting intra-African trade in agricultural commodities and services;
VI. Enhancing resilience of livelihoods and production systems to climate variability and other related risks;
VII. Mutual accountability to actions and results.

11
National Agricultural Investment Plan
Each commitment has sub-themes with related targets and performance indicators. Countries agreed to a biannual review process to monitor progress towards the 2025 targets. Achieving these targets requires a multi-sectoral approach that involves several ministries. While the agricultural sector and agricultural ministries continue to play a central role, contributions from other sectors such as nutrition, trade, private sector development, natural resource management and social protection are critical in achieving such targets.
42. Malawi is a Party to the United Nations Framework Convention on Climate Change (UNFCCC) and the Paris Climate Agreement of December 2015. Under these agreements Malawi has made firm commitments to move the country’s development pathways towards a green economy based on national circumstances and capabilities. These commitments are defined under Malawi’s Intended Nationally Determined Contribution (INDC).
43. The Enhanced Integrated Framework (EIF) is a global initiative of WTO which brings together partners and resources to support least developed countries in harnessing trade for poverty reduction, inclusive growth and sustainable development. It provides financial and technical support to build trade capacity in 50 countries including Malawi. The EIF has supported Malawi in identifying and quantifying the trade costs constraining its competitiveness within regional and international markets.
44. Malawi has also joined two Continental Initiatives to foster private investments in Africa: Grow Africa (GA) and the New Alliance for Food Security and Nutrition (NAFSN). GA is a partnership that was jointly founded in 2011 by the AU, NEPAD and the World Economic Forum. It works to increase private sector investment in agriculture and accelerate the execution and impact of investment commitments. The aim is to enable countries to realise the potential of the agriculture sector for economic growth and job creation, particularly among farmers, women and youth. The NAFSN which was launched in 2012 is a shared commitment to achieve sustained inclusive, agriculture-led growth in Africa. It sets out to: (i) reaffirm continued development partner commitment to reducing poverty and hunger; (ii) accelerate implementation of key components of the CAADP; (iii) leverage the potential of responsible private investment to support development goals; and (iv) help lift 40 million people out of poverty in Africa by 2022.The NAIP is also aligned with the SADC Regional Agricultural Policy (2013) and Regional Agricultural Investment Plan (2016); as well as the COMESA Regional Agricultural Policy and Investment Framework and the COMESA Regional CAADP Compact– see Annex 6.
45. The key role of the private sector in the NAIP is consistent with the Malabo Declaration’s invitation for countries to establish a Country Agribusiness Partnership Framework (CAP-F). The CAP-F will identify policy issues and actions to stimulate private agribusiness investment building on GA and the NA.
National Policies and Strategies46. Malawi has a very wide range of sectoral and sub-sectoral policies that are relevant to the NAIP,
most of which are accompanied by various policy statements, investment frameworks and strategic plans. The most important ones are summarised in Annex 6. The overarching National Development Plan is the Malawi Growth and Development Strategy. The third phase (MGDS III) was prepared in parallel with the NAIP and is currently in draft form pending publication. The five priority areas of MGDS III are: (1) Agriculture, Water Development and Climate Change; (2) Education and Skills Development; (3) Transport and ICT infrastructure; (4) Energy, Industry and Tourism Development and (5) Health and Population. Several cross-cutting areas are mainstreamed into the strategy including: gender; youth development; empowerment of persons with disabilities; management of HIV and AIDS and nutrition; environmental management; disaster risk reduction and resilience building; peace, security and good governance. The agricultural content of MGDS III is derived from the National Agricultural Policy which was developed and approved in 2016.

12
National Agricultural Investment Plan
47. The main policy document for the agricultural sector is the National Agriculture Policy (NAP) which defines the vision and provides a high-level framework for development of the agricultural sector in Malawi for (2016 - 2020), with MoAIWD as the policy holder. It includes eight Policy Priority Areas (PPAs), subdivided into 54 Policy Statements which are to be implemented through a number of strategies. The Policy intends to achieve sustainable agricultural transformation, expanding incomes for farm households, improved food and nutrition security and increased agricultural exports by creating a conducive environment for development of the sector. The emphasis is on farmer-led agricultural transformation and commercialisation by treating farming as a business, facilitating and harnessing dynamic transitions within farming communities, in particular a transition into non-traditional high-value agricultural value chains, and increased engagement in profitable off-farm and non-agricultural livelihoods. There are also a number of sub-sectoral and thematic strategies and polices (see Annex 6) which are subsidiary to the NAP.
48. Whilst the NAIP is firmly rooted in the national policies for agriculture, it also responds to a number of related policies and strategies in line with its objectives. The alignment of the NAIP with sectoral and related policy frameworks is guided by the need to ensure consistency and coherence and address critical resource gaps in overlapping policy and investment areas. These fall under the mandates of other Ministries and are described in Annex 6. The most important of these are: • National Trade Policy and the National Export Strategy (NES)• Trade, Industry and Private Sector Development, Sector Wide Approach (TIP-SWAp) and the
Joint Sector Plan (JSP)• National Resilience Plan (NRP)• Malawi National Nutrition Policy, 2016-2020, the draft National Nutrition Strategic Plan,
2017-2021 and the draft Agriculture Sector Food and Nutrition Strategy 2017-2021.• National Gender Policy • Malawi National Social Support Program, Phase II (MNSSP II)• Financial Sector Development Strategy and the Financial Inclusion Strategy• Decentralisation Policy and the Integrated Rural Development Strategy• National Environmental Policy, National Climate Change Policy, and Malawi Climate Change
Investment Plan (MCCIP)• Malawi National Land Policy
2.8 Key Stakeholders49. Effective implementation of the NAIP requires stronger coordination of all key players in the
agriculture sector. These includes: Government and its subsidiaries (parastatals, boards and trusts); non-state actors (NSAs) such as Non-Governmental Organisations (NGOs) and Civil Society Organisations (CSOs); the private sector (including farmers, farmers organisations and private sector companies); Research and Academia; and Development Partners (DPs). The key stakeholders and their main roles are described in Annex 6.
50. As identified in the NAP, the ministries responsible for implementation of the NAIP are:
• Ministry of Agriculture, Irrigation and Water Development (MoAIWD), as the lead ministry
• Ministry of Industry, Trade and Tourism (MoITT);
• Ministry of Local Government and Rural Development (MoLGRD);
• Ministry of Lands, Housing and Urban Development (MoLHUD);

13
National Agricultural Investment Plan
• Ministry of Natural Resources, Energy and Mining (MoNREM), • Ministry of Health and Population (MoHP); • Ministry of Transport and Public Works (MoTPW)• Ministry of Gender, Children, Disability and Social Welfare (MoGCDSW), and • Ministry of Finance, Economic Planning and Development (MoFEP&D).
51. Other important ministries though not directly part of NAIP implementation include; Ministry of Foreign Affairs and Internal Corporation, Ministry of Justice and Constitutional Affairs and Ministry of Labour, Youth ,Sports and Manpower Development. Other key stakeholders include the Reserve Bank of Malawi (RBM) and a number of parastatals, boards and trusts which are important for development of the agricultural sector and have in some cases substituted for private sector.
52. Civil Society is relatively well organised in Malawi. The Council for Non-Governmental Organisations in Malawi (CONGOMA) and the NGO Board are the official registrars, and for the agricultural sector the Civil Society Agriculture Network (CISANET) is active in policy dialogue and Program implementation. They have also lobbied for progressive policies, quality service provision and facilitating access to markets. These organisations have supported multi-stakeholder dialogue structures especially at district level, such as the District Agriculture Extension Coordinating Committees (DAECCs), District Stakeholder Panels (DSPs) and Area Stakeholder Panels (ASPs).
53. The private sector is composed of approximately 2.6 million farmers (small and medium-sized), and 30,000 estates, as well as a number of companies engaged along agricultural value chains and related inputs and services. There are a number of large corporates in the sector (both domestic and foreign) of which over 30 have participated in the NAFSN and GA. Private financial institutions such as banks, microfinance institutions and Saving and Credit Corporative (SACCOs) also have a key role to play. Rural (SMEs) such as traders, transporters and agro dealers are often direct market partners of commercialising smallholder farmers and should play an important role in agricultural transformation. However micro, small and medium enterprises in the sector are not very visible and receive little support (the so-called “missing middle”) and this has been addressed in the NAIP.
54. Farmer Organisations: The Farmers Union of Malawi (FUM) represents smallholder, medium and larger farmers7 and The National Smallholder Farmers Association of Malawi (NASFAM) represents commercially-oriented smallholders. In addition to policy and advocacy work, NASFAM provides services to farmers and buys produce through subsidiary processing enterprises. Input suppliers and certain value chain segments are organised in associations (e.g., in dairy, cotton, tea, and tobacco). However, overall organisation of the private agribusiness sector is weak, partially due to the diversity of actors in terms of size and specific interests. While the Malawian Confederation of Chambers of Commerce and Industry (MCCCI) represent the overall private sector interests, the interests of smaller companies remain diluted. Attempts to create a sub-chamber for agriculture have not succeeded yet.
55. Agricultural research is coordinated and undertaken by MoAIWD through the Department of Agricultural Research Services (DARS) at its three main research stations as well as sub-stations strategically positioned throughout the country. Much of this work is undertaken in collaboration with CGIAR institutions of which there are normally 4-5 active in the country at any time. Universities also play an important role in agricultural research and human resource development. In the tobacco sector, the Agricultural Research and Extension Trust is responsible for conducting research and providing technical and extension services.
7 Farmers Union of Malawi (FUM) has a total membership of 1,024,843 farmers which consist of 1,024,193 individual smallholder farmers organized into 256 farmer organizations across the country and 650 medium and large-scale farmers. NASFAM represents over 100,000 smallholder farmers.

14
National Agricultural Investment Plan
56. Malawi’s development partners have supported the ASWAp and are expected to continue their support for agriculture and rural development via the NAIP. The DPs also play an important role in guiding and coordinating the sector. The agricultural sector stands out in terms of donor coordination. The Donor Committee in Agriculture and Food Security (DCAFS) aims to deepen dialogue, coordination and cooperation among development partners, and between these and the Government in relation to agriculture and food security, with a view to strengthening the quality of partnership and effectively supporting the NAP, Malabo, CAADP and related strategies. The DCAFS consists of resident bilateral and multilateral donors as well as UN agencies. The group provides harmonised and coordinated input to MoAIWD and maintains a database of all donor projects in the agricultural sector. The group is professionally managed through contributions from each of the resident donors and meets on a regular basis. The leadership is organised as a troika comprising the current, incoming and outgoing chairs, and meets regularly with the Principal Secretary of MoAIWD. Similar donor structures with professional coordination have been set up, modelled after DCAFS and these include Donor group in Nutrition Security (DoNUTS), Private Sector Donor (PSD) group and Climate Change and Environment Donor Group.

15
National Agricultural Investment Plan
Chapter 3: Detailed NAIP Description3.1 Objectives and Scope57. Policy Foundations: The NAIP is based on two main foundations; the NAP and the Malabo
Declaration. The NAP’s transformation agenda involves a holistic approach to a heterogeneous sector, retaining a focus on smallholders but also supporting commercial farming. In addition to the focus on production and productivity, the NAP addresses other issues such as sustainable management of agricultural resources; resilience to climate change; increased agricultural exports; as well as food security and improved nutrition. Its implementation therefore requires inputs from other sectors and line ministries. This applies even more to the Malabo Declaration with its ambitious targets related to ending hunger, halving poverty, boosting intra-African trade in agricultural commodities and services (including a continental free-trade area and transition to a continental Common External Tariff) and making at least 30% of farm/pastoral households resilient to shocks. While agriculture plays a central role in achieving these targets, other sectors and related policies investment frameworks in areas such as nutrition and health, water and sanitation, education, social development and protection, trade, transport, natural resources and climate change also have to make important contributions.
58. Several activities mentioned under the above policy and investment frameworks that are important for achieving the NAIP’s development objectives, are included and budgeted for in the NAIP. This not only lays the foundation for improved coordination between the NAIP and adjacent programmatic frameworks but also helps to ensure that critical activities are funded and implemented8. The NAIP implementation and monitoring arrangements described in Chapter 6 will ensure proper coordination and reporting across sectors, identify financing gaps and avoid parallel funding and implementation of similar activities by various actors9.
59. Key changes compared to the ASWAp. The NAIP shares some common elements with the ASWAp and draws on many lessons learned from the latter. However, there are a number of material differences between the NAIP and the ASWAp which are expected to make the NAIP a more effective framework for targeted and harmonised agricultural sector investment as can be noted below:
ASWAp NAIP
• Formulated in the absence of a national agricultural policy – functioned as both a policy and an investment framework.
• The NAIP is informed by the NAP.
• Pillar structure with limited horizontal linkages between different focus areas.
• Matrix structure with 16 Intervention Areas each contributing to one or more of the four Programs.
• Very limited reference to related thematic and sectoral policies.
• Reviews the full range of thematic and sectoral policies and strategies (Annex 6) and responds to these where appropriate.
• Limited involvement of ministries other than those directly responsible for agriculture and irrigation
• Well-defined and important roles for many other ministries and agencies, some in leadership roles for particular elements of the plan.
• Cost estimates only included investments. • Recurrent costs also included on the basis that investments cannot be undertaken effectively without adequate operational costs.
8 In an uncertain funding environment, the inclusion of activities and other sectoral frameworks does not ensure that these get funded (view chapters 5 on trade and nutrition -related investment frameworks as examples).9 The exact linkages between the NAIP and the main other plans and investment frameworks (NRP, JSP and MCCIP) are detailed in Annex 6.

16
National Agricultural Investment Plan
• Highly centralised implementation arrangements with very limited involvement at district level and below.
• Proposes decentralised implementation modalities in line with the decentralisation policy.
• Limited provision for intra- and inter-agency coordination.
• Coordination arrangements clearly specified and costed.
• Investment highly concentrated in one focal area (food security) with the FISP consuming the bulk of GoM resources
• More balanced investment portfolio across four Programs and 16IAs.
60. Timeframe. The NAIP has a five-year implementation period. However, the agricultural transformation envisaged in the NAP and the ambitious Malabo and SDG targets require a longer timeframe to be achieved. The NAIP can thus be seen as the first of two or three investment plans for implementation of the NAP. It identifies what can realistically be done within the first five years of NAP implementation. After that, a second NAIP, within the same programmatic framework, can be developed with an updated budget and priorities.
61. Objectives. The NAIP adopts the goal of the NAP which is sustainable agricultural transformation that will result in significant growth of the agricultural sector, expanding incomes for farm households, improved food and nutrition security for all Malawians, and increased agricultural exports. It has three related objectives at the impact level, to be measured through six indicators as shown in Table 3.1. These objectives mirror the Level I results areas and indicators of the CAADP Results Framework. The targets concerning poverty reduction and food and nutrition security are set below those of the Malabo Declaration for two reasons. First, Progress on stunting and other nutrition targets require many interventions in other areas, beyond the scope of the NAIP. Second, the NAIP ends in 2023, whereas the Malabo targets are set for 2025, and the SDGs for 2030.
Table 3.1: Impact Level Objectives, Indicators, Baseline and Targets
Objectives Indicators Baseline Target
Broad-based and resilient agricultural growth
I. Consistent agricultural sector growth 4.3% a/ 6%
II. Increased share of agricultural GDP from commodities other than tobacco and maize tbd tbd
Improved well-being and livelihoods of Malawians
III. Increased share of population above the national poverty line 49.2%(2010/11) 65%
IV. Rural poverty gap reduced 19.2% 15%
V. Increased share of households resilient to climate and weather-related shocks (RIMA10) tbd 25%
Improved food and nutrition security
VI. Reduction in Malawi’s score in the IFPRI global hunger index11 27.2 <20
VII. Reduction of stunting among 0-5 year-old children 37% (2015/16) 25%
VIII. Reduction of underweight among 0-5 year old children 12% 5%
IX. Reduced food insecurity12 Tbd 10%
a/ Average growth rate achieved during ASWAp implementation
10Resilience Index Measurement and Analysis (http://www.fao.org/3/a-i5665e.pdf) 11www.globalhungerindex.org12As measured by the Food Insecurity Experience Scale (FIES) http://www.fao.org/in-action/voices-of-the-hungry/fies/en/

17
National Agricultural Investment Plan
62. The three NAIP objectives are mutually reinforcing. Agricultural sector growth contributes to poverty reduction and Food and Nutrition Security (FNS). Improved FNS contributes to agricultural and overall growth through a healthier, better-educated and more productive workforce; and reduced poverty levels increase the demand for food products, stimulating agricultural sector growth. The main thrust of the NAIP is to stimulate broad-based agricultural-led growth, with specific measures to maximise the synergies with food and nutrition security, poverty reduction and overall economic growth.
Objective 1: Broad-Based and Resilient Agricultural Growth 63. The commercialisation of smallholder farming will be the main source of growth with the
highest contribution to poverty reduction and FNS. However, medium and large farms also have important roles to play, in view of the substantial amount of underutilised land under their control. These farms can also play important roles in linking smallholder farmers to markets by providing inputs and services and bulking production within out grower arrangements. Large, medium and small enterprises in the up- and downstream segments of the Agri-food system13 are critical for providing inputs and services to farmers, adding value and linking farmers to markets. The smallholder and commercial segments of the Agri-food system are interlinked and need to grow in parallel to achieve robust growth and meet evolving market demands while successfully competing with imports. Hence, the NAIP will take a holistic approach looking beyond primary production to further develop input markets, transformation and trade.
64. In the context of strong population growth and a limited and fragile natural resource base, agricultural growth has to come mainly from productivity gains rather than through an expansion of the area under production, combined with interventions to improve resilience by preparing for and managing shocks This especially applies to the smallholder-dominated areas under communal tenure where landholdings are very small and intensively utilised. In the estate sub-sector, a two-pronged approach is needed combining productivity increases and horizontal (area) expansion. Strengthening land tenure security is critical for investments and sustainable agricultural practices. In addition, land rental markets would allow more productive farmers to expand without requiring owners to give up their land permanently.
Objective 2: Improved Well-Being and Livelihoods 65. While there is ample evidence that broad-based agricultural growth is an effective strategy for
poverty reduction, the extent of that linkage depends on the type and quality of growth. Broad-based growth driven by productivity increases on small farms is the most effective and has the largest multipliers. But within the smallholder population, there is huge diversity in terms of assets, income levels and capabilities to respond to market opportunities; affected by factors such as gender, age, location and availability of family labour.
66. The NAIP recognises the heterogeneous nature of rural communities. Whilst the great majority or rural households are poor, there is a need to tailor programs/interventions to the needs of different categories of the poor. The NSSP classifies poor rural households into five categories: (i) ultra-poor labour constrained; (ii) ultra-poor but non-labour constrained; (iii) poor but food-secure; (iv) vulnerable to poverty; and (v) resilient to poverty. In addition to addressing the generic constraints facing smallholder farmers, specific targeting measures will be employed to address the needs of vulnerable/disadvantaged sub-groups. These will include measures to close the gender gap in agriculture, support youth employment and entrepreneurship, increase the access of remote areas to infrastructure, markets and support services, and to support labour-constrained households such as those affected by HIV-AIDS. The NAIP also incorporates strategies and interventions tailored to larger scale commercial farmers and agribusinesses.
13Upstream refers to supply of inputs, technologies and services for production (seeds, breeding stock, fertilizer, machinery and equipment). Downstream includes all the processes after farm production, such as post-harvest handling, bulking, storage, transport and logistics, processing, trading and retailing.

18
National Agricultural Investment Plan
67. Notwithstanding the above, the NAIP acknowledges that agriculture is not the only pathway out of poverty for all rural households. Labour-constrained rural households and/or those with very small land areas may pursue other pathways, including engaging in non-farm enterprises, non-farm employment or migration. Typically, such households pursue a portfolio of livelihood strategies - agricultural and non-agricultural, to provide for their food and nutritional needs. Different extension approaches and technologies are needed to support these farmers to increase and diversify their production. Hence, the NAIP will support different strategies for different segments of the farming population, including graduating beneficiaries of social protection Programs into agricultural production, linking subsistence farmers with markets, and creating employment opportunities in related value chains. This will be achieved in close coordination with the MNSPP and relevant stakeholders.
Objective 3: Improved Food and Nutrition Security (FNS)68. FNS builds on the concept of food security14 but places more emphasis on the qualitative
dimensions of achieving a healthy and balanced diet. Further emphasis is on the utilisation of available food through proper food handling and feeding practices, operating in a well-managed environment that has safe, hygienic and sanitary facilities. Food security is necessary, but not sufficient, to ensure nutrition and prevent malnutrition.
69. Food security has traditionally been at the centre of agricultural policies in Malawi. However, efforts have concentrated on achieving maize self-sufficiency, and despite some improvements, food insecurity and malnutrition remain serious challenges, with stunting levels still unacceptably high. The number of people who require food assistance can reach as high as six million (around a third of the population) in years of severe drought.
70. The NAIP targets the more comprehensive objective of FNS. Food insecurity and malnutrition has three dimensions: food access, care practices and health sanitation and environment. While FNS requires interventions from different sectors - health, water and sanitation, and education – targeted investments in agriculture have a critical role to play in addressing stunting, micronutrient deficiencies and other forms of malnutrition. Micronutrient deficiencies are closely associated with lack of dietary diversity. Agriculture-based interventions can also make important contributions to reducing stunting by increasing the availability of diverse and healthy foods in urban and rural areas; improving access through lower food prices and increased incomes, and by decreasing the gender gap in agriculture. The NAIP will contribute to FNS through six outcome areas that address the three main determinants of nutritional status as outlined in Figure 3.1.
Figure 3.1: Agricultural Pathways to Achieving Nutrition Outcomes
Source: FAO compendium on Nutrition Sensitive Investment (adopted from Herforth and Ballard, 2016)14Food security is defined by FAO as a situation that exists “when all people, at all times, have physical, social and economic access to sufficient, safe and nutritious food to meet their dietary needs and food preferences for an active and healthy life”
Nutrition Knowledgeand norms
On-farm availability,
diversity and safety of food
Food environment
in markets
Natural resource
management practices
Income
Food access
IMPACTS
OUTCOMES
Diet
Nutritional status
Health
Care practices Health and sanitation environment
Intervation
Women’s empowerment(time, labour,
assets, income control

19
National Agricultural Investment Plan
3.2 Additional Strategic Considerations71. Gender and Youth: The pivotal role of women in agricultural production, and the serious
disadvantages experienced by both women and youth in rural communities demands that gender and youth are mainstreamed in all parts of the NAIP and that there are specific measures to help address the many inequalities and challenges they face. The attainment of this will be done through proper targeting where at least 50% of the participants in various interventions and 40% in decision making positions will be women.
72. Social Protection: The NAIP recognises the complementary roles of agricultural development and social protection. Social protection is a critical instrument in poverty reduction and FNS, but needs to be complemented by other sectoral interventions, including agriculture. In addition, social protection can enable poor households to participate in productive interventions, avoiding the risk that the very poor are excluded from, or at least not included in, production support interventions. Under the FISP reforms the focus is shifting from the FISP as an instrument of social protection to a productivity enhancement measure. This calls for the deployment of other social protection options, embracing skills development, health and education etc., to ensure that the potential synergies between social protection and agricultural development are realised.
73. Resilience: In Malawi sustained growth, poverty reduction and FNS are closely linked with increased resilience defined as: “the ability to prevent disasters and crises as well as to anticipate, absorb, accommodate or recover from them in a timely, efficient and sustainable manner”. This includes protecting, restoring and improving livelihood systems in the face of threats that impact agriculture, nutrition, food security and food safety.Agricultural growth has been erratic due to high and growing vulnerability to climatic variability exacerbated by the high dependence on a single staple food crop. Hence, resilience is a key priority, as evidenced by the recently launched NRP. The NAIP will promote diversification of agricultural production and exports to improve resilience in concert with well-targeted social protection. Diversification will also expand the synergies between agriculture-led growth and the rural and broader economy and contribute to dietary diversity according to the FAO guidelines on measurement of dietary diversity (see Table 4.2).
74. Investment effectiveness: In order to maximise the effectiveness of the public investments in achieving overall development objectives and leveraging private investments, the following strategies will be pursued: • Improvement of inter-sectoral coordination between agriculture and related sectors
(including trade, industry, health, education, environment, finance and social protection), both at policy and Program level;
• Improvement of the business enabling environment to stimulate private investment;• Better coordination with non-state actors and private sector in terms of policy development,
implementation and investment promotion;• Strengthening implementation capacities, especially at local (district) level; and• More balanced allocation of funds between input subsidies and other key public investments
in areas such as infrastructure (roads, water management and marketing), research, extension and capacity development, as well as sustainable land management.
75. Value Chain Prioritisation: The Malabo Declaration calls for the identification of priority value chains to foster Public Private Partnerships (PPPs). In Malawi, the need for diversification beyond maize and tobacco invites the question of which value chains to focus on. Selecting priority value chains is challenging and needs to consider the different views and priorities among actors, changing market conditions, and the fact that value chains score differently according to the assessment criteria employed. No single value chain (or set of value chains) is clearly superior in all key development outcomes. Rather, a portfolio of value chains is needed to address various policy objectives in a balanced way.

20
National Agricultural Investment Plan
76. Initial identification of priorities is based on the IFPRI CGE model (see Annex 7), stakeholder consultations during the NAIP formulation process, prioritisation in other policy frameworks (e.g. decentralisation, gender, climate change) and literature review (including the initial results of the value chain studies conducted by the NAPAS Malawi project). The approach was to identify subsectors that score well according to key selection criteria such as: potential for poverty reduction; broad-based growth; climate change resilience; dietary diversity; diversification of production and trade; and potential for value addition; and that offer attractive investment opportunities to farmers and other private investors. Within these subsectors, priority value chains will be selected during the CAP-F process based on further consultations with the private sector. As NAIP implementation progresses, support to some value chains might be scaled down and others might be added, depending on the interests of stakeholders and changing market conditions. Based on these considerations, the following subsectors are proposed to receive priority:
• Oilseeds (cotton, soybean, and others) are important smallholder crops with good market potential and good prospects for export growth and value addition. They have good potential to contribute to poverty reduction and dietary diversity, both directly - through oil consumption - and indirectly, through increased incomes. The potential of oilseeds has already been identified under the NES and has been confirmed by the CGE model.
• Grain Legumes play an important role in soil fertility management and can be readily integrated into cereal farming systems. Groundnuts are an important smallholder crop with domestic and export market potential and a nutrient-rich food if aflatoxin is better managed. Pigeon peas have shown a strong growth in recent years and export markets might be diversified beyond India. Common beans and cowpeas can also contribute to diversifying farming systems and diets.
• Horticultural crops, especially vegetables and, to a lesser extent, fruit and nuts score highly in terms of their contribution to poverty reduction and dietary diversity. Development of vegetable production calls for coordination of production and marketing, and investments in small-scale irrigation, storage and transport facilities. Fruit and nuts include mangoes, bananas, papaya, oranges, Macadamia and cashew. Further studies and consultations are required to identify the fruit and nut value chains with the highest potential.
• Livestock, especially beef and dairy products, have strong domestic demand that will expand with growing incomes. The IFPRI model shows high potential in terms of poverty reduction, dietary diversity and overall growth. Further disaggregation of the analysis would be helpful in prioritising investments among the various livestock categories. Generally, the subsector requires better organisation and its competitiveness needs to be further analysed. There has been strong demand growth for poultry meat and the value chain has good backward linkages into grain legumes and maize. Small stock such as goats and backyard poultry make important contributions to food and nutrition security, income diversification and resilient livelihoods.
• Roots and tubers (cassava, Irish potato and sweet potato), have strong potential to contribute to food and nutrition security. Cassava is the second most important food crop after maize but also has good potential for industrial processing into starch, cassava flour, ethanol, beer and other products. It is drought-resistant, easy to cultivate and storable (in the ground or in dried form). NAPAS conducted roots and tubers value chain study to inform stakeholders and GIZ has also conducted a study on smallholder participation in cassava value chains.
• Rice is a value chain with good commercialisation and export potential and one company has recently constructed a large rice milling facility for this purpose. Malawi is producing rice with strong domestic and regional demand fetching price premia. There is a rice value chain coordination platform hence production and productivity could be increased significantly under both rain fed and irrigated conditions.

21
National Agricultural Investment Plan
77. The identification of sub-sectors leaves sufficient flexibility for fine-tuning and selection of more specific value chains during the CAP-F process based on further consultations with the private sector and the recently completed value chain studies. Under the CAP-F, support to the priority value chains will be mainstreamed throughout the NAIP. Each priority value chain will select from the menu of intervention areas described in Chapter 4. The NAIP will support multi-stakeholder platforms for each priority value chain, which will develop value chain-specific strategies that articulate needs and priorities (see Chapter 6). Such platforms will also help to orchestrate public, private and non-state actors and facilitate PPPs. Such PPPs could involve infrastructure investments such as roads, irrigation and rural electrification to support private investments that ensure inclusion of local communities, whilst safeguarding the environment and FNS. PPPs would also include support services such as extension, business development, strengthening of farmer organisations and access to finance.
78. The identification of priority value chains does not mean that the NAIP will only support particular value chains. The main traditional crops, maize and tobacco, remain strategically important, along with the other agriculture export products, sugar, tea and coffee. In view of the diverse agro-ecological conditions and the need for farm-level diversification to increase resilience and FNS, the NAIP will also respond to local needs. Nevertheless, the above-mentioned subsectors and value chains will be prioritised in terms of financial, institutional and human resources allocation for research, extension as well as capacity development and infrastructure investments during NAIP implementation.
3.3 NAIP ArchitectureThe Four Programs79. The NAIP departs from the ASWAp by using a matrix structure composed of four Programs and
16 IAs. The four Programs are:
• Program A: Policies, Institutions and Coordination for Results
• Program B: Resilient Livelihoods and Agricultural Systems
• Program C: Production and Productivity for Growth
• Program D: Markets, Value Addition, Trade and Finance for Transformation
80. The four Programs are rather generic and aligned to the NAP and will therefore remain relevant over a medium to long term. As such, they can be used as basis for Program-based budgeting (PBB). This is important because achievement of the goal and objectives of the NAP and the Malabo Declaration will require a longer timeframe, beyond the five-year span of the NAIP. The objectives of the NAIP will remain valid over medium to longer term, whereas the targets are set for the five-year period of the NAIP. Each Program has a set of outcome statements and related indicators and targets (see Sections 4.1 – 4.4).
81. The four Programs can also be associated with different target groups and domains of the Agri-food system (see Table 3.2). This allows funders of the NAIP to allocate their resources according to target groups and Agri-food system and domains. It also serves to achieve a more balanced allocation of funds and distribution of activities across these different Agri-food domains.
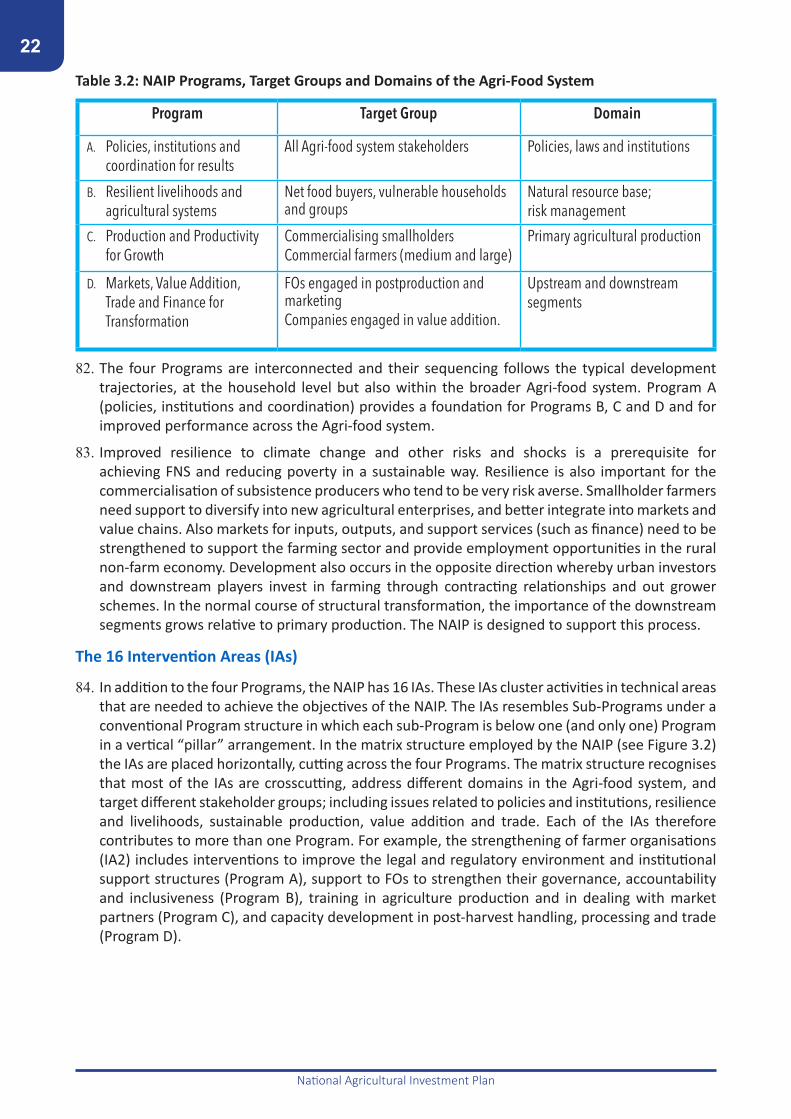
22
National Agricultural Investment Plan
Table 3.2: NAIP Programs, Target Groups and Domains of the Agri-Food System
Program Target Group Domain
A. Policies, institutions and coordination for results
All Agri-food system stakeholders Policies, laws and institutions
B. Resilient livelihoods and agricultural systems
Net food buyers, vulnerable households and groups
Natural resource base;risk management
C. Production and Productivity for Growth
Commercialising smallholdersCommercial farmers (medium and large)
Primary agricultural production
D. Markets, Value Addition, Trade and Finance for Transformation
FOs engaged in postproduction and marketingCompanies engaged in value addition.
Upstream and downstream segments
82. The four Programs are interconnected and their sequencing follows the typical development trajectories, at the household level but also within the broader Agri-food system. Program A (policies, institutions and coordination) provides a foundation for Programs B, C and D and for improved performance across the Agri-food system.
83. Improved resilience to climate change and other risks and shocks is a prerequisite for achieving FNS and reducing poverty in a sustainable way. Resilience is also important for the commercialisation of subsistence producers who tend to be very risk averse. Smallholder farmers need support to diversify into new agricultural enterprises, and better integrate into markets and value chains. Also markets for inputs, outputs, and support services (such as finance) need to be strengthened to support the farming sector and provide employment opportunities in the rural non-farm economy. Development also occurs in the opposite direction whereby urban investors and downstream players invest in farming through contracting relationships and out grower schemes. In the normal course of structural transformation, the importance of the downstream segments grows relative to primary production. The NAIP is designed to support this process.
The 16 Intervention Areas (IAs)
84. In addition to the four Programs, the NAIP has 16 IAs. These IAs cluster activities in technical areas that are needed to achieve the objectives of the NAIP. The IAs resembles Sub-Programs under a conventional Program structure in which each sub-Program is below one (and only one) Program in a vertical “pillar” arrangement. In the matrix structure employed by the NAIP (see Figure 3.2) the IAs are placed horizontally, cutting across the four Programs. The matrix structure recognises that most of the IAs are crosscutting, address different domains in the Agri-food system, and target different stakeholder groups; including issues related to policies and institutions, resilience and livelihoods, sustainable production, value addition and trade. Each of the IAs therefore contributes to more than one Program. For example, the strengthening of farmer organisations (IA2) includes interventions to improve the legal and regulatory environment and institutional support structures (Program A), support to FOs to strengthen their governance, accountability and inclusiveness (Program B), training in agriculture production and in dealing with market partners (Program C), and capacity development in post-harvest handling, processing and trade (Program D).
23
National Agricultural Investment Plan
85. Likewise, each Program needs contributions from multiple IAs. Under a conventional Program structure, each Program can have a maximum of 3 to 4 Sub-Programs, which often leads to “silos” with limited communication and coordination between Programs and Sub-Programs. Under the matrix structure most Programs are composed of activities and outputs from many if not most IAs (see Table 5.1 and Annex 1). While some IAs have their “natural homes” under one Program (e.g. IA 1), in most cases they contribute to two or more Programs. The advantage of the matrix structure is that the Sub-Programs are the same for all Programs. For example, Program A includes the generic interventions for institutional strengthening, policy and program coordination (IA 1) but also activities and outputs concerning policy, regulatory and institutional reforms and capacity development in most of the more specific, technical IAs.
86. The matrix can be used in several ways. Funds can be allocated by Program, but also by IA. Each cell of the matrix has activities and outputs with identified budget, targets and implementation partners. These outputs contribute to the overall development objectives of the NAIP in two ways: Vertically, via the Program outcomes (main results chain); and horizontally, via IAs and Intermediate Outcomes (IOs).
87. Figure 3.2 depicts the structure of the NAIP results framework resulting from the program matrix. The vertical results chain is the traditional one used under pillar-based Program structures. It shows a linear flow of results from activities, to outputs, outcomes and impacts. The limitation of this linear vertical flow is that each activity/output can only contribute to the outcomes of one Program (the one under which the activity/output is placed). In reality, activities and outputs often contribute to outcomes of several Programs. For example, the creation of an effective legal and regulatory framework for warehouse receipt finance not only contributes to an improved enabling environment (Program A) but also to enhanced access to markets and finance (Program D), which in turn provides incentives for improved production (Program C). The ability to access finance at harvest time increases the resilience of farming households and smoothens the availability of grains and legumes throughout the year (Program B). These horizontal effects are captured through the horizontal results chain whereby activities and outputs contribute to more specific intermediate outcomes (IOs) of the respective IAs. These IOs may contribute to the outcomes of one or several Programs but they also feed directly into the high-level development objectives of the NAIP. Figure 3.2 displays this in a schematic way and Annex 1 contains a complete Program matrix with all outputs for each Program and IA, together with the objectives, outcomes statements and outcome indicators for each Program and the outcomes and IOs for each IA.

24
National Agricultural Investment Plan
Figure 3.2: NAIP Results Framework
88. The above matrix structure has the following advantages:
• In line with the PBB guidelines, it allows for a limited number of Programs (up to four per sector) with long-term validity and avoids Sub-Programs;
• It facilitates a more holistic design of interventions taking into account the interconnectedness of policy domains and technical areas across different segments of the Agri-food system; thereby overcoming “silos”;
• Since budgets can be allocated by Programs and by IAs, balancing of priorities across Agri-food system domains, target groups and across technical areas becomes easier; and
• Crosscutting issues are not assigned to separate pillars where they risk being marginalised, but literally cut across the Programs. By making them explicit as IAs, they remain visible and therefore do not get diluted (a risk of mainstreaming crosscutting issues).
Links between the NAIP and the NAP89. The NAP and the NAIP have similar content but are structured in different ways. The 16 IAs of the
NAIP are derived directly from the eight PPAs of the NAP. Table 3.3 shows the linkages between NAP PPAs and NAIP IAs and Programs. Some PPAs are quite broad (e.g. PPA 3.1: Sustainable Agricultural Production and Productivity, and PPA 3.4: Agricultural Market Development, Agro Processing and Value Addition); others are comparatively narrow and specific (e.g. PPA 3.2: Sustainable Irrigation Development, and PPA 3.3: Mechanisation of Agriculture). Within the broader PPAs, 2-3 IAs (with one specific intermediate outcome) have been identified; for the

25
National Agricultural Investment Plan
narrower PPAs, only one IA is identified. Activities and outputs are bundled into IOs and largely reflect the content of the 54 Policy Statements of the NAP and the strategies under these. The IA structure also allows integrating key activities and outputs from other relevant policies and investment frameworks (NRP, JSP, and MCCIP), where these have been found critical to achievement of NAIP objectives (see Annex 6 for details).
Table 3.3: NAP Policy Priority Areas and NAIP Intervention Areas
* The NAP Policy Priority Areas are sequenced and clustered following the above narrative

26
National Agricultural Investment Plan
3.4 NAIP Programs
Program A: Policies, Institutions and Coordination for Results
Development Objective: To improve the policy and regulatory environment, stakeholder coordination and accountability.
90. A supportive legal and policy environment, capable and accountable institutions and effective coordination mechanisms are prerequisites for achieving the objectives of the NAIP. The Programme is anchored on Malawi’s comprehensive set of policies, strategies and plans which are highlighted in Annex 6; and includes a number of global, continental and regional policy frameworks, treaties and commitments. Programme A is also linked to national policies and strategies including higher level national development plans (MGDS III and Vision 2020), the NAP, sub-sectoral and thematic policies relating to agriculture, and related policy areas including gender, climate change, resilience, food and nutrition security.
91. Program A addresses the need for legal, regulatory and policy reforms along with effective coordination mechanisms between various actors - public, non-state and private. The Program will strengthen implementation capacity for service delivery at all levels by among others increasing staffing levels, infrastructure and funding as well as strengthening farmer organisations. Program A will also enhance the availability and quality of data and information to inform implementation of the NAIP and monitor progress. It is expected to deliver the following outcomes:
1. Strengthened capacity for evidence-based planning, implementation and review of policies and Programs;
2. Effective and inclusive policy design, implementation and review processes mainstreamed;3. Improved coordination of public and private stakeholders in agriculture;4. Public agricultural service delivery capacity enhanced according to its mandate; and5. Enabling environment for agribusiness investments improved.
92. Program outcome indicators and targets are summarised in Table 3.4, to the extent available15. Table 3.4: Program A: Outcome Indicators and Targets
Indicator Target Means of VerificationA1: MoAIWD provides its policy, oversight, coordination and service functions efficiently Improvements
Stakeholder surveySector level M&E system Report
A2: Technical working groups, high-level public-private coordination forum and value chain platforms implement their work plans effectively
ImprovementsMeeting minutes, stakeholder feedback and JSR reports
A3: Institutionalised Management Information system for agricultural sector in place 1
Management Information System generated reports
A4: New Alliance and CAP-F Policy commitments implemented by due date
All implemented
Annual New alliance and CAP-F reports
A5: Effective coordination of service-providers at all levels JSR reportsA6: R---atio of extension workers to farmers 1:1,000 Aggregated District level
information reportsA7: Malawi’s ranking in Ease of Doing Business Index
100Ease of Doing Business Reports (World Bank)
A8: Number of days taken to license inputs that have already been accredited in other SADC countries 90 days
MoAIWD data, private sector feedback
A 9: Malawi’s ranking in the ‘Enabling the Business of Agriculture (EBA)’ index
Improvement by 15%
Annual Enabling the Business of Agriculture (World Bank)
15The indicators and targets will be revised during the start-up phase of the NAIP funded under Program A.

27
National Agricultural Investment Plan
93. Given the essential and crosscutting nature of Program A, it contributes to almost all IAs, and vice versa. Key outputs include:
• Strengthening and funding of MoAIWD to finance operational and recurrent costs for oversight and implementation of the NAIP;
• Effective coordination structures within and between sectors, actors, and levels of implementation (from Central to field);
• National M&E system and performance assessment framework in place, JSR reports published bi-annually and relevant surveys conducted regularly;
• Policies and related legal and regulatory frameworks revised, improved and their implementation supported in the areas of farmer organisations and cooperatives, food safety and quality, land tenure, plant protection, seeds, Livestock and fisheries Master Plans, fertiliser policy and bill, FISP, agro forestry, water user’s associations;
• Institutions established, reformed and strengthened, in areas such as food safety, land registration, seed certification, fertiliser regulation, cooperatives and registration of moveable collateral. Reform of ADMARC, refurbishment of soil laboratories and quarantine facilities, accreditation of laboratories, and strengthening of farmer organisations. Capacity for extension, disease control and animal health at district level strengthened;;
• Multi-stakeholder fora established and strengthened, such as a high-level platform for improved public private coordination and dialogue (in relation to the CAP-F), value chain, district level nutrition coordination, food safety multi-stakeholder, research planning and implementation and monitoring of FISP reforms;
• Developing tools, methodologies and capacities including a farmer registry for improving targeting of interventions to different categories of farmers and linkages with the unified beneficiary registry of MNSSP; and
• Databases created and maintained on: farmer organisations, district-level extension service providers, varieties being released and their adoption rates, disaster prone areas (mapping), national tree cover, market information (ICT-based), non-tariff trade barriers.
Program B: Resilient Livelihoods and Agricultural SystemsDevelopment Objective: To strengthen resilience of livelihoods and natural resource base for agriculture.
94. This Program aims at sustainable utilisation of the natural resource base for agricultural production and improved livelihoods for farming households under the challenges imposed by climate change. It contains activities to promote sustainable use of land, water, fisheries and forestry resources, including adaptation measures to reduce the impact of climate change and support production systems and livelihoods strategies. The Program also includes measures to strengthen rural livelihoods by enhancing food and nutrition security, strengthening grassroots organisations, and helping subsistence farmers and vulnerable groups to increase their production and incomes. The program also includes interventions to strengthening resilience and adaptation to climatic (or other) shocks for sustained progress in FNS and to enhance the ability of individuals or community groups to participate in markets. Program B has foundations on Malawi’s global and regional commitments detailed in Annex 6.

28
National Agricultural Investment Plan
95. Program B will also support subsistence farmers to increase the scale and productivity of their agricultural activities and help them to identify the most suitable activities and technologies. It complements other Programs such as the NSSP, the Climate Change Investment Plan and the NRP. Many of the outputs are harmonised with the NRP, which has similar objectives. Others, like irrigation, which is also a priority in the NRP, are included under Program C due to the production-oriented nature of the activities. The NAIP will also support environmental and other initiatives which promote sustainable intensification. It is expected to deliver the following outcomes:
1. Increase in dietary diversity and reduction in food insecurity
2. Improved food safety and sanitation environment
3. Improved natural resource management for sustainable agriculture and livelihoods
4. Incidence and impact of pest and diseases in crop, livestock and fisheries production reached
Program outcome indicators and targets are summarised in Table 3.5.Table 3.5: Program B: Outcome Indicators and Targets
Indicator Target Means of Verification
B1. Number of households, children under 5, and women meeting the 6-food group minimum dietary diversity requirement
25% increase
Specialised M&E study report based on FAO’s guidelines for measuring dietary diversity16
B2. Aflatoxin levels in groundnuts and maize 10 ppb a/ Malawi Program on Aflatoxin Control reports
B3: Size of sustainable fisheries and aquaculture (within biologically sustainable levels) in % of GDP Tbd Department of Fisheries
annual report
B4: Annual increase in area under sustainable land and water management 15,000 ha Department of Land
Resources annual reportB5: Woody biomass levels 15% increase Satellite photography, e.g.
www.globalforestwatch.org
B6: Number of people requiring food assistance Max. 5% per annum MVAC reports
B7: Percentage reduction in livestock mortality rates Chickens 10%, Pigs 8%, Cattle 3% DAHLD annual report
B8: percent of crop area affected by pest outbreaks per year Less than 0.05% Department of Crop Development annual report
a/ ppb = parts per billion
96. Program B includes activities from most IAs. Some indicative outputs are listed below:
• Nutrition-related activities such as school feeding, nutrition education, nutrition fairs, establishment of integrated homestead farming, cooking demonstrations; sensitisation on food hazard impacts and management;
• Groups or farmer organisations established, members trained and supported in enterprise selection;
16FAO (2010). Guidelines for Measuring Household and Individual Dietary Diversity. Nutrition and Consumer Protection Division.

29
National Agricultural Investment Plan
• Strategic grain reserves equipped and facilities rehabilitated;• Rural households trained on risk management and disaster preparedness, and early warning
information disseminated in a timely way;
• Ensuring that vulnerable farming households are also supported through NSSP to ensure complementarity of social protection and production interventions;
• Facilities and stocks in place to respond to major pest and disease outbreaks;
• Farmers trained on small stock management and pass on schemes successfully implemented; farmers produce manure and organic fertiliser;
• Catchment management enhanced through training and institutional strengthening;
• Agricultural and protected land is owned and natural resource management committee is functional;
• Agroforestry activities through large-scale tree planting and related farmer training;
• Community awareness campaigns on HIV Aids implemented; and
• Area under draft animal power and conservation agriculture expanded.
Program C: Production and Productivity for Growth
Development Objective: To increase production and productivity of a more diversified agricultural sector
97. Program C includes core activities related to increasing production and productivity of crops, livestock and fisheries in line with agro-ecologic and market conditions. The Program supports the commercialisation and professionalization of farming. It targets commercially oriented smallholder farmers as well as medium and large farms, with activities oriented towards women and youth entrepreneurs in agriculture. It seeks to reduce productivity gaps across a broad range of crop, livestock and fisheries enterprises and support farmers in diversifying production towards high-value crops and livestock breeds in the priority value chains. Important activities include: (i) generation and dissemination of agricultural technologies and knowledge; (ii) helping farmers to select the most appropriate enterprises and technologies; (iii) improved access to quality inputs through strengthened input supply chains; (iv) support to farmer organisations to strengthen farmer to farmer knowledge transfer and collective action in dealing with market access; (v) improved access to mechanisation services; and (vi) sustainable expansion of irrigated farming.
98. The production orientation of Program C is based on its close alignment with the productivity focus of the NAP as shown in Table 1, Annex 6. Other important policy anchor points for Programme C include, but are not limited to the policies on agricultural extension, fisheries, livestock, seed, fertiliser and irrigation.
99. The main outcomes of program C are :
1. Increased productivity and production of priority value chains;
2. Increased access to and control over productive assets;
3. Timely access to a broader range of quality inputs enhanced;
4. Increased access to sustainable mechanisation services;
5. Increased adoption of GAP and technologies generated; and
6. Sustainable increase of diversified crop production and productivity under irrigation

30
National Agricultural Investment Plan
Program outcome indicators and targets are summarised in Table 3.6.Table 3.6: Program C: Outcome Indicators and Targets
Indicator Target Means of Verification
C1: productivity of target crops and livestock numbers See targets in Annex 2
Crops and livestock specific reports
C2: Number of farmers with land rights recorded under the new land Registries (by sex and age) tbd
Records of District Land Registries; MoLHUD
C3: Percentage increase in farmers using improved seeds100%
Agricultural Production Estimate Surveys reports
C4: Fertiliser usage per ha of arable land60 kg/ha
MoAIWD and specific survey reports
C5: Share of land prepared with mechanised CA implementstbd
Department of Land Resources report
C7: Cropping intensity on existing and new irrigation schemes 150% Department of Irrigation report
100. Program C includes activities from most IAs. Some indicative outputs are listed below:
• Strengthening of agricultural extension and support services including equipment and facilities, on-farm participatory research trials/demos on improved crop varieties and technologies, training of lead farmers, promotion of GAPs through field days, and specialised extension services for specific crops;
• Aquaculture development including restocking of dams, fish cage and pond culture, aquaculture demos, and training for fishers (men, women, youth) on improved management and technologies;
• Rehabilitation of existing irrigation schemes and establishment of new ones, training for irrigation associations and water user associations(WUAs), and provision of specialist extension services to irrigation farmers;
• Support for farm mechanisation including training for machinery operators and mechanics, health and safety training and mechanisation demonstrations;
• Training of farmers on the use of market information, sensitisation of farmer organisations and agribusinesses on contract farming, and capacity building in agribusiness operations; and
• Financial literacy and management skills training campaigns for farmers, women and youth.
Program D: Markets, Value Addition, Trade and Finance for Transformation
Development Objective: To enhance market access, value addition, trade, and access to finance
101. Agricultural transformation requires improved access to markets, increased value addition, increased agricultural exports and trade, and better access to finance. Program D covers these areas by focusing on the downstream segments of agricultural value chains. The main target groups are agribusiness enterprises and farmer organisations engaged in these downstream activities. It includes investment in transport, marketing and storage infrastructure to improve market access and reduce post-harvest losses. Efforts to boost intra-African trade will receive special priority. It also covers training and capacity development for farmers and other private actors on technical and managerial aspects related to processing, marketing and storage, including the use of innovative instruments such as warehouse receipts and commodity exchanges. Private agribusiness investments will be promoted through Agri-food parks and special economic zones

31
National Agricultural Investment Plan
for agro-processing and exports (complementing measures to enhance the business enabling environment under Program A). Through trade facilitation and export promotion, the Program will improve access of farmers and agribusiness to regional and global markets as well as to a broader range of quality inputs. Program D will also improve access to finance for farmers and other value chain actors through technical assistance and new financing and risk management instruments.
102. Program D is linked to the Malabo objective on intra-African trade and the SADC and COMESA regional agricultural development and trade strategies; as well as various national policies on trade and private sector development that are detailed in Annex 6. These include policies related to exports, trade, industries, private sector development, contract farming and financial inclusion among others. Implementation of the strategies and policies will be achieved through the following outcomes:
1. Greater efficiency and transparency of agricultural markets and better market accessed;2. Increased diversification of agricultural exports, with special emphasis on intra-African trade;3. Increased number of farmers/FOs linked to markets and finance;4. Volume and inclusiveness of private investment agribusiness enhanced;5. Increased agricultural value addition and processing; and6. Post-harvest losses reduced.
103. Program outcome indicators and targets are summarised in Table 3.7.Table 3.7: Program D: Outcome Indicators and Targets
Indicator Target Means of Verification
D1: Share of agricultural produce sold on markets tbd Production and productivity survey reportsD2: Share of agricultural exports other than tobacco 60% Annual reports from MoITT, ITC, WTO
D3: Share of high-value and processed products in agricultural exports
20% increase Annual Reports from MoITT, MITC, WTO
D4: Percentage volume of intra-African agricultural trade
20% increase Annual Reports from MoITT, COMESA SADC
D5: Number of farmers under contract farming20%
increase
Annual reports from MoITT; farmer organisation apexes, NA and CAP-F frameworks, CFTC
D6: Privately managed storage capacity 240,000 tonnes
Annual reports from MoITT, Ware House Receipt System and Commodity Exchange regulators and Private Sector surveys. .
D7: Ratio of private agricultural investments to GDP 20% increase
Annual Economic reports
D8: Percentage reduction in post-harvest losses 50% reduction Specialised surveys reports by DAPS
D9: Lending to agric. SMEs and farmers tbd RBM statistics, bank-data, MFIs and
SACCOsD10: Reduction in gap between farm gate and wholesale prices tbd Price surveys reports
D11: Domestic Food Price Volatility Index reduced 10% Biennial Review reporting

32
National Agricultural Investment Plan
104. Program D includes activities from most IAs. Some indicative outputs are listed below: • Formation of agribusiness farmer organisations, training for FO leaders, linkage of FOs to
commodity exchanges and increased number of FOs engaging in contract farming operations;• Upgrading of food safety and quality control systems and training for FOs, processors and
traders. Inspection of processors, traders and food premises for quality control and food hygiene;
• Post-harvest storage facilities improved and farmers and SMEs trained in warehouse receipt systems, post-harvest management, value addition and commodity exchanges. Rural infrastructure (roads, cold stores, markets) constructed or rehabilitated;
• Establishment of fish landing sites and fish marketing facilities;• Support for agricultural mechanisation including a feasibility study on establishment
of a machinery fund and incentives to increase importation of tractors and conservation agriculture equipment; and
• Improved access to finance for value addition and marketing including provision of start-up capital and matching grant
3.5 The Intervention Areas105. This section provides an overview on the 16 Intervention Areas including their objectives/
outcomes, IOs and outputs. Outputs are grouped under the respective Programs to which they contribute (view Table 3.3 in Chapter 3 and Annex 1).
IA1: Policy, Program and Stakeholder Coordination and M&E
Outcome: Effective mechanisms for multi-sectoral and multi-stakeholder coordination to support Program implementation, M&E are in place.
Intermediate Outcomes:• IO 1.1: MoAIWD fully operational and core funding provided to finance operational and recurrent costs for
oversight and implementation of the NAIP.• IO 1.2: Improved coordination of policies and Program implementation partnerships and mutual
accountability at all levels.• IO 1.3: M&E systems and performance management in agriculture functioning and up to date.
106. IA 1 deals with crosscutting issues of institutional capacity, coordination and M&E. The outcomes are based on the CAADP Results Framework level 3 outcomes under “Strengthening Systemic Capacity for Effective Execution and Delivery of Results”. In particular it aims for the twin outcomes of “strengthened capacity for evidence-based planning, implementation and review” and “improved multi-sectoral coordination, partnerships and mutual accountability”. IA 1 recognises the pivotal role of MoAIWD in the implementation of the NAIP, decentralisation process and the recommendations of the CFA, as well as the need for enhanced implementation and coordination capabilities in MoAIWD and its associated agencies. The proposed approach, which is further elaborated in Chapter 6, draws on the lessons learned from implementation of the ASWAp.
107. Successful implementation of the NAIP requires strong leadership and implementation capacity in MoAIWD, including timely and transparent disbursement of sufficient funding for MoAIWD recurrent and implementation costs (such as payment of salaries, maintenance of vehicles and regular monitoring and supervision visits at various levels). The NAIP therefore includes core funding for MoAIWD accordingly under Intermediate Outcome 1.1. While such costs are not always included in NAIPs, it is important to incorporate these and acknowledge that the lack of funding for such activities leads to lack of implementation for all other activities or projects.
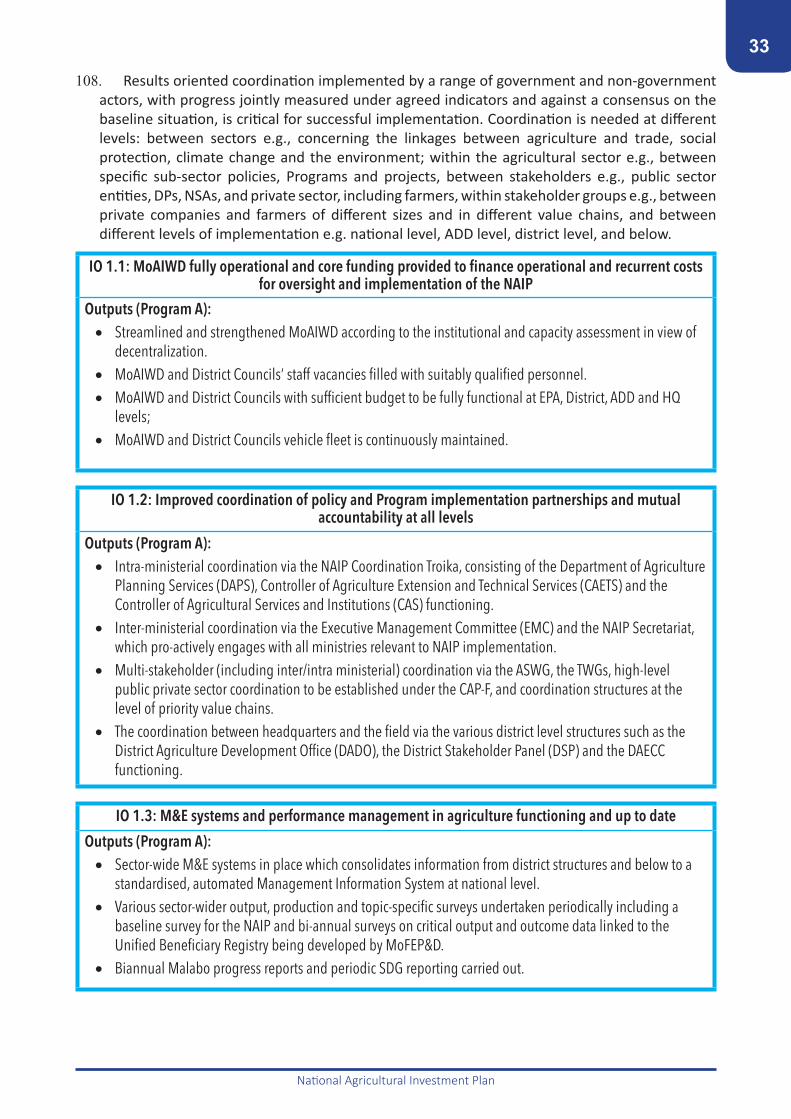
33
National Agricultural Investment Plan
108. Results oriented coordination implemented by a range of government and non-government actors, with progress jointly measured under agreed indicators and against a consensus on the baseline situation, is critical for successful implementation. Coordination is needed at different levels: between sectors e.g., concerning the linkages between agriculture and trade, social protection, climate change and the environment; within the agricultural sector e.g., between specific sub-sector policies, Programs and projects, between stakeholders e.g., public sector entities, DPs, NSAs, and private sector, including farmers, within stakeholder groups e.g., between private companies and farmers of different sizes and in different value chains, and between different levels of implementation e.g. national level, ADD level, district level, and below.
IO 1.1: MoAIWD fully operational and core funding provided to finance operational and recurrent costs for oversight and implementation of the NAIP
Outputs (Program A):• Streamlined and strengthened MoAIWD according to the institutional and capacity assessment in view of
decentralization.• MoAIWD and District Councils’ staff vacancies filled with suitably qualified personnel.• MoAIWD and District Councils with sufficient budget to be fully functional at EPA, District, ADD and HQ
levels;• MoAIWD and District Councils vehicle fleet is continuously maintained.
IO 1.2: Improved coordination of policy and Program implementation partnerships and mutual accountability at all levels
Outputs (Program A):• Intra-ministerial coordination via the NAIP Coordination Troika, consisting of the Department of Agriculture
Planning Services (DAPS), Controller of Agriculture Extension and Technical Services (CAETS) and the Controller of Agricultural Services and Institutions (CAS) functioning.
• Inter-ministerial coordination via the Executive Management Committee (EMC) and the NAIP Secretariat, which pro-actively engages with all ministries relevant to NAIP implementation.
• Multi-stakeholder (including inter/intra ministerial) coordination via the ASWG, the TWGs, high-level public private sector coordination to be established under the CAP-F, and coordination structures at the level of priority value chains.
• The coordination between headquarters and the field via the various district level structures such as the District Agriculture Development Office (DADO), the District Stakeholder Panel (DSP) and the DAECC functioning.
IO 1.3: M&E systems and performance management in agriculture functioning and up to date
Outputs (Program A):• Sector-wide M&E systems in place which consolidates information from district structures and below to a
standardised, automated Management Information System at national level.• Various sector-wider output, production and topic-specific surveys undertaken periodically including a
baseline survey for the NAIP and bi-annual surveys on critical output and outcome data linked to the Unified Beneficiary Registry being developed by MoFEP&D.
• Biannual Malabo progress reports and periodic SDG reporting carried out.
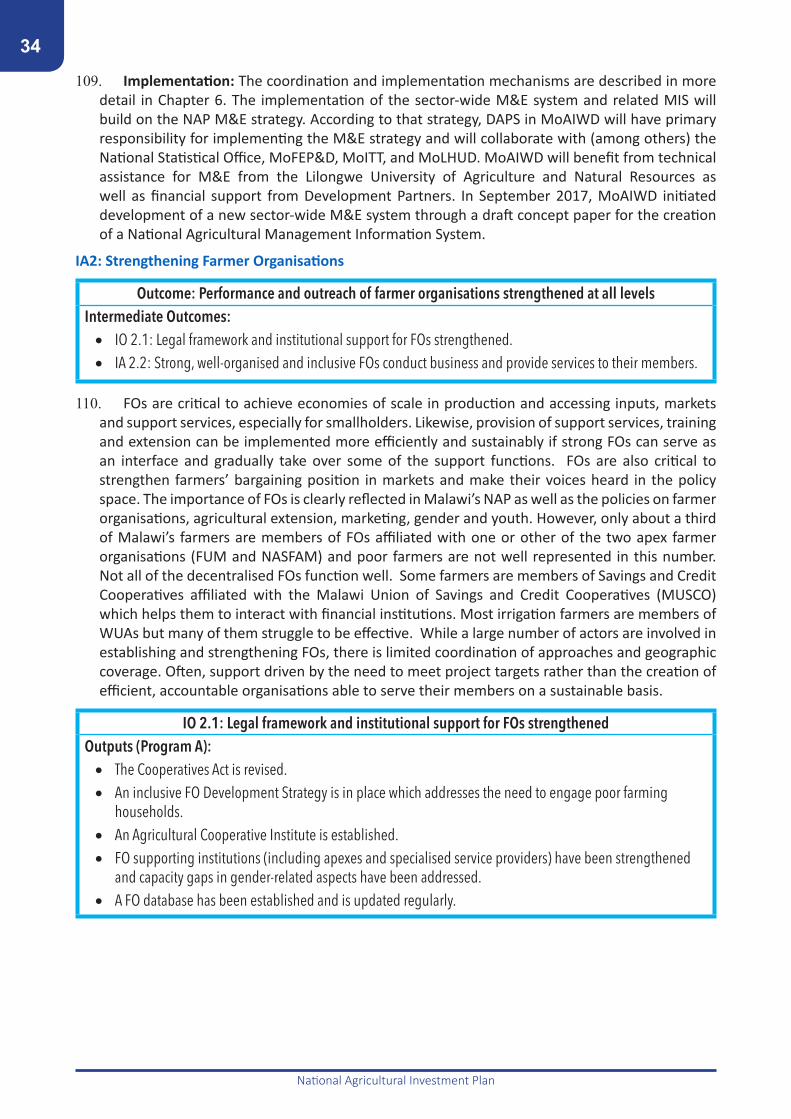
34
National Agricultural Investment Plan
109. Implementation: The coordination and implementation mechanisms are described in more detail in Chapter 6. The implementation of the sector-wide M&E system and related MIS will build on the NAP M&E strategy. According to that strategy, DAPS in MoAIWD will have primary responsibility for implementing the M&E strategy and will collaborate with (among others) the National Statistical Office, MoFEP&D, MoITT, and MoLHUD. MoAIWD will benefit from technical assistance for M&E from the Lilongwe University of Agriculture and Natural Resources as well as financial support from Development Partners. In September 2017, MoAIWD initiated development of a new sector-wide M&E system through a draft concept paper for the creation of a National Agricultural Management Information System.
IA2: Strengthening Farmer Organisations
Outcome: Performance and outreach of farmer organisations strengthened at all levelsIntermediate Outcomes:• IO 2.1: Legal framework and institutional support for FOs strengthened.• IA 2.2: Strong, well-organised and inclusive FOs conduct business and provide services to their members.
110. FOs are critical to achieve economies of scale in production and accessing inputs, markets and support services, especially for smallholders. Likewise, provision of support services, training and extension can be implemented more efficiently and sustainably if strong FOs can serve as an interface and gradually take over some of the support functions. FOs are also critical to strengthen farmers’ bargaining position in markets and make their voices heard in the policy space. The importance of FOs is clearly reflected in Malawi’s NAP as well as the policies on farmer organisations, agricultural extension, marketing, gender and youth. However, only about a third of Malawi’s farmers are members of FOs affiliated with one or other of the two apex farmer organisations (FUM and NASFAM) and poor farmers are not well represented in this number. Not all of the decentralised FOs function well. Some farmers are members of Savings and Credit Cooperatives affiliated with the Malawi Union of Savings and Credit Cooperatives (MUSCO) which helps them to interact with financial institutions. Most irrigation farmers are members of WUAs but many of them struggle to be effective. While a large number of actors are involved in establishing and strengthening FOs, there is limited coordination of approaches and geographic coverage. Often, support driven by the need to meet project targets rather than the creation of efficient, accountable organisations able to serve their members on a sustainable basis.
IO 2.1: Legal framework and institutional support for FOs strengthenedOutputs (Program A): • The Cooperatives Act is revised.• An inclusive FO Development Strategy is in place which addresses the need to engage poor farming
households.• An Agricultural Cooperative Institute is established.• FO supporting institutions (including apexes and specialised service providers) have been strengthened
and capacity gaps in gender-related aspects have been addressed.• A FO database has been established and is updated regularly.

35
National Agricultural Investment Plan
IO 2.2: Strong, well-organised and inclusive FOs conduct business and provide services to their members
Outputs (Program B):• 17,000 groups are supported to establish formalised FOs and have received basic training, including
group dynamics, enterprise selection and management. This will include specific initiatives for youth and women groups.
Outputs (Program C):• 390 FOs have been trained on enterprise management and business development.• 500 leaders of promising FOs have received long term training packages with a view to ensuring that
FOs can assess their management capacity and take decisions accordingly and to improve their business models and receive Malawi Bureau of Standards (MBS) certification.
Outputs (Program D):• 250 FOs have been supported to successfully engage in contract farming arrangements. • 250 agri-business oriented FOs have been formed and supported.• 150 FOs are linked to warehouses receipt systems and/or commodity
111. Implementation: MoAIWD and MoITT support FO strengthening but through slightly different approaches and with different objectives. Both ministries will continue providing these services with MoAIWD developing FOs capacity for production and extension services to their members, and MoITT focusing on business management. Periodic coordination meetings will contribute to harmonising approaches and avoiding overlaps. Government will also take the lead in updating the legislative environment, in consultation with NSAs. Umbrella bodies will take the lead in strengthening FOs in terms of being facilitators of change and in the long-term training packages to develop the FOs as institutions and decision-makers in their own right. Stronger FOs are also expected to engage directly with the private sector to enhance their production and agro-processing, and sell profitably to the market.
IA3: Public Agricultural Services Delivery
Outcome: MoAIWD’s capacity strengthened to provide relevant, market-oriented agricultural extension services in conjunction with/complementary to private sector providers.Intermediate Outcomes:• IO 3.1 Capacity of public sector institutions to provide agricultural extension services strengthened.• IO 3.2 Public extension workers at decentralised levels are equipped with adequate transport, office,
technical and housing facilities
112. This Intervention Area focuses on the capacity of the public sector to deliver services, while farmer-farmer eg. lead farmer approach and farmer field school approach and community capacity building are captured under other IAs (including IA9). This relates more to the Local Government structures, as a consequence of decentralisation. The extension policy outlines pluralistic, decentralised and demand-driven extension services provided by public and non-state actors. However, the public extension system needs to be upgraded to play its role envisaged in the policy.

36
National Agricultural Investment Plan
113. Field extension staff lack basic facilities such as bicycles or motorbikes, as well as office space and decent accommodation. The NAIP will adopt a two-pronged approach by both increasing the number of frontline extension workers and providing them with the transport, equipment and skills needed to be effective. The NAIP will further improve office space and accommodation. In addition, there is a need to maintain a distinction between public and private goods/services so that the Government concentrates on the former and does not crowd-out the private sector in the latter..
IO 3.1: Capacity of public sector institutions to provide agricultural extension services strengthened
Outputs (Program A): • Extension Policy incorporates a pluralistic and innovation-driven approach including non-traditional
extension methods and ICT-based approaches.• Staff externally trained (100 staff short term, 225 staff to BSc level, 225 staff to MSc level and 20 staff to
PhD level). Selection of staff and specific courses will be based on a training needs assessment.• 3,000 frontline staff are trained on technical issues (including fisheries, communication, food safety,
GAPs, agroforestry, trans-boundary diseases, conservation agriculture, water harvesting and extension approaches, etc.).
• Public Veterinary Service gap analysis completed to inform investment strategy for animal health services.• 150 students have graduated from refurbished Malawi College of Fisheries, both diploma and certificate
levels, and including an upgrading of these facilities to standards.• Extension worker vacancy rate is reduced from 46% to 10%; and HQ/ADD vacancy rate reduced from 35%
to 20%. This includes recruitment of EPA level food and nutrition specialists, district level M&E officers and agri-business officers and 61 researchers (crop and legumes breeders, livestock breeders and veterinary specialists).
• Members of staff affected by HIV and AIDS receive a nutrition supplement, to enable them to keep working despite their circumstance.
IO 3.2: Public extension workers at decentralised levels are equipped with adequate transport, office, technical and housing facilities
Outputs (Program A):• All EPAs (204) have maintained office buildings, with a source of power and a housing facility.• All Districts (28) have maintained office buildings. • 13 border post offices and houses are maintained; to monitor cross-border trade, disease control and
matters.• 50 vehicles and 2,000 motorbikes are procured for field operation. • ICT packages are available at 28 districts, 8 research stations and 14 national level offices, including both
internet/communications systems and hardware.• 26 laboratories are equipped, including veterinary labs, bio-security labs, fisheries and chicken hatcheries
and agricultural research stations in general. • All four Government livestock farms have electricity.• Eight fisheries vessels are available, with the necessary equipment and of both larger and smaller scale.• All 22 Residential Training Centres are rehabilitated.• 15,000 front line staff and lead farmers have the necessary equipment, including protective gear, scales
and tools, as well as monitoring and surveillance equipment and motorcycles.

37
National Agricultural Investment Plan
114. Implementation: MoAIWD, in cooperation with other Government Institutions such as MoTPW, OPC and MoFEP&D will be responsible for implementation of the activities. The IA covers all MoAIWD Departments which have a field presence, including DAES, DARS, DAHLD, Fisheries and others. These investments are linked to the decentralisation process, where some assets may be handed over to the District Councils. While majority of expenditures are investments expected to be financed by Government, Development Partners are also expected to contribute.
IA4: Diversification, availability and consumption of Nutritious Foods
Outcome: Diverse, nutritious foods are available and consumed.Intermediate Outcomes:• IO 4.1: Improved implementation, coordination and monitoring of nutrition-related activities in the
agricultural sector.• IO 4.2: Smallholder farmers are linked to food purchase for institutional feeding Programs.• IO 4.3: Nutrition education is widely available at all levels, including grassroots.
115. Improved FNS features at the impact level of the results chain of the NAIP. Most IAs contribute to FNS through at least one of its four dimensions: availability, access, utilisation and stability: through increased production and productivity of a greater diversity of crop and livestock products, better functioning of rural markets, and improved storage and post-harvest handling. IA9 describes the support that poor farmers will receive for increasing and diversifying their production. However, recognising that increased production is not in itself sufficient, FNS has been incorporated into an IA to emphasise some specific interventions focusing on improved coordination of nutrition-related activities and increased nutrition awareness. IA 5 addresses food safety, another key dimension of FNS.
116. IA 4 is firmly rooted in CAADP and the Malabo Declaration, the AU Declaration on Nutrition Security, Compact 2025, the global initiative on Scaling up Nutrition and Priority Area 3 of the COMESA Regional Agriculture Policy. It also responds to Priority Area II of the NAP, the Malawi National Nutrition Policy, the draft National Nutrition Strategic Plan and the draft Agriculture Sector Food and Nutrition Strategy.
IO 4.1: Improved implementation, coordination and monitoring of nutrition-related activities in the agricultural sector
Outputs (Program A):• All districts have Nutrition Coordination Committees which meet regularly• National semi-annual nutrition fora are undertaken• The Nutrition Policy is updated to capture all dimensions of FNS• District-level nutrition data is collected annually for improved surveillance of nutrition activities and
outcomes
IO 4.2: Smallholder farmers are linked to food purchase for institutional feeding ProgramsOutputs (Program B):• School feeding Programs are improved, through local sourcing of foods and advocating for more
diversified food packages used, including e.g. fruits.

38
National Agricultural Investment Plan
IO 4.3: Nutrition education is widely available at all levels, including grassroots
Outputs (Program B):• Four cooking demonstrations have been delivered annually per EPA, using local, indigenous and
diversified ingredients.• 115,000 households are sensitised each year on nutrition-related topics.• 1 million integrated homestead gardens established at household level.• Annual village level nutrition fairs and national nutrition campaigns undertaken, including dissemination
of information through flyers, radio and guidelines for extension workers.• All EPAs have nutrition care groups (as envisaged under the draft Agricultural Food and Nutrition Strategy)
which are operational. Program D• 500,000 farmers trained on food processing for improved nutritional outcomes
117. Implementation: MoHP (Department of Nutrition) and MoAIWD are the co-lead institutions for this IA. At local level, this is supported by extension workers (under MoAIWD) who interact with farmers on a daily basis and provide a channel for dissemination of messages, and by Food and Nutrition Officers at EPA level. Front line staff members, under Ministry of Gender, Disabilities and Social Welfare also provide an avenue for dissemination of messages and interaction with the most vulnerable households. Cash transfer Programs may provide the income required for households to invest in nutrition and to invest in their children. For a number of activities MoAIWD may take the lead, for example in integrated home gardens and cooking demonstrations.
IA5: Food Safety and Quality Standards
Outcome: Food safety and quality standards are established and mainstreamed.Intermediate Outcomes:• IO 5.1: Appropriate and adequate food safety policy, legislation and quality control system is in place.• IO 5.2: Knowledge on food safety issues is enhanced along the value chain.• IO 5.3: Quality control activities undertaken.
118. Food safety quality standards are at their infancy in Malawi. Although food safety is included in Priority Area II of the NAP, implementation of this policy has not taken place. MBS is mandated to carry out quality control services including in areas such as agro-processing, however, the coverage of its operations is limited. MoAIWD and MoHP also have important roles to play in food safety and quality. Most agricultural value chains are covered only partially and the majority of Malawians buy their daily food through informal channels. Supermarkets with certified products are mainly an urban phenomenon and larger food processors account for a small share of total food consumed. However, physical, chemical and biological food contaminants are a threat to food safety – especially aflatoxin, which has serious impacts on child growth and cognitive development. It is estimated that 40% of commodities in local markets in Africa exceed allowable aflatoxin levels. Potential export markets impose strict food quality and safety standards which Malawian exporters cannot always satisfy. However, Malawi has not yet developed a comprehensive food safety and quality policy, and this needs to be done before a food safety law can be enacted.
39
National Agricultural Investment Plan
IO 5.1: Appropriate and adequate food safety legislation is in place, through the following outputsOutputs (Program A):• A food safety and quality policy is developed (in progress) and a food safety law is enacted.• A food safety and quality control agency is established.• Quality standards have been developed, such as monitoring mechanisms for mycotoxins, and residue
levels for pesticides and additives.
IO 5.2: Knowledge on food safety issues enhanced along the value chain
Outputs (Program A):• TWGs and Government officers trained on food safety and quality standards.• Multi-stakeholder platforms meeting regularly, involving, amongst others, the National Codex Committee,
the Malawi Program on Aflatoxin Control and service providers.• Rapid assessment of food safety hazards available.• Data on aflatoxin is regularly updated in the Africa Aflatoxin Management System.
Outputs (Program B):• Information on aflatoxin and other food-borne diseases is widely disseminated.
Outputs (Program C):• 1.3 million Farmers/ fishermen are trained on food safety, including aflatoxin control, and fish sanitation
and diseases.• 900 FOs, SMEs, cooperatives and other commercial producers are trained on food safety management.
Outputs (Program D):• 5,642 food processors trained on different aspects of food safety and quality, such as HACCP standards,
marketing, branding, advertising and packaging.
IO 5.3: Quality control activities undertakenOutputs (Program A):• Establishment of a department within the Food Agency for process control, product examination and
certification. • Two food laboratories accredited by COMESA.• A quality control system, including a database for registration of all food premises.
Outputs (Program D):• 140 inspection visits undertaken, to abattoirs, and other food processing facilities.• 150 monitoring visits to food premises including quarterly audit and accreditation visits.
119. Implementation: MoITT and its subsidiaries like MBS and Malawi Investment and Trade Centre (MITC) have an important role to play in this IA, as well as MoAIWD through extension services delivery and the private sector (including farmers) in upholding food standards. Supervision and quality control is a core public function, and substantial public resource is expected to finance this.
IA6: Empowerment and Tenure Security
Outcome: Women and youth empowered and land tenure security enhanced,Intermediate Outcomes:• IO 6.1: Implementation of the Land Policy supported,• IO 6.2: Increased participation of women and youth in agricultural value chains and institutions,

40
National Agricultural Investment Plan
120. The minimal inclusion of youth, women and vulnerable groups in the agricultural sector hampers Malawi’s growth. It has been estimated that closing the gender gap may increase crop yields by 7.3% per annum and increase GDP by 1.8% (UN Women, 2015). At the same time a growing population and increasing land scarcity makes it difficult for rural youth to make a start in farming. Empowerment of women, youth and vulnerable people including disabled and people living with HIV and AIDS is, therefore, mainstreamed into the NAIP, especially under Programs B and C. The following are examples of some of the gender and youth mainstreaming measures that are included in other Programs and IAs:Measures to encourage participation of women in Farmer Organisations;
• Measures to encourage participation of women in Farmer Organisations;
• Promotion of gender and youth responsive extension approaches;
• Review of the agricultural sector gender and HIV strategy;
• Gender disaggregated guidelines for disaster response;
• Training for Government staff in gender and youth mainstreaming;
• Gender and age disaggregation of all performance targets and indicators; and
• Targets for gender and youth participation in training programs, and access to financial services.
121. In parallel with the above mainstreaming measures, empowerment, coupled with the related issue of land tenure is included as a separate intervention area. IA6 includes activities to organise and train groups of women and youth, review strategies, training and extension materials, and sensitise rural households and service providers on gender relations and land tenure. Access to land is tackled from both the tenure security perspective, and the problem of accessing land for larger scale investments.
122. The importance of equitable and secure access to land is well recognised in a number of continental and regional policy frameworks, as well as nationally through the National Land Policy. However, until recently Malawi lacked an appropriate legal and regulatory regime to achieve its policy objectives. IA 6 supports the implementation of the recently approved Land Law in the demarcation and registration of rural land, and includes specific measures to ensure that women, youth and other vulnerable groups are empowered regarding secure access to land.
IO 6.1: Implementation of the Land Policy supported
Outputs (Program A):• 28 District land registries are established and operational.• Institutional aspects of the Land Policy are implemented, including the development of subsidiary
regulations and a roadmap for implementation.Outputs (Program B):• Annual District-level awareness meetings on the laws for acquiring land for investments.• Annual EPA level sensitisation meetings on land rights, for community members and local and traditional
leaders.
Outputs (Program C):• 91,000 ha of land registered, comprising individual land holdings with priority for women, youth and
vulnerable groups, registration through FOs, and piloting registration of customary estates.

41
National Agricultural Investment Plan
IO 6.2: Increased participation of women and youth in agricultural value chains and institutionsOutputs (Program A):• 30 Government focal persons trained on gender issues.• Agricultural training curricula updated on gender, HIV/AIDS and youth issues.
Outputs (Program B):• 202,500 households have improved gender relations, through household mentoring methodologies.• 17,640 women and youth groups are strengthened and empowered in relation to land tenure security.• A strategy on decent employment is developed¸ dealing with issues of working conditions and child labour
in the agricultural sector.Outputs (Program D):• 300 agribusiness SMEs owned/operated by women and youth are trained on various technical and
business aspects.• 2,000 youth and women agribusiness entrepreneurs receive business mentorship.
123. Implementation: MoLHUD is the lead public agency in relation to land tenure, while MoGCDSW is the primary lead on gender issues, in conjunction with Ministry of Labour and Youth on youth issues and MoAIWD on mainstreaming gender and youth issues in the agriculture sector. In addition to these efforts, many stakeholders, projects and programs support these issues.. Each stakeholder has a role to play to ensure quality and equitable outcomes. The private sector must be encouraged to promote equality amongst their staff as public actions alone cannot solve the issues. Considering the multiplicity of these players, coordination will be critical.
IA7: Disaster Risk Management Systems
Outcome: Capacity to manage disasters and reduce their impact strengthened.Intermediate Outcomes:• IO 7.1: Strategic grain reserves (physical and virtual) in place to ensure household-level FNS during natural
disasters.• IO 7.2: Disaster preparedness strengthened.
124. The increased frequency of climate-induced food security crises requires improved disaster preparedness, early warning and response capacity. This falls within the scope of NAP Priority Area III on Agricultural Risk Management, the guidelines on management of the Strategic Grain Reserve and national policies on social protection. IA 7 includes measures to strengthen the coping capacities immediately after climate-induced disastrous events and to strengthen longer-term adaptation planning to reduce the impacts of such events. Activities include awareness creation and training at community level, promotion of technologies such as local storage facilities and drought/flood tolerant varieties, zoning and mapping, and management of food reserves. The latter requires the proper management of specialised institutions such as ADMARC and NFRA to minimising market distortions and uncertainties. The IA complements activities in other IAs which also contribute to improved resilience, such as GAPs, IPM, sustainable natural resource management, and irrigation development. Disasters related to pest and disease outbreaks are covered under IA 8.

42
National Agricultural Investment Plan
125. On an annual basis, 5-10% of Malawians are food insecure and require food aid, from the SGR and through humanitarian channels. A budget for the average food aid expenditures has been included in order to enable better coordination between emergency response and recovery/development activities and actors within the overall framework of the NAIP. Food aid will be combined with other disaster risk management programs under NSSP which can deliver additional support in the form of cash, near-cash or kind, to food insecure households during emergencies. Use of public works programs would also support disaster-affected households through cash or food for work, and contribute to disaster preparedness through building or rehabilitating community assets (e.g., feeder roads and irrigation works).
IO 7.1: Strategic Grain Reserves (physical and virtual) to ensure household-level FNS during natural disasters
Outputs (Program B)• 240,000 tonnes of grain stored (with a minimum of 90,000 tonnes at all times), incurring storage and
management costs as well as replenishment after years of crisis.• 54 storage facilities rehabilitated and maintained, including 15 metallic silos, 34 concrete silos at Kanengo
and five warehouses at Limbe.• Food is distributed to 5% of Malawian households, possibly more in years of crisis.
IO 7.2: Disaster preparedness strengthenedOutputs (Program A):• Weather stations established in each EPA, including systems for staff training, maintenance, data collection
and analysis.• 50,000 ha of land is zoned and mapped for disaster preparedness.
Outputs (Program B):• 50,000 households have grain storage facilities (silos, sealed bags etc.).• 20,250 farmers trained on disaster risk preparedness and management and, including on-farm
demonstrations and awareness creation on drought tolerant varieties.• Early warning messages disseminated, including establishment of an SMS-based dissemination system
and regular coordination amongst institutions and actors.
Outputs (Program C):• Piloting insurance products: including product design, development of indices and use of remote sensing
and GPS data.• Rehabilitating maize storage silos and ensuring that they are continuously maintained and in use.
126. Implementation: The Department of Disaster Management Affairs under the Office of the Vice President is the main responsible entity for disaster risk reduction and coordination, while NFRA is responsible for maintaining the strategic grain reserves and MNSSP provides social protection ADMARC and NFRA are responsible for procurement of grain. For weather stations, MoLGRD and the Metrological Department are important players. MoAIWD will be responsible for household level demonstrations and on-farm storage. Coordination between these stakeholders will be critical to achieve the priorities, and the TWG for agriculture risk management may consider this in its constituency. From the side of MoAIWD, interventions are guided by the Risk Management Strategy.
43
National Agricultural Investment Plan
IA8: Pest and Disease Management
Outcome: Major pests and diseases are controlled and major outbreaks managed effectively.Intermediate Outcomes:• IO 8.1: Infrastructure is in place to prevent and handle disease outbreaks.• IO 8.2: Pests and diseases outbreaks are monitored and controlled.• IO 8.3 Animal health preventive measures.• IO 8.4: Biotechnology usage up-scaled.
127. Outbreak of crop pests and diseases is a recurrent issue in Malawi. In addition, animal health is an important investment area, currently only handled mainly by the public sector. Preventing and/or controlling major pests and diseases and managing their impacts is a core public function. The main approach promoted is Integrated Pest and Disease Management (IPDM), which complements GAPs, the adoption of drought and flood tolerant varieties, and crop selection based on agro-ecological zone. IPDM contributes to increased productivity and decreased use of pesticides. In order to minimise the risk of exotic pests and disease incursions from outside Malawi, border protection facilities and procedures must be maintained to a high standard.
IO 8.1: Infrastructure is in place to prevent and handle disease outbreaksOutputs (Program C):• Suitable quarantine and other facilities are available, including dip tanks and mist blowers, fish
quarantining facilities, livestock quarantining facilities, improvement of laboratories, related offices, and human capacity development within all of these areas.
• Border protection posts are staffed and equipped to maintain a high degree of bio security protection.• Strategic reserves of pest and disease control materials are always in stock.
IO 8.2: Pests and diseases outbreaks are monitored and controlled
Outputs (Program C):• 2 million ha of agricultural land monitored and controlled for pests, including surveillance of migratory
and emerging pests.
IO 8.3: Animal health preventive measures undertakenOutputs (Program B):• Procedures for bio-security of fisheries and livestock in place; including surveillance, vaccinations,
deworming and disease screening of poultry, cattle, goats and other livestock.• 500,000 farmers are trained annually on animal health and disease prevention.• 5 million poultry vaccinations are implemented per annum.• Large-scale vaccination and dipping of cattle twice a year (2.6 – 4.0 million cattle).• Goat stock dewormed annually (6.5 – 10.0 million goats).• Pigs dewormed and vaccinated annually (1.8 – 4.0 million pigs).• Dairy cattle screened for ticks and TB (71,000 – 106,500 cows).• Vaccines supplied, with the required cold-chains established to maintain them.

44
National Agricultural Investment Plan
IO 8.4: Biotechnology usage up-scaledOutputs (Program A):• 20 staff trained on biotechnology and chemical analysis.• Plant protection regulation reviewed.
Outputs (Program B):• 100 plant clinics established, including development of biotechnology for these.• Agricultural biotechnologies applied through development and commercial distribution.• Five groups for IPM/IPDM implementation are established in each EPA.
Outputs (Program C):• 15,000 farmers are trained on IPM annually.• Agricultural and food imports and exports inspected at border posts for pests and diseases.
128. Implementation: GoM, especially MoAIWD in partnership with private companies and suppliers of equipment, are the main implementers of this IA. Activities will mainly be funded by the government. DPs might be requested to finance IPM and upgrading of quarantine facilities, and farmers are expected to co-finance vaccination and other animal health activities.
IA9: Agricultural Innovation Systems
Outcome: Demand-driven, pluralistic innovation system generates and disseminates relevant and adequate technologies to all farmers.Intermediate Outcomes:• IO 9.1: Efficient research partnerships established in a participatory and demand-driven way, including
on-farm research.• IO 9.2: Relevant, evidence-based extension advice delivered in a demand-driven and participatory way.
129. The The development, adaptation and dissemination of new agricultural technologies are at the core of sustainable productivity increase, diversification and adaptation to climate change. Climate-smart approaches, which seek to balance sustainable productivity increase to meet the needs of a growing population in addressing the challenges of adapting to climate change and reducing agriculture’s carbon footprint to the extent possible, are a key element of this IA. IA 9 responds to a number of important policy foundations. The importance of agricultural research is recognised in MGDS III and the NAP and elaborated in the Agricultural Research Master Plan.
130. Approaches to research and extension have been fragmented, poorly co-ordinated, and lacking focus on key priorities. Moreover, the dominant supply-driven approaches were often not in line with farmer priorities and market requirements, resulting in limited uptake. The innovation systems approach aims at strengthening the integration of research organisations, extension service providers, and end users, to improve the quality and relevance of new technologies. Emphasis is on a consultative approach for identifying best practices in adaptation to climate change and for scaling up of such practices and climate smart agriculture. This calls for gender and youth sensitive processes in setting research priorities and extension approaches and technologies that address the specific needs of the target groups.

45
National Agricultural Investment Plan
131. Participatory approaches should at the forefront of technology adoption. In addition to offering new technologies, service providers should act as facilitators for peer-to-peer learning, choice of enterprises and technologies, and their adaptation to local conditions. The Extension Policy is expected to confirm the relevance of the pluralistic and innovation-driven approach, albeit with some modifications to incorporate non-traditional extension methods and ICT-based approaches. IA9 will enhance the capacity of the public sector to play a leading and coordinating role, including coordination between extension and research (also addressed under IA1) through strengthened decentralised structures to ensure better communication between grassroots and central level.
IO 9.1: Efficient research partnerships established in a participatory and demand-driven way, including on-farm research
Outputs (Program A):• Research coordination activities including establishment of research Programs at research station level;
national plant breeder’s fairs, and coordination meetings amongst public, private and CGIAR research institutions.
• The Malawi Industrial Research and Technology Development Centre (MIRT) strengthened, to produce technologies that reduce post-harvest losses.
• Two stakeholder meetings for technology release are conducted annually.• The Agricultural Research and Extension Trusts’ diversification plan is developed.• Competitive research grants are provided to 50 students.
Outputs (Program B):• Germplasm is conserved, to preserve livestock and plant varieties as well as wild crops.• The Malawi Plant Genetic Centre is re-furbished.
Outputs (Program C):• 18 micro-nutrient bio-fortified varieties are developed.• About 10 new varieties or technologies developed and released annually in areas demanded by farmers,
companies or extension workers.• About five feed technologies developed annually, for both livestock and fisheries.• About 45,000 on-farm participatory demos on GAPs conducted annually, on improved varieties,
indigenous crops, conservation agriculture and other issues identified by farmers.• Detailed analysis of site-specific constraints affecting agricultural performance carried out.

46
National Agricultural Investment Plan
IO 9.2: Relevant, evidence-based extension advice delivered in a demand-driven and participatory way
Outputs (Program A):• District-level databases on extension established.• Livestock master plan developed.• Two agricultural resource centres are operational per district.• GAP guidelines are continuously updated, including development of appropriate messages on climate
resilience, post-harvest management, and conservation agriculture.
Outputs (Program B):• 225,000 farmers participating in goat pass-on Programs, with 45,000 goats annually distributed.• 150,000 farmers participating in chicken pass-on schemes, with 180,000 chickens annually distributed.• 4,500 beekeepers trained on apiculture.• Livestock committees revamped in 2,800 villages.
Outputs (Program C):• The number of lead farmers increased from 20,000 to 35,000.• 10,000 clusters (as an innovative extension approach) are functional every year.• 1,000 farmer field schools are established.• 1,000 green belts are operational per year.• 1,000 model villages established per year.• 22,000 annual field days on GAPs.• 300,000 ha annually cultivated under GAPs.• 800,000 farmers annually receive specialised extension services with special attention to priority value
chains.• 190,000 ha annually intercropped with nitrogen fixing plants.• Annual district agricultural fairs are undertaken.• Various productive inputs are supplied to farmers for demonstration purposes.• 400 farmers using stall feeding methods.• 1,020 grazing areas and 100 water points established.• 50,000 fodder trees planted by dairy farmers.• 5,000 farmers per annum trained on deep pond fish production systems.• 8 fish pond/cage culture schemes established, and potential aquaculture sites are mapped.• 15 dams restocked with fish.
Outputs (Program D):• 245 value addition groups are formed and trained in priority value chains.• 410,000 farmers trained annually on post-harvest management, including cost-effective drying, storage
and shelling methods.• 2,930 FOs trained on processing, including MBS requirements, support to milk producer’s associations,
quality standards, and with market requirements.• Equipment distributed for reducing post-harvest losses for demonstration purposes

47
National Agricultural Investment Plan
132. Implementation: MoAIWD is the lead agency for both extension and research, but this is also an intervention area which requires a large extent of coordination amongst a range of stakeholders; an area which has been particularly challenging in the past. This includes mainly NGOs, CSOs, CGIAR institutions and academia.
IA10: Access to Inputs
Outcome: Farmers have timely access to a broader range of quality inputs at reasonable cost.Intermediate Outcomes:• IO 10.1: Efficient seed supply systems established.• IO 10.2: FISP reforms advanced.• IO 10.3: Supply chains for organic and in-organic fertiliser strengthened.• IO 10.4: Livestock and fisheries gene pool improved and breeding stock made available to farmers.
133. Timely access to agricultural inputs (seeds, fertiliser and crop protectants, breeding stock and fingerlings) that are well-suited to local conditions is critical for enhancing productivity and adapting to climate change. The importance of access to inputs is recognised in the SADC Regional Agricultural Policy and accompanying Investment Plan, as well as the NAP under Policy Priority Area IV. Specific reference to inputs also appears in the national seed and fertiliser policies. Since 2006, the FISP has been the dominant government Program in this area which has attracted the bulk of public spending for the sector. FISP reforms are ongoing and related stakeholder discussions, studies and pilots will be financed by the NAIP. While the future size and scope of the program are uncertain, the 2016/17 targets have been used for the NAIP budget (900,000 beneficiaries). Beyond the FISP, input markets need to be strengthened. Improved access to seeds has been highlighted as policy priority by companies participating in the New Alliance, including reforms to facilitate importation of varieties licensed in neighbouring SADC countries. The Seed Services Unit, which is responsible for seed certification, is currently undergoing reforms to be more efficient and closer to the farmers. An improved regulatory framework is also required to facilitate importation of other inputs such as inoculants, livestock, day-old chicks, veterinary drugs and fertiliser.
IO 10.1: Efficient seed supply systems established
Outputs (Program A): • Import procedures for seeds and other inputs are simplified, especially for seeds which are approved for
use in another SADC country.• Procedures for testing and release of new climate adapted varieties revised and streamlined.• The Seed Bill enacted.• A semi-autonomous Seed Services Unit (SSU) is established.
Outputs (Program C):• FISP is implemented with increased participation of the private sector.• Under FISP 900,000 farmers annually receive vouchers for legume and maize seeds. • 10,000 import permits are issued annually, including the Phytosanitary certificates.• 950 community seed banks established and connected to seed pass-on Programs.• Quantity of basic seed produced increased from 105 to 325 tonnes per annum.• 13,000 tonnes of seed multiplied by farmers, including setting up of demo plots.• Seed Services Unit annually inspects 25,000 ha of seed multiplication (15,000 ha currently).• 75 ha of nurseries for tree and vegetable seedlings are established.

48
National Agricultural Investment Plan
IO 10.2: FISP reforms advancedOutputs (Program A):• FISP reform options studied.
Outputs (Program C):• FISP reform options piloted.• FISP reform options monitored and discussed amongst stakeholders.
IO 10.3: Supply chains for organic and in-organic fertiliser strengthened
Outputs (Program A):• The Pesticides Control Board is strengthened.• A semi-autonomous fertiliser regulatory body is established.• Three soil labs are refurbished.• Options for domestic fertiliser manufacturing evaluated.
Outputs (Program B):• 2,000,000 farmers produce manure and inorganic fertiliser.• National soil maps updated.
Outputs (Program C):• 900,000 farmers annually receive vouchers for fertiliser subsidies under FISP; to a large extent through
private sector distributers, and by providing co-financing.• 300 fertiliser samples analysed annually.• Area-specific fertiliser recommendations developed.
IO 10.4: Livestock and fisheries gene pool improved and breeding stock made available to farmersOutputs (Program A): • Livestock conservation protocols developed.
Outputs (Program B):• Small stock multiplication through farmer breeders, reaching up to 1,000 goats.
Outputs (Program C):• 5,000,000 fingerlings produced annually, including establishment of hatcheries and certification of
private hatchery operators.• 5,000,000 fingerlings restocked annually, including designation of fish breeding grounds and sanctuaries
and restocking of indigenous fish.• 60,000 (up from 10,000) livestock artificially inseminated annually.• Livestock breeding animals sourced, increased from 3,450 to 10,000 animals annually, though both
imports of improved breeds and restocking of Government livestock farms.• 1,400 heifers passed-on, through implementation of a pass-on Program.

49
National Agricultural Investment Plan
134. Implementation will be led and coordinated by MoAIWD in collaboration with private sector and farmers. FISP reforms will be designed, implemented and evaluated by a multi-stakeholder group consisting of MoAIWD, DPs, Academia, NSAs/CSOs, farmers and private sector. Over time, the role of the private sector in input supply chains including FISP implementation will increase and farmers will be expected to co-finance larger share of the cost with the possible exception of subsidies linked to environmental services.
IA11: Sustainable Natural Resource Management and Climate Resilience
Outcome: Natural resources are sustainably managed and the resilience of production systems is enhanced.Intermediate Outcomes:• IO 11.1: Water resources are managed and used sustainably.• IO 11.2: Land use planning and zoning updated and implementation capacity enhanced.• IO 11.3: Area under agro-forestry expanded and management capacities enhanced.• IO 11.4: Lake and rivers fisheries resources are efficiently and sustainably managed.
135. Climate change, land degradation and deforestation are major threats to Malawi’s ecosystem and rural livelihoods. The focus of this IA is on adaptation to climate change according to the UNFCCC definition17 .The NAIP’s response is anchored on a number of Malawi’s global and regional commitments on climate change adaptation and mitigation including UNFCCC, the Paris Agreement and COMESA Regional Agricultural Policy. Climate change response is also included as a cross-cutting theme in many national policies and strategies; MGDS III, the National Resilience Plan and a number of national climate change related policies which contribute to the national Climate Change Investment Plan and policies on land resource conservation and natural resource management.
136. This IA includes measures to enhance the resilience of production systems and promote sustainable management of natural resources. This includes improved land use planning based on zoning and protected areas; sustainable management of fisheries; sustainable management of water resources through catchment management approaches; conservation of genetic resources; up scaling of agroforestry; sustainable intensification of livestock production; organic manure production and use; inter-cropping with legumes; irrigation development; aquaculture development; and enhancement of community and household resilience. These measures are in line with the National Resilience Plan and the MSSP and respond to the commitments of the Intended Nationally Determined Contribution and Climate Change Investment Plan. Also
17UNFCCC defines Adaptation to climate change as actions taken to help communities and ecosystems cope with changing climate conditions

50
National Agricultural Investment Plan
important are the National Catchment Management and Infrastructure Development Guidelines under MoAIWD that will guide this intervention area. In some cases it may be possible to use social protection programs to promote the adoption of climate resilient practices, and to use public works programs to build community infrastructure facilities that support climate change adaptation.
IO 11.1: Water resources are managed and used sustainablyOutputs (Program B):• 200,000 farmers trained annually on rainwater harvesting.• Improved rainwater harvesting and soil moisture management technologies developed.• 3 dams and 1 deep well constructed per district.• Catchment area management strengthened• 1,500 livestock watering points established.
IO 11.2: Land use planning and zoning updated and implementation capacity enhancedOutputs (Program B):• Agricultural and protected areas are zoned in all 28 districts.• District level natural resource management committees are functional through capacity development.
IO. 11.3: Agro-forestry areas expanded and management capacities enhancedOutputs (Program A):• Legislative framework for agro-forestry developed and incentive mechanisms identified.• Tree-cover density targets on agricultural land established at national level.
Outputs (Program B):• 150,000 farmers are trained annually in climate resilient agro-forestry practices.• 2,000,000 ha of farmer-managed natural generation tree-planted areas established.• 22,500 mini-tree nurseries established and properly managed.• At least 30,000 ha and 2,500 km of river banks are planted with trees.
IO 11.4: Lake and rivers fisheries resources are efficiently and sustainably managed
Outputs (Prog. A):• Legal / regulatory framework for fisheries management revised strengthened.• Fisheries master plan developed.
Outputs (Prog. B):• Annual census on fish and aquatic environment undertaken.• HIV/AIDS community awareness campaigns conducted.
Outputs (Prog. C):• 30,000 fisher folk including women and youth trained on improved technologies such as aquaponics and
identification of exotic fish species.• Fisheries technologies developed and analysed, including offshore deep-water fishing.
Outputs (Prog. D):• 20 fish landing and marketing facilities and two docking stations/break-ways established.

51
National Agricultural Investment Plan
137. Implementation: MoAIWD and MoNREM are the lead agencies under this IA, in coordination with NGOs and researchers. This must also be coordinated with the MNSSP and the public works Program catchment management approaches. Government is expected to be a major financier with development partners also contributing. Important Programs to coordinate with include Local Development Fund’s Public Works Programs’ Catchment Management Approach, as well as work under WFP’s Food for Assets interventions.
IA12: Sustainable Irrigation Development
Outcome: Use of irrigation sustainably increased.Intermediate Outcomes:• IO 12.1: Area under functional irrigation systems increased.• IO 12.2 Irrigation schemes are properly managed and maintained.
138. Malawi has well-developed policies in irrigation development and a detailed Irrigation Master Plan, both of which are linked to the national policies on water and environmental protection. There are two institutions with responsibilities for irrigation development: MoAIWD and the GBA. However, irrigation development has always lagged behind Malawi’s national ambitions in this area, largely due to lack of finance for the substantial investments needed and limited technical capacity for system design and construction.
139. Malawi’s irrigation potential is estimated at 408,000 hectares of which 107,000 ha (26%) has been developed with about 46 percent on estates and 54 percent smallholder. Most strategic plans identify irrigation as having potential for adaptation to climate change, sustainable intensification, food security and trade promotion. In line with the Irrigation Master Plan, and overshooting the NAP objective, the NAIP targets to increase the irrigated area by 43,700 ha.
IO 12.1: Area under functional irrigation systems increasedOutputs (Program A):• Capacity for planning and implementation of irrigation work and scheme management is strengthened.
Outputs (Program C):• 36,800 ha of irrigation schemes developed.• 5,100 ha of irrigation schemes rehabilitated.
52
National Agricultural Investment Plan
IO 12.2 Irrigation schemes are properly managed and maintained according to their economic potential
Outputs (Program A):• Irrigation Code of Practice developed and their implementation monitored.• WUA Law enacted.
Outputs (Program C):• 100 irrigation associations have their performance assessed annually.• 64 new WUAs are established and all existing WUAs are trained annually.• Extension services are provided to farmers in irrigated schemes.
Outputs (Program D):• Irrigation farmers are linked to markets and finance.• 50 matching grants are disbursed for irrigation investments.
140. Implementation: Key stakeholders include MoLHUD in terms of land identification and in ensuring tenure security for all involved parties (covered under IA6); MoAIWD in coordinating irrigation projects as well as leading their design and implementation in partnership with the private sector and in provision of extension services. The Green Belt Authority (GBA) is also a major player in irrigation development and in engagement with private sector.
IA13: Mechanisation
Outcome: Improved access to and use of mechanisation services by farmers.Intermediate Outcome:• IO 13.1: Knowledge and skills of providers and users of mechanisation services strengthened.• IO 13.2: Availability and quality of mechanisation equipment and services enhanced.
141. The majority of Malawian farmers continue to use rudimentary hand tools for all farm operations including harvesting and processing. This is highly inefficient and burdens millions of households, making agriculture unattractive, particularly to the youth. Mechanisation is a crucial input for crop production and one that has been underdeveloped and underfinanced in Malawi. Mechanisation is an often-overlooked climate change adaptation measure that, in concert with other activities, can improve the resilience of farming systems. Mechanisation reduces hard labour, relieves labour shortages, improves productivity and timeliness of operations, and contributes to climate adaptation. NAIP will aim at increasing the use of machinery in farming and agro-processing activities by 50 percent. This will be achieved in full harmony with environmental considerations, including the full integration of conservation agriculture principles.
IO 13.1: Knowledge and skills of providers and users of mechanisation services strengthenedOutputs (Program A):• Standards for safety measures and safeguards are developed.
Outputs (Program C):• 425 Health and safety trainings are conducted.• 750 machinery operators/mechanics are trained.• 300 mechanisation demos are conducted.

53
National Agricultural Investment Plan
IO 13.2: Availability and quality of mechanisation equipment and services enhanced
Outputs (Program C):• Government mechanisation schemes make more tractors and CA equipment available.
Outputs (Program D):• Incentives are provided to increase the importation of tractors and CA implements by private sector.• Feasibility study on machinery fund is conducted.
142. Implementation: While MoAIWD is responsible for maintaining Government-owned facilities with tractor and draught animals for hire, the private sector is expected to lead this intervention area. Many of these private stakeholders are farmers themselves, through their farmer organisations.
IA14: Agricultural Markets and Trade
Outcome: Enhanced efficiency and inclusiveness of agricultural markets and tradeIntermediate Outcomes:• IO 14.1: Availability and quality of market information enhanced• IO 14.2: Government price policies are evidence based, transparent and predictable• IO 14.3: Effectiveness, scope and fairness of contract farming improved• IO 14.4: Scope and efficiency of commodity exchanges and warehouse receipt systems enhanced• IO 14.5: Domestic market access improved• IO 14.6: Access to regional and global markets and regional trade enhanced
143. MMalawi has a comprehensive set of policies concerning agricultural marketing and trade, and is party to a number of regional trade agreements that promote intra-African and sub-regional trade. Malawi is a participant in the EIF (linked to WTO), and supports the SADC and COMESA ambitions to improve regional agricultural trade. IA 14 is also founded on several national trade and private sector policy frameworks including the National Trade Policy, National Export Policy, and the TIP-SWAp.
144. Notwithstanding the sound policy foundations, the efficiency and inclusiveness of agricultural markets are hampered by gaps in market infrastructure, information and asymmetries between farmers and downstream actors. Moreover, market interventions through trade policy measures and public grain storage often creates uncertainty for value chain players, reduces prices and margins and leads to under-investment in production and storage. This calls for improved market information and analytical capacity by government along with better coordination between public and private actors. Rural roads and market infrastructure are critical to improve market access, reduce postharvest losses and improve product quality. Commodity exchanges, warehouse receipt systems and contract farming are effective instruments in building more structured markets. An enabling legal and regulatory environment and effective oversight are needed to realise the full potential of these instruments ensuring fairness, competitiveness and security for market participants.
IO 14.1: Availability and quality of market information enhanced
Outputs (Program C):• Various sources of market information are integrated in an ICT-based market information system accessible
to large numbers of farmers and other value chain actors.• Farmers and other value chain actors as well as public sector decision-makers are trained in analysing and
using market information.

54
National Agricultural Investment Plan
IO 14.2: Government price policies are evidence based, transparent and predictable
Outputs (Program A):• ADMARC reforms are implemented.• Evidence-based market intervention and price policy is developed.• The analytical capacity of GoM to analyse market and price trends is strengthened.• Continuous consultations are held with private market players to inform market and price policy
interventions.
IO 14.3: Effectiveness, scope and fairness of contract farming improvedOutputs (Program C):• and stakeholders are sensitised on its content.• The capacity of FOs and agribusiness to engage in contract farming is strengthened.• Increased number of farmers operating under contract farming arrangements.• The Competition and Fair Trade Commission is strengthened through the establishment of a contract
farming unit.
IO 14.4: Scope and efficiency of commodity exchanges and warehouse receipt systems enhancedOutputs (Program D):• 400,000 tonnes of additional quality storage capacity in rural areas is built or rehabilitated through private
investments of PPPs.• Farmers and SMEs trained in warehouse receipt systems and commodity exchanges.• Strengthened capacity of warehouse operators in warehouse operations and use of warehouse receipts.• Increased value of warehouse receipt financing, through linking of FOs, SMEs and banks to the warehouse
receipt systems and commodity exchanges.
IO 14.5: Domestic market access improvedOutputs (Program D):• 5,000 km of rural feeder roads rehabilitated/upgraded, giving priority to supporting PPPs involving
farmers and agribusinesses in priority value chains.• 7,500 km of rural feeder roads spot improved.• Rural cold storage facilities established, including 316 milk bulking centres and five large cold storage
facilities for fruits and vegetables.• 251 Rural market facilities rehabilitated, including livestock markets (two per district), food retail and
wholesale markets.

55
National Agricultural Investment Plan
IO 14.6: Access to regional and global markets and regional trade enhancedOutputs (Program A):• Technical capacity of MoITT to negotiate and implement trade agreements in agriculture strengthened.• Policies related to agricultural trade revised and updated.• Database on non-tariff barriers to trade established.• Trade bans and non-tariff trade barriers in agriculture reduced.• Barcode institution established.
Outputs (Program D):• Trade promotion for agricultural exports on regional and global markets undertaken through market
research, participation in expos/fairs.
145. Implementation: This IA covers a range of activities which fall under different mandates and require the collaboration of various public and private actors. Leadership will be provided by MoITT (IO 4 and 6), Ministry of Transport (IO 5), and shared between MoITT and MoAIWD (IO 1-3). The High-Level Public Private Coordination Mechanism to be established under the CAP-F and the value chain platforms will play important roles.
IA15: Inclusive Private Investments in Agribusiness
Outcome: Increased agro-processing, value addition and investments into the domestic marketsIntermediate Outcomes:• IO 15.1: Enabling agribusiness environment and public-private dialogue strengthened• IO 15.2: Principles for Responsible Agricultural Investment (PRAI) mainstreamed• IO 15.3: Technical and Business skills of cooperatives and SMEs in agribusiness enhanced• IO 15.4: Agribusiness investment promotion and PPPs implemented
146. The policy foundations for IA 15 are in the Malabo Declaration and Malawi’s Private Sector Development Policy and Strategy, the TIP-SWAp, and the policy on PPPs. These recognise that the government can promote private investments through an improved business-enabling environment including stable and predictable policies, supporting legislation and infrastructure and support services. Promotional measures may include tax incentives and special economic zones for agro-processing. Regular consultations between public and private stakeholders will be undertaken through a high-level stakeholder forum in the context of the CAP-F. This will be complemented by multi-stakeholder platforms within priority value chains which will serve to identify PPPs for maximising socio-economic investment impact. The latter will be ensured by applying the PRAI. Such investments are most successful if properly screened at appraisal stage and monitored by competent government entities and civil society.
IO 15.1: Enabling agribusiness environment and public-private dialogue strengthened
Outputs (Program A):• A high-level public-private coordination forum is established to discuss policy, regulatory and institutional
reforms and monitoring their implementation.• Tax and non-tax based incentive mechanisms for priority value chains are established, based on a review of
the existing incentive framework.• The regulatory and institutional frameworks for cotton and tobacco subsectors are strengthened.
Outputs (Program D):• A National Agricultural Fair and centre for excellence is established.

56
National Agricultural Investment Plan
IO 15.2: The PRAI are mainstreamedOutputs (Program A):• Relevant stakeholders sensitised and trained on the PRAI.• Guidelines are developed for screening investors and investment proposals, especially those requiring
access to land and/or proposed for PPPs.• PRAI and related operational guidelines are translated into Chichewa and common local languages.
IO 15.3: Technical and business skills of cooperatives and SMEs in agribusiness enhancedOutputs (Program D):• 150 Cooperatives and SMEs are trained on various business aspects, such as market research, marketing,
development of business plans, etc.• 150 Cooperatives and SMEs are trained on various technical aspects related to post-harvest handling and
agro processing.
IO 15.4: Agribusiness investments and PPPs promotedOutputs (Program D):• 6 additional priority commodity value chain platforms in value chains are established and existing
platforms function effectively, supported by technical assistance.• Agribusiness potential mapped at regional/district level and five Special Economic Zones for
agribusiness established in high potential areas.• Investment commitments under New Alliance fully implemented.• 36 abattoirs in rural and urban centres established.• 75 rural agro-processors are connected to the electricity grid (last mile connectivity).• Annual agribusiness investment fora and fairs undertaken at national and district levels, in order to
identify PPPs.
147. Implementation: Agribusiness development is under the mandate of both MoITT and MoAIWD but also requires collaboration with other public entities, such as local governments, MITC, and entities responsible for rural roads and electricity. Moreover, close coordination with private actors including agribusiness companies, cooperatives and farmer organisations is critical. The High-level Coordination Forum and the value chain platforms will play important roles in orchestrating these various actors. Civil society and NSAs play important roles as service providers and in the implementation of the PRAI.
IA16: Access to a Broader Range of Agri-Financial Services Enhanced
Outcome: Improved access to agricultural finance by all target groupsIntermediate Outcomes:• IO 16.1: Enabling environment for Agri-finance strengthened and specific policy instruments established• IO 16.2: Farmers, especially women and youth are able to use financial services more effectively• IO 16.3: Investment support and start-up activities and adoption of innovative technologies by FOs and
SMEs, with preference to youth and women

57
National Agricultural Investment Plan
148. Malawi’s Financial Sector Development and Financial Inclusion Strategies emphasise the importance of improved access to financial services in rural areas to support agricultural and agro-industrial investment and trade. IA 16 responds to these strategies by measures to increase the diversity, quality and accessibility of financial services (including banks, MFIs, SACCOS and agribusiness) and by sharing risks. The capacity of farmers and other value chain actors to interact with financial service providers will also be strengthened. Access to finance is one of the most critical constraints facing farmers and other food system actors. Farmers and Agri-related enterprises need access to a broad range of financial services including credit, savings, insurance and money transfer. Currently, the supply of financial services is very limited, especially in rural areas. While the spread of Village Savings and Loan Groups is an important step towards financial inclusion, their contribution to agricultural finance is quite limited. Banks and agribusiness are the main sources of finance but loans are mostly limited to larger farmers and enterprises and to a few highly structured value chains (tobacco, sugarcane and tea). Nevertheless, there are opportunities emerging from warehouse receipt financing and the spread of mobile phones and other ICT delivery channels.
IO 16.1: Enabling environment for Agri-finance strengthened and specific policy instruments established
Outputs (Program A):• Feasibility studies and consultations to identify new financing instruments (including a TA facility to
support financial service providers, a risk-sharing mechanism and a re-financing mechanism)18. • At least one financing instruments will be established and their management outsourced to independent
service providers.• A low-cost, electronic registry for movable collateral is established to help reduce collateral constraints.
IO 16.2: Farmers, women and youth able to use financial services more effectivelyOutputs (Program C):• Financial literacy campaigns targeting 220,000 farmers.• Farmers, especially women and youth, and their organisations receive training to strengthen their financial
literacy and financial management skills.
IO 16.3: Investment support and start-up activities and adoption of innovative technologies by FOs and SMEs, with preference to youth and women
Outputs (Program D):• 140 SMEs (with priority to women and youth) annually received matching grants for business start-ups for
agro-enterprises.• 250 agribusiness SMEs receive matching grants for investments in environmentally friendly technologies
to expand their operations.
18The latter might also include the feasibility of establishing an Agricultural Development Bank, as advocated by some stakeholders.
58
National Agricultural Investment Plan
149. Implementation: Rural and agricultural finance is a complex area that requires strong coordination with various actors and policy frameworks. The availability and cost of finance to agriculture depends on improved macroeconomic stability, reduced inflation and lower domestic government borrowing rates (T-bills), as well as on an improved legal and regulatory environment. Activities will, therefore, be led by the MoFEP&D and include collaboration with the Reserve Bank of Malawi (RBM), MoITT, MOAIWD and representatives of financial institutions. Implementation will be closely aligned to the Financial Sector Strategy 2016-20 and the Financial Inclusion Strategy 2015-20 both of which identify rural financial inclusion and agricultural/SME finance as priorities. The NAIP will facilitate coordination of rural finance policies with agricultural sector priorities regarding improved farmer access to financial services.

59
National Agricultural Investment Plan
Chapter 4: Budget and Financing4.1 Methodology150. The NAIP budget has been developed through a bottom-up approach whereby contributions
were received from various stakeholders including all MoAIWD Departments as well as other Ministries and Agencies (MoITT, MITC, MoLHUD). Costs for activities and outputs have been estimated based on unit costs and physical targets over the five-year life of the NAIP. Some of the very detailed activities and cost estimates were consolidated into more generic activities, some of which were further consolidated into more aggregate outputs. The cost estimates are further grouped by Intermediate Outcomes (IOs), Intervention Areas (IAs) and Programs.
151. This Chapter presents the NAIP and its budget at the consolidated output level, not at the level of detailed activities. It starts by presenting the budget by Program and IA using the matrix structure. In addition, the budget is displayed according to the following classifiers:• Sub-sector (crops, livestock, and fisheries)• Main investment areas (inputs, infrastructure and institutional strengthening.)• Expenditure type (recurrent versus investment)• Implementation level (central versus field)• Year
152. Readers seeking more disaggregated cost information at the level of each activity/budget line can refer to the Excel budget file underpinning the aggregate budget presented here. The detailed cost tables can be filtered and aggregated according to a number of classifiers through the use of pivot tables. In addition to the classifiers mentioned above, the Excel file contains additional classifiers for each budget line which allows the budget to be viewed from various angles. For example, activities and outputs can be grouped by NAP Policy Priority Area or Strategy which facilitates monitoring the implementation of the NAP through the NAIP. The classifiers are helpful to guide resource allocation and monitor implementation, as well as to consider the balance between the various Programs, IAs and institutions.

60
National Agricultural Investment Plan
4.2 Budget OverviewBudget by Program and Intervention Area
153. The NAIP budget is estimated at USD 3.219 billion over a five-year implementation period, USD 643 million per annum on average. This represents a 16% increase over the ASWAp, which had a total budget of USD 2.2 billion over a four-year period, averaging USD 550 million per year. Table 5.1 provides an overview the budget allocation by IA and by Program.
Table 4.1: Total NAIP Budget by Program and IA (in USD’000)
Program A Program B Program C Program D Total Share of total by IA
IA1 181,896 - - - 181,896 5.7%IA2 3,317 5,048 7,157 501 16,023 0.5%IA3 93,949 - - - 93,949 2.9%IA4 576 208,669 - - 209,245 6.5%IA5 4,895 580 3,400 1,910 10,785 0.3%IA6 15,325 10,199 2,398 4,690 32,612 1.0%IA7 18,157 392,872 1,500 - 412,529 12.8%IA8 2,844 215,822 13,434 - 232,100 7.2%IA9 3,992 20,471 196,096 211,603 432,161 13.4%IA10 6,195 15,494 338,993 - 360,682 11.2%IA11 3,283 55,894 4,299 1,257 64,733 2.0%IA12 810 - 394,793 384 395,987 12.3%IA13 70 - 15,320 40,085 55,475 1.7%IA14 13,922 - 13,250 495,351 522,523 16.2%IA15 1,330 - - 166,389 167,719 5.2%IA16 21,850 - 3,430 5,430 30,710 1.0%Total 372,408 925,050 994,071 927,600 3,219,129
Share by Program 11.6% 28.7% 30.9% 28.8% 100% 100%
154. The overall budget distribution among the four Programs is balanced. Under Program A (11.6% of the budget) the main items are personal emoluments for MoAIWD staff, collection and utilisation of quality data, and maintenance of EPA-level infrastructure. The largest items under Program B (28.7% of the budget) are the delivery of food aid, the establishment of homestead gardens to enhance FNS, and the monitoring and control of major pests and diseases. Under Program C (30.9% of the budget) the largest expenditures are establishment and rehabilitation of irrigation schemes, FISP seed and fertiliser and artificial insemination. Under Program D (28.8% of the budget) the largest items are the rehabilitation and upgrading of rural feeder roads, followed by the investment amounts pledged by the NA Companies and the construction of on-farm storage facilities. Annex 4 presents the outputs by Program and related budget allocation.
155. The detailed activities (budget lines) under each of the four Programs can be used as a basis for preparing the MoAIWD budget under the proposed Program-based budgeting (PBB) approach. This would be done only for the activities (co)-financed and implemented by MoAIWD during the given year.
156. Table 4.2 shows the shares of the IAs in the total budget for each Program. It shows the relative contributions of the IAs by Program. It also links the IAs to the NAP Policy Priority Areas (PPAs) which allows calculation of the total expenditures and budget shares of each PPA in the NAIP budget.

61
National Agricultural Investment Plan
Tabl
e 4.
2: R
elati
ve B
udge
t Sha
res o
f Pro
gram
s by
IAs a
nd N
AP P
olic
y Pr
iorit
y Ar
ea
NAP
Polic
y Prio
rity A
reas
NAI
P In
terv
entio
n Ar
eas
Prog
ram
APr
ogra
m B
Prog
ram
CPr
ogra
m D
Reso
urce
allo
catio
n pe
r IA
(% /
USD
mill
ion)
3.8:
Insti
tutio
nal D
ev.
Coor
dina
tion
& Ca
pacit
y De
velo
pmen
t
IA1:
MoA
IWD,
Coo
rdin
atio
n an
d M
&E48
.8%
5.7%
181.
9IA
2: Fa
rmer
-Bas
ed O
rgan
isatio
ns
0.9%
0.5%
0.7%
0.1%
0.5%
16.
0IA
3: P
ublic
Agr
icultu
ral S
ervic
es D
elive
ry
25.2
%0.
0%2.
9% 9
3.9
3.5:
Food
& N
utrit
ion
Secu
rity
IA4:
Food
and
Nutri
tion
Secu
rity
0.2%
22.6
%0.
2%6.
5% 2
09.2
IA
5: Fo
od S
afet
y and
Qua
lity S
tand
ards
1.3%
0.1%
0.3%
0.2%
0.3%
10.
83.
7: E
mpo
werm
ent o
f You
th,
Wom
en &
Vuln
erab
le G
roup
sIA
6: E
mpo
werm
ent a
nd Te
nure
Sec
urity
4.1%
1.1%
0.2%
0.5%
1.0%
32.
6
3.6:
Agr
icultu
ral R
isk
Man
agem
ent
IA7:
Disa
ster R
isk R
educ
tion
Syste
ms
4.9%
42.5
%0.
2%12
.8%
412
.5
IA8:
Pes
t and
Dise
ase
Man
agem
ent
0.8%
23.3
%1.
4%7.
2% 2
32.1
3.1:
Sus
tain
able
Pro
ducti
on &
Pr
oduc
tivity
IA9:
Agr
icultu
ral I
nnov
atio
n Sy
stem
1.1%
2.2%
19.7
%22
.8%
13.4
% 4
32.2
IA
10: A
cces
s to
Inpu
ts1.
7%1.
7%34
.1%
11.2
% 3
60.7
IA
11: N
atur
al R
esou
rce
Man
agem
ent
0.9%
6.0%
0.4%
0.1%
2.0%
64.
7 3.
2: S
usta
inab
le ir
rigat
ion
deve
lopm
ent
IA12
: Sus
tain
able
Irrig
atio
n De
velo
pmen
t 0.
2%39
.7%
12.3
% 3
96.0
3.3:
Mec
hani
satio
n IA
13: M
echa
nisa
tion
1.5%
4.3%
1.7%
55.
5
3.4:
Mar
ket D
evel
opm
ent,
Agro
-pr
oces
sing
& Va
lue A
dditi
on
IA14
: Agr
icultu
ral M
arke
ts an
d Tra
de3.
7%1.
3%53
.4%
16.2
% 5
22.5
IA15
: Agr
i-bus
ines
s Dev
elop
men
t 0.
4%0.
0%17
.9%
5.2%
167
.7IA
16: A
cces
s to
Finan
ce
5.9%
0.3%
0.6%
1.0%
30.
7 To
tal
100%
100%
100%
100%
100%
3,21
9.1
Tota
l per
Pro
gram
(USD
mill
ion)
372
.4 9
25.0
994.
1 9
27.6
3,21
9.1
Rela
tive
shar
e of
Pro
gram
10.9
%28
.8%
31.6
%28
.8%
100%

62
National Agricultural Investment Plan
157. Expenditures are also distributed reasonably well across IAs, especially if compared to the ASWAp where expenditures were highly skewed towards Pillar 1 and sub-Program 1.1 (FISP). Broken down by IAs, the largest ones are as summarised in Table 4.3 below:
Table 4.3: Share of Biggest IAs in Total Budget
Intervention Areas Share of budgetIA14 Agricultural Markets and Trade 16.2%
IA9 Agricultural Innovation System 13.4%IA7 Disaster Risk Reduction Systems 12.8%
IA12 Sustainable Irrigation Development 12.3%IA10 Access to Inputs 11.2%
Budget by Main Subsectors and by Investment Categories
158. The NAIP budget analysis presented at main subsectors, activities and investments specific to crop value chain levels amount to 45% of the total budget (USD 1,455.5 million), followed by livestock (7%, USD 219.7 million) and fisheries (1%, USD 39.5 million). The remaining 46.7% of the budget are not specifically linked to any of these subsectors but are related to generic investment and activities cutting across subsectors. Table 5.3 shows the budget allocations of the main types of expenditures and their respective shares in the overall NAIP budget. The largest category is infrastructure (28%) followed by on farm investments (15%), institutional strengthening (11%), and seasonal inputs (9%). Overall, this represents a more balanced investment portfolio than under the ASWAp, including a much lower share of the FISP and a larger share of investments in other productivity- enhancing assets, services and infrastructure.
Table 4.4: Budget by Main Investment Categories (Sub-totals and share of total budget)
Type of investmentTotal (USD
million)
Share of total NAIP budget
Infrastructure Irrigation, roads, market infrastructure, storage and agro-processing, 906.5 28%
Farm level investments
Perennial crops, livestock farm level storage, FNS (homestead gardens) 478.2 15%
Institutional strengthening
hardware, systems and training of key institutions and coordination mechanisms
365,4 11%
Seasonal inputs Seeds, fertiliser, pesticides, fingerlings 304.2 9%
Training and sensitisation
Awareness creation and training of private AFS actors (farmers, processors and FOs).
183.6 6%
Research Research programmes and HR strengthening 89.6 3%
Equipment and machinery Farm-level and downstream equipment and implements 46.2 1%
Other19 27%
19 For this reason, some output targets are round numbers whereas in other cases there are specific targets resulting from various outputs targets of similar dis-aggregated activities which were combined to a more generic, higher level output.

63
National Agricultural Investment Plan
Budget by Program and Year
159. Table 4.5 shows the distribution of the budget by Program and year. The amount per annum is relatively stable, with a slight progression from USD 619 million in year 1 to USD 672 million in years 5. This progression reflects the sequencing of some of the activities and a gradual increase of investments over time. For example, legal and regulatory reforms, feasibility studies, strategies and master plans, as well as institutional reforms are mainly budgeted during years 1 and 2, many of which trigger an increase in other activities and investments in following years.
Table 4.5: Budget by Program and Year (in USD’000)
Year 1 Year 2 Year 3 Year 4 Year 5
Program A 77,754 80,257 82,123 65,917 66,356Program B 173,320 179,068 183,895 190,520 198,247Program C 178,142 187,915 194,652 203,276 230,087Program D 190,262 192,521 185,896 181,080 177,841
Total 619,478 639,761 646,565 640,794 672,530
Budget by Expenditure Category
160. Capital expenditure accounts for 62% of the budget while 38% are recurrent costs (see Table 4.6). This marks a major departure from the ASWAp which was dominated by recurrent expenditure items. This change reflects the reduced share of the FISP in the budget and an increased share of investments in productive infrastructure. The largest recurrent expenditure items include food aid, FISP subsidies, monitoring and control of pests and diseases, and staffing costs. Activities related to capacity development, training, and coordination are also classified as recurrent costs. The largest capital investments are related to irrigation, rehabilitation of feeder roads, post-harvest drying equipment and storage, nutrition-related investments at household level (kitchen gardens), and research.
Table 4.6: Breakdown by Expenditure Category
USD ‘000 % Capital 2,001,743 62.2% Recurrent 1,217,386 37.8%
Total 3,219,129 100.0%
Budget by Expenditure Level
161. Table 4.7 shows the level at which the budgeted activities will be implemented. Overall, 85% of the budget is allocated to the decentralised and field-level activities, whereas 15% is for activities at central/national level. Only Program A contains mainly central/national level activities whereas the other three Programs mainly consist of field level activities. However, this does not imply that an equivalent share of the budget needs to be transferred to the districts. First, several large-ticket items combine local and central level expenditures. For example, FISP and Food Aid require centralised procurement and local distribution and such breakdown within activities has not been done in the NAIP budget. Second, in view of the capacity constraints at district level in terms of fiduciary management, a substantial share of the budget will be managed centrally or through Program Implementation Units (PIUs). As local capacities improve in the course of the decentralisation process, an increasing share of human, technical and financial resources will be transferred to the districts.

64
National Agricultural Investment Plan
Table 4.7: Expenditure Level by Program
Central level Local level
USD ‘000 % USD ‘000 %
Program A 259,383 70% 113,025 30%
Program B 51,237 6% 873,812 94%
Program C 125,618 13% 868,453 87%
Program D 49,593 5% 878,006 95%
Total 485,831 15% 2,733,298 85%
4.3 Financing AvailabilityGeneral
162. This chapter combines the available information on the funding from various sources and identifies the gap that requires additional resource mobilisation in order to fully fund the Plan. The estimates are mainly based on budget projections such as Medium-Term Expenditure Frameworks (MTEFs) for key ministries and ongoing/pipeline projects of the main DPs, as well as on funding patterns and disbursement trends over the past five years. The Agricultural Sector Performance Expenditure Review (AgPER) covering the period from 2000 to 2013 and the ASWAp Review (2016) are further sources of information. In view of the scope of the NAIP beyond the core mandate of MoAIWD, funding projections in adjacent areas (e.g. nutrition and trade) were also assessed. Three different sources of funding were considered:• On-budget Sources: GoM funding to MoAIWD (as shown in the MTEF); funding to MoITT
which relates to agricultural sector objectives (also in the MTEF); GoM transfers to districts (related to agriculture); and DP on-budget support to MoAIWD, districts or other ministries and agencies (e.g. projects financed by WB, IFAD or AfDB).
• Off-budget Sources: donor funding, CGIAR funding from outside the DCAFS group, NGO financing from outside the donor group, and DARS off-budget income.
• Non-traditional Sources which are not aligned to the NAIP but may still contribute to its objectives. This includes private sector funding (from farmers, domestic private sector, and foreign investments), grants from development funds, climate change funds or similar, as well as financing from other sectors that support the NAIP objectives, for example humanitarian disaster response.
163. These sources are described in detail below and quantified where possible. Historically, the agricultural sector has received substantial funding from GoM and DPs, even though there has been a declining trend in recent years. The past two years have seen both lower levels of FISP expenditure, and less Government resource allocation to the sector. Donor funding has been affected by domestic fiduciary issues and global trends such as reduced availability of traditional ODA. On the other hand, new funding sources are appearing including charitable foundations and new DPs from emerging countries.

65
National Agricultural Investment Plan
MoAIWD MTEF
164. Historically, GoM Funding for MoAIWD as a share of the government budget was high, although most of it was allocated to the FISP. In most years, over 90% of the allocated funds were disbursed. GoM provides three-year projections for ORT under the MTEF. However, personal emoluments and the development budget components are not projected, as staffing levels are set outside the budgeting process, and the development budget is mainly counterpart funding for DP-funded projects. Both the AgPER and ASWAp reviews confirmed that the share of capital expenditure in the GoM budget has been very low, generally below 5%, since 2008 (see Table 4.8). However, capital items are often budgeted under ORT instead of the development budget which makes the picture less clear.
Table 4.8: Historical Budget Allocations for MoAIWD
2011/12 2012/13 2013/14 2014/15 2015/16 5-year Ave
Share of approved GoM budget to MoAIWD* 12% 16% 19% 19% 18% 17%
GoM allocation to Development (Part II)*
4.5% 2% 3% 4.5% 2% 3%
MoAIWD Personal Emoluments (billion MKW) 3.4 3.8 3.9 4.6 6.7 4.5
* Mainly used for co-financing for projects financed by DPs.
165. Table 4.9displays the ORT projections for MoAIWD from FY 2016/17 until 2020/21, based on the current PBB system. The budget allocation pattern in Table 5.11 means that over 95% of the recurrent budget will be allocated to the Agricultural Productivity and Risk Management Program, which includes the FISP. ORT funding levels are expected to grow from the current MK 69.4 billion to MK 101.6 billion in 2021. The projection applies a 10% annual growth rate, which is in line with the current inflation rate.
Table 4.9 MoAIWD ORT Projections
ProgramProjected Recurrent Budget (MKW millions) 2016/17
(USD millions)
2016/17 (*)
2017/18(*)
2018/19(*)
2019/20(**)
2020/21(**) Total
Agric Productivity & Risk Management 68,439 75,283 82,811 91,092 100,202 417,827 95.59
Water Resources Development, Management & Supply (***) 43 47 52 57 63 262 ---
Livestock & Fisheries Production 314 346 380 419 460 1,919 0.44Sustainable Rural Development 173 190 209 230 253 1,055 0.24Management & Administration 436 480 528 580 639 2,663 0.61
Total 69,406 76,347 83,981 92,379 101,617 423,730 96.94
Source: (*) GoM, MTEF Projections; (**) Authors projections
Note: (***) Resources for Water Development are not included in the NAIP projections, and thus not included in the totals
166. Ideally, the MTEF budget projections should be the basis for medium-term expenditure planning of interventions. However, experience shows that this is not the case, as Treasury provides annual ceiling allocations to the sectors including Agriculture. The disregard for the MTEF is driven by a number of factors including annual variations in the national resource envelope as well as changes in national policy priorities

66
National Agricultural Investment Plan
167. Given the uncertainties about future inflation and funding levels, the 2016/17 budget, converted into USD, is used as the baseline for projection. This results in an estimated budget of USD 485 million for MoAIWD during the NAIP implementation period. To this, PE and Development Budget projections need to be added. Irrespective of the uncertainties, it is likely that the agricultural sector will continue to receive a substantial share of the national budget. Even though FISP expenditures, historically a major budget allocation, are decreasing, funding is expected to be re-directed towards other agricultural sector requirements, such as irrigation development and agricultural commercialisation.
DCAFS Funding Commitments and Disbursements
168. Funds committed: The current portfolio of DCAFS projects (see Table 4.10) indicates a financing commitment of USD 1.172 billion, with USD 749 million (64%) yet to be disbursed. The projects have different implementation periods and are currently aligned to the ASWAp framework. While some projects are phasing out, there are several large pipeline projects, of which seven have been identified with a total budget of USD 544 million. Taken together, un-disbursed commitments relating to ongoing and pipeline projects from the DCAFS members add up to USD 1,293 million during the NAIP implementation period, or USD 259 million per annum
Table 4.10: DCAFS Commitments to the Agricultural Sector February 2017 (USD Million)
Commitments Committed Amount Disbursements to date Carryover Per yearOn-going projects 1,1712 423 749Pipeline projects (2017- 2026) 544 544Total 1,716 423 1,293 259
Source: DCAFS data base & contacts with development partners
169. Funds Disbursed: Table 4.11 displays annual disbursement rates of DCAFS donors between 2010/11 and 2016/17. These fluctuated between USD 102 million and USD 198 million, with an average of USD 155 million. This shows that the binding constraint is not the overall level of committed funds but the disbursement rate. Hence, rather than resources commitments, DCAFS disbursements are dependent upon several factors including the absorption capacity of partner institutions, issues related to governance and fiduciary practices, as well as changing donor priorities (global, amongst countries and within countries, between sectors and within the sector). The latter includes short-term reallocation of resources from agricultural development into emergency response in response to natural disasters.
Table 4.11: DCAFS Disbursements, 2010/11 to 2015/16 (USD millions)
Year USD millions2010/11 1602011/12 1392012/13 1172013/14 1022014/15 1882015/16 1862016/17 198
Total 892Average per annum 155
Source: DCAFS data base

67
National Agricultural Investment Plan
170. The NAIP’s emphasis on strengthening institutions and implementation capacity at all levels (under Program A) is expected to contribute to increasing disbursement rates, building on the positive trends during the past two years. Hence, over the NAIP implementation period, average DCAFS disbursements of around USD 200 million per year are expected. Moreover, since the NAIP includes a budget for emergency response in the form of food aid, a large share of emergency response funding will remain within the agricultural sector, contributing to a more stable resource envelope and improved coordination between development and emergency response programming. In consequence, DCAFS funding for risk management and food aid under MVAC needs to be added to the resource envelope. According to the DCAFS Secretariat, average disbursements for food and other emergency assistance amount to around USD 40 million per annum during the last decade.
Allocation of DCAFS Committed Funds by NAIP Programs171. Table 4.12 maps the committed DCAFS funds according to the NAIP Programs. Program C
would receive around 60% of DCAFS funding in both current and pipeline projects, while an increasing share of financing is being directed towards Program B. This presents a significant change from the ASWAp where most funding was allocated to Pillar 1: Food Security and Risk Management. An analysis of larger DCAFS projects (see Annex 3, 4 and 5 for details) shows that the NAIP matches many of the evolving DP priorities in areas such as irrigation and water development, market development, capacity building and risk management. Overall, DCAFS donor support is focused largely on Program C whereas Programs B and D are comparatively underfunded. The allocation to Program A activities is in line with this Program’s share in the NAIP budget. This calls for some rebalancing of DP funding from program C into programs B and D.
Table 4.12: Allocation of DCAFS Funds Committed by NAIP Programs
A: Enabling Environment:
B: Resilience C: Production & Productivity
D: Markets Total
On-going projects
Allocation 162 83 596 207 1,048(%) 15% 8% 57% 20% 100%Pipeline commitments Allocation 11 88 351 95 544(%) 2% 16% 64% 17% 100%Total 172 170 947 302 1,592(% share) 11% 11% 60% 19% 100%
Notes: projections used for pipeline projects which are still tentative and the commitments contain activities which are non-agricultural sector and hence not included
Source: DCAFS database and own projections

68
National Agricultural Investment Plan
NGO Funding172. A recent study by the Civil Society Agricultural Network (CISANET) indicated that besides the
off-budget support from DCAFS donors, NGOs also mobilise significant funding from other sources including funds mobilised by their head offices, funds received from non-DCAFS donors, and from domestic sources. Thus NGOs are regarded as an independent source of funding for NAIP.
173. A survey was implemented to estimate future funding levels of NGOs. Responses were received from 21 NGOs and are summarised in Table 4.13. However, except for a few larger on-going projects, NGOs were not able to provide financial projection for more than one year, given their dependence on largely unpredictable donor funding. This concern is understandable considering the variability in donor funding to the NGOs, which for the period 2007/08 and 2011/12, oscillated between USD 40 million and USD 100 million (World Bank, 2014). A total investment of USD 44 million was planned for fiscal year 2017/18, a slight increase from the USD 40 million yearly average captured by the 2015 CISANET report, most likely caused by a higher response rate than for that study. USD 44 million is at par with expenditure levels over the past five years and therefore this level is used for projections for the NAIP implementation period. Almost two thirds of the total NGO investment (62%) targets household resilience, followed by agriculture production at 25% and about 13% percent for both value chain development and institutions pillars.
Table 4.13: Projected NGO Funding during NAIP Implementation Period (USD million)
Total A: Enabling Environment B: Resilience C: Production &
ProductivityD:
Markets2017/18 planned 44.5 2.6 27.8 11.2 2.95 year projection 222.6 12.9 138.9 56.0 14.7Percent 100% 6% 62% 25% 7%
Source: Primary data collected from 17 NGOs174. The projected NGO investments are substantial, but the uncertainty of funding levels has
implications for the financing plans. The NAIP, therefore, outlines more stable funding modalities for the sector, and seeks to strengthen collaboration between the NGOs and Ministries (for example through the use of NGOs as service providers), which is a guiding principle of the NGO Act, to ensure continuity of the NGO interventions.
Funding for Research Institutions175. According to the AgPER, research institutions contributed about 8% of the funding to the
sector; the majority though CGIAR institutions and some through DARS income-generating activities (see Table 4.14). ). Funding research is a CAADP indicator and the area has been underfinanced in the past. The CGIAR funding for Research and Development investments comprise both DCAFS and non-DCAFS resources. Out of the seven CGIAR centres represented in Malawi four made information available on their expected budget during the NAIP period. Overall, the projected contributions are small, declining and less predictable.
Table 4.14: Combined R&D Projected Financing
InstitutionFunding Amounts (USD million) Annual
Average2016/17 2017/18 2018/19 2019/20 2020/21 TotalCGIARs combined* 4.00 4.09 3.84 3.26 2.70 17.89 3.60DARS off-budget ** 0.60 0.60 0.60 0.60 0.60 3.00 0.60Total 4.60 4.69 4.44 3.86 3.30 20.89 4.20
* The figures here are tentative as they are from four of the six CGIAR institutions contacted.**the DARS figures are projections of the AgPER data of 0.6 million in 2011/12Sources: CGIARs and AgPER

69
National Agricultural Investment Plan
Non-Traditional Financing Sources176. Non-traditional sources provide substantial funding for the agricultural sector. Some of
these are from related sectors such as climate change, resilience or private sector development. Examples include the; Global Environmental Facility (GEF), Gates Foundation, McDonalds Fund and Rockefeller Foundation. There is also a group of bilateral donors who are not resident in Malawi and not part of the DCAFS group but provide substantial funding to the sector. In addition, there are small national and international groups or initiatives which provide financing, including national NGOs. While the amounts provided by each source within these categories is comparatively small, and monitoring is a challenge, their aggregate financial contributions can be substantial.
Private Sector Financing177. Quantifying private investments in agriculture is challenging due to the lack of reliable
data. The only current data on agriculture private investments is the New Alliance/Grow Africa data base. However, the data are self-reported by participating companies and are not verified independently. Moreover, the 29 companies (19 domestic and 10 international) that have signed Letters of Intent under the NA and GA frameworks only represent a subset of the private sector in agriculture. The total investment made by these companies in 2015/16 was US$41.9 million and cumulative investments since the start of NA/GA in Malawi amount to US81.5 million. The remaining commitments of USD 148 million have been included in the NAIP budget. Future investments by other private actors, including companies and farmers of different sizes, are unknown and difficult to project at national level.
178. However, international evidence20 shows that farmers are the main financiers of the sector and are expected to make important contributions through co-financing of most NAIP activities. The private sector including farmers is expected to co-finance activities amounting to USD 1.4 billion (46% of the total NAIP budget). Such financing would be in cash or in-kind for a broader range of investments and services21 .Private agribusiness and SMEs receiving matching grants or participating in PPPs will also make contributions. Assuming an average co-financing share of 20%, this would result in USD 293 million being mobilised by the private sector. Combined with the USD 148 million of investments pledged under the NA/GA, total private financing would be at least USD 441 million.
Other Related Sectors179. Given the broader scope of the NAIP beyond the confines of MoAIWD, two other important
sectors have also been considered as sources of funding: trade and nutrition.
180. Nutrition is a key area for investment and coordination. Most nutrition Programs are implemented by the MoHP Department of Nutrition and HIV/AIDS. Given that nutrition is not a traditional sector with a dedicated ministry, public financing is split between the various spheres of influence, including MoHP for health-related activities, MoAIWD for extension and water, sanitation and hygiene. To strengthen coordination the DPs have formed the DoNUTS group which maintains a database (see Annex 5, Appendix 5.2) of donor financed projects in that area. Most projects focus on child health, hygiene and sanitation, malnutrition management and related areas. These are complementary to some of the agriculture sector investments under the NAIP. The fact that the DCAFS and DoNUTS groups have full time coordinators is possibly a starting point for closer collaboration in project design, implementation and review. However, in terms of financing, these activities are not included on the supply side of the NAIP.
20 FAO (2012) The State of Food and Agriculture: Investing in Agriculture for a Better Future21The main ones reflected in the NAIP budget include FISP vouchers, other inputs and equipment for production and postproduction, as well as the construction and rehabilitation of transport, storage and marketing infrastructure

70
National Agricultural Investment Plan
181. Trade, Industry, Private Sector and SME development. In an agro-based economy like Malawi, agriculture and trade are closely interlinked – one cannot thrive without the other. The same applies to private sector development and industrialisation. In terms of funding, there is a need to coordinate resources and implementation to maximise synergies between the two sectors. As with other sectors, funding comes from both public and donor resources. Projections from the public comes from MTEF ORT projections, while donor financed projects are monitored and coordinated in the Private Sector Development Group (see Table 4.15).
Table 4.15: MoITT ORT projections 2016/17 - 2020/21
ProgramProjected Recurrent Budget (MKW millions) 2016/17
(USD millions)
2016/17(*)
2017/18(*)
2018/19(*)
2019/20(**)
2020/21(**) Total
Trade Development & Facilitation 73 77 80 84 93 73 0.102Industrial Development 91 95 100 105 116 91 0.127Private Sector Development 40 42 44 46 51 40 0.056Small Scale Business Development 123 129 136 142 157 123 0.172Total 327 343 360 378 417 327 0.456
Source: (*) GoM, MTEF Projections; (**) Projections provided by MoITT. Selected Programs only (budget related to administration and tourism not presented)
182. The MTEF projections show a 5% annual increase in recurrent resource allocation to MoITT, compared to 10% for the agriculture sector. Furthermore, the MoITT recurrent budget allocations are much smaller than MoAIWD. The MoITT resource envelope (excluding administration and tourism related expenditures) amounts to less USD 0.5 million per annum. The potential for MoITT financing of NAIP activities is therefore limited. Other sources of funding will, therefore, have to be allocated to trade-related activities.
183. Donor financing in the trade sector seems to be less in quantity and less coordinated than in the agricultural sector (see Annex 5, Appendix 5.3). From the donor perspective, there are several dominant themes, such as value addition, business environment, manufacturing, skills development, and access to finance amongst others. However, most of these initiatives are underfunded. Additional funding might be sourced from “Aid for Trade Funds” under the EIF and through challenge fund mechanisms supporting private sector development.
Summary on Resource Mobilisation
184. Table 4.15 provides a summary of projected resource availability, funding targets and the financing gap for the NAIP. The aggregation of the various funding sources reveals an availability of about USD 400 million for the 2016/17 fiscal year (baseline)22 . DCAFS donors are expected to contribute USD 240 million, MoAIWD USD 111 million, whereas NSAs will contribute around USD 50 million. This figure does not include funding from other domestic and foreign sources, on which no data were available. Extrapolated over five-years, the total funding from identified public sources and NSAs is projected at around USD 2.0 billion. Adding USD 441 million of private sector co-financing results in a total funding envelope of 2.4 billion under the baseline scenario. The resulting funding gap amounts to USD 776 million, approximately 24% of the NAIP budget including food aid. The baseline scenario does not include some funding sources for the sector that could not be quantified: these include non-aligned donor funding outside the DCAFS group and other government resources, such as transfers to the districts for agricultural activities and to the GBA.
22While the actual MVAC Response budget was much higher due to the drought, the 10-year average amount is used for the baseline scenario.

71
National Agricultural Investment Plan
185. While the baseline scenario is based on recent funding sources that have been clearly identified, the NAIP is expected to mobilise additional funds and to improve absorption capacity. The committment of DPs, Treasury and others to increase funding levels to agriculture depends on the existence of a coherent and nationally-owned investment framework and on absorption and implementation capacity. The NAIP provides such an investment framework and focuses on strengthening the implementation capacity of government and NSAs at all levels, especially under Program A. It may, therefore, be assumed that additional resources could be mobilised from the main traditional funders, Treasury and DCAFS; as well as from non-traditional sources. Scenario 2 in table 5.20, therefore, assumes a moderate increase in MoAIWD’s budget, as well as for the funding levels of DCAFS donors and NSAs. For DCAFS, the average committed funding of USD 259 million is considerably higher than the baseline scenario. Hence, a 15% increase of the amount disbursed (USD 30 million per annum) is projected under Scenario 2, resulting from increased DCAFS commitments and improving implementation capacity. This scenario also assumes that USD 150 million can be mobilised from non-traditional funding sources, such as foundations and philanthropy, non-DCAFS donors, funds from other sectors such as environment and climate change, and government resources provided to the districts. As shown in the right-hand column of Table 4.16, if these sources are considered, the funding gap is substantially reduced to USD 334 million (approximately 10% of the budget). If the budget for food aid (which is highly unpredictable) is taken out, the funding gap reduces to 24% and 10% under the two scenarios, respectively.
186. The financing scenarios embodied in Table 5.15 are subject to the challenges and uncertainties of funding from multiple sources. However, even the more ambitious Scenario 2 is deemed achievable in view of the broader scope of the NAIP and the related possibility to access non-traditional funding sources, including for adjacent sectors. The funding gap could be addressed through any or all of the following strategies: aligning additional DPs to the NAIP, increasing government funding, increasing DP disbursement rates, and mobilising non-traditional funding sources, including the private sector. Alternatively, and subject to funding availability, some investments could be scaled-down or deferred. Decisions on the latter will be made each year during the AWPB process based on the actual funding envelope available. The ability to mobilise resources also depends on the progress and performance of the NAIP implementation itself.

72
National Agricultural Investment Plan
Table 4.15: Summary of Projected Resource Availability, and Funding Targets and Financing Gap (USD million)
Funding source 2016/17 projected
5-year Scenario
1
% increase
Increment over 5 years
5-year Scenario 2
MoAIWD:- ORT- Development- PE- Subtotal MoAIWD
96.94.89.3
111.0
484.724.246.5
555.4
+10%+50%+50%
48.512.123.2
107.1
533.236.369.7
639.2
DCAFS- Development- MVAC response- Sub-total DCAFS
200.040.0
240.0
1,000.0200.0
1,200.0+15%
150.0
150.0
1,150.0200.01,350
NGOs 44.5 222.5 +25% 55.6 278.1CGIARs 4.2 21.0 +25% 5.25 26.2
Other domestic and foreign sources a/ 150.0 150.0Subtotal public and NSAs 399.8 1,998.9 467.9 2,443.5Private Sector co-financing b/ 441.0 441.0Total 399.8 2439.9 +23% 467.9 2,884.2NAIP budget 3,219.0 3,219.0
Funding gap 779.1 (24%)
334.4(10.3%)
NAIP BL for food aid 343.0 343
Funding gap without food aid c/ 626.1(19.4%)
191.4(5.9%)
a/ Existing funds in agric. Sector that are not aligned to NAIP plus additional funds mobilised
b/ New Alliance, NAIP co-financing
c/ Net of NAIP budget for food aid and DCAFS funding for emergency/disaster response
73
National Agricultural Investment Plan
4.4 Funding Mechanisms187. The NAIP build on the funding mechanisms used under the ASWAp and continue the
progression from scattered projects towards program support and pooled funding. In line with the Paris Declaration and the Malawi Development Cooperation Strategy, donors have agreed to align their support with national strategies, increase the use of country systems, make funding more predictable, and reduce transaction costs by harmonizing procedures and streamlining delivery. According to the Development Cooperation Strategy, the order of preference is general budget support, sectoral budget support, pooled/basket funds and lastly project modalities. However, GoM recognises that some DPs are unable to employ the pooled approach due to their own policies and guidelines regarding traceability of funds and results. Currently a large number of DP projects use project modality with varying degrees of alignment and use of country systems. Hence, whilst GoM preferences are clear, progress towards greater alignment and use of national systems will be gradual, depending on NAIP implementation performance and improvement of public financial management systems.
188. In line with the above, the NAIP will be financed through a menu of funding modalities, whereby a progression towards pooled funding mechanisms, increased use of country systems and stronger alignment with the NAIP programmatic structure, implementation mechanisms and results framework is envisaged. The main DP funding modalities are depicted in Box 3.
Box 3: DP Funding Modalities under the NAIP
Sectoral budget support is a form of general budget support earmarked for the agricultural sector. This modality is fully on-budget and could be used by GoM for any NAIP related activity.
Pooled Program Funding allows DPs to jointly fund parts of the NAIP. Within the pooled funding arrangements, DP may earmark their funding to certain Programs or IAs or to specific activities and outputs therein. Implementation would be through government institutions and systems. The pooled funding commitment would be governed by a joint financing agreement signed by multiple DPs.
Co-Funding involves the commitment of multiple DPs to a single, common work plan and budget. This arrangement applied under the ASWAp through the ASWAp Support Program (ASWAp-SP) funded by the World Bank, GEF and Norway (implemented through the Multi-Donor Trust Fund, MDTF). Co-funded work plans will be identifiable within the overall NAIP investment plan, and that they will be on-budget and make full use of government systems.
Parallel Funding is another intermediate step from discrete projects towards programmatic support, whereby two or more DPs align their funding to closely linked work plans. These work plans and related funding will be closely related to specific NAIP Programs and IAs and activities therein. Joint project preparation, implementation support and supervision, and the use of common indicators reduce transaction costs and strengthen DP harmonization and alignment with the NAIP.
Discrete Projects are still the main funding and implementation modality in agriculture. Still, projects vary in their degree of alignment and use of country systems. Projects of International Financing Institutions are funded through the national budget but implemented through PIUs hosted in line ministries. Bi-lateral projects tend to be off budget and make limited use of government systems for implementation. During the ASWAp efforts were made to reduce the number of PIUs and mainstream project activities within g structures. This process is expected to continue under the NAIP leading to a reduction of stand-alone projects and their close alignment with the NAIP (view chapter 7.1).

74
National Agricultural Investment Plan
189. The proposed NAIP funding structures shown in Figure 4.1. Funding will come from domestic and foreign sources. Domestic resources will be channelled through the national budget to MoAIWD and other implementing agencies. Some donor funding will also be channelled through the national budget, whereas another part will remain off-budget. On budget support includes sector budget support and pooled funding mechanisms such as the MDTF, but can also be implemented through various project modalities (PM) including discrete projects, co-funding and parallel funding.
Figure 4.1: NAIP Funding Modalities
On-budget funding Off-budget funding
National Agricultural Policy
PM = Project Modality AP = Aligned Project NP = Non-Aligned Project
MGDSII/IIIDevelopment Assistance Strategy/Paris/CAADP/Malabo etc.
Malawi NAIP
PMNAIP Programmes and IAs AP AP NP NP
DomesticResources
DPA
DP A/B
PM
Development Partners (DCAFS)
National Budget (Part 1 Domestic /Part 2 DPs)
MDTF DPC
DPD Other DPs
190. The Government will continue to invite development partners to pool funding in the MDTF established under the ASWAp. Some DPs funding is expected to support implementation of NAIP activities through a project modality where money goes through the budget but is implemented through PMUs (DP A). In some cases, DPs may co-finance such projects (DP A/B). There are also DPs who do not finance NAIP components through the national budget, but whose activities are aligned with the NAIP and can, therefore, be called aligned projects (AP) as long as their activities, outcomes and outputs are closely linked to NAIP Programs and IAs (view chapter 7.1). Non-aligned projects (NP) are those funded by non-DCAFS donors and have no formal linkages with the NAIP.
191. The envisaged transition process will entail: (i) an increasing share of funding through budget support and pooled funding mechanisms, with a growing number of DPs using this modality; (ii) an increasing number of DPs using the PM rather than AP mechanism; and (iii) a declining number of NPs and their alignment to the NAIP, at least as APs. A certain number of DP funded projects implemented by CSOs, NGOs, CGIAR centres, FOs and agribusiness will remain off-budget. These can be considered APs as long they contribute to the NAIP budget and results framework.

75
National Agricultural Investment Plan
Chapter 5: Governance, Implementation and Coordination
192. The NAIP is an investment plan for the agricultural sector. As such, a range of government ministries, departments and agencies, along with NSAs and the private sector will play a role in its implementation. This calls for clear demarcation of responsibilities among the actors, within a well-defined framework for governance, management and coordination. At national level, the Cabinet Committee on the Economy will provide political guidance and facilitate speedy clearance of policies and regulations while MoAIWD will provide leadership in the policy processes, planning, coordination and M&E. In addition a wide range of implementation partners will be responsible for financial, implementation and technical support at the relevant levels of the sector. The multiple levels at which these partners operate emphasizes the need for strong and well-defined coordination arrangements: within MoAIWD; between ministries and other government agencies; and between government and non-state actors. The following sections describe the proposed coordination mechanisms in greater detail: between actors, between sectors, within MoAIWD and at local assembly level.
5.1 Overall governance and Implementation Structure
193. An overview of the proposed management structure is given in Figure 6.1.Ultimate decision-making authority on all issues related to the NAIP will rest with the Principal Secretary (PS) of MoAIWD. The Executive Management Committee (EMC) is the main instrument for inter-ministerial coordination. Chaired by the PS of MoAIWD, the EMC is composed of the PSs of all ministries and agencies participating in NAIP implementation. The EMC will be the overall governing body for the NAIP and will act in the role of a Steering Committee at the level of GoM. It will provide strategic direction and inter-ministerial coordination, oversee implementation of key policy decisions, endorse annual work plans and budget allocations as well as monitor progress on NAIP implementation.
194. The Agricultural Sector Working Group (ASWG) provides a similar function for all stakeholders, including DPs, CSOs and private sector. The entire management structure of the NAIP shown in Figure 5.1 is expected to coordinate horizontally with other sectors through their respective ministries, agencies, NSAs and private businesses; as well as vertically with the various NAIP Programs and Intervention areas via their respective lead agencies. Intra-ministerial coordination will be led by the NAIP Coordination Troika, composed of DAPS, CAETS and CAS as detailed in Section 5.3.
195. The NAIP Secretariat will have dedicated full-time staff to oversee the implementation of NAIP on a day-to-day basis. The secretariat will be located within the DAPS but functionally report to TROIKA. The Secretariat shall concentrate full-time on NAIP management, coordination and be kept free from routine ministerial duties. .Its responsibilities will include: consolidating work plans, liaising with DPs, convening meetings of the ASWG and TWGs, ensuring timely reporting, monitoring progress against the NAIP performance indicators, coordinating the annual progress review, and preparing proposals for the EMC’s review and endorsement.

76
National Agricultural Investment Plan
Figure 5.1: Overview of NAIP Governance and Implementation Structure
DAPS = Director of Ag. Planning Services CAETS = Controller of Ag. Extension and Technical Services CAS = Controller of Ag. Services and Institutions ASWG = Agricultural Sector Working Group TWGs = Technical Working Groups LA=Lead Agencies
NAIP Coordination Troika
Lead Agencies for Each Intervention Area
Other Inter-sectoral MoAIWD Sectors coordination Intra-ministerial coordination
PS Agriculture
ASWG DAPS CAETS CAS
NAIP Secretariat
Basket Fund PIU
Other PIUs
Technical Departments, Agencies and parastatals
Implementation by ADDs , Districts and below
EMC
TWGs
Implementation of NAIP Programmes and Implementation Areas by various partner agencies and Stakeholders including other ministries, agencies, NSAs and private sector
LA LA LA LA LA LA LA LA LA LA LA LA LA LA LA
PS o ther sectors
Other stakeholders (NSAs, DPs,
private sector)
196. The action-radius of the NAIP Secretariat also goes beyond MoAIWD to involve other ministries, NSAs and the private sector, in order to oversee the full performance of the NAIP, not only the parts implemented by MoAIWD. The Secretariat will work pro-actively with ministerial and district staff as well as structures of the other participating ministries and organisations. This includes coordination platforms for DP support to other ministries’ projects related to the agriculture sector.. The NAIP Secretariat will report to Director of Planning; and technical matters are also reported to the ASWG. The ASWG will receive a technical report from the NAIP Secretariat prior to every ASWG meeting.

77
National Agricultural Investment Plan
197. For the envisaged continuation of the basket fund (Multi Donor Trust Fund), there will be a Program Implementation Unit (PIU) for the management of that support to be housed in the DAPS. As under the ASWAp, basket fund resources will be channelled not only through MoAIWD but also through other participating ministries and agencies. In view of the preferred funding modalities of many DPs, there will still be a number of other PIUs to manage donor-funded projects and donor support23. Consequently, the NAIP secretariat will also provide overall coordination for all projects aligned to the NAIP. For proper coordination and monitoring of project performance all PIUs within the Ministry of Agriculture, Irrigation and Water Development will be housed in the DAPS and efforts will be made to reduce their number by using programme approach. Even though the management functions performed by these PIUs will continue to be kept separate from the NAIP Secretariat, housing them under one roof with the NAIP Secretariat will make coordination and reporting easier. As M&E of NAIP rests in the DAPS, the NAIP Secretariat will provide additional staff to assist DAPS in its sector-wide monitoring function to inform the EMC, ASWG and JSRs.
5.2 Key Actors’ Roles and ResponsibilitiesNational Government Agencies198. Table 5.1 displays the main actors involved in the implementation of each of the 16 IAs. Each
IA will have a Lead Agency (LA) responsible for overall management of the respective activities, coordination of implementing partners and monitoring progress to the ASWG as described below. Normally, the LA will be the Ministry or institution with the main mandate for the activities under the respective IA.
199. In cases where mandates overlap or activities fall under different Ministries, arrangements will have to be worked out on how responsibilities could best be split to ensure coherent implementation and reporting. Depending on specificity of each IA, possibilities include: (i) dividing the LA function between two ministries with clear demarcation on roles and responsibilities (e.g. IA 6); (ii) one Ministry taking the coordination and monitoring function for the entire IA and the other ministry for the activities and outputs under its mandate (e.g. IAs 2 and 15); (iii) the LA function could be shared on a rotational basis; or (iv) be delegated to a third party, including a parastatal or NSA.
200. In addition to its overall lead in managing the implementation of the NAIP, MoAIWD, participates in the implementation of all 16 IAs and assumes the LA function in at least seven: IA 1, 3, 8, 9, 10, 12 and 13. In case of four IAs, MoAIWD would co-lead, as an important part of the activities also fall under the mandates of MoITT (IA 2 and 14), MoHP (IA 4), and MoNREM (IA15). MoITT will have responsibilities under four of the IAs, but other Ministries or agencies have specialised responsibilities in only one or two IAs.
23 Especially when DPs use different modalities, e.g. basket/pool funds and project funding.

78
National Agricultural Investment Plan
Table 5.1: NAIP Intervention Areas by Main Implementer and Lead Agency
Intervention Areas Main implementers Lead AgencyIA1: Implementation, Coordination and M&E
Line Ministries, Local Assemblies, Parastatals, NSAs, A&R* PS**
MoAIWD, Local Assemblies
IA2: Farmer-Based Organisations MoITT, MoAIWD, Local Assembly, NSAs, Private Sector MoITT or MoAIWD (tbd)IA3: Public Agricultural Services Delivery MoAIWD, MoLGRD, A&R, Local Assembly MoAIWD
IA4: Diverse, Nutritious Food Available and Consumed
MoHP, MoAIWD, MoGCDSW, MNSSP NGO/CSO, A&R, Local Assembly
MoHP& MoAIWD
IA5: Food Safety and Quality Standards
MoITT (MBS, MITC), MoAIWD, MoHP, A&R, /CGIAR, RTCDT, NGO/CSOs
MoITT
IA6: Empowerment and Tenure Security
MoLHUD, MoGCDSW, MoAIWD, Local Assembly NGO/CSOs, A&R
MoLHUD & MoGSWCD
IA7: Disaster Risk Reduction Systems MoNREM, DODMA, MoAIWD (NFRA ADMARC), MoLGRD, Prívate Sector, NGO/CSOs, A&R
MoNREM, NFRA
IA8: Pest and Disease Management MoAIWD, ARET, NGOs/CSOs, A&R, Private Sector MoAIWDIA9: Agricultural Innovation Systems MoAIWD, A&R, NGOs/CSOs,Prívate Sector MoAIWDIA10: Access to Inputs MoAIWD, MoNREM, Private Sector, A&R, NGOs/CSOs MoAIWDIA11: Natural Resource Management MoNREM, MoAIWD, MoTPW, A&R, NGOs/CSOs MoNREM & MoAIWDIA12: Sustainable Irrigation Development
MoAIWD, GBA, MoITT, MoLHUD, NGOs/CSOs, Private Sector
MoAIWD
IA13: Mechanisation MoAIWD, Private Sector, NGOs/CSOs, A&R MoAIWD
IA14: Market Systems and Access to Markets
MoITT (MITC, CFTC), MoAIWD (ADMARC), MoLGRD, Private Sector, NGOs/CSOs
MoITT
IA15: Agri-Business MoAIWD, MoITT, MoFEP&D, Private Sector MoAIWD
IA16: Access to Finance MoAIWD, MoITT, MoFEP&D, RBM MoAIWD/MoFEP&D
*Academia and Research**Private sector
201. Table 5.2 shows the roles and responsibilities of each line ministry and their affiliated agencies and parastatals in the implementation of each IA. In many cases, MoAIWD (and other Ministries) will be both a coordinator and a service provider, sometimes engaging NSAs in service delivery (e.g. extension, training of FOs). In other cases, MoAIWD will only have a minor role in implementation and its main function will be to coordinate different state and non-state actors, provide overall strategic guidance, ensure quality and coherence in approaches, methodologies and services, and monitor progress. The budget file contains a detailed account of which actor is expected to participate in implementation of each budget line. In general, MoAIWD’s role in the implementation of the NAIP will be in line with the recommendations of the CFA.
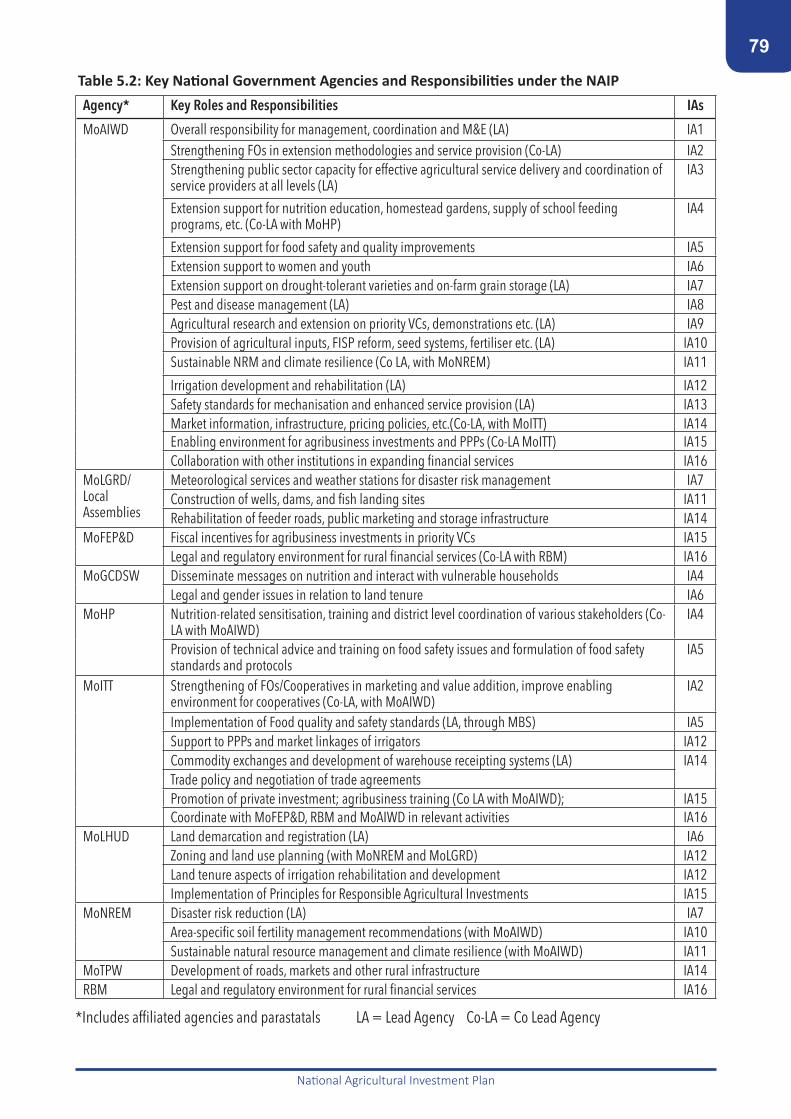
79
National Agricultural Investment Plan
Table 5.2: Key National Government Agencies and Responsibilities under the NAIPAgency* Key Roles and Responsibilities IAs
MoAIWD Overall responsibility for management, coordination and M&E (LA) IA1Strengthening FOs in extension methodologies and service provision (Co-LA) IA2Strengthening public sector capacity for effective agricultural service delivery and coordination of service providers at all levels (LA)
IA3
Extension support for nutrition education, homestead gardens, supply of school feeding programs, etc. (Co-LA with MoHP)
IA4
Extension support for food safety and quality improvements IA5Extension support to women and youth IA6Extension support on drought-tolerant varieties and on-farm grain storage (LA) IA7Pest and disease management (LA) IA8Agricultural research and extension on priority VCs, demonstrations etc. (LA) IA9Provision of agricultural inputs, FISP reform, seed systems, fertiliser etc. (LA) IA10Sustainable NRM and climate resilience (Co LA, with MoNREM) IA11
Irrigation development and rehabilitation (LA) IA12Safety standards for mechanisation and enhanced service provision (LA) IA13Market information, infrastructure, pricing policies, etc.(Co-LA, with MoITT) IA14Enabling environment for agribusiness investments and PPPs (Co-LA MoITT) IA15Collaboration with other institutions in expanding financial services IA16
MoLGRD/ Local Assemblies
Meteorological services and weather stations for disaster risk management IA7Construction of wells, dams, and fish landing sites IA11Rehabilitation of feeder roads, public marketing and storage infrastructure IA14
MoFEP&D Fiscal incentives for agribusiness investments in priority VCs IA15Legal and regulatory environment for rural financial services (Co-LA with RBM) IA16
MoGCDSW Disseminate messages on nutrition and interact with vulnerable households IA4Legal and gender issues in relation to land tenure IA6
MoHP Nutrition-related sensitisation, training and district level coordination of various stakeholders (Co-LA with MoAIWD)
IA4
Provision of technical advice and training on food safety issues and formulation of food safety standards and protocols
IA5
MoITT Strengthening of FOs/Cooperatives in marketing and value addition, improve enabling environment for cooperatives (Co-LA, with MoAIWD)
IA2
Implementation of Food quality and safety standards (LA, through MBS) IA5Support to PPPs and market linkages of irrigators IA12Commodity exchanges and development of warehouse receipting systems (LA) IA14Trade policy and negotiation of trade agreementsPromotion of private investment; agribusiness training (Co LA with MoAIWD); IA15Coordinate with MoFEP&D, RBM and MoAIWD in relevant activities IA16
MoLHUD Land demarcation and registration (LA) IA6Zoning and land use planning (with MoNREM and MoLGRD) IA12Land tenure aspects of irrigation rehabilitation and development IA12Implementation of Principles for Responsible Agricultural Investments IA15
MoNREM Disaster risk reduction (LA) IA7Area-specific soil fertility management recommendations (with MoAIWD) IA10Sustainable natural resource management and climate resilience (with MoAIWD) IA11
MoTPW Development of roads, markets and other rural infrastructure IA14RBM Legal and regulatory environment for rural financial services IA16
*Includes affiliated agencies and parastatals LA = Lead Agency Co-LA = Co Lead Agency

80
National Agricultural Investment Plan
NSAs and the Private Sector202. NSAs, academia and research, and the private sector play important complementary roles
in the implementation of almost all IAs. NSAs include a wide range of international, national and local NGOs and CSOs with networks and capacities in rural areas. Their main roles relate to service provision and capacity development at local and higher levels but also participation in policy processes and coordination fora at all levels. Despite their limited own resources (see chapter 5), they play important roles in implementing projects funded by DPs and could also be contracted by GoM as service providers. Academic and Research organisations (including CGIAR centres) play key roles in development, testing and adaptation of agricultural technologies, but also in monitoring, evaluation and knowledge management at the Program level.
203. The private sector comprising farmers, cooperatives, agribusiness, financial and non-financial service providers, and related associations and apexes. It has a dual function as service provider and co-financier. Many service functions can be outsourced to competent private service providers (including farmer and industry organisations), either on a fully commercial or cost-sharing basis. In case of PPP arrangements, investments will be implemented by the private sector with public sector sharing the costs and risks and overseeing implementation. Such arrangements will be used in agribusiness and value chain development, agricultural finance, irrigation development and mechanisation. Overall, the private sector will play important roles in some or all of the following activities.
• Investment in developing supply, storage and distribution channels for agricultural inputs (e.g. Seeds, fertilisers and agro-chemicals) including under the FISP voucher system;
• Investment in and management of facilities for national or international trade in agricultural commodities (e.g., commodity exchanges and warehouse receipt systems);
• Importation or production of mechanised farming equipment (e.g. tractors, conservation agriculture equipment, sprayers and harvesters);
• Storage facilities for grain and perishable commodities (e.g. fruit, vegetables and fish,);
• Investment in the rehabilitation and/or development of new irrigation systems;
• Farm mechanisation services (e.g. cultivation, planting, spraying and harvesting.);
• Investment in financial institutions to increase outreach to farmers and rural entrepreneurs;
• Investment in livestock and fisheries development; and
• PPPs in agriculture enterprises.

81
National Agricultural Investment Plan
5.3 Coordination Arrangements General204. This section describes the existing coordination mechanisms and their proposed enhancements
in more detail. A distinction is made between coordination mechanisms within the government (intra- and inter-ministerial), between GoM and other stakeholders, and between the public and the private sector.
205. To overcome the coordination challenges experienced under ASWAp, the following principles will guide coordination under the NAIP:• Coordination for results: Coordination as an end in itself must be avoided; rather, it must be
seen as a means to an end, with successful implementation and results being the ultimate aim of all coordination efforts. In this respect, NAIP calls for professional coordination that should be matched with adequate funding with clear allocation of human and financial resources to the various coordination tasks. Full-time coordinators can be justified with respect to critical NAIP platforms (such as the NAIP Secretariat and key Working Groups); and,
• Existing coordination platforms: Should be used and srengthened before establishment of new ones is considered. Coordination, implementation and reporting responsibilities must be clearly allocated and defined with the most suitable actors/platforms strengthened in accordance with their mandates.
206. Coordination arrangements are considered in four ways: (i) inter-sectoral coordination (between stakeholders in agriculture and adjacent sectors); (ii) intra-sectoral coordination, between departments and institutions within MoAIWD; between MoAIWD and other key institutions and stakeholders in the sector (iii) vertical coordination within GoM, especially between head office and decentralised implementation structures at district levels and below; (iv) coordination between public and private/non-state actors.
207. Inter-ministerial coordination must take place at the sector level (between the ministries and agencies listed in Table 5.2) and at multi-sector level under the MGDS III (between policy frameworks such as the NAP, and the other relevant plans, strategies, policies detailed in Chapter 2 and Annex 6). In view of the broader scope of the NAIP, effective inter-ministerial and inter-sectoral coordination is very important, both at the level of the NAIP, as well as under MGDS III, to ensure that the broader targets of the Malabo Declaration are met.
208. The leadership role and multiple responsibilities of MoAIWD (see Table 5.1) and the experiences under the ASWAp both indicate that effective intra-ministerial coordination within MoAIWD is equally critical for successful NAIP implementation. This includes the full alignment of the Ministry’s Annual Work Plan and Budget to the NAIP, coordination in planning and implementation between departments at national level; and between headquarters and the field levels where most activities will be implemented. The latter will become even more important with full implementation of the Decentralisation reforms, where implementing staff have shifted to the Local Assemblies. Improved two-way communication, a clearer demarcation of roles, and a sustained flow of resources to the districts will be required. The important roles of other ministries, parastatals and NSAs in managing and implementing most IAs calls for effective coordination within and across sectors.
209. Improving dialogue and coordination with the private sector has emerged as an important issue at national and continental level, as reflected in the Malabo Declaration and the recent AU Initiative to establish CAP-Fs to complement the second-generation NAIPs. This has recognised the importance of the private sector as investor and service provider and the need for more effective and inclusive public-private coordination, including through PPPs. In Malawi, such dialogue has already been established with the New Alliance framework, and others. This dialogue and coordination will be strengthened under NAIP.

82
National Agricultural Investment Plan
Existing Coordination Structures210. Existing structures can be divided into Government and multi-stakeholder platforms, as in the
Table5.3 below. Most of these structures serve inter-ministerial coordination, as representation is across government (OPC, EMC, HLF even DCG). Also the SWG and TWGs include representation by other ministries and NSAs. Only the Senior Management Team and departmental meetings are specifically for intra-ministerial (MoAIWD) coordination.
Table 5.3: Existing Coordination Structures
GoM Platforms Multi-Stakeholder Platforms
Multi-Sector
Office of the President and Cabinet (OPC) High Level Forum (HLF)Public-Private Dialogue Forum (PPDF)
Executive Management Committee (EMC) Development Cooperation Group (DCG)
Sector Senior Management Team (SMT) Agricultural Sector Working Group (ASWG)
Sub-SectorDepartmental Meetings Technical Working Groups (TWGs)
Commodity Platforms
Inter-Sectoral and Inter-Ministerial CoordinationExisting Structures
211. Inter-Sectoral Coordination Platforms: The OPC, the HLF and the DCG all have both inter-ministerial and inter-sectoral coordination mandates. These platforms guide implementation under a range of policies, Programs and plans that include the overarching MGDS (under leadership of the MoFEP&D), the National Resilience Plan (coordinated by the OPC), the National Export Strategy (under MoITT), the National Climate Change Investment Plan (coordinated by the OPC and MoNREM).
212. The HLF and the DCG include membership by non-state actors. The HLF is the highest dialogue platform between government and stakeholders such as DPs, private sector, NGOs, civil society and academia. It is co-chaired by the MoFEP&D and a DP representative. The HLF meets once a year to discuss progress under the Development Cooperation Strategy and towards MGDS targets. The DCG meets twice a year to prepare the work of the HLF. It provides inputs to the HLF and follows up on action points emerging from the HLF. Sector Working Groups forward issues to the DCG.
213. Inter-Ministerial Coordination: The main platform is the EMC which was established during the ASWAp to provide strategic direction for inter-ministerial coordination, oversee implementation, endorse work plans and monitor progress. Inter-ministerial coordination is especially important for cross-sectoral issues such as creating an enabling business environment, managing climate change, food and nutrition security and creating opportunities for women and youth.
214. Non-State Actors: Important platforms for NSAs are the ASWG and its subsidiary TWGs. The ASWG is one of a range of such groups established by OPC in 2008 to coordinate action under the MGDS. The ASWG was intended as a public-private dialogue platform as well as one for inter-ministerial coordination. TWGs are an extension of SWGs tasked to guide and inform technical implementation. The TWGs include non-state actors and also have inter-ministerial representation.

83
National Agricultural Investment Plan
Figure 5.2: Existing Coordination Structures
Proposed Arrangements
215. TTo ensure that inter-sectoral coordination improves and that the NAIP undertakings are properly guided and that policies and regulations receive due attention to speed up reforms in the sector, the following institutional arrangements are proposed:• Cabinet Committee: For proper political guidance and speedy reform facilitation the Cabinet
Committee on the Economy shall guide the NAIP implementation. The Committee shall meet biannually to review progress on policy reforms and other related instruments in the sector.
• The EMC: The current EMC structure under the ASWAp will be maintained as perstakeholders desire though it was not effective during ASWAp implementation. Under NAIP, the EMC will meet twice a year and be attended by the Principal Secretaries and NAIP Coordinators of all participating ministries (generally the head of planning). Participation at the highest level is critical to ensure follow-up on action points and report on progress. In case of consecutive non-attendance or lack of engagement, the PS of MoAIWD should table the matter to Cabinet and to the ASWG for redress.
• The ASWG: The Agriculture Sector Working Group arrangement will be strengthened with the Agriculture PS as a chair. The ASWG will have representation from the LA ministries at the highest level preferably at the Director or PS levels. Alternatively, the NAIP Coordinators should represent the participating ministries. The ASWG should meet at least twice a year and communicate NAIP progress and obstacles to the DCG prior to their bi-annual meetings.
• TWGs: A clear demarcation will be drawn between the ASWG roles and that of the TWGs. The TWGs will focus on technical issues and practical implementation while the ASWG will focus on the (horizontal) NAIP IAs and policies. The ASWG will coordinates implementation according to the four (vertical) NAIP Programs, as shown in Table 5.4 below:

84
National Agricultural Investment Plan
Table 5.4: Demarcation of Roles between ASWG and TWGs
ASWG TWGs
Purpose Policy dialogue and coordination Technical dialogue and coordinationFocus Policies, plans and budgets Technical implementationComposition Broad-based and inclusive
Policy and decision makers from Government (inter-ministerial), private sector, NGOs, civil society, academia and DPs
Lean and action-orientedTechnical staff from Government (inter-ministerial where necessary), strong private sector representation, NGOs, civil society, academia and DPs
Functions • Report and review NAIP implementation progress across ministries and departments
• Report and review the role of NSAs including barriers to optimum use of NSA potential
• Review and discuss AWPBs and advise on improved alignment to the NAIP
• Assess TWGs request for support• Based on TWG advice, carry out vetting of
(DP/NGO supported) projects to assure NAIP compliance
• Monitor adherence to Codes of Conduct MoUs in the agriculture sector
• Encourage and coordinate joint government-DP M&E missions
• Support LAs in coordination and monitoring implementation under the IAs concerned
• Analyse implementation bottlenecks and identify solutions
• Identify potential areas for public-private cooperation
• Report to the ASWG on progress and challenges to implementation
• Advise the ASWG on AWPBs• Set-up Task Forces to address priority issues
and apply for support when necessary• Streamline and harmonise implementation
approaches• Maintain an overview of relevant DP/NGO
projects and ensure that these contribute to NAIP targets
• Coordinate geographic implementation; avoid project overlaps, aim to fill gaps
• Advise ASWG on vetting of projects
Chair Permanent Secretary Agriculture Department Director / Co-chair: NSAMeeting Two – four times per year As needed, but no less than 4x/year, prior to the
ASWG meetings
• The TWGs The number of TWGs will be limited and focused on technical areas where coordination between different actors is critical. Therefore, not all areas need to be covered by TWGs, since essential coordination of reporting functions will be carried out by the LAs. The number and thematic coverage of TWGs can also be modified during implementation, based on performance and changing needs. On this basis, the following TWGs are initially :
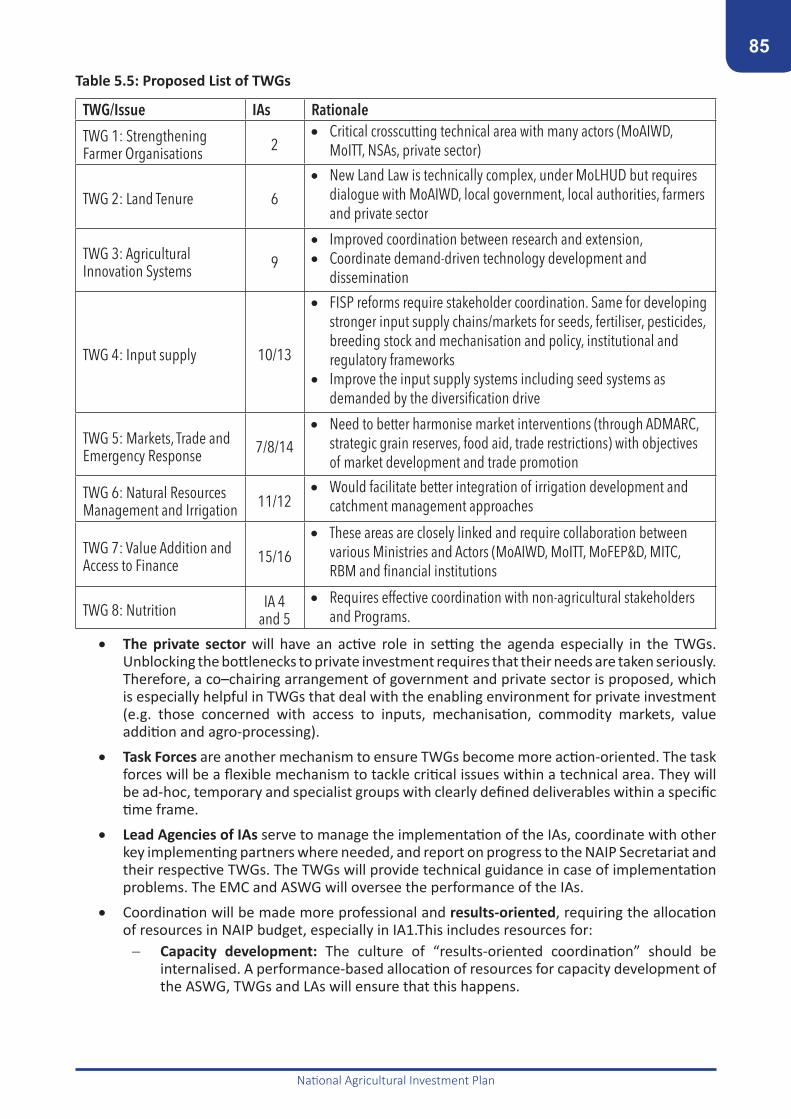
85
National Agricultural Investment Plan
Table 5.5: Proposed List of TWGs
TWG/Issue IAs Rationale
TWG 1: Strengthening Farmer Organisations 2
• Critical crosscutting technical area with many actors (MoAIWD, MoITT, NSAs, private sector)
TWG 2: Land Tenure 6• New Land Law is technically complex, under MoLHUD but requires
dialogue with MoAIWD, local government, local authorities, farmers and private sector
TWG 3: Agricultural Innovation Systems 9
• Improved coordination between research and extension, • Coordinate demand-driven technology development and
dissemination
TWG 4: Input supply 10/13
• FISP reforms require stakeholder coordination. Same for developing stronger input supply chains/markets for seeds, fertiliser, pesticides, breeding stock and mechanisation and policy, institutional and regulatory frameworks
• Improve the input supply systems including seed systems as demanded by the diversification drive
TWG 5: Markets, Trade and Emergency Response 7/8/14
• Need to better harmonise market interventions (through ADMARC, strategic grain reserves, food aid, trade restrictions) with objectives of market development and trade promotion
TWG 6: Natural Resources Management and Irrigation 11/12
• Would facilitate better integration of irrigation development and catchment management approaches
TWG 7: Value Addition and Access to Finance 15/16
• These areas are closely linked and require collaboration between various Ministries and Actors (MoAIWD, MoITT, MoFEP&D, MITC, RBM and financial institutions
TWG 8: Nutrition IA 4 and 5
• Requires effective coordination with non-agricultural stakeholders and Programs.
• The private sector will have an active role in setting the agenda especially in the TWGs. Unblocking the bottlenecks to private investment requires that their needs are taken seriously. Therefore, a co–chairing arrangement of government and private sector is proposed, which is especially helpful in TWGs that deal with the enabling environment for private investment (e.g. those concerned with access to inputs, mechanisation, commodity markets, value addition and agro-processing).
• Task Forces are another mechanism to ensure TWGs become more action-oriented. The task forces will be a flexible mechanism to tackle critical issues within a technical area. They will be ad-hoc, temporary and specialist groups with clearly defined deliverables within a specific time frame.
• Lead Agencies of IAs serve to manage the implementation of the IAs, coordinate with other key implementing partners where needed, and report on progress to the NAIP Secretariat and their respective TWGs. The TWGs will provide technical guidance in case of implementation problems. The EMC and ASWG will oversee the performance of the IAs.
• Coordination will be made more professional and results-oriented, requiring the allocation of resources in NAIP budget, especially in IA1.This includes resources for:− Capacity development: The culture of “results-oriented coordination” should be
internalised. A performance-based allocation of resources for capacity development of the ASWG, TWGs and LAs will ensure that this happens.

86
National Agricultural Investment Plan
− Strengthening of district and grassroots structures: NAIP resources will be allocated to implementation levels at the district level and below such as the District Agriculture Development Office, the District Agriculture Extension Coordinating Committee, the District Stakeholder Panel, Area Stakeholder Panel and the Village Agriculture Committee. This includes resources for TA to clearly define the role of these various structures, in particular that of the District Agriculture Committee (see section on Coordination for Implementation).
− Recruitment of coordination professionals: Effective coordination needs people dedicated to the task. The NAIP budget includes resources for staff such as the CAETS and CAS, the NAIP Secretariat, and for TA to support TWGs.
− Operational costs of coordination: Budget allocations are included for the operational costs of coordination structures such the Coordination Troika, the NAIP Secretariat, the ASWG and TWGs. There is also a budget allocation for meetings by various coordinating bodies from the EMC at the top, to the Village Agriculture Committees at the bottom.
− Follow-up on action-points: The ASWG and its TWGs will be responsible for follow-up on action points from their meetings. Under ASWAp, the commitment of the private sector dwindled as recommendations were often not actioned and representation by ministries other than MoAIWD was not sustained. Under the NAIP, ASWG and TWGs will receive budget resources to follow up on agreed action points24. TWGs will be able to access these resources through submitting proposals for their use. This should motivate TWGs to become solution-oriented drivers of change.
216. While initially all above-mentioned implementation and coordination mechanisms will be funded under the NAIP, subsequent funding will be performance-based. The performance will be assessed periodically by TWG members (in case of LAs and professional facilitators/TA) and as part of the JSR for all platforms and mechanisms.
Intra-Ministerial Coordination ArrangementsExisting Structures
217. Intra-ministerial coordination takes place at national level for planning, budgeting, monitoring and reporting. Within MoAIWD the Director of Agricultural Planning Services has the mandate for intra-ministerial coordination, including the coordination of investments. Other positions with important coordination roles include: (i) the CAETS who is responsible for coordinating the technical departments; and (ii) the Controller of Agricultural Services and Institutions (CAS) supervising trusts and parastatals. The CAETS and CAS are placed below the PS and above the Departments, in a position of oversight. As support officers to the PS, the CAETS and the CAS are in the direct decision-making line.
Proposed Arrangements
218. Based on these structures, planning and management of the NAIP will work as follows: • A NAIP Coordination Troika comprising the DAPS, CAETS, CAS will be formed in the MoAIWD
with DAPS as the chair. The NAIP Troika will ensure that NAIP implementation is the central purpose of MoAIWD departments and institutions, and that a Program-based budget will anchor and guide coordination efforts. The CAETS and the CAS will be responsible for aligning their departments and institutions with the NAIP. DAPS will additionally be responsible for alignment and harmonisation across partners and projects.
• The Senior Management Team will be brought under the CAETS and its function of intra-ministerial decision-making will be revived and strengthened. The SMT already exists as a
24This may include resolving challenges (e.g. in sanitary and phyto-sanitary regulation); providing evidence for decision-making (e.g. studies and analyses) or the strengthening of capacities (e.g. through exchange visits, TA support).

87
National Agricultural Investment Plan
platform for intra-ministerial coordination consisting of Department Directors and Program Managers and coordinated by CAETS.
• All technical departments and institutions under MoAIWD as well as Local Assembly will integrate the NAIP as their core business. Making NAIP implementation the core business throughout MoAIWD also includes the measures shown below and in Table 5.4:− Work Plans and Budgets will be based on the NAIP and will classify each activity by IA,
outcome and target. − Directors of Departments will be designated NAIP Coordinators and may appoint
Coordination Officers for specific coordination and monitoring tasks. Departmental Meetings will be held regularly and structured around the discussion of progress towards NAIP outcomes and outputs. Any challenges towards NAIP progress will be reported to the Troika.
− Program Managers will be NAIP Coordinators at Agriculture Development Division (ADD) level responsible for (1) coordination of integrated supportive supervision and mentorship in districts within their respective ADDs; (2) facilitating capacity building initiatives at district level in the areas of planning, resource mobilisation, monitoring, and evaluation and reporting; and (3) facilitating ADD level NAIP reviews and preparation of ADD reports.
− The head of Agriculture at the Local Assembly will become NAIP Coordinator at district level. They will report directly to the District Commissioners and various coordination platforms at district level to ensure coordination with other sectors (e.g. health, environment). These are to report directly to the ADDs, who consolidate, and submit to the NAIP Secretariat.
Table 5.6: Intra-Ministerial Coordination Roles
Actor/Office Coordination Position Function and TasksDAPS Hosts the NAIP Secretariat
and chairs the NAIP Coordination Troika
• Coordination of MoAIWD investments and alignment of activities to the NAIP
• Responsible for NAIP implementation and M&E
CAETS Member of the NAIP Coordination Troika
• Engaging with Directors of the technical Departments to implement the NAIP
CAS Member of the NAIP Coordination Troika
• Engage institutions under the MoAIWD to implement the NAIP
Directors of Departments
NAIP Coordinators at Departmental level
• Ensure that the NAIP is the core business in their Departments• Direct implementation, working closely with Planning Officers
in the Departments• Coordinate across departments in MoAIWD through SMT of
the MoAIWD• Report to PS and the SMT on NAIP implementation
Program Managers (PMs)
ADD-level NAIP Coordination Officers
• Coordinate NAIP implementation at ADD level• Liaise with national-level HQs • Support NAIP implementation for each of the technical
departments represented in the eight ADDsDADOs District-level NAIP
Coordination Officers• Coordinate NAIP implementation at district level• Liaise through ADDs with national-level HQs • Liaise with the District Commissioner• Liaise with District Directors of Planning to ensure
coordination with other relevant sectors
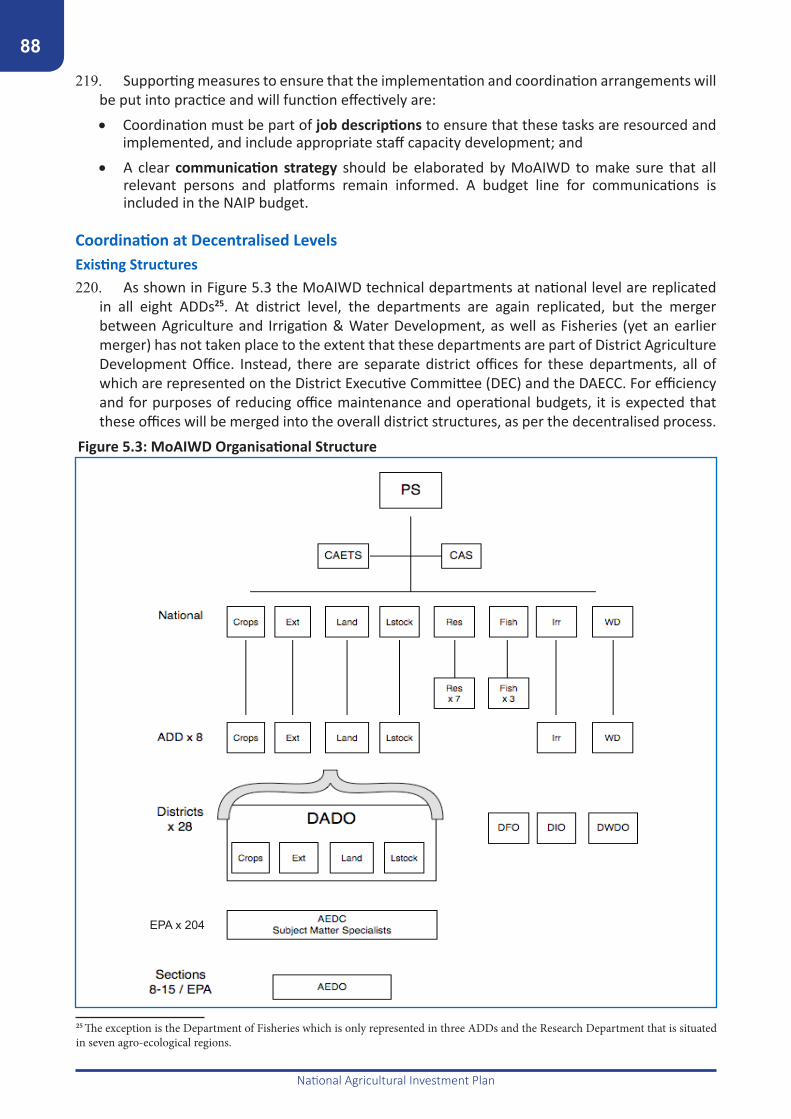
88
National Agricultural Investment Plan
219. Supporting measures to ensure that the implementation and coordination arrangements will be put into practice and will function effectively are: • Coordination must be part of job descriptions to ensure that these tasks are resourced and
implemented, and include appropriate staff capacity development; and• A clear communication strategy should be elaborated by MoAIWD to make sure that all
relevant persons and platforms remain informed. A budget line for communications is included in the NAIP budget.
Coordination at Decentralised LevelsExisting Structures220. As shown in Figure 5.3 the MoAIWD technical departments at national level are replicated
in all eight ADDs25. At district level, the departments are again replicated, but the merger between Agriculture and Irrigation & Water Development, as well as Fisheries (yet an earlier merger) has not taken place to the extent that these departments are part of District Agriculture Development Office. Instead, there are separate district offices for these departments, all of which are represented on the District Executive Committee (DEC) and the DAECC. For efficiency and for purposes of reducing office maintenance and operational budgets, it is expected that these offices will be merged into the overall district structures, as per the decentralised process.
Figure 5.3: MoAIWD Organisational Structure
25 The exception is the Department of Fisheries which is only represented in three ADDs and the Research Department that is situated in seven agro-ecological regions.
EPA x 204

89
National Agricultural Investment Plan
221. At the district level, national government structures interact with Local Government structures and structures that have NSA representation. In Figure 5.4, structures that discuss agriculture are highlighted in green. Structures are divided into those belonging to MoAIWD (left), those in which NSAs take part (centre) and those of Local Government (right).
222. The District Stakeholder Panel (DSP) has government staff (DADOs and other MoAIWD Officers) and representatives of the private sector, farmers, CSOs and NGOs. Similar structures at lower levels are the Area Stakeholder Panel (ASP) and the Village Agriculture Committee (VAC). At all these levels MoAIWD staff are represented, which represents an opportunity for upward information flow from beneficiaries of the NAIP. The upstream and downstream communication between the VAC, ASP and DSP need to be strengthened as part of NAIP implementation.
Figure 5.4: Linkages between implementation structures
223. Local Government structures have the District Council (DC) at the top. Below this is the multi-sectoral District Executive Committee (DEC) comprised of technical officers from government and NGOs. The DAECC is a sub-committee of the DEC of which the DADO and other MoAIWD officers are members. It is one of the more effective public-private structures at the district level. The District Agriculture Committee (DAC) consists of elected councillors, but seems to be one of the less effective agriculture platforms at the district level. It mirrors the national level Parliamentary Committee on Agriculture, but the links between this committee and the DAC need to be clarified.
Proposed Arrangements224. There is general agreement that the existing structures at the district level are too complex
with overlap in roles and functions. For example, the linkage and division of roles between the DSP and the DAECC is not clear: both have government–NSA participation, and both are public-private platforms. Under NAIP there is a need to come up with a leaner and simpler structure. It is imperative that the connection to the field via the sub-national structures is effective. This must become a working relationship, as the thrust of the NAIP must be at field and at farm level. How best to make use of the structures that are available, which ones to strengthen, which ones to merge, which to abandon, are issues that need to be addressed under Program. The following are proposals for analysis and action:

90
National Agricultural Investment Plan
• Decentralisation needs to be pro-actively supported by MoAIWD with care to retain sufficient connection to the DADOs to still make effective use of this layer in NAIP implementation;
• The DSP should be strengthened in its task of district-level coordination. It is proposed that the DADO serves as DSP Secretary, with an elected chairperson (possibly a NSA);
• The division of roles between the DAECC and the DSP needs clarification and the possibility of merging these structures should be assessed;
• Tasks of the DSP and/or DAECC, or indeed of a merger of the two, should include: tracking how various sectors are aligning the NAIP into their core business; developing work plans with a clear division of labour towards NAIP implementation at district level; and facilitating reviews and reports on NAIP implementation;
• The Area Stakeholder Panel (ASP) and Village Action Committees (VACs) will continue to be used at Traditional Authority and Village level. However, it is recommended that linkages between VAC, ASP and DSP be strengthened so that an upward and downward communication can take place;
• Strengths and weaknesses of the DAC should be assessed, as well as the possibility of strengthening its link to Parliamentary Committee on Agriculture (at national level). A decision should then be made to either strengthen or abandon the DAC;
• Efforts should be made to keep coordination of NAIP under one roof at district level and ADD should be strengthened in their coordination and monitoring functions, including harmonising and scrutinising annual work plans from the districts and ensuring their compliance with the NAIP;
• An assessment should be made on the need for (and the use of) Performance Contracts for ADD Program Managers and DADOs; and
• A working relationship should be established at district level between platforms in agriculture (e.g. DADO and DAECC) and those in other NAIP sectors such as the District Social Support Committee and Community Social Support Committee under the MNSSP.
Private Sector Coordination225. Improved coordination between public and private actors is key to a successful NAIP. The
Malabo Declaration invites countries to establish a CAP-F in order to: (i) achieve policy reforms through multi-stakeholder engagements and institutional support systems; and (ii) establish collaborations for improving the efficiency of priority value chains. The CAP-F should be aligned with the priority investments and value chains under the NAIP and serve as a dynamic registry for partnerships and private investments that support the NAIP. The CAP-F should identify policy initiatives to stimulate agribusiness investment through a multi-stakeholder (government/private sector) group to jointly identify key issues and monitor implementation.
226. In Malawi, the CAP-F would rest on two main building blocks: (i) the NA/GA framework; and (ii) value chain specific multi-stakeholder platforms. Malawi joined the NA in 2013 and the initial Country Corporation Agreement (CCA) included 35+ policy commitments and 27 Letters of Intent for investments by private companies. In April 2015, the CCA was revised and the number of policy commitments reduced to 15. Under the NAIP the CCA will be updated and upgraded in the form of a CAP-F, according to the CAP-F implementation guidelines26. This will require a review of the policy commitments, including their implementation status and relevance during the NAIP implementation period. A list of high-priority issues should be identified in close collaboration with the private sector in order not to dilute efforts. The process should be guided by an inclusive group composed of the original NA/GA companies but also new companies and representatives

91
National Agricultural Investment Plan
of SMEs and farmers. A high-level public private dialogue forum with broad participation from key ministries and private sector representatives should be created to address issues involving several ministries, and to monitor implementation. The forum should meet periodically (e.g., bi-annually) to review progress on policy reforms, investments commitments and PPPs, and discuss new issues as they arise. The forum could be established as a subsidiary of the Public Private Dialogue Forum (PPDF) under the High Level Forum under the auspices of the Malawi Confederation of Chambers of Commerce and Industry (MCCCI). It should be aligned with the NAIP governance structure.
Box 4: Elements of a CAP-FCoordination: this is fundamental to inclusive value chain development but is often under-resourced. Only when a single private sector actor dominates a value chain can they viably take on the burden of coordination. In most situations, the initiative and funding for coordination must come from a government or development partner, at least until the value chain matures to establish and self-fund its own mechanisms.Policy Change: The viability of each agribusiness partnership will be constrained by specific policy issues within each value chain. The success of a CAP-F depends on simultaneously getting government to commit to key policy reforms, alongside companies committing to investments. Investment Mobilisation: Whilst CAP-Fs are focused primarily on mobilising private sector investment, they also seek to mobilise or align catalytic investments from government, development partners and non-state actors. These two types of investment are described separately.Mutual Accountability: This is the process by which two or more parties hold one another accountable for the commitments they have voluntarily made to one another. It is a key principle for CAADP implementation, because agricultural transformation requires diverse cross-sector partners to act in concert.Source: CAP-F Implementation Guide
227. At the level of priority value chains, multi-stakeholder platforms and TWGs already exist in several of them including oilseeds, legumes, rice, dairy and roots and tubers. The platforms can facilitate collective action for developing priority value chains in close coordination with private actors. This could include the formulation of subsector or value chain strategies and the identification of investment priorities and opportunities for PPPs, along with specific policy issues and critical gaps in infrastructure, services and technologies. Attention should be paid to the participation of small, medium and large entrepreneurs and smallholder farmers. Under IA 15, value chain platforms will be enhanced through TA to support the implementation of agreed activities and report back to stakeholders.
26Grow Africa and CAADP (August 2017) Country Agribusiness Partnership Frameworks (CAP-F): An Implementation Guide for Governments and their Partners.

92
National Agricultural Investment Plan
5.4 Risks and Risk Mitigation228. The NAIP is subject to a number of generic risks that affect all development programs and
projects in Malawi. These include: (i) the willingness of the private sector to participate; (ii) limited capacity in Government institutions and human resources; (iii) the challenge of coordinating NAIP investments within and between institutions; (iv) ensuring that the primary target group (smallholders) participate fully and that women, youth and other disadvantaged groups are included; (v) managing environmental and climate risks; and (vi) coordinating multiple funding modalities.
229. These challenges need to be addressed in a situation where all stakeholders, particularly smallholder farmers, are routinely confronted by a number of risks which deliver setbacks in their efforts to achieve better livelihoods. These risks include extreme weather events, exacerbated by climate change; commodity price fluctuations; uncertain tenure of land and water resources; disability or illnesses; pest and disease outbreaks, uncertainties about the availability and price of farm inputs etc. The NAIP recognises the heavy dependence on rain-fed cropping, and the low ability of farming households to manage risks, and consequently the need to make significant investments in resilience.
230. All of the risks mentioned above are considered to be “background risks” that have to be confronted and managed with or without the NAIP. The NAIP includes many initiatives that are intended to mitigate these risks. Packages of GAPs are expected to improve the resilience of farming systems to climate variability and climate change. Investments in irrigation development are also a useful adaptation measure. Marketing and value addition will reduce exposure to commodity price fluctuations, land tenure security will be improved, and the capacity to manage pest and disease challenges will be enhanced. Through these and other measures the NAIP will bring about a progressive reduction in the risk exposure of Malawi’s farmers. In other words, the risks associated with implementing the NAIP are less than those of not implementing it. Without the NAIP Malawi’s farmers face an uncertain future with the real possibility that recent improvements will stall or even reverse under the influences of land degradation and climate change.
231. But there are also risks that the NAIP will fail to deliver according to expectations. These risks are recognised in the design of the NAIP which also includes measures to reduce their probability and impact. The initial step in designing the NAIP was a thorough assessment of the ASWAp experience to identify lessons learned. The proposed implementation and coordination arrangements were informed by the ASWAp experience. The consultative process by which the NAIP was prepared also has an important function of building awareness, ownership and commitment to the Plan.
232. Institutional capacity is a well-known risk for agricultural development initiatives in Malawi. The Plan recognises the critical role that institutions will play and incorporates institutional capacity building measures in each Program and IA. Successful implementation will also depend on the availability of competent management and technical personnel at central, ADD and district levels. This will require inclusion of decentralisation process and the recommendations of the CFA into the NAIP capacity building plan.
233. The decentralisation process accentuates the institutional capacity risks. Whilst decentralisation has been underway for a decade the first transfers of staff from central ministries to Districts took place in 2016. This poses a challenge to the agricultural sector in terms of direct influence over frontline staff, but is also an opportunity to ensure that planning is more responsive to local needs. However, it is yet to be finalised how administrative and fiscal decentralisation will happen and to what extent. MoLGRD will have an important role to play in this and improved coordination between it and MoAIWD is essential. The NAIP budget identifies activities at district level (including administration and staff costs), which may or may not be transferred to MoLGRD for decentralised administration during the course of the NAIP.

93
National Agricultural Investment Plan
234. Private sector participation is a key element of the NAIP. The ASWAp experience demonstrates that full participation of the private sector cannot be assumed. Consequently, the Programme will include specific measures to motivate investment by smallholder and commercial farmers by facilitating access to inputs, technologies, markets and financial services, and creating an enabling environment that is attractive to private investment in the sector. The private sector will be represented in the NAIP advisory and governance bodies such as the ASWG. Formulation of the CAP-F during the early stages of implementation provides a further opportunity to develop productive agribusiness partnerships.
235. Inclusive transformation is another significant challenge. Smallholders are the primary target group of the NAIP, although the role of commercial agriculture and agro-industries is also vital to a commercially viable sector. There is a risk that smallholders, particularly women, youth and disadvantaged groups, will fail to participate fully in the process. To minimise this risk, the NAIP includes interventions such as strengthening farmer organisations, and facilitating access to rural financial services that will enable small scale farmers to undertake profitable investments.
236. There is a risk of environmental degradation due to un-sustainable natural resource management practices. It is envisaged that the NAIP will stimulate increased agricultural activity employing the principles of sustainable agricultural intensification based on technologies which are both more productive and more resilient and sustainable. However, mitigation of possible adverse effects will also be considered where necessary. The NAIP will also implement training programs in climate-smart farming practices, including conservation agriculture, agro-forestry, IPM and sustainable natural resource management.
237. The existence of a financing gap and the need to mobilise funding from multiple (national and international) sources presents a significant challenge. Within MoAIWD, within Government generally and amongst stakeholders there is a continued struggle for resources which, at times, hampers the strategic decision-making and prioritisation processes. The availability of funding tends to influence priority-setting as much as (or more than) strategic considerations. At the same time Government priorities can shift, for example if the FISP reform agenda changes. Factors external to Malawi may also affect the sector, for example reduced funding or changing priorities of development partners.
238. Financing arrangements also present an element of risk. Whilst GoM has a preference for general and sectoral budget support and on-budget project finance, it is anticipated that a number of Development Partners will opt for other funding modalities, including discrete and earmarked project funding, bilateral arrangements etc. (see Figure 5.1 on funding modalities). The risk lies in weak coordination of budget processes among the participating agencies and also among Development Partners. Different Development Partners also have differing requirements for reporting, accounting and auditing systems. As the NAIP is expected to attract non-traditional development partners there may be need to comply with additional donor requirements. There is therefore need to strengthen the capacity to manage multiple sources of funds within the Government financial system whilst maintaining high standards of traceability and control.

94
National Agricultural Investment Plan
239. Several measures are needed to ensure the continuing relevance and validity of the NAIP over a five-year implementation period. Circumstances are always changing: new priorities may emerge, new partnerships and changes in domestic or international relations may drastically influence the course of NAIP implementation. Several steps have been taken to ensure continued validity of the NAIP, including: (i) identification of generic and long-lasting programs, within which policy priorities and intervention areas can be easily changed; (ii) a non-prescriptive and flexible approach in value chain selection, as markets change over time; and (iii) various levels of stakeholder fora and coordination bodies to monitor implementation and ensure continued validity.
240. All of the above risks are significant, but need to be considered in comparison to the risks associated with a less ambitious approach to sector development, which imply a high likelihood of continuing poverty, food insecurity, environmental degradation and rural economic stagnation. Against this background, and the proposed risk mitigation measures, the case for implementing the NAIP is compelling.

95
National Agricultural Investment Plan
Chapter 6: Alignment, Mutual Accountability and Monitoring
6.1 Alignment241. Successful implementation of the NAIP requires alignment of all actors in the sector to its
programmatic structure, results framework and implementation arrangements, reinforced by mutual accountability mechanisms and an effective monitoring system for the sector. The main instrument for alignment is the CAADP Compact through which all stakeholders (including GoM, DPs, CSOs and private sector) have subscribed to the values and principles of the CAADP framework. These principles include: (i) evidence-based programming, implementation and monitoring of policies through inclusive stakeholder engagement; and (ii) alignment of all stakeholders to a nationally-owned investment plan rooted in the Maputo and Malabo Declarations. The CAADP process also includes joint sector review and accountability mechanisms at national, regional and continental levels. In line with the Malabo Declaration and NAIP, the CAADP compact will be updated and signed by the same stakeholder categories as the first CAADP Compact, and along the partnership principles of the Malabo Agreement: Government, DPs, private sector, farmer organisations, civil society, NGOs, academia as well as the African Union Commission, NEPAD and COMESA.
242. In order to assume full ownership of the NAIP and lead its implementation, MoAIWD needs to fully align its own systems and processes to it. This includes alignment of (i) Annual Work Plans and Budgets of MoAIWD, as well as relevant parts of those of other key Ministries, Departments and Agencies, and of districts, to the NAIP programmatic structure; (ii) effective use of the governance structures described in Chapter 6 to ensure inter-ministerial coordination around the NAIP; and (iii) consistent allocation of national budget to the NAIP implementing agencies at national and district level by MoFEP&D.
243. Development Partners will align their support to the NAIP in line with the Malawi Development Cooperation Strategy. Key principles include alignment to and use of national systems, harmonisation of procedures, increased predictability of donor funding, involvement of NSAs, and mutual accountability. This implies the following steps during NAIP implementation: (i) reducing the number and fragmentation of projects and increased use of sector budget support, under the MDTF; (ii) bringing more projects on budget and reducing the number of PMUs, including through joint and parallel financing structures; (iii) strengthening the alignment of projects by clearly indicating to which IA and Program they contribute, not only at the outcome level but at the level of outputs and intermediate outcomes. Such alignment of project activities and related targets and budgets will enable MoAIWD to lead and manage NAIP implementation more effectively, by guiding Development Partner support towards under-resourced areas and avoiding duplication in other areas. All new projects in the agriculture sector will have to be cleared upfront by MoAIWD at the national level and Local Assemblies. This will be instrumental for achieving equitable and efficient distribution of activities and investments.
244. In order to formalise such arrangements, the CAADP Compact will be complemented through subsidiary agreements between the main actors operating in the sector. The Code of Conduct will provide a framework for all stakeholders on the principles of engagement in the sector. In addition MoUs should be used between financing partners, mainly between Development Partners and Government, but also in some cases with larger NGOs or private sector financiers, to align projects to specific IAs and Programs. These MoUs will also be agreed and implemented at District level. In the case of pooled funding, a Joint Financing Agreement may replace the MoUs. These mechanisms, additional to the Compact, are described in Table 6.1 below.

96
National Agricultural Investment Plan
Table 6.1: Proposed Alignment Mechanisms for NAIP Implementation and Monitoring
Code of Conduct MoU Joint Financing Agreement
Scope Agriculture Sector NAIP Pooled Fund
AimTo ensure alignment to the National Agriculture Policy
To agree on implementation arrangements, objectives, targets and indicators
To define the terms for the joint funding pool for NAIP implementation
SignatoriesActors funding more than a defined amount to the agricultural sector
Partners contributing funds to NAIP implementation
Partners contributing to the NAIP pooled fund
PlanningPartners plan specific activities aligned to the NAIP
Partners identify specific NAIP activities for earmarked funding
Partners fund the NAIP in an un-earmarked fashion
MonitoringCommon indicators in the Agriculture PAF but possible use of own M&E
Joint M&E arrangements against common indicators of the Agriculture PAF
Common performance indicators for pool fund disbursements
Finance modalityProjects, both on and off budget
Funds earmarked for NAIP budget lines but not pooled
Pooled fund in government held account jointly managed with DPs
Synchronisation
Partners may use own programming cycles but must indicate following year commitments in line with national budget cycle
Partners subscribe to a harmonised disbursement and implementation schedule aligned to the national budget cycle
Partners have common disbursement and implementation aligned to the national budget cycle
245. In addition to different NAIP related government ministries and agencies, mechanisms will also be put in place to strengthen coordination and alignment for DPs that support NAIP-related activities in other sectors and through other ministries. This includes the DP group in nutrition (DoNUTS) but also DPs in other adjacent sectors such as trade, private sector development, social development, and climate change.
6.2 Mechanisms for Mutual Accountability246. All actors engaged in the sector will be required to fully align their financial, technical and
implementation support to the NAIP. Following a renewal of the CAADP Compact and the signature of the aforementioned subsidiary instruments, stakeholders will be held accountable for their commitments to the NAIP. GoM is accountable to the general public in Malawi, to the main beneficiaries of the NAIP and to its financing partners for their commitments under the NAIP. GoM is also accountable for its continental and global commitments, to which the NAIP is expected to contribute. DPs are accountable for their pledges and commitments to the sector under the Development Cooperation Strategy. NSAs are accountable for their roles in NAIP implementation and for increased alignment of their operations to the NAIP. The private sector is accountable for investment commitments and pledges made under the New Alliance Country Cooperation Agreement and CAP-F for their roles as co-financiers and implementers within PPP arrangements.

97
National Agricultural Investment Plan
247. Several accountability mechanisms for GoM’s activities in agriculture are already in place. These include general democratic control instruments such as the Parliamentary Committee responsible for Agriculture which plays an important role in monitoring the agriculture budget implementation. These are complemented by mutual accountability mechanisms through which two or more parties are accountable for their commitments. Mutual accountability is a core principle to support the CAADP agenda and related mutually agreed goals at continental, regional and national level. As one of the six principles of the Paris Declaration on aid effectiveness, mutual accountability aims to increase the incentives and collective responsibility for governments and development partners to achieve their development goals.
248. Mutual accountability can be generated through engagement of a range of actors in governance and oversight. Several multi-stakeholder platforms already exist which coordinate different actors, jointly review implementation progress and highlight issues to be addressed. These platforms include the ASWG at the highest level, the TWGs, the value chain platforms and the high-level public-private coordination and dialogue forum for agriculture, to be established and reinvigorated during the CAP-F process. The JSR has taken place since 2011, coordinated by MoAIWD. It has grown in strength, and in 2015 the private sector actively participated. To reflect the spirit of public-private cooperation of the NAIP, the JSR will be strengthened as an accountability mechanism by requiring that all players in the sector report areas of their engagement, progress on implementation as well as challenges and opportunities. The JSR is a coordination mechanism that builds consensus around key issues. It will be further supported under the NAIP; in particular by the NAIP Secretariat which will have full-time staff dedicated to such coordination, monitoring and evaluation meetings.
249. Under the Malabo Declaration, countries have agreed to a biennial review (BR) mechanism for regular country progress reporting to the African Union Assembly. The BR aims to reinforce mutual accountability and peer learning to deliver on the Malabo targets. A reporting template has been designed that includes 43 performance targets and indicators clustered into 23 performance categories which contribute to the seven commitments of the Declaration. The NAIP is a key instrument towards achieving the Malabo targets and as such, its M&E framework will feed into relevant BR indicators.
6.3 The NAIP M&E System250. Key to achieving the NAIP goal is a sound monitoring and evaluation system in which quality data is
generated, analysed, and used to timely inform operational and strategic decisions of implementers, policy makers and funders at community, district and national levels. Recent evaluations of the ASWAp revealed serious gaps in monitoring and evaluation of agriculture interventions in Malawi. In addition, separate reviews for two large scale projects, the ASWAp Support Project (ASWAp SP), a Multi-Donor Trust Fund project under the ASWAp; and the Agriculture Infrastructure Support Project (AISP); as well as a Mid-Term Evaluation of the Smallholder Irrigation and Value Addition Project (SIVAP) identified similar challenges in M&E. Key challenges include: (1) lack of timely data due to late or non-reporting; (2) Poor data quality; (3) Weak data utilization at all levels of the system; and (4) Weak governance of M&E across the sector.
251. As a consequence, major programmes are conceived and implemented without sound evidence to back up choice of interventions. Where such evidence is used, the data are often outdated and of low quality. Significantly, the majority of the data collected are simply meant to meet reporting requirements at national and international levels rather than enhancing learning and sound managerial decisions at each level of the Agriculture Sector. The need for an effective monitoring and evaluation system is widely acknowledged within the Agriculture sector. In 2013, through technical assistance from the Japan International Cooperation Agency (JICA), a Monitoring and Evaluation Plan for ASWAp was developed.

98
National Agricultural Investment Plan
252. The ASWAp M&E plan identified specific challenges including: (1) The paper-based nature of data collection and transfer which leads to poor adherence to reporting timelines as well as poor quality and incomplete data; (2) The multiplicity of projects and programmes with independent monitoring and evaluation systems which weakens, rather than strengthening, the capacity of the Ministry to effectively monitor results across projects and programmes; (3) Loss of learning from M&E results of completed projects due to unaligned systems as well as weak mechanisms for impact evaluations. To deal with these challenges, the ASWAP M&E plan proposed gradual and optimal computerization, specifically through operation of an Agriculture Management Information System. The ASWAP M&E plan envisioned that the system was to enhance: (1) Common understanding among the stakeholders on the ongoing activities, changing policy environment and their overall results; (2) Accountability for results amongst stakeholders at all levels of the agriculture sector; (3) Efficient response and action on results from monitoring and evaluation data and analysis; and (4) Improved quality of data collection and handling for evidenced-based and informed decision making.
253. To strengthen monitoring, evaluation, research and learning, the MoAIWD is leading the development of a sector-wide National Agriculture Management Information System (NAMIS). Specifically, the NAMIS will strengthen data collection by replacing the predominantly paper based data collection tool with electronic data collection, reporting and analysis at all levels of the Agriculture Sector. Key initiatives in the NAMIS process will include: (1) Single data reporting system for all players in the agriculture sector; (2) development and operationalizing dashboards for each level of implementation and decision making; (3) integration of social accountability tools including community score card system at implementation level to both improve community participation and data quality; (4) Web-based data access; (5) intra-operability with relevant other Management Information Systems When fully operational; and (6) institutionalisation of key national level surveys. The NAMIS will thus significantly improve efficiency and quality of data collection, reporting, analysis and use at all levels, thereby enhancing capacity of managers and policy makers to make evidence-based decisions for improved agriculture outcomes in the country.
254. The NAMIS will, therefore, have the following structure:• At the community level, field staff and enumerators will collect data using tablets;• Primary data will be transferred electronically to EPA level. Any data not collected
electronically, will be entered manually on to the EPA computer and checked for accuracy; • At the District level, data from departments and EPAs will be stored on a server where a
senior officer will undertake quality checks before submitting the data to the national level; and
• At the national level, the system will receive data from district levels and will be sorted and uploaded to different dashboards. A web-based information system will be developed to enable access to information by stakeholders and the general public.
Overall, therefore, the NAIP will address the challenges of monitoring, evaluation and learning under IA1 (Program A), in line with the CAADP Level 3 outcome targets, in particular: (i) strengthened capacity for evidence-based planning, implementation and review; and (ii) improved multi-sectoral coordination, partnerships and mutual accountability

99
National Agricultural Investment Plan
Structure of M&E system255. Table 6.2 shows the structure of the NAIP M&E system, in line with the overall Program
matrix structure described in Chapters 3 and 4. Annex 1 provides a comprehensive overview of the NAIP objectives, indicators and targets at impact, outcome and intermediate outcome levels, along with the main outputs. Annex 2 gives more details on the quantitative impact and outcome targets and baseline values, while annex 3 and 4 contain detailed output targets by IA and Program, respectively.
256. The NAIP budget includes approximately 700 activities with related targets which are consolidated into 257composite outputs. Each output falls under a specific Program and an IA. As described in Chapter 4, there is a vertical results chain (outputs => Program outcomes => development objectives), and a horizontal results chain (outputs => IA intermediate outcomes=> development objectives). Under the vertical results chain, for example, 103 outputs contribute to the eight outcome indicators of Program A, whereas 54 outputs contribute to the eight outcome indicators of Program B. Under the horizontal results chain, each IA has one outcome and between two and six intermediate outcomes, totalling to 48 intermediate outcomes across all 16 IAs. The outputs under each IA feed into the respective intermediate outcomes which then contribute to the impact-level objectives and indicators. In line with the matrix structure, most IAs are composed of outputs under more than one Program. Five IAs (2, 5, 9, 11 and 13) cut across all four Programs, and eight IAs are composed of activities and outputs under three Programs. Only in case of IAs 1 and 3, all outputs are under one Program (A), due to its specific nature.
Table 6.2: NAIP M&E System Structure
Impact objectivesTotal
3
Impact indicators 9
Development Objectives 4
Program à A B C DOutcome statements 4 4 6 6 20Outcome indicators 10 8 7 10 35Intermediate Outcomes Outputs Outputs Outputs OutputsIA 1 3 16 16IA 2 2 5 1 2 3 11IA 3 2 16 16IA 4 3 4 9 13IA 5 3 10 1 2 3 16IA 6 2 3 5 1 9IA 7 2 3 6 1 10IA 8 4 2 8 7 17IA 9 2 8 6 18 4 36IA 10 4 10 3 17 30IA 11 4 4 13 2 1 20IA 12 2 3 4 2 9IA 13 2 1 5 2 8IA 14 6 9 6 8 23IA 15 4 5 8 13IA 16 3 4 2 4 10Total 48 103 54 65 35 257Activities (budget lines) 702

100
National Agricultural Investment Plan
257. All targets at activity and output level have been defined for each Program and IA (view Annexes 3 and 4). The 35 outcome indicators (at the Program level) constitute the key indicators for the NAIP. They are monitorable on an annual basis and, if presented consistently at the JSR and other fora, provide a snap-shot of sector performance. The IAs have corresponding intermediate outcomes but does not have related indicators, as this would prove too complex a reporting system. Rather, the achievement towards the intermediate outcomes will be measured through the sum of the outputs. Baseline and target figures for the outcome (35) and impact (9) indicators are presented to the extent that they are readily available. Some of these indicators may need to be revised and gaps concerning baselines and target values be filled.
258. Further developing and fine-tuning of the RF, including the indicators, targets and baseline values, will be done as part of the start-up activities during the first year of NAIP implementation, with Technical Assistance from a specialised service provider. As a general principle, the number of indicators should be limited, in order to reduce the complexity of the system. To the extent possible, indicators should be items that are already reported as part of the national accounting and statistics system and are required for the biennial review. Some outcome level indicators still require specific surveys to establish baseline and target values.
Roles and ResponsibilitiesTable 6.3: Proposed Allocation of M&E Responsibilities
Coordination Entity
Level of monitoring Lead Agency Reporting Frequency
Impact Level
ASWG Impact NAIP Secretariat /DAPSTo be reported on at baseline, mid-term (year 3) and end-line (year 5), through national accounts or specialised surveys
Outcomes/Program Level
ASWG
Progr A NAIP Secretariat /DAPSBi-annual (or annual)27 reporting on outcomes in the context of the JSR and as bases for strategic planning and AWPBs
Progr B NAIP Secretariat /DLRCProgr C NAIP Secretariat/DAESProgr D NAIP Secretariat
Outputs/Intervention Area (IAs)
Lead Implementing Agencies
IA1 MoAIWD
Bi-annual reporting on outputs and annual reporting on intermediate outcomes every year at the JSR Results are to be validated by the respective TWGs and the ASWG
IA2 MoAIWD, MoITTIA3 MoAIWD IA4 MoHP& MoAIWDIA5 MoITTIA6 MoLHUD & MoGSWCDIA7 MoNREM – NFRAIA8 MoAIWD IA9 MoAIWD
IA10 MoAIWD IA11 MoNREM & MoAIWDIA12 MoAIWDIA13 MoAIWD - IA14 MoITTIA15 MoITT & MoAIWDIA16 MoFEP&D & RBM
27For specific outcomes such as production and productivity and stakeholder satisfaction with public service provision, targeted surveys might be implemented annually, to be decided by key stakeholders during implementation.

101
National Agricultural Investment Plan
259. The DAPS in MoAIWD has primary responsibility for M&E and will collaborate with the National Statistical Office, MoITT, MoLHUD, among others. In view of the magnitude of the task and the need to consolidate data from different sources and implementing partners, it is proposed to align the responsibility for data collection and reporting closely to the NAIP implementation structure. Hence, responsibility will rest with the NAIP Secretariat which is also in charge of coordinating the implementation of the NAIP. The Secretariat will be supported by a technical service provider during an initial period, until baseline data collection has been completed, the M&E system is operational and the capacity has been built in DAPS and other agencies to ensure continuity. At the level of each IA, the LA will be responsible for data collection and reporting on outputs and intermediate outcomes. The NAIP Secretariat will consolidate the data for each Program and report on outcome and development indicators. Data on investments and policy commitments under the CAP-F will also be consolidated by the NAIP secretariat. The EMC and the ASWG will monitor the establishment and operation of the system through the JSR. The TWGs can help the LAs in facilitating data collection, if needed.
260. Reporting on the SDGs and towards the Biennial Review under the Malabo declaration also falls within IA1. This includes the training as well as support to the Biennial Review contact person (most likely the Director of Planning of MoAIWD) as well as his/her participation in relevant CAADP events.
261. To address funding constraints for sector wide M&E, it is recommended that each new project or Program supporting the agricultural sector irrespective of the funding source (be it government or donor financed) earmarks a percentage (1-2%) of its budget towards strengthening the design and operation of a sector wide M&E system. In addition to informing the sector wide system, individual projects/Programs may also report on specific indicators requested by their respective donors.
262. The general approach to M&E recognises that a large amount of work remains to be done in the detailed design of a comprehensive M&E system and to ensure that the system is operational from the outset. Long term TA is required to design the M&E system and develop sector-wide monitoring tools, as well as for supporting MoAIWD in M&E efforts. It is important that the TA be initiated as soon as possible after approval of the NAIP, and DPs are encouraged to finance this, possibly through pooled/basket funding. The outputs envisaged from the TA include:• A Performance Assessment Framework (PAF) further developing and fine-tuning the Results
Framework which is part of this NAIP, as well as identifying the data sources and baseline figures. The PAF will consist of a limited number of mostly outcome indicators.
• Executing or supporting various studies at output-outcome-and impact levels to capture baseline data and re-evaluate and possibly update the targets of the NAIP.
• Development and implementation of reporting formats and other data collection tools for front line staff.
• Development of a sector-wide M&E system capturing both decentralised and headquarters levels.

102
National Agricultural Investment Plan
Anne
x 1:
Hig
h-le
vel R
esul
ts F
ram
ewor
k an
d Pr
ogra
m S
truc
ture
This
anne
x sho
ws t
he re
sults
fram
ewor
k em
bedd
ed in
the
mat
rix st
ruct
ure.
The
qua
ntita
tive
targ
ets a
nd b
asel
ine
valu
es a
re d
ispla
yed
in a
nnex
2 (o
utco
me
leve
l) an
d an
nexe
s 3 a
nd 4
(out
put l
evel
). Th
e de
taile
d ac
tivity
-leve
l tar
gets
are
in th
e bu
dget
file
.
Goal
To a
chie
ve su
stai
nabl
e ag
ricul
tura
l tra
nsfo
rmat
ion
that
will
resu
lt in
sign
ifica
nt g
row
th o
f the
agr
icultu
ral s
ecto
r, ex
pand
ing
inco
mes
for f
arm
hou
seho
lds,
impr
oved
food
and
nut
ritio
n se
curit
y fo
r all
Mal
awia
ns, a
nd in
crea
sed
agric
ultu
ral e
xpor
ts
Impa
ct
obje
ctiv
es
1.
To ac
hiev
e co
nsist
ent a
nd b
road
-bas
ed ag
ricul
tura
l gro
wth
2.
To im
prov
e we
ll-be
ing
and
livel
ihoo
ds o
f Mal
awia
ns3.
To
impr
ove
food
& n
utrit
ion
secu
rity
Impa
ct
indi
cato
rs
i. Co
nsist
ent a
gricu
ltura
l sec
tor G
DP g
rowt
h ii.
Gr
owin
g sh
are
of ag
ricul
tura
l GDP
from
com
mod
ities
oth
er th
an to
bacc
o an
d m
aize
iii
. Sh
are
of th
e po
pula
tion
livin
g ab
ove
the
natio
nal p
over
ty li
ne;
iv.
Rura
l pov
erty
gap
v.
Shar
e of
hou
seho
lds r
esili
ent t
o cli
mat
e an
d we
athe
r-rel
ated
shoc
ksvi.
Re
ducti
on in
Mal
awi’s
scor
e in
the
Glob
al H
unge
r Ind
exvii
. Re
ducti
on o
f stu
ntin
g am
ong
0-5
year
-old
child
ren
viii.
Redu
ction
of u
nder
weig
ht am
ong
0-5
year
-old
child
ren
ix.
Food
inse
curit
y
Prog
ram
s
Prog
ram
A
Polic
ies,
Inst
itutio
ns a
nd C
oord
inat
ion
for R
esul
ts
Prog
ram
B
Resi
lient
Live
lihoo
ds a
nd
Agric
ultu
ral S
yste
ms
Prog
ram
C
Prod
uctio
n an
d Pr
oduc
tivity
for
Grow
th
Prog
ram
D
Mar
kets
, Val
ue A
dditi
on, T
rade
and
Fi
nanc
e fo
r Tra
nsfo
rmat
ion
Prog
ram
De
velo
pmen
t Ob
ject
ives
To Im
prov
e po
licy
and
regu
lato
ry
fram
ewor
k, re
sults
-orie
nted
st
akeh
olde
r coo
rdin
atio
n an
d m
ore
effe
ctiv
e an
d ac
coun
tabl
e in
stitu
tions
To st
reng
then
resi
lienc
e of
liv
elih
oods
and
nat
ural
reso
urce
ba
se fo
r agr
icultu
re
To in
crea
se P
rodu
ctio
n an
d pr
oduc
tivity
of a
mor
e di
vers
ified
ag
ricul
tura
l sec
tor
To e
nhan
ce m
arke
t acc
ess,
valu
e ad
ditio
n, tr
ade
and
acce
ss to
fina
nce
Prog
ram
Ou
tcom
e St
atem
ents
- Stre
ngth
ened
capa
city f
or e
viden
ce-
base
d pl
anni
ng, im
plem
enta
tion
and
revie
w of
pol
icies
and
prog
ram
s (CA
ADP)
- Im
prov
ed co
ordi
natio
n of
pub
lic an
d pr
ivate
stak
ehol
ders
in ag
ricul
ture
- E
nhan
ced
Publ
ic ag
ricul
tura
l ser
vice
deliv
ery c
apac
ity a
ccor
ding
to it
s m
anda
te
- Im
prov
ed e
nabl
ing
envir
onm
ent f
or
agrib
usin
ess i
nves
tmen
ts
- Inc
reas
ed d
ieta
ry d
ivers
ity an
d re
duce
d in
food
inse
curit
y - I
mpr
oved
food
safe
ty an
d sa
nita
tion
envir
onm
ent
- Im
prov
ed n
atur
al re
sour
ce
man
agem
ent f
or su
stain
able
ag
ricul
ture
and
livel
ihoo
ds- R
educ
ed in
ciden
ce an
d im
pact
of
pest
and
dise
ases
in cr
op, li
vesto
ck
and
fishe
ries p
rodu
ction
- Inc
reas
ed p
rodu
ctivit
y and
pr
oduc
tion
of p
riorit
y val
ue ch
ains
; - I
ncre
ased
acce
ss to
and
cont
rol o
ver
prod
uctiv
e as
sets
- Enh
ance
d tim
ely a
cces
s to
a bro
ader
ra
nge
of q
ualit
y inp
uts
- Inc
reas
ed ac
cess
to su
stain
able
m
echa
nisa
tion
serv
ices
- Inc
reas
ed ad
optio
n of
GAP
and
tech
nolo
gies
gen
erat
ed
- Sus
tain
able
incr
ease
of d
ivers
ified
cr
op p
rodu
ction
and
prod
uctiv
ity
unde
r irri
gatio
n
- Gre
ater
effi
cienc
y and
tran
spar
ency
of
agric
ultu
ral m
arke
ts an
d be
tter m
arke
t ac
cess
- I
ncre
ased
dive
rsifi
catio
n of
agric
ultu
ral
expo
rts w
ith sp
ecia
l em
phas
is on
Intra
-Af
rican
trad
e- I
ncre
ased
num
ber o
f far
mer
s/FOs
link
ed
to m
arke
ts an
d fin
ance
- V
olum
e an
d in
clusiv
enes
s of p
rivat
e in
vestm
ent a
grib
usin
ess e
nhan
ced
- Inc
reas
ed ag
ricul
tura
l val
ue ad
ditio
n an
d pr
oces
sing
- Pos
t-har
vest
loss
es re
duce
d

103
National Agricultural Investment Plan
Outc
ome
Indi
cato
rs
- MoA
IWD
prov
ides
its p
olicy
, ove
rsig
ht,
coor
dina
tion;
and
serv
ice fu
nctio
ns
effic
ient
ly- T
echn
ical W
orki
ng G
roup
s, Hi
gh-Le
vel
Publ
ic-Pr
ivate
Coo
rdin
atio
n Fo
rum
and
Valu
e Ch
ain
Plat
form
s im
plem
ent t
heir
work
pla
ns e
ffecti
vely
- Ins
titut
iona
lise
M&E
syste
m fo
r the
ag
ricul
tura
l sec
tor i
n pl
ace
- New
Alli
ance
and
CAP-
F pol
icy
com
mitm
ents
impl
emen
ted
by d
ue d
ate
- Effe
ctive
coor
dina
tion
of se
rvice
pro
vider
s at
all l
evel
s- R
atio
of e
xten
sion
work
ers t
o fa
rmer
s- I
mpr
ovem
ent i
n M
alaw
i’s ra
nkin
g in
En
ablin
g th
e Bu
sines
s of A
gricu
lture
In
dex
- Fas
ter l
icens
ing
of in
puts
that
hav
e al
read
y bee
n ac
cred
ited
in o
ther
SAD
C co
untri
es
- Inc
reas
e in
Num
ber o
f hou
seho
lds,
child
ren
unde
r 5, a
nd w
omen
m
eetin
g th
e 6-
food
gro
up m
inim
um
diet
ary d
ivers
ity re
quire
men
t- R
educ
tion
in afl
atox
in le
vels
in
grou
ndnu
ts an
d m
aize
- Size
of s
usta
inab
le fi
sher
ies a
nd
aqua
cultu
re (w
ithin
bio
logi
cally
su
stain
able
leve
ls) in
% o
f GDP
- Ann
ual i
ncre
ase
in ar
ea u
nder
su
stain
able
land
and
wate
r m
anag
emen
t- I
ncre
ase
in W
oody
bio
-mas
s- R
educ
tion
in in
divid
uals
requ
iring
fo
od as
sista
nce
- Red
uctio
n in
Live
stock
mor
talit
y ra
tes
- Red
uctio
n in
crop
area
seve
rely
affe
cted
by p
est o
utbr
eaks
per
year
- Inc
reas
e in
pro
ducti
vity o
f tar
get
crop
s, liv
esto
ck p
rodu
ction
and
aqua
cultu
re- N
umbe
r of f
arm
ers w
ith la
nd ri
ghts
reco
rded
und
er th
e ne
w La
nd
Regi
stry (
by se
x and
age)
- Inc
reas
e in
Per
cent
age
of fa
rmer
s us
ing
impr
oved
seed
s- I
ncre
ase
in Fe
rtilis
er u
sage
per
ha o
f ar
able
land
- I
ncre
ase
in S
hare
of l
and
prep
ared
wi
th m
echa
nise
d co
nser
vatio
n ag
ricul
ture
impl
emen
ts- I
ncre
ase
in C
ropp
ing
inte
nsity
on
exist
ing
and
new
irrig
atio
n sc
hem
es
- Inc
reas
e in
Sha
re o
f agr
icultu
ral p
rodu
ce
sold
on
mar
kets
- Inc
reas
e in
Sha
re o
f agr
icultu
ral e
xpor
ts ot
her t
han
toba
cco
- Inc
reas
e in
Sha
re o
f hig
h-va
lue
and
proc
esse
d pr
oduc
ts in
agric
ultu
ral
expo
rts- I
ncre
ase
in Vo
lum
e of
Intra
-Afri
can
agric
ultu
ral t
rade
- Inc
reas
e in
Num
ber o
f FOs
und
er
cont
ract
farm
ing
- Inc
reas
e in
Priv
atel
y man
aged
stor
age
capa
city
- Inc
reas
e in
Rat
io o
f priv
ate
agric
ultu
ral
inve
stmen
ts to
GDP
- R
educ
tion
in P
ost-h
arve
st lo
sses
- I
ncre
ase
in le
ndin
g to
Agr
i-SM
Es an
d fa
rmer
s - R
educ
tion
in g
ap b
etwe
en fa
rm g
ate
and
whol
esal
e pr
ices
- Red
uctio
n in
Dom
estic
food
pric
e vo
latil
ity

104
National Agricultural Investment Plan
Inte
rmed
iate
out
com
esOu
tput
s Pro
gram
AOu
tput
s Pro
gram
BOu
tput
s Pro
gram
COu
tput
s Pro
gram
DIA
1: C
oord
inat
ion
& M
&EOu
tcom
e: E
ffect
ive
mec
hani
sms f
or m
ulti-
sect
oral
and
mul
ti-st
akeh
olde
r coo
rdin
atio
n to
supp
ort p
rogr
am im
plem
enta
tion,
mon
itorin
g an
d ev
alua
tion
in p
lace
IO 1
.1 M
oAIW
D fu
lly
oper
atio
nal a
nd co
re
fund
ing
prov
ided
to
finan
ce o
pera
tiona
l and
re
curre
nt co
sts fo
r ove
rsig
ht
and
impl
emen
tatio
n of
the
NAIP
- MoA
IWD
restr
uctu
red
acco
rdin
g to
the
Core
Func
tion
Anal
ysis
- Inc
reas
ed st
aff l
evel
s mai
ntai
ned
and
paid
- MoA
IWD
fully
ope
ratio
nal a
t EPA
, Di
strict
, AAD
and
HQ le
vels
- HQ-
ADD-
Distr
ict m
onito
ring
of fi
eld
activ
ities
- Veh
icle
fleet
cont
inuo
usly
mai
ntai
ned
IO 1
.2 Im
prov
ed
coor
dina
tion
of p
olicy
and
prog
ram
impl
emen
tatio
n pa
rtner
ship
s and
mut
ual
acco
unta
bilit
y at a
ll le
vels.
- Coo
rdin
atio
n tro
ika f
uncti
onal
- Im
prov
ed in
tra-m
inist
eria
l coo
rdin
atio
n str
uctu
res
- EM
C, N
AIP
secr
etar
iat a
nd S
TM
func
tiona
l- S
ecto
r tar
getin
g ha
rmon
ised
- SW
G an
d TW
Gs fu
nctio
ning
as p
lann
ed- V
illag
e, E
PA, D
istric
t and
ADD
co
ordi
natio
n str
uctu
res f
uncti
onal
IO
1.3
M&E
syste
ms a
nd
perfo
rman
ce m
anag
emen
t in
agric
ultu
re fu
nctio
ning
an
d up
to d
ate
- Nat
iona
l M&E
syste
ms f
uncti
onin
g sa
tisfa
ctoril
y- S
ecto
r-wid
e HQ
and
dece
ntra
lised
MIS
sy
stem
in p
lace
- P
erfo
rman
ce A
sses
smen
t Fra
mew
ork
deve
lope
d fo
r the
agric
ultu
ral s
ecto
r- S
ecto
r wid
e ou
tput
, out
com
e, b
asel
ine
and
topi
c-spe
cific s
urve
ys- B
ienn
ial M
alab
o an
d SD
G re
porti
ng

105
National Agricultural Investment Plan
IA 2
: Stre
ngth
enin
g Fa
rmer
s Org
anis
atio
nsOu
tcom
e: P
erfo
rman
ce an
d ou
treac
h of
farm
er o
rgan
isatio
ns st
reng
then
ed at
all l
evel
sIO
2.1
Lega
l fra
mew
ork a
nd
insti
tutio
nal s
uppo
rt fo
r FO
s stre
ngth
ened
- Coo
pera
tives
act r
evise
d- F
O De
velo
pmen
t Stra
tegy
in p
lace
- Agr
icultu
ral C
oope
rativ
e In
stitu
te
esta
blish
ed- F
O su
ppor
ting
insti
tutio
ns
stren
gthe
ned
- FO
data
base
esta
blish
ed an
d up
date
dIO
2.2
Stro
ng, w
ell-
orga
nise
d an
d in
clusiv
e FO
s con
duct
busin
ess a
nd
prov
ide
serv
ices t
o th
eir
mem
bers
- Tra
inin
g of
gro
ups t
o es
tabl
ish FO
s an
d ch
ose
ente
rpris
es
- FOs
trai
ned
on e
nter
prise
an
d bu
sines
s - L
ong-
term
trai
ning
of F
O le
ader
s
- FOs
pro
ducin
g un
der c
ontra
ct - A
grib
usin
ess F
Os fo
rmed
- FOs
link
ed to
war
ehou
ses /
com
mod
ity
exch
ange
s
IA 3
: Pub
lic A
gricu
ltura
l Ser
vice
s Del
iver
yOu
tcom
e: M
oAIW
D’s c
apac
ity st
reng
then
ed to
pro
vide
rele
vant
, mar
ket-o
rient
ed ag
ricul
tura
l ext
ensio
n se
rvice
s
IO 3
.1 C
apac
ity o
f pub
lic
secto
r ins
titut
ions
to
prov
ide
agric
ultu
ral
exte
nsio
n se
rvice
s str
engt
hene
d
- Ext
ensio
n po
licy u
pdat
ed- T
rain
ing
need
s ass
essm
ent
- Ext
erna
l tra
inin
g of
staf
f (sh
ort c
ours
e,
BSc,
MSc
, PhD
)- T
echn
ical t
rain
ing
of fr
ontli
ne st
aff
- Pub
lic Ve
terin
ary S
ervic
e Ga
p an
alys
is co
mpl
eted
- S
tude
nts g
radu
ate
from
refu
rbish
ed
Mal
awi F
isher
ies C
olle
ge- R
ecru
itmen
t of E
PA, D
istric
t lev
el st
aff
and
rese
arch
ers
- HIV
/AID
S nu
tritio
n su
pple
men
ts pr
ovid
ed

106
National Agricultural Investment Plan
IO.3
.2 P
ublic
ext
ensio
n wo
rker
s at d
ecen
tralis
ed
leve
ls ar
e eq
uipp
ed w
ith
adeq
uate
tran
spor
t, of
fice,
te
chni
cal a
nd h
ousin
g fa
ciliti
es
- EPA
, dist
rict a
nd b
oard
er le
vel o
ffice
an
d ho
usin
g str
uctu
res a
nd o
ffice
str
uctu
res u
pgra
ded
to m
inim
um
acce
ptab
le st
anda
rds
- mot
orbi
kes a
nd ve
hicle
s pro
cure
d- I
CT p
acka
ges a
vaila
ble
at al
l lev
els
- Lab
orat
orie
s upg
rade
d;
- Gov
ernm
ent f
arm
s hav
e el
ectri
city
- Fish
erie
s ves
sels
avai
labl
e- A
gricu
lture
Trai
ning
Cen
tres
reha
bilit
ated
- F
ront
line
staf
f hav
e eq
uipm
ent
avai
labl
e as
per
thei
r are
a of e
xper
tise
IA 4
Food
and
Nut
ritio
n Se
curit
yOu
tcom
e: D
ivers
e, n
utrit
ious
food
s ava
ilabl
e an
d co
nsum
edIO
4.1
Impr
oved
im
plem
enta
tion,
co
ordi
natio
n an
d m
onito
ring
of n
utrit
ion
rela
ted
activ
ities
in th
e ag
ricul
tura
l sec
tor
- Nut
ritio
n sta
keho
lder
s coo
rdin
ated
at
all l
evel
s- S
emi-a
nnua
l nat
iona
l lev
el n
utrit
ion
foru
ms u
nder
take
n- N
utrit
ion
Polic
y upd
ated
- Nut
ritio
n da
ta co
llecte
d an
nual
ly at
di
strict
leve
l IO
4.2
Sm
allh
olde
r far
mer
s lin
ked
to fo
od p
urch
ase
for i
nstit
utio
nal f
eedi
ng
prog
ram
s
- Sch
ool f
eedi
ng p
rogr
ams i
mpr
oved
- Orc
hard
s esta
blish
ed in
scho
ols
IO 4
.3 N
utrit
ion
educ
atio
n is
wide
ly av
aila
ble
at al
l le
vels
inclu
ding
gra
ssro
ots
- Coo
king
dem
onstr
atio
ns
unde
rtake
n- H
ouse
hold
s sen
sitise
d on
nut
ritio
n- I
nteg
rate
d ho
mes
tead
gar
dens
es
tabl
ished
- V
illag
e le
vel n
utrit
ion
fairs
un
derta
ken
- Nut
ritio
n Ca
re g
roup
s esta
blish
ed
at E
PAs
- Far
mer
s sen
sitize
d on
bio
-forti
fied
varie
ties
- Far
mer
s tra
ined
on
food
pro
cess
ing

107
National Agricultural Investment Plan
IA 5
: Foo
d sa
fety
and
Qua
lity
Stan
dard
sOu
tcom
e: Fo
od sa
fety
and
qual
ity st
anda
rds e
stabl
ished
and
mai
nstre
amed
IO 5
.1 A
ppro
pria
te an
d ad
equa
te fo
od sa
fety
po
licy,
legi
slatio
n an
d qu
ality
cont
rol s
yste
ms i
n pl
ace
- Foo
d Sa
fety
and
Qual
ity La
w en
acte
d- F
ood
safe
ty an
d qu
ality
cont
rol
orga
niza
tion
esta
blish
ed- P
rodu
ct-sp
ecifi
c sta
ndar
ds d
evel
oped
IO 5
.2 K
nowl
edge
of f
ood
safe
ty is
sues
enh
ance
d al
ong
the
valu
e ch
ain
- Ag
and
Trade
TWGs
trai
ned
on fo
od
safe
ty- M
ulti-
stake
hold
er fo
rum
esta
blish
ed
and
mee
ts re
gula
rly- R
apid
asse
ssm
ent o
f foo
d ha
zard
s- A
frica
Afla
toxin
Man
agem
ent S
yste
m
upda
ted
- Inf
orm
atio
n on
aflat
oxin
and
othe
r foo
d-bo
rne
dise
ases
wid
ely
diss
emin
ated
- Far
mer
s/fish
erm
en tr
aine
d on
fo
od sa
fety
man
agem
ent
- FOs
and
SMEs
trai
ned
on fo
od
safe
ty m
anag
emen
t
- Foo
d pr
oces
sors
trai
ned
on fo
od
hand
ling
IO 5
.3 Q
ualit
y con
trol
activ
ities
und
erta
ken
- Dep
artm
ent o
n pr
oces
s con
trol,
prod
uct e
xam
inat
ion
and
certi
ficat
ion
esta
blish
ed w
ithin
Food
Age
ncy
- Lab
orat
orie
s acc
redi
ted
inte
rnat
iona
lly- Q
ualit
y con
trol s
yste
m d
evel
oped
- Ins
pecti
on vi
sits t
o fo
od
proc
essin
g fa
ciliti
es- M
onito
ring
visits
(inc
ludi
ng
audi
t and
accr
edita
tion)
IA 6
: Em
pow
erm
ent a
nd Te
nure
Sec
urity
Outc
ome:
Wom
en an
d yo
uth
empo
were
d an
d la
nd te
nure
secu
rity e
nhan
ced
IO 6
.1 Im
plem
enta
tion
of
the
Land
Pol
icy su
ppor
ted
- Dist
rict l
evel
land
regi
strie
s es
tabl
ished
Impl
emen
tatio
n of
in
stitu
tiona
l asp
ects
of th
e La
nd P
olicy
- Dist
rict l
evel
awar
enes
s mee
tings
on
land
for i
nves
tmen
t und
erta
ken
- Sen
sitiza
tion
of co
mm
unity
le
ader
s/EPA
leve
l on
land
righ
ts
- Reg
istra
tion
of la
nd
IO 6
.2 In
crea
sed
parti
cipat
ion
of w
omen
and
yout
h in
agric
ultu
ral v
alue
ch
ains
and
insti
tutio
ns
- Gov
ernm
ent s
taff
train
ed o
n ge
nder
iss
ues
- Upd
ate
of ag
ricul
tura
l cur
ricul
a on
gend
er an
d HI
V/AI
DS is
sues
- Int
ra-h
ouse
hold
gen
der r
elat
ions
im
prov
ed- W
omen
/you
th g
roup
s str
engt
hene
d - S
trate
gy o
n de
cent
em
ploy
men
t de
velo
ped
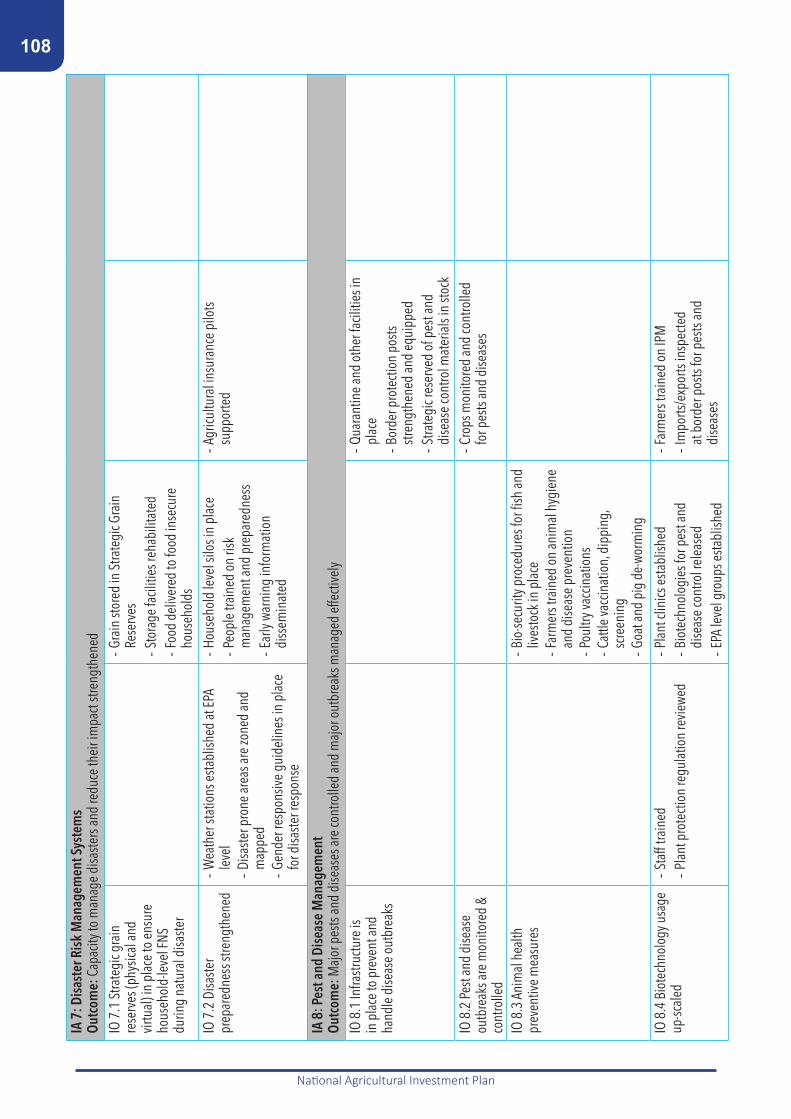
108
National Agricultural Investment Plan
IA 7
: Dis
aste
r Ris
k M
anag
emen
t Sys
tem
sOu
tcom
e: C
apac
ity to
man
age
disa
sters
and
redu
ce th
eir i
mpa
ct str
engt
hene
dIO
7.1
Stra
tegi
c gra
in
rese
rves
(phy
sical
and
virtu
al) i
n pl
ace
to e
nsur
e ho
useh
old-
leve
l FNS
du
ring
natu
ral d
isaste
r
- Gra
in st
ored
in S
trate
gic G
rain
Re
serv
es
- Sto
rage
facil
ities
reha
bilit
ated
- Foo
d de
liver
ed to
food
inse
cure
ho
useh
olds
IO 7
.2 D
isaste
r pr
epar
edne
ss st
reng
then
ed- W
eath
er st
atio
ns e
stabl
ished
at E
PA
leve
l - D
isaste
r pro
ne ar
eas a
re zo
ned
and
map
ped
- G
ende
r res
pons
ive g
uide
lines
in p
lace
fo
r disa
ster r
espo
nse
- Hou
seho
ld le
vel s
ilos i
n pl
ace
- Peo
ple
train
ed o
n ris
k m
anag
emen
t and
pre
pare
dnes
s- E
arly
warn
ing
info
rmat
ion
diss
emin
ated
- Agr
icultu
ral i
nsur
ance
pilo
ts su
ppor
ted
IA 8
: Pes
t and
Dis
ease
Man
agem
ent
Outc
ome:
Maj
or p
ests
and
dise
ases
are
cont
rolle
d an
d m
ajor
out
brea
ks m
anag
ed e
ffecti
vely
IO 8
.1 In
frastr
uctu
re is
in
pla
ce to
pre
vent
and
hand
le d
iseas
e ou
tbre
aks
- Qua
rant
ine
and
othe
r fac
ilitie
s in
plac
e- B
orde
r pro
tecti
on p
osts
stren
gthe
ned
and
equi
pped
- Stra
tegi
c res
erve
d of
pes
t and
di
seas
e co
ntro
l mat
eria
ls in
stoc
k IO
8.2
Pes
t and
dise
ase
outb
reak
s are
mon
itore
d &
cont
rolle
d
- Cro
ps m
onito
red
and
cont
rolle
d fo
r pes
ts an
d di
seas
es
IO 8
.3 A
nim
al h
ealth
pr
even
tive
mea
sure
s - B
io-se
curit
y pro
cedu
res f
or fi
sh an
d liv
esto
ck in
pla
ce- F
arm
ers t
rain
ed o
n an
imal
hyg
iene
an
d di
seas
e pr
even
tion
- Pou
ltry v
accin
atio
ns- C
attle
vacc
inat
ion,
dip
ping
, sc
reen
ing
- Goa
t and
pig
de-
worm
ing
IO 8
.4 B
iote
chno
logy
usa
ge
up-sc
aled
- S
taff
train
ed
- Pla
nt p
rote
ction
regu
latio
n re
viewe
d - P
lant
clin
ics e
stabl
ished
- B
iote
chno
logi
es fo
r pes
t and
di
seas
e co
ntro
l rel
ease
d- E
PA le
vel g
roup
s esta
blish
ed
- Far
mer
s tra
ined
on
IPM
- Im
ports
/exp
orts
insp
ecte
d at
bor
der p
osts
for p
ests
and
dise
ases

109
National Agricultural Investment Plan
IA9:
Agr
icul
tura
l Inn
ovat
ion
Syst
ems
Out
com
e: D
eman
d-dr
iven
and
plur
alist
ic in
nova
tion
syste
ms g
ener
ates
and
diss
emin
ates
rele
vant
and
adeq
uate
tech
nolo
gies
to al
l far
mer
s
IO 9
.1 E
fficie
nt re
sear
ch
partn
ersh
ips e
stabl
ished
in
a par
ticip
ator
y and
dem
and
drive
n wa
y, in
cludi
ng o
n-fa
rm re
sear
ch
- Res
earc
h ac
tiviti
es co
ordi
nate
d ef
fecti
vely
- MIR
T stre
ngth
ened
- Sta
keho
lder
tech
nolo
gy re
leas
e m
eetin
gs co
nduc
ted
- ARE
T dive
rsifi
catio
n pl
an- S
tude
nts r
ecei
ved
rese
arch
gra
nts
- Ger
mpl
asm
cons
erve
d- M
alaw
i Pla
nt an
d Ge
netic
Cen
tre
refu
rbish
ed
- Micr
o-nu
trien
t bio
-forti
fied
crop
s de
velo
ped
- Im
prov
ed va
rietie
s and
te
chno
logi
es d
evel
oped
- On-
farm
par
ticip
ator
y res
earc
h/GA
Ps tr
ials
cond
ucte
d- A
nalys
is un
derta
ken
of si
te-
spec
ific c
onstr
aint
s
IO 9
.2 R
elev
ant,
evid
ence
-ba
sed
exte
nsio
n ad
vice
deliv
ered
in a
dem
and-
drive
n an
d pa
rticip
ator
y wa
y.
- Dist
rict l
evel
dat
abas
es o
n ex
tens
ion
esta
blish
ed
- Live
stock
Mas
ter P
lan
deve
lope
d Ag
ricul
tura
l Res
ourc
e Ce
ntre
s op
erat
iona
l - G
AP g
uide
lines
cont
inuo
usly
upda
ted
- Far
mer
s inv
olve
d in
smal
l sto
ck
pass
-on
and
train
ed o
n sm
all-s
tock
m
anag
emen
t - F
arm
ers i
nvol
ved
in p
oultr
y pas
s-on
and
train
ed o
n sm
all-s
tock
m
anag
emen
t - B
ee-k
eepe
rs tr
aine
d- V
illag
e-le
vel l
ivesto
ck co
mm
ittee
s re
vam
ped
- Lea
d fa
rmer
s tra
ined
and
iden
tified
- Clu
sters
, far
mer
fiel
d sc
hool
s, gr
een
belts
and
mod
el vi
llage
s im
plem
ente
d- F
ield
day
s on
GAPS
und
erta
ken
- Lan
d un
der G
AP
- Far
mer
s rec
eive
ext
ensio
n se
rvice
s re
late
d to
the
prod
uctio
n th
ey ar
e un
derta
king
- Int
ercr
oppi
ng w
ith n
itrog
en-fi
legu
mes
und
erta
ken
- Dist
rict a
gricu
ltura
l fai
rs
unde
rtake
n- I
nput
s sup
plie
d to
farm
ers f
or
dem
onstr
atio
ns- S
tall
feed
ing
unde
rtake
n- G
razin
g ar
eas a
nd w
ater
poi
nts
esta
blish
ed- F
odde
r tre
es p
lant
ed
- Far
mer
s tra
ined
on
deep
fond
fish
pr
oduc
tion
- Cag
e cu
lture
s esta
blish
ed- D
ams r
esto
cked
- Val
ue ad
ditio
n gr
oups
form
ed- F
arm
ers t
rain
ed o
n po
st-ha
rves
t m
anag
emen
t - S
MEs
/Coo
ps tr
aine
d on
pr
oces
sing
- Equ
ipm
ent d
istrib
uted
for p
ost-
harv
est d
emos

110
National Agricultural Investment Plan
IA 1
0: A
cces
s to
inpu
tsOu
tcom
e: Fa
rmer
s hav
e tim
ely a
cces
s to
a bro
ader
rang
e of
qua
lity i
nput
s at r
easo
nabl
e co
stsIO
10.
1 Ef
ficie
nt se
ed
supp
ly sy
stem
s esta
blish
ed
- Im
port
proc
edur
es si
mpl
ified
- P
roce
dure
s for
testi
ng an
d re
leas
e im
prov
ed
- See
d Bi
ll pa
ssed
- See
d Se
rvice
s Uni
t res
tructu
red
- FIS
P im
plem
ente
d wi
th in
crea
sed
priva
te se
ctor p
artic
ipat
ion
- Far
mer
s rec
eive
vouc
hers
for c
o-fin
ancin
g of
legu
me
and
seed
in
puts
- Im
port
perm
its an
d Ph
ytos
anita
ry
certi
ficat
es is
sued
- Com
mun
ity se
ed b
anks
es
tabl
ished
- B
asic
seed
pro
ducti
on in
crea
sed
- See
d m
ultip
lied
by fa
rmer
s- S
SU in
spec
tion
of fi
elds
- N
urse
ries f
or tr
ee an
d ve
geta
ble
seed
lings
esta
blish
ed
IO 1
0.2
FISP
refo
rms
adva
nced
- F
ISP
refo
rm o
ptio
ns st
udie
d- F
ISP
refo
rm o
ptio
ns p
ilote
d- F
ISP
refo
rm o
ptio
ns m
onito
red
and
disc
usse
d am
ongs
t sta
keho
lder
s
IO 1
0.3
Supp
ly ch
ains
for
orga
nic a
nd in
-org
anic
ferti
liser
stre
ngth
ened
- Pes
ticid
e Co
ntro
l Boa
rd st
reng
then
ed
- Sem
i-aut
onom
ous f
ertil
iser r
egul
ator
y bo
dy e
stabl
ished
- Soi
l lab
s ref
urbi
shed
- Opt
ions
for d
omes
tic fe
rtiliz
er
man
ufac
turin
g ev
alua
ted
- Far
mer
s pro
duce
man
ure
and
inor
gani
c fer
tilise
r - N
atio
nal s
oil m
aps u
pdat
ed
- FIS
P fe
rtilis
er vo
uche
rs d
istrib
uted
- F
ertil
iser s
ampl
es an
alys
ed fo
r qu
ality
- A
rea-
spec
ific f
ertil
iser
reco
mm
enda
tions
pro
vided
IO 1
0.4
Lives
tock
and
fishe
ries g
ene
pool
im
prov
ed an
d br
eedi
ng
stock
mad
e av
aila
ble
to
farm
ers
- Live
stock
cons
erva
tion
prot
ocol
s de
velo
ped
- Sm
all
stock
m
ultip
licat
ion
thro
ugh
farm
er b
reed
ers
- Pro
ducti
on an
d re
stock
ing
of
finge
rling
s- A
rtific
ial i
nsem
inat
ion
of li
vesto
ck
cond
ucte
d- L
ivesto
ck b
reed
ing
anim
als
sour
ced
- Hei
fer p
ass-o
n sc
hem
e im
plem
ente
d
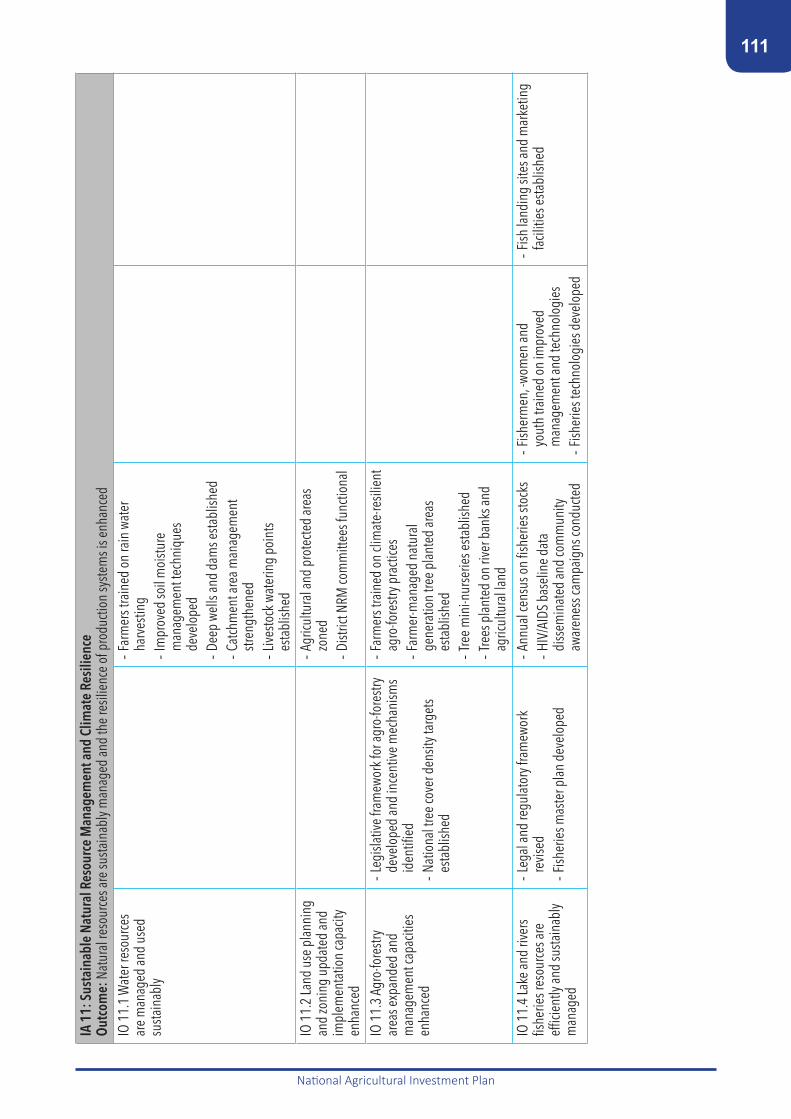
111
National Agricultural Investment Plan
IA 1
1: S
usta
inab
le N
atur
al R
esou
rce
Man
agem
ent a
nd C
limat
e Re
silie
nce
Outc
ome:
Nat
ural
reso
urce
s are
susta
inab
ly m
anag
ed an
d th
e re
silie
nce
of p
rodu
ction
syste
ms i
s enh
ance
dIO
11.
1 W
ater
reso
urce
s ar
e m
anag
ed an
d us
ed
susta
inab
ly
- Far
mer
s tra
ined
on
rain
wat
er
harv
estin
g- I
mpr
oved
soil
moi
sture
m
anag
emen
t tec
hniq
ues
deve
lope
d- D
eep
wells
and
dam
s esta
blish
ed- C
atch
men
t are
a man
agem
ent
stren
gthe
ned
- Live
stock
wat
erin
g po
ints
esta
blish
edIO
11.
2 La
nd u
se p
lann
ing
and
zoni
ng u
pdat
ed an
d im
plem
enta
tion
capa
city
enha
nced
- Agr
icultu
ral a
nd p
rote
cted
area
s zo
ned
- Dist
rict N
RM co
mm
ittee
s fun
ction
al
IO 1
1.3
Agro
-fore
stry
area
s exp
ande
d an
d m
anag
emen
t cap
aciti
es
enha
nced
- Leg
islat
ive fr
amew
ork f
or ag
ro-fo
restr
y de
velo
ped
and
ince
ntive
mec
hani
sms
iden
tified
- Nat
iona
l tre
e co
ver d
ensit
y tar
gets
esta
blish
ed
- Far
mer
s tra
ined
on
clim
ate-
resil
ient
ag
ro-fo
restr
y pra
ctice
s - F
arm
er-m
anag
ed n
atur
al
gene
ratio
n tre
e pl
ante
d ar
eas
esta
blish
ed- T
ree
min
i-nur
serie
s esta
blish
ed
- Tre
es p
lant
ed o
n riv
er b
anks
and
agric
ultu
ral l
and
IO 1
1.4
Lake
and
river
s fis
herie
s res
ourc
es ar
e ef
ficie
ntly
and
susta
inab
ly m
anag
ed
- Leg
al an
d re
gula
tory
fram
ewor
k re
vised
- Fish
erie
s mas
ter p
lan
deve
lope
d
- Ann
ual c
ensu
s on
fishe
ries s
tock
s - H
IV/A
IDS
base
line
data
di
ssem
inat
ed an
d co
mm
unity
aw
aren
ess c
ampa
igns
cond
ucte
d
- Fish
erm
en, -w
omen
and
yout
h tra
ined
on
impr
oved
m
anag
emen
t and
tech
nolo
gies
- F
isher
ies t
echn
olog
ies d
evel
oped
- Fish
land
ing
sites
and
mar
ketin
g fa
ciliti
es e
stabl
ished

112
National Agricultural Investment Plan
IA 1
2: Ir
rigat
ion
Deve
lopm
ent
Outc
ome:
Use
of i
rriga
tion
susta
inab
ly in
crea
sed
IO 1
2.1
Area
und
er
func
tiona
l irri
gatio
n sy
stem
s inc
reas
ed
- Cap
acity
for p
lann
ing
and
impl
emen
tatio
n of
irrig
atio
n wo
rk
stren
gthe
ned
- Irri
gatio
n sc
hem
es re
habi
litat
ed/
esta
blish
ed
IO 1
2.2
Irrig
atio
n sc
hem
es
are
prop
erly
man
aged
and
mai
ntai
ned
acco
rdin
g to
th
eir e
cono
mic
pote
ntia
l
- Irri
gatio
n Co
des o
f Pra
ctice
(ICo
P)
for m
anag
emen
t dev
elop
ed an
d m
onito
red
- WUA
law
enac
ted
- Irri
gatio
n as
socia
tions
pe
rform
ance
asse
ssed
- WUA
s esta
blish
ed tr
aine
d an
nual
ly- E
xten
sion
serv
ices p
rovid
ed to
fa
rmer
s in
irrig
ated
area
s
- Mat
chin
g gr
ants
disb
urse
d fo
r irr
igat
ion
inve
stmen
t - I
rriga
tion
farm
ers l
inke
d to
m
arke
ts an
d fin
ance
IA 1
3: M
echa
nisa
tion
Outc
ome:
Impr
oved
acce
ss to
and
use
of m
echa
nisa
tion
serv
ices b
y far
mer
s
IO 1
3.1
Know
ledg
e an
d sk
ills o
f pro
vider
s and
use
rs
of m
echa
niza
tion
serv
ices
stren
gthe
ned
- Sta
ndar
ds fo
r saf
ety m
easu
res a
nd
safe
guar
ds d
evel
oped
- Hea
lth an
d sa
fety
trai
ning
s co
nduc
ted
for m
achi
nery
op
erat
ors
- Mac
hine
ry o
pera
tors
and
mec
hani
cs tr
aine
d- U
nder
take
mec
hani
zatio
n de
mos
IO 1
3.2
Avai
labi
lity a
nd
qual
ity o
f mec
hani
zatio
n eq
uipm
ent a
nd se
rvice
s en
hanc
ed
- Dra
ught
anim
al se
rvice
s im
prov
ed- M
ore
tracto
rs an
d CA
-com
plia
nt
rippe
rs av
aila
ble
thro
ugh
Gove
rnm
ent m
echa
niza
tion
sche
mes
- Inc
entiv
es p
rovid
ed to
incr
ease
im
porta
tion
of tr
acto
rs an
d CA
im
plem
ents
by p
rivat
e se
ctor
- Fea
sibili
ty st
udy o
n m
achi
nery
fu
nd co
nduc
ted

113
National Agricultural Investment Plan
IA 1
4: A
gricu
ltura
l Mar
kets
and
Tra
deOu
tcom
e: E
nhan
ced
Effic
ienc
y and
Inclu
siven
ess o
f Agr
icultu
ral M
arke
ts an
d Tra
de
IO 1
4.1
Avai
labi
lity
and
qual
ity o
f mar
ket
info
rmat
ion
enha
nced
- ICT
bas
ed m
arke
t inf
orm
atio
n sy
stem
ope
ratio
nal
- Far
mer
s and
oth
ers t
rain
ed
on an
alys
ing/
usin
g m
arke
t in
form
atio
n
IO 1
4.2
Gove
rnm
ent p
rice
polic
ies a
re e
viden
ce
base
d, tr
ansp
aren
t and
pr
edict
able
- ADM
ARC
refo
rmed
- P
ricin
g po
licy d
evel
oped
- G
oM st
aff a
nalyt
ical c
apac
ity
stren
gthe
ned
- Priv
ate
secto
r con
sulta
tion
mec
hani
sm
esta
blish
ed
IO 1
4.3
Effe
ctive
ness
, sco
pe
and
fairn
ess o
f con
tract
farm
ing
impr
oved
- FOs
and
agri-
busin
esse
s se
nsiti
sed
on n
ew co
ntra
ct fa
rmin
g str
ateg
y - C
apac
ity o
f FO’
s to
enga
ge in
co
ntra
ct fa
rmin
g en
hanc
ed- M
ore
farm
ers f
arm
und
er co
ntra
ct- C
ontra
ct fa
rmin
g un
it es
tabl
ished
un
der t
he C
FTC
IO 1
4.4
Scop
e an
d ef
ficie
ncy o
f com
mod
ity
exch
ange
s and
war
ehou
se
rece
ipt s
yste
ms e
nhan
ced
- War
ehou
se st
orag
e ca
pacit
y in
crea
sed
- Far
mer
s and
SM
Es tr
aine
d in
wa
reho
use
rece
ipt s
yste
ms a
nd
com
mod
ity e
xcha
nges
- W
areh
ouse
ope
rato
rs tr
aine
d - V
alue
of i
ncre
men
tal w
areh
ouse
re
ceip
t fina
nce
incr
ease
d
IO 1
4.5
Dom
estic
mar
ket
acce
ss im
prov
ed- R
ural
feed
er ro
ads s
pot i
mpr
oved
an
d re
habi
litat
ed
- Rur
al co
ld st
orag
e fa
ciliti
es
esta
blish
ed
- Rur
al m
arke
t fac
ilitie
s esta
blish
ed

114
National Agricultural Investment Plan
IO 1
4.6
Acce
ss to
regi
onal
an
d gl
obal
mar
kets
and
regi
onal
trad
e en
hanc
ed
- Gov
ernm
ent s
taff
train
ed o
n ag
ricul
tura
l tra
de is
sues
- Agr
icultu
re tr
ade-
rela
ted
polic
ies
upda
ted
- Non
-trad
e ba
rrier
dat
abas
e es
tabl
ished
- Tra
de b
ans a
nd n
on-tr
ade
barri
ers
redu
ced
- Ba
rcod
e in
stitu
tion
esta
blish
ed
- Acti
ve in
tern
atio
nal t
rade
pr
omot
ion
unde
rtake
n
IA 1
5: In
clusi
ve P
rivat
e In
vest
men
ts in
Agr
ibus
ines
s Ou
tcom
e: In
crea
sed
agro
-pro
cess
ing,
valu
e ad
ditio
n an
d in
vestm
ents
into
the
dom
estic
mar
kets
IO 1
5.1
Enab
ling
agrib
usin
ess e
nviro
nmen
t an
d pu
blic-
priva
te d
ialo
gue
stren
gthe
ned
- Hig
h-le
vel p
ublic
-priv
ate
coor
dina
tion
foru
m e
stabl
ished
(CAP
-F)
- Tax
/non
-tax i
ncen
tive
mec
hani
sms i
n pl
ace
- Reg
ulat
ory a
nd in
stitu
tiona
l fra
mew
orks
for c
otto
n an
d to
bacc
o su
bsec
tors
stre
ngth
ened
- Na
tiona
l Agr
icultu
ral F
air
and
Cent
re o
f Exc
elle
nce
esta
blish
ed
IO 1
5.2
Prin
ciple
s for
Re
spon
sible
Agr
icultu
ral
Inve
stmen
ts (P
RAI)
mai
nstre
amed
- Awa
rene
ss cr
eatio
n an
d ou
treac
h ac
tiviti
es co
nduc
ted
- Pro
cedu
res a
nd g
uide
lines
dev
elop
ed,
trans
late
d in
to lo
cal l
angu
ages
and
adop
ted
IO 1
5.3
Tech
nica
l and
Bu
sines
s Ski
lls o
f COO
PS
and
SMEs
in ag
ribus
ines
s en
hanc
ed
- Coo
ps/S
MEs
trai
ned
in va
rious
bu
sines
s asp
ects
rela
ted
to va
lue
addi
tion/
post-
harv
est/a
gro-
proc
essin
g
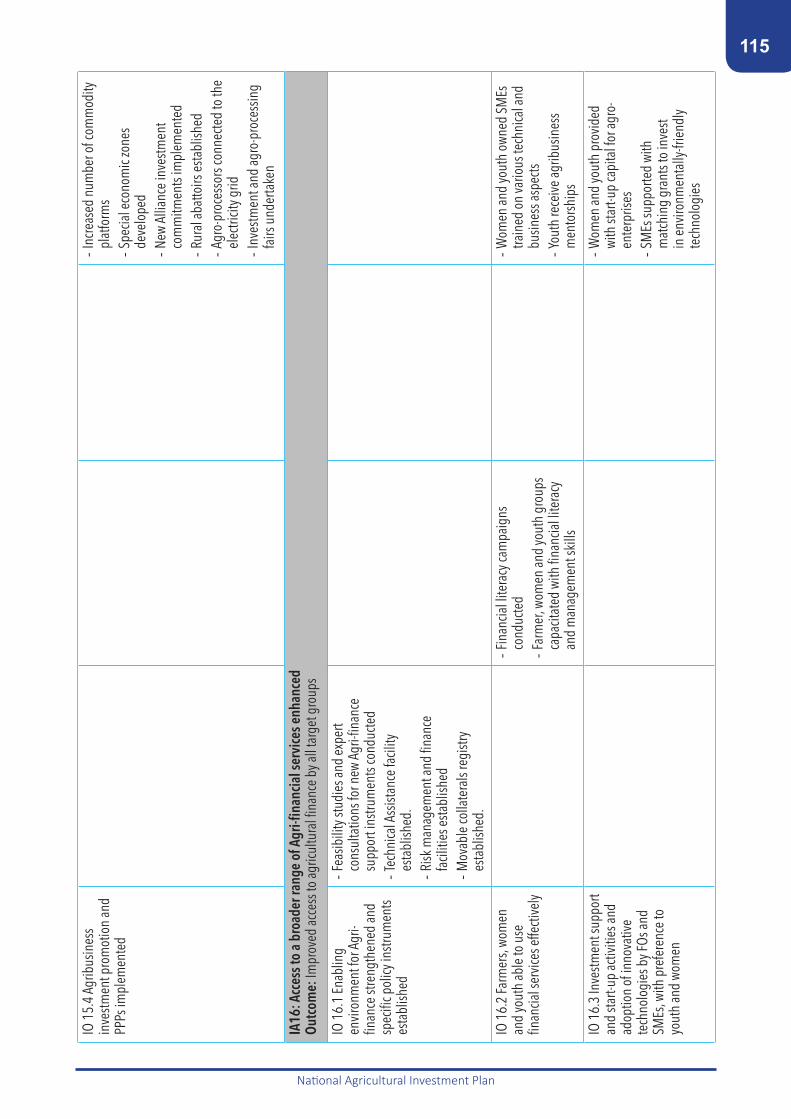
115
National Agricultural Investment Plan
IO 1
5.4
Agrib
usin
ess
inve
stmen
t pro
mot
ion
and
PPPs
impl
emen
ted
- Inc
reas
ed n
umbe
r of c
omm
odity
pl
atfo
rms
- Spe
cial e
cono
mic
zone
s de
velo
ped
- New
Alli
ance
inve
stmen
t co
mm
itmen
ts im
plem
ente
d- R
ural
abat
toirs
esta
blish
ed- A
gro-
proc
esso
rs co
nnec
ted
to th
e el
ectri
city g
rid- I
nves
tmen
t and
agro
-pro
cess
ing
fairs
und
erta
ken
IA16
: Acc
ess t
o a
broa
der r
ange
of A
gri-fi
nanc
ial s
ervi
ces e
nhan
ced
Outc
ome:
Impr
oved
acce
ss to
agric
ultu
ral fi
nanc
e by
all t
arge
t gro
ups
IO 1
6.1
Enab
ling
envir
onm
ent f
or A
gri-
finan
ce st
reng
then
ed an
d sp
ecifi
c pol
icy in
strum
ents
esta
blish
ed
- Fea
sibili
ty st
udie
s and
exp
ert
cons
ulta
tions
for n
ew A
gri-fi
nanc
e su
ppor
t ins
trum
ents
cond
ucte
d- T
echn
ical A
ssist
ance
facil
ity
esta
blish
ed.
- Risk
man
agem
ent a
nd fi
nanc
e fa
ciliti
es e
stabl
ished
- Mov
able
colla
tera
ls re
gistr
y es
tabl
ished
.
IO 1
6.2
Farm
ers,
wom
en
and
yout
h ab
le to
use
fin
ancia
l ser
vices
effe
ctive
ly
- Fin
ancia
l lite
racy
cam
paig
ns
cond
ucte
d- F
arm
er, w
omen
and
yout
h gr
oups
ca
pacit
ated
with
fina
ncia
l lite
racy
an
d m
anag
emen
t ski
lls
- Wom
en an
d yo
uth
owne
d SM
Es
train
ed o
n va
rious
tech
nica
l and
bu
sines
s asp
ects
- You
th re
ceive
agrib
usin
ess
men
tors
hips
IO 1
6.3
Inve
stmen
t sup
port
and
start-
up ac
tiviti
es an
d ad
optio
n of
inno
vativ
e te
chno
logi
es b
y FOs
and
SMEs
, with
pre
fere
nce
to
yout
h an
d wo
men
- Wom
en an
d yo
uth
prov
ided
wi
th st
art-u
p ca
pita
l for
agro
-en
terp
rises
- SM
Es su
ppor
ted
with
m
atch
ing
gran
ts to
inve
st in
env
ironm
enta
lly-fr
iend
ly te
chno
logi
es

116
National Agricultural Investment Plan
Anne
x 2:
Key
Per
form
ance
Indi
cato
rsIm
pact
Indi
cato
rsUn
itBa
selin
e(2
015/
16)/
or re
fere
nce
perio
d
5 ye
ar ta
rget
(2
022/
23)
Mea
ns o
f ver
ifica
tion
Com
men
ts
Cons
isten
t agr
icultu
ral s
ecto
r GDP
gr
owth
Pe
rcen
t p.a
.4.
3%6%
p.a
.Na
tiona
l acc
ount
s Ba
selin
e is
aver
age
achi
eved
dur
ing
ASW
Ap
impl
emen
tatio
n. M
alab
o ta
rget
Grow
ing
shar
e of
agric
ultu
ral G
DP
from
com
mod
ities
oth
er th
an
toba
cco
and
mai
ze
Perc
ent
tbd28
tbd
Natio
nal a
ccou
nts
Mea
sure
s dive
rsifi
catio
n as
pre
requ
isite
for
incr
ease
d re
silie
nce
and
broa
d-ba
sed
grow
th
Incr
ease
in sh
are
of p
opul
atio
n ab
ove
the
natio
nal p
over
ty li
nePe
rcen
t49
.2%
(201
0/11
)65
%In
tegr
ated
Hou
seho
ld S
urve
ys
(NSO
) Ag
ricul
ture
to co
ntrib
ute
50%
to S
DG ta
rget
(2
030)
. NAI
P to
cont
ribut
e 60
% to
Mal
abo
targ
et b
y 202
2Ru
ral p
over
ty g
ap re
duce
d29Pe
rcen
t po
ints
19.2
%15
%In
tegr
ated
Hou
seho
ld S
urve
ys
CAAD
P RF
201
5-25
indi
cato
r tow
ards
Mal
abo
targ
et
Incr
ease
in sh
are
of h
ouse
hold
s re
silie
nt to
clim
ate
and
weat
her-
rela
ted
shoc
ksRI
MA
scor
eTb
d25
%Re
silie
nt In
dex M
easu
rem
ent a
nd
Anal
ysis30
; spe
cialis
ed su
rvey
s CA
ADP
RF 2
015-
25 in
dica
tor t
owar
ds M
alab
o ta
rget
(30%
)
Redu
ction
of M
alaw
i’s sc
ope
in
IFPR
Is Gl
obal
Hun
ger I
ndex
Scor
e27
.2<
20ww
w.gl
obal
hung
erin
dex.o
rgCA
ADP
RF 2
015-
25 in
dica
tor t
owar
ds M
alab
o ta
rget
Redu
ction
of s
tunt
ing
amon
g 0-
5 ye
ar o
ld ch
ildre
n Pe
rcen
t37
%(2
015/
16)
25%
Dem
ogra
phic
Heal
th S
urve
y (DH
S)
(201
5/16
)CA
ADP
RF 2
015-
25 in
dica
tor t
owar
ds M
alab
o ta
rget
Redu
ction
of u
nder
weig
ht am
ong
0-5
year
old
child
ren
Perc
ent
12%
5%M
alab
o ta
rget
Redu
ction
in f
ood
inse
curit
yFI
ES sc
ore
tbd
10%
Food
Inse
cure
Exp
erie
nce
Scal
e (F
IES)
31FA
OSTA
T Ta
rget
is b
ack t
o 20
10/1
2 le
vel. C
AADP
RF
2015
-25
indi
cato
r tow
ards
Mal
abo
targ
et
28A
gric
ultu
ral G
DP
min
us p
rodu
ctio
n va
lue
of m
aize
and
toba
cco.
29Po
vert
y ga
p is
the
aver
age
cons
umpt
ion
shor
tfall
of th
e po
pula
tion
rela
tive
to th
e po
vert
y lin
e.30
http
://w
ww.
fao.
org/
3/a-
i566
5e.p
df31
http
://w
ww.
fao.
org/
in-a
ctio
n/vo
ices
-of-
the-
hung
ry/fi
es/e
n/

117
National Agricultural Investment Plan
Prog
ram
A: P
olici
es, I
nstit
utio
ns a
nd C
oord
inat
ion
for R
esul
ts
Outc
omes
Indi
cato
rsUn
itBa
selin
eTa
rget
Mea
ns o
f Ver
ifica
tion/
Com
men
ts
1. S
treng
then
ed ca
pacit
y for
ev
iden
ce-b
ased
pla
nnin
g,
impl
emen
tatio
n an
d re
view
of
polic
ies a
nd P
rogr
ams (
also
a CA
ADP
outco
me)
A1: M
oAIW
D pr
ovid
es it
s pol
icy, o
vers
ight
, co
ordi
natio
n an
d se
rvice
func
tions
ef
ficie
ntly
Qual
itativ
eIm
prov
emen
tSt
akeh
olde
r sur
vey,
Secto
r-lev
el M
&E
syste
m
A2: T
echn
ical w
orki
ng g
roup
s, hi
gh-le
vel
publ
ic-pr
ivate
coor
dina
tion
foru
m an
d va
lue
chai
n pl
atfo
rms i
mpl
emen
t the
ir wo
rk p
lans
effe
ctive
ly
Qual
itativ
en/
aIm
prov
emen
tM
eetin
g m
inut
es, s
take
hold
er fe
edba
ck
and
JSR
A3: I
nstit
utio
nalis
ed M
&E m
echa
nism
s for
th
e ag
ricul
tura
l sec
tor
Syste
ms
01
Syste
m ab
le to
mon
itor d
ata o
n ex
pend
iture
s, ou
tput
s and
out
com
es b
i-an
nual
ly, as
per
NAI
P str
uctu
re (C
AADP
in
dic.)
2. Im
prov
ed co
ordi
natio
n of
pu
blic
and
priva
te st
akeh
olde
rs in
ag
ricul
ture
A4: N
ew A
llian
ce an
d CA
P-F P
olicy
co
mm
itmen
ts im
plem
ente
d by
due
dat
eNu
mbe
r15
All i
mpl
emen
ted.
Revis
ed co
mm
itmen
ts un
der C
AP-F
to
be ad
ded.
3. P
ublic
agric
ultu
ral s
ervic
e de
liver
y cap
acity
enh
ance
d ac
cord
ing
to it
s man
date
A5: E
ffecti
ve co
ordi
natio
n of
serv
ice
prov
ider
s at a
ll le
vels
Qual
itativ
eSt
akeh
olde
r fee
dbac
k and
JSR
A6: I
ncre
ased
ratio
of e
xten
sion
work
ers t
o fa
rmer
sRa
tio1:
3,00
01:
1,00
0Ag
greg
atio
n of
dist
rict l
evel
info
rmat
ion
4.En
ablin
g en
viron
men
t for
ag
ribus
ines
s inv
estm
ents
impr
oved
A7: M
alaw
i’s ra
nkin
g in
Eas
e of
Doi
ng
Busin
ess I
ndex
impr
oved
Ra
nk o
n in
dex
110
(201
7)10
0An
nual
Eas
e of
Doi
ng B
usin
ess R
epor
t (W
orld
Ban
k)
A8: F
aste
r lice
nsin
g of
inpu
ts th
at h
ave
alre
ady b
een
accr
edite
d in
oth
er S
ADC
coun
tries
Days
913
(ferti
liser
)57
9 (se
eds)
90 d
ays
90 d
ays
EBA
coun
try re
ports
A9: M
alaw
i’s ra
nkin
g in
the
Enab
ling
the
Busin
ess o
f Agr
icultu
re (E
BA) I
ndex
Ra
nk o
n in
dex
33/6
2 co
untri
esRe
lativ
e po
sit.
impr
oved
by 1
5%EB
A re
ports
A10:
Incr
ease
d pr
ivate
inve
stmen
t in
agric
ultu
reUS
D m
illio
ntb
d25
% in
crea
seBR
indi
cato
rs

118
National Agricultural Investment Plan
Prog
ram
B: R
esili
ent L
ivel
ihoo
ds a
nd A
gricu
ltura
l Sys
tem
s In
dica
tors
Unit
Base
line
Targ
etM
eans
of V
erifi
catio
n/Co
mm
ents
1. In
crea
se in
die
tary
dive
rsity
and
redu
ction
in fo
od in
secu
rity
B1: I
ncre
ase
in th
e nu
mbe
r of h
ouse
hold
s, un
der 5
-year
old
child
ren/
wom
en m
eetin
g 6-
food
gro
up m
inim
um d
ieta
ry d
ivers
ity
requ
irem
ent32
Perc
ent
tbd
25%
incr
ease
Spec
ialis
ed M
&E st
udy b
ased
on
FAO’
s gu
idel
ines
for m
easu
ring
diet
ary
dive
rsity
B2: R
educ
tion
in n
umbe
r of p
eopl
e re
quiri
ng fo
od as
sista
nce
per y
ear
Perc
ent
tbd
5%M
VAC
repo
rts
2. Im
prov
ed fo
od sa
fety
and
sani
tatio
n en
viron
men
tB3
: Afla
toxin
leve
ls in
gro
undn
uts a
nd
mai
ze re
duce
dPa
rts p
er b
illio
n (p
pb)
70 p
pb35
ppb
10 p
pb10
ppb
Mal
awi P
rogr
am o
n Afl
atox
in C
ontro
l Re
ports
3. Im
prov
ed n
atur
al re
sour
ce
man
agem
ent f
or su
stain
able
ag
ricul
ture
and
livel
ihoo
ds
B4: S
ize o
f sus
tain
able
fish
erie
s and
aq
uacu
lture
(with
in b
iolo
gica
lly
susta
inab
le le
vels)
in %
of G
DP
Perc
ent
N/A
N/A
SDG
indi
cato
r
B5: A
nnua
l inc
reas
e in
area
und
er
susta
inab
le la
nd an
d wa
ter m
anag
emen
tha
10,5
0015
,000
Depa
rtmen
t of L
and
Reso
urce
s Ann
ual
repo
rt (C
AADP
indi
cato
r)
B6: W
oody
bio
-mas
s inc
reas
edtb
dtb
d15
% in
crea
seSa
telli
te p
hoto
grap
hy, e
.g.
www.
glob
alfo
restw
atch
.org
4. In
ciden
ce an
d im
pact
of p
est
and
dise
ases
in cr
op, li
vesto
ck an
d fis
herie
s pro
ducti
on re
duce
d
B7: C
rop
area
seve
rely
affe
cted
by p
est
outb
reak
s per
seas
onha
2,80
0-5,
300
ha p
er ye
ar
(arm
ywor
m)
0 h
(for a
ll ou
tbre
aks)
Depa
rtmen
t of C
rop
Deve
lopm
ent
annu
al re
ports
B8: L
ivesto
ck m
orta
lity r
ates
redu
ced
(chick
en, p
igs a
nd ca
ttle)
Perc
ent
30%
28%
10%
10%
8% 3%
Depa
rtmen
t of A
nim
al H
ealth
and
Lives
tock
Dev
elop
men
t
32 Th
is in
dica
tor i
ss c
urre
ntly
not
mea
sure
d at
nat
iona
l lev
el in
Mal
awi,
and
the
shar
e fr
om fo
od g
roup
s in
the
diet
may
be
used
as a
pro
xy.

119
National Agricultural Investment Plan
Prog
ram
C: P
rodu
ctio
n an
d Pr
oduc
tivity
for G
row
thOu
tcom
esIn
dica
tors
Unit
Base
line
Targ
etM
eans
of V
erifi
catio
n/Co
mm
ents
1. In
crea
sed
prod
uctiv
ity an
d pr
oduc
tion
of p
riorit
y val
ue ch
ains
C1a:
Aver
age
pulse
s yie
ld
MT/h
a0.
921.
538
% in
crea
seGr
ound
nut p
rodu
ction
MT/y
ear
350,
000
700,
000
50%
incr
ease
Oilse
eds p
rodu
ctivit
yM
T/ha
2.8
5.0
50%
incr
ease
Rice
pro
ducti
on
MT/y
ear
110,
000
220,
000
100%
incr
ease
C1b:
Pro
ducti
on an
d pr
oduc
tivity
incr
ease
fo
r live
stock
and
fishe
ries:
Aqua
cultu
re ca
tchM
T/yea
r4,
984
10,0
0010
0% in
crea
seCh
icken
stoc
k M
illio
ns97
110
100%
incr
ease
Goat
s sto
ckM
illio
ns7
1050
%Pi
gs st
ock
Mill
ions
45.
550
%Ca
ttle
stock
Mill
ions
1.5
2.0
50%
Dairy
cattl
eTh
ousa
nd80
106
50%
Lives
tock
uni
ts ow
ned
per h
ouse
hold
Aver
age
1.35
1.80
50%
2. In
crea
sed
acce
ss to
and
cont
rol
over
pro
ducti
ve as
sets
C2: N
umbe
r of f
arm
ers w
ith la
nd ri
ghts
reco
rded
und
er th
e ne
w la
nd R
egist
ries
(by g
ende
r and
age)
Farm
ers
0tb
dRe
cord
s of d
istric
t lan
d re
gistr
ies,
MoL
HUD
3. Ti
mel
y acc
ess t
o a b
road
er ra
nge
of q
ualit
y inp
uts e
nhan
ced
C3: N
umbe
r of f
arm
ers u
sing
impr
oved
se
eds
Farm
ers
1.5
mill
ion
3.2
mill
ion
APES
– 3rd
roun
d.
Bi-a
nnua
l pro
ducti
on/ p
rodu
ctivit
y sur
veys
(M
alab
o in
dica
tor)
C4: I
ncre
ased
ferti
liser
usa
ge p
er h
a of
arab
le la
ndkg
/ha
43.2
(201
3)60
Wor
ld D
evel
opm
ent I
ndica
tors
( M
alab
o BR
indi
cato
r
4. In
crea
sed
acce
ss to
susta
inab
le
mec
hani
satio
n se
rvice
s
C5: I
ncre
ased
shar
e of
land
pre
pare
d wi
th
mec
hani
sed
cons
erva
tion
agric
ultu
re
impl
emen
ts
haTb
dtb
dDe
partm
ent o
f Lan
d Re
sour
ce
5. In
crea
sed
adop
tion
of G
AP an
d ot
her t
echn
olog
ies
C6: N
umbe
r of f
arm
ers u
sing
Inte
grat
ed
Pest
Man
agem
ent
farm
ers
Tbd
tbd
Prod
uctio
n su
rvey
s
6. S
usta
inab
le in
crea
se o
f dive
rsifi
ed
crop
pro
ducti
on an
d pr
oduc
tivity
un
der i
rriga
tion
C7: I
ncre
ased
crop
ping
inte
nsity
on
exist
ing
and
new
irrig
atio
n sc
hem
esPe
rcen
tTb
d15
0%De
partm
ent o
f Irri
gatio
n

120
National Agricultural Investment Plan
Prog
ram
D: M
arke
ts, V
alue
Add
ition
, Tra
de a
nd Fi
nanc
e fo
r Tra
nsfo
rmat
ion
Outc
ome
Indi
cato
rsUn
itBa
selin
eTa
rget
Mea
ns o
f Ver
ifica
tion/
Com
men
ts
1. G
reat
er e
fficie
ncy a
nd
trans
pare
ncy o
f agr
icultu
ral m
arke
ts an
d be
tter m
arke
t acc
ess
D1: I
ncre
ased
shar
e of
smal
lhol
der
farm
ers p
rodu
cing
for t
he m
arke
tPe
rcen
t20
%30
%An
nual
/bi-a
nnua
l out
com
e pr
oduc
tion
& pr
oduc
tivity
surv
ey
D2: D
omes
tic Fo
od P
rice V
aria
bilit
y Ind
extb
d10
%M
alab
o in
dica
tor (
targ
et 7
.5%
by 2
025)
Incr
ease
farm
er sh
ares
in te
rmin
al m
arke
t pr
ice fo
r sel
ect c
omm
oditi
esPe
rcen
tM
AFAP
re
ports
33
MAF
AP re
ports
2. In
crea
sed
dive
rsifi
catio
n of
ag
ricul
tura
l exp
orts,
with
spec
ial
emph
asis
on in
tra-A
frica
n tra
de
D3: I
ncre
ased
shar
e of
agric
ultu
ral e
xpor
ts ot
her t
han
toba
cco
Perc
ent
34.2
%34
(201
6)60
%M
oITT
, ITC
(http
://ww
w.tra
dem
ap.o
rg)
D4: I
ncre
ased
shar
e of
hig
h-va
lue
and
proc
esse
d pr
oduc
ts in
agric
ultu
ral e
xpor
tsUn
it va
lues
tbd
20%
incr
ease
MoI
TT, I
TC (h
ttp://
www.
trade
map
.org
)
D5: I
ncre
ased
valu
e of
regi
onal
ag
ricul
tura
l tra
de
USD
tbd
20%
incr
ease
MoI
TT, C
OMES
A SA
DC
3. In
crea
sed
num
ber o
f far
mer
s/FOs
lin
ked
to m
arke
ts an
d fin
ance
D6: I
ncre
ased
num
ber o
f far
mer
s und
er
cont
ract
farm
ing
Farm
ers
tbd
20%
incr
ease
MoI
TT; f
arm
er o
rgan
izatio
n ap
exes
, NA
and
CAP-
F fra
mew
orks
, CFT
C
D7:P
erce
ntag
e of
smal
lhol
der f
arm
ers
acce
ssin
g fin
ancia
l ser
vices
Perc
ent
5%10
%RB
M st
atist
ics an
d da
ta fr
om b
anks
, MFI
s an
d SA
CCOs
4. Vo
lum
e an
d in
clusiv
enes
s of
priva
te in
vestm
ent a
grib
usin
ess
enha
nced
D8: I
ncre
ased
priv
atel
y man
aged
stor
age
capa
city
MT
incr
ease
dtb
d24
0,00
0 M
TM
oITT
, WHR
and
CE re
gula
tors
, PS
surv
eys.
5. P
ost-h
arve
st lo
sses
redu
ced
D1
0: R
educ
tion
of p
ost-h
arve
st lo
sses
in
prio
rity v
alue
chai
nsPe
rcen
ttb
d50
% re
ducti
onSp
ecia
lised
surv
eys (
Mal
abo,
CAA
DP, S
DG
indi
cato
r)
33Ba
selin
e re
port
s are
avai
labl
e fo
r gro
undn
uts,
mai
ze, s
eed
cotto
n, su
gar c
ane,
tea
and
toba
cco
(201
4). T
o be
upd
ated
dur
ing
mid
-ter
m a
nd to
war
ds th
e en
d of
the
NA
IP.
34M
alaw
i’s to
tal a
gric
ultu
ral e
xpor
ts in
201
6 am
ount
ed to
USD
844
.9 m
illio
n (c
alcu
late
d as
all
expo
rtsm
inus
the
follo
win
g ite
m cl
assifi
catio
ns: 3
9, 8
4, 4
0, 8
5, 8
7, 7
3, 6
1,
64, 7
4, 9
9, a
nd 3
0. T
obac
co e
xpor
ts U
SD 5
55.6
mill
ion
(HS
24, t
obac
co, a
ll ty
pes a
nd p
rodu
cts)
. Bas
ed o
n IT
C T
rade
Map
s.

121
National Agricultural Investment Plan
Anne
x 3:
NAI
P Bu
dget
by
Prog
ram
All v
alue
s are
in c
onst
ant 2
017
US
dolla
rs
Prog
ram
AIA
IO
Outp
uts
Unit
Targ
et
Cost
Y1
Cost
Y2
Cost
Y3
Cost
Y4
Cost
Y5
Tota
l cos
t01
Impr
oved
mul
ti-se
ctor
al co
ordi
natio
n, p
artn
ersh
ips a
nd m
utua
l acc
ount
abili
ty20
4 EP
A le
vel s
tructu
res m
eet b
iann
ually
mee
tings
4,08
040
8,00
040
8,00
040
8,00
040
8,00
040
8,00
02,
040,
000
28 D
istric
t coo
rdin
atio
n str
uctu
res m
eet 2
-4 /y
ear
mee
tings
1,66
034
2,50
034
7,00
034
2,00
034
2,00
034
2,00
01,
715,
500
628
villa
ge le
vel s
tructu
res m
eet 2
/yea
rm
eetin
gs7,
906
938,
600
125,
600
938,
600
125,
600
125,
600
2,25
4,00
0AD
D le
vel c
oord
inat
ion
func
tiona
lm
eetin
gs40
27,9
3627
,936
27,9
3627
,936
27,9
3613
9,68
2AS
WG
mee
ts 4
times
per
year
mee
tings
2044
,000
44,0
0044
,000
44,0
0044
,000
220,
000
Bian
nual
coor
dina
tion
mee
tings
for F
O’s,
CSOs
, pr
ivate
secto
r and
sub-
secto
rsm
eetin
gs10
2,00
02,
000
2,00
02,
000
2,00
010
,000
Coor
dina
tion
troik
a fun
ction
allu
mp
sum
114
,000
14,0
0014
,000
14,0
0014
,000
70,0
00EM
C fu
nctio
nal
mee
tings
1012
,000
12,0
002,
000
2,00
02,
000
30,0
00In
tra-m
inist
eria
l coo
rdin
atio
n str
uctu
res i
mp.
TA3
10,0
0010
,000
5,00
00
025
,000
MoA
IWD
com
stra
tegy
dev
elop
edstr
ateg
y1
50,0
000
00
050
,000
NAIP
secr
etar
iat f
uncti
onal
lum
p su
m5
110,
000
80,0
0080
,000
80,0
0080
,000
430,
000
Secto
r tar
getin
g in
har
mon
ised
lum
p su
m5
11,0
0011
,000
11,0
0010
,000
10,0
0053
,000
STM
func
tiona
l m
eetin
gs20
54,0
004,
000
4,00
04,
000
4,00
070
,000
TWGs
mee
t as p
er TO
R +
hig
h at
tend
ance
mee
tings
270
313,
000
313,
000
313,
000
313,
000
313,
000
1,56
5,00
0In
crea
sed
capa
city
to g
ener
ate,
ana
lyse
and
use
dat
a, in
form
atio
n, k
now
ledg
e an
d in
nova
tions
Outco
me
leve
l sur
veys
bi-a
nnua
llysu
rvey
610
0,00
050
0,00
00
500,
000
100,
000
1,20
0,00
0Pr
oduc
tion-
leve
l sur
veys
annu
ally
surv
ey15
735,
000
735,
000
735,
000
735,
000
735,
000
3,67
5,00
0Sp
ecifi
c sur
veys
und
erta
ken
as re
quire
dlu
mp
sum
518
0,00
040
,000
00
100,
000
320,
000
M&E
syst
ems a
nd p
erfo
rman
ce m
anag
emen
t in
agric
ultu
re fu
nctio
ning
and
up
to d
ate
Natio
nal l
evel
M&E
syste
ms i
mpr
oved
lu
mp
sum
172
0,00
048
0,00
035
0,00
040
0,00
035
0,00
02,
300,
000
Perfo
rman
ce A
sses
smen
t Fra
mew
ork d
evel
oped
for
the
agric
ultu
ral s
ecto
rlu
mp
sum
140
,000
40,0
000
00
80,0
00
Secto
r-wid
e HQ
/ dec
entra
lised
MIS
lum
p su
m1
1,04
0,00
01,
040,
000
790,
000
790,
000
790,
000
4,45
0,00
0M
oAIW
D op
erat
iona
l and
recu
rren
t cos
ts co
vere
dVe
hicle
flee
t con
tinuo
usly
mai
ntai
ned
vehi
cles
450
100,
000
200,
000
200,
000
200,
000
200,
000
900,
000

122
National Agricultural Investment Plan
IA
IOOu
tput
sUn
it Ta
rget
Co
st Y
1Co
st Y
2Co
st Y
3Co
st Y
4Co
st Y
5To
tal c
ost
MoA
IWD
oper
atio
nal,
recu
rren
t cos
tsHQ
-ADD
-Dist
rict m
onito
ring
of fi
eld
lum
p su
m5
6,38
5,55
56,
385,
555
6,38
5,55
56,
385,
555
6,38
5,55
531
,927
,777
Incr
easin
g sta
ffing
leve
ls m
aint
aine
d/pa
idlu
mp
sum
516
,000
,000
19,2
00,0
0020
,800
,000
22,4
00,0
0024
,000
,000
102,
400,
000
MoA
IWD
func
tion
(EPA
/Dist
rict/A
DD/H
Q)lu
mp
sum
54,
120,
000
4,12
0,00
04,
120,
000
4,12
0,00
04,
120,
000
20,6
00,0
0002
Lega
l fra
mew
ork
and
inst
itutio
nal s
uppo
rt fo
r FOs
stre
ngth
ened
Agric
ultu
ral C
oope
rativ
e In
stitu
te e
stabl
ished
lum
p su
m1
050
0,00
025
0,00
025
0,00
025
0,00
01,
250,
000
Coop
erat
ive A
ct re
vised
act
117
5,00
00
00
017
5,00
0Fa
rmer
s Org
aniza
tions
Dev
elop
Stra
tegy
ac
t1
050
,000
00
050
,000
FO d
atab
ase
esta
blish
ed an
d up
date
dlu
mp
sum
512
0,41
511
7,91
511
7,91
511
7,91
511
7,91
559
2,07
7Ge
nder
capa
city g
aps a
re id
entifi
edre
ports
50
150,
000
100,
000
00
250,
000
TA to
5 FO
supp
ortin
g in
stitu
tions
TA10
500,
000
500,
000
00
01,
000,
000
03Ca
pacit
y of
pub
lic se
ctor
inst
itutio
ns to
pro
vide
agr
icultu
ral e
xten
sion
serv
ices s
treng
then
ed10
0 sta
ff re
ceive
shor
t-ter
m tr
aini
ngsta
ff10
020
0,00
020
0,00
020
0,00
020
0,00
020
0,00
01,
000,
000
150
stude
nts g
radu
ated
from
refu
rbish
ed M
alaw
i Co
llege
of F
isher
ies
staff
150
75,0
0014
0,00
014
0,00
014
0,00
012
0,00
061
5,00
0
20 st
aff u
pgra
ded
to P
hD le
vel
staff
2020
0,00
020
0,00
020
0,00
020
0,00
020
0,00
01,
000,
000
Field
Food
and
Nutri
tion
Offic
ers (
EPA)
recr
uite
dsta
ff20
454
0,00
019
4,40
00
00
734,
400
Field
Food
and
Nutri
tion
Offic
ers t
rain
edsta
ff20
411
3,98
011
3,98
011
3,98
011
3,98
011
3,98
056
9,90
122
5 sta
ff up
grad
ed to
BSC
leve
lsta
ff22
590
0,00
090
0,00
090
0,00
090
0,00
090
0,00
04,
500,
000
225
staff
upgr
aded
to M
SC le
vel
staff
225
1,35
0,00
01,
350,
000
1,35
0,00
01,
350,
000
1,35
0,00
06,
750,
000
28 d
istric
t lev
el M
&E o
ffice
rs re
crui
ted
staff
2816
,800
00
00
16,8
0030
0 ag
ri-bu
sines
s offi
cers
recr
uite
dsta
ff30
054
0,00
054
0,00
00
00
1,08
0,00
0Ex
tens
ion
staff
train
ed (v
ario
us te
chni
cal)
staff
3,00
01,
324,
382
1,30
8,87
11,
276,
922
1,26
7,92
21,
272,
122
6,45
0,21
861
rese
arch
ers r
ecru
ited
staff
6155
8,00
036
0,00
090
,000
90,0
000
1,09
8,00
0HR
man
agem
ent i
n M
oAIW
D m
oder
nise
dlu
mp
sum
110
,500
10,5
0010
,500
500
1,00
033
,000
MoA
IWD
re-st
ructu
red
lum
p su
m1
3,15
0,00
00
30,0
0030
,000
03,
210,
000
HIV/
AIDS
nut
ritio
n su
pple
men
ts (S
taff)
lum
p su
m1
11,1
7511
,175
11,1
7511
,175
11,1
7555
,873
Train
ing
need
s ass
essm
ent u
nder
take
nlu
mp
sum
115
,000
00
00
15,0
00Pu
blic
exte
nsio
n w
orke
rs a
t dec
entra
lised
leve
ls e
quip
ped
and
hous
ed to
do
thei
r job
10 7
-ton
lorri
es av
aila
ble
lorri
es10
00
500,
000
00
500,
000
100
vehi
cles p
rocu
red
for fi
eld
oper
atio
nsve
hicle
s10
06,
500,
000
00
00
6,50
0,00
0

123
National Agricultural Investment Plan
IA
IOOu
tput
sUn
it Ta
rget
Co
st Y
1Co
st Y
2Co
st Y
3Co
st Y
4Co
st Y
5To
tal c
ost
13 b
orde
r pos
t offi
ce/h
ouse
s mai
ntai
ned
Site
s13
530,
498
530,
498
795,
747
795,
747
795,
747
3,44
8,23
720
4 EP
As m
aint
aine
d wi
th o
ffice
, pow
er an
d ho
usin
g fa
ciliti
esEP
As20
45,
200,
000
5,00
0,00
05,
000,
000
5,00
0,00
05,
000,
000
25,2
00,0
00
22 A
gricu
lture
Trai
ning
Cen
tres r
ehab
ilita
ted
cent
res
2225
0,00
025
0,00
025
0,00
025
0,00
010
0,00
01,
100,
000
28 d
istric
t offi
ces m
aint
aine
dDi
strict
s28
75,0
0075
,000
75,0
0090
,000
105,
000
420,
000
3500
mot
orbi
kes p
rocu
red
for f
ront
line
staff
mot
orbi
kes
3,50
03,
000,
000
4,50
0,00
03,
000,
000
00
10,5
00,0
00Ho
usin
g at
rese
arch
stat
ions
impr
oved
St
atio
ns8
100,
000
100,
000
100,
000
100,
000
040
0,00
0IC
T pac
kage
s ava
ilabl
e at
28
distr
icts,
8 re
sear
ch
statio
ns an
d 14
nat
iona
l lev
el o
ffice
sIC
T pac
kage
s50
350,
000
350,
000
350,
000
350,
000
350,
000
1,75
0,00
0
04Im
prov
ed im
plem
enta
tion,
coor
dina
tion
and
mon
itorin
g of
nut
ritio
n re
late
d ac
tiviti
es in
the
agric
ultu
ral s
ecto
r28
dist
rict l
evel
Dist
rict N
utrit
ion
Coor
dina
ting
Com
mitt
ees o
pera
tiona
lm
eetin
gs14
056
,000
56,0
0056
,000
56,0
0056
,000
280,
000
Nutri
tion
polic
y enh
ance
dpo
licy
150
,000
00
00
50,0
00Re
gion
al n
utrit
ion
data
colle
cted
annu
ally
surv
eys
2039
,111
39,1
1139
,111
39,1
1139
,111
195,
554
Sem
i-ann
ual n
utrit
ion
foru
ms u
nder
take
nm
eetin
gs10
10,0
0010
,000
10,0
0010
,000
10,0
0050
,000
05Ad
equa
te fo
od sa
fety
legi
slat
ion
is in
pla
cePr
oduc
t-spe
cific q
ualit
y sta
ndar
ds d
evel
oped
lum
p su
m1
184,
920
109,
920
109,
920
34,9
2034
,920
474,
602
Appr
opria
te a
nd a
dequ
ate
food
safe
ty le
gisl
atio
n is
in p
lace
Food
Saf
ety a
nd Q
ualit
y Bill
and
Act d
evel
oped
agen
cy1
00
150,
000
00
150,
000
Food
safe
ty an
d qu
ality
cont
rol a
genc
y esta
blish
edag
ency
115
0,00
00
015
0,00
00
300,
000
prod
uct-s
pecifi
c qua
lity s
tand
ards
dev
elop
edlu
mp
sum
10
75,0
000
75,0
0075
,000
225,
000
Know
ledg
e of
food
safe
ty is
sues
enh
ance
d al
ong
the
valu
e ch
ain
45 TW
G m
embe
rs an
d Go
vern
men
t offi
ces t
rain
ed
on fo
od sa
fety
issu
estra
inin
gs45
143,
173
143,
173
143,
173
143,
173
143,
173
715,
866
Mul
ti-sta
keho
lder
pla
tform
s mee
t reg
ular
mee
tings
3540
,000
40,0
0040
,000
40,0
0040
,000
200,
000
Regu
lar d
ata u
pdat
ing
on afl
atox
inlu
mp
sum
513
4,76
113
4,76
113
4,76
113
4,76
113
4,76
167
3,80
6Su
rvey
s on
food
safe
ty u
nder
take
nsu
rvey
6156
0,00
00
00
560,
000
1,12
0,00
0Qu
ality
cont
rol a
ctiv
ities
und
erta
ken
2 la
bora
torie
s acc
redi
ted
inte
rnat
iona
llyla
bs2
020
0,00
00
200,
000
040
0,00
03
labo
rato
ries a
ccre
dite
d in
tern
atio
nally
labs
20
00
150,
000
015
0,00
04
labo
rato
ries a
ccre
dite
d in
tern
atio
nally
labs
211
,733
11,7
3311
,733
11,7
3311
,733
58,6
66Qu
ality
cont
rol s
yste
m d
evel
oped
syste
m1
00
027
,000
100,
000
127,
000

124
National Agricultural Investment Plan
IA
IOOu
tput
sUn
it Ta
rget
Co
st Y
1Co
st Y
2Co
st Y
3Co
st Y
4Co
st Y
5To
tal c
ost
06Im
plem
enta
tion
of th
e La
nd P
olicy
supp
orte
d28
Dist
rict l
and
regi
strie
s esta
blish
edsy
stem
s28
375,
000
3,42
0,00
03,
420,
000
3,42
0,00
03,
420,
000
14,0
55,0
00La
nd P
olicy
insti
tutio
nal a
spec
ts im
plem
ente
dlu
mp
sum
525
8,00
021
8,00
020
8,00
011
8,00
058
,000
860,
000
Parti
cipat
ion
of w
omen
and
you
th in
agr
icultu
ral v
alue
chai
ns a
nd in
stitu
tions
incr
ease
dGo
v’t st
aff t
rain
ed as
gen
der f
ocal
per
sons
staff
200
050
,000
50,0
000
010
0,00
0Ag
trai
ning
curri
cula
upd
ated
(gen
der/H
IV)
Lum
p su
m1
309,
522
00
00
309,
522
Ag S
ecto
r gen
der/
HIV
strat
egy r
evie
wed
strat
egy
10
50,0
000
00
50,0
0007
Disa
ster
pre
pare
dnes
s stre
ngth
ened
Early
war
ning
info
diss
emin
ated
Lum
p su
m5
204,
000
204,
000
154,
000
154,
000
154,
000
870,
000
Land
zone
d/m
appe
d fo
r disa
ster p
repa
red
ha50
,000
943,
408
1,18
8,40
869
8,40
869
8,40
869
8,40
84,
227,
039
Wea
ther
stat
ions
esta
blish
ed at
eac
h EP
Asta
tions
204
1,75
0,00
02,
700,
000
3,20
0,00
03,
120,
000
3,12
0,00
013
,890
,000
08IP
M a
nd b
iote
chno
logy
for p
lant
pro
tect
ions
wid
ely
adop
ted
20 st
aff t
rain
ed in
bio
tech
nolo
gysta
ff20
139,
682
419,
045
558,
726
838,
089
838,
089
2,79
3,63
1Pl
ant p
rote
ction
regu
latio
n re
viewe
dpo
licy
10
050
,000
00
50,0
0009
Rele
vant
, evi
denc
e ba
sed
exte
nsio
n ad
vice
del
iver
ed2
ag re
sour
ce ce
ntre
s ope
ratio
nal p
er d
ist.
cent
res
6310
4,76
110
4,76
110
4,76
114
0,79
334
,920
489,
997
Distr
ict le
vel d
atab
ases
on
exte
nsio
n es
tabl
ished
data
base
s28
251,
427
293,
331
209,
522
209,
522
209,
522
1,17
3,32
5GA
P gu
idel
ines
cont
inuo
usly
upda
ted
guid
elin
es5
145,
713
215,
999
145,
713
145,
713
145,
713
798,
852
Lives
tock
mas
ter p
lan
deve
lope
dstr
ateg
y1
500,
000
00
00
500,
000
Effic
ient
rese
arch
par
tner
ship
s2
tech
rele
ase
stake
hold
er m
eetin
gs/a
nnua
llym
eetin
gs10
41,9
0441
,904
41,9
0441
,904
41,9
0420
9,52
2AR
ET d
ivers
ifica
tion
plan
dev
elop
edstu
dy1
050
,000
00
050
,000
Capa
city o
f nat
iona
l rep
osito
ry ce
ntre
s (pl
ant,
lives
tock
, fish
gen
etics
) upg
rade
dLu
mp
sum
10
015
0,00
00
015
0,00
0
MIR
T stre
ngth
ened
Lum
p su
m1
050
,000
00
050
,000
Rese
arch
coor
dina
tion
activ
ities
mee
tings
2062
,000
52,0
0042
,000
32,0
0032
,000
220,
000
Rese
arch
gra
nts p
rovid
ed to
50
stude
nts
stude
nts
5010
0,00
010
0,00
010
0,00
010
0,00
010
0,00
050
0,00
010
Effic
ient
seed
supp
ly sy
stem
s est
ablis
hed
Impo
rt pr
oced
ures
sim
plifi
ed
Lum
p su
m1
150,
000
75,0
0015
0,00
00
037
5,00
0Pr
oced
ure
for r
elea
sing
new
varie
ties r
evise
d an
d str
eam
lined
(bla
nk)
30,0
0030
,000
00
060
,000

125
National Agricultural Investment Plan
IA
IOOu
tput
sUn
it Ta
rget
Co
st Y
1Co
st Y
2Co
st Y
3Co
st Y
4Co
st Y
5To
tal c
ost
Seed
bill
pas
sed
Lum
p su
m1
29,3
3329
,333
00
058
,666
Sem
i-aut
onom
ous S
eed
Serv
ices U
nit e
stabl
ished
Lum
p su
m1
846,
152
423,
076
00
01,
269,
228
FISP
refo
rms a
dvan
ced
FISP
refo
rm o
ptio
ns m
onito
red
and
disc
usse
d am
ongs
t sta
keho
lder
sLu
mp
sum
517
5,00
017
5,00
017
5,00
017
5,00
017
5,00
087
5,00
0
FISP
refo
rm o
ptio
ns p
ilote
dLu
mp
sum
576
5,00
076
5,00
076
5,00
076
5,00
076
5,00
03,
825,
000
FISP
refo
rm o
ptio
ns st
udie
dstu
dies
215
0,00
010
0,00
00
00
250,
000
Live
stoc
k an
d fis
herie
s gen
e po
ol im
prov
ed a
nd b
reed
ing
stoc
k m
ade
avai
labl
e to
farm
ers
Lives
tock
cons
erva
tion
prot
ocol
s dev
elop
edLu
mp
sum
110
,000
10,0
0010
,000
10,0
0010
,000
50,0
00Su
pply
chai
ns fo
r org
anic
and
in-o
rgan
ic fe
rtilis
er st
reng
then
ed3
soil
labs
refu
rbish
edla
bs3
488,
885
509,
838
509,
838
20,9
520
1,52
9,51
3Se
mi-a
uton
omou
s fer
tilise
r reg
ulat
ory b
ody
esta
blish
edag
ency
124
,444
097
7,77
10
01,
002,
215
11Ag
ro-fo
rest
ry a
reas
exp
ande
d an
d m
anag
emen
t cap
aciti
es e
nhan
ced
Lega
l fra
mew
ork f
or ag
ro-fo
restr
y dev
elop
ed an
d in
cent
ive m
echa
nism
s ide
ntifi
edstu
dies
125
,000
25,0
0010
0,00
075
,000
25,0
0025
0,00
0
Tree-
cove
r den
sity o
n ag
ricul
tura
l lan
d es
tabl
ished
at
nat
iona
l lev
elstu
dies
175
0,00
00
75,0
0015
0,00
015
0,00
01,
125,
000
Lake
and
rive
rs fi
sher
ies r
esou
rces
are
effi
cient
ly a
nd su
stai
nabl
y m
anag
edAn
nual
cens
us o
n fis
h an
d aq
uatic
env
ironm
ent
unde
rtake
nsu
rvey
511
9,84
111
9,84
111
9,84
111
9,84
111
9,84
159
9,20
4
Fishe
ries m
aste
r pla
n de
velo
ped
studi
es1
00
020
0,00
00
200,
000
Lega
l/reg
ulat
ory f
ram
ewor
k for
fish
erie
s m
anag
emen
t stre
ngth
ened
Lum
p su
m1
422,
236
244,
443
555,
475
230,
475
230,
475
1,68
3,10
3
12Ar
ea u
nder
func
tiona
l irr
igat
ion
syst
ems i
ncre
ased
Capa
city f
or p
lann
ing/
impl
emen
tatio
n of
irrig
atio
n/m
anag
emen
t stre
ngth
ened
at n
atio
nal l
evel
Lum
p su
m2
105,
793
105,
793
105,
793
105,
793
105,
793
528,
965
Irrig
atio
n sc
hem
es a
re p
rope
rly m
anag
ed a
nd m
aint
aine
d ac
cord
ing
to th
eir e
cono
mic
pote
ntia
lCo
des o
f con
duct
for i
rriga
tion
man
agem
ent
deve
lope
d &
mon
itore
d pl
ans
1,20
062
,952
42,0
0042
,000
42,0
0042
,000
230,
952
WUA
Act
enac
ted
Lum
p su
m1
050
,000
00
050
,000
13Kn
owle
dge
and
skill
s of p
rovi
ders
and
use
rs o
f mec
hani
zatio
n se
rvice
s stre
ngth
ened
Stan
dard
s for
safe
ty m
easu
res/s
afeg
uard
dev
elop
edsta
ndar
d1
13,9
6813
,968
13,9
6813
,968
13,9
6869
,840

126
National Agricultural Investment Plan
IA
IOOu
tput
sUn
it Ta
rget
Co
st Y
1Co
st Y
2Co
st Y
3Co
st Y
4Co
st Y
5To
tal c
ost
14En
ablin
g en
viro
nmen
t for
Agr
i-fina
nce
stre
ngth
ened
and
spec
ific p
olicy
inst
rum
ents
est
ablis
hed.
Incre
ased
incre
men
tal va
lue of
ware
hous
e rec
eipt fi
nanc
ingLu
mp
sum
510
0,00
00
00
010
0,00
0
MAR
KET I
NFO
avai
labi
lity
and
use
enha
nced
ICT-b
ased
MIS
ope
ratio
nal
syste
ms
197
8,88
897
8,88
897
8,88
897
8,88
897
8,88
84,
894,
442
Regi
onal
and
inte
rnat
iona
l tra
de fa
cilita
ted
Barc
ode
insti
tutio
n es
tabl
ished
insti
tutio
n1
00
00
62,8
5762
,857
Gove
rnm
ent s
taff
train
ed o
n tra
de is
sues
lum
p su
m1
225,
936
225,
936
225,
936
225,
936
225,
936
1,12
9,67
8No
n-tra
de b
arrie
r dat
abas
e es
tabl
ished
data
base
10
253,
768
00
025
3,76
8Tra
de b
ans/
non-
trade
bar
riers
redu
ced
lum
p su
m1
158,
612
158,
612
158,
612
158,
612
158,
612
793,
060
Trade
-rela
ted
polic
ies u
pdat
edlu
mp
sum
136
6,58
636
8,05
336
9,51
924
0,94
224
0,94
21,
586,
042
Scop
e an
d ef
ficie
ncy
of C
omEX
and
WR
syst
ems e
nhan
ced
Incre
ased
incre
men
tal va
lue of
ware
hous
e rec
eipt fi
nanc
ingUS
D50
,000
,000
295,
566
345,
566
295,
566
295,
566
295,
566
1,52
7,83
1
Tran
spar
ent a
nd ru
les-
base
d m
arke
t and
trad
e po
licie
sAD
MAR
C su
cces
sfully
refo
rmed
studi
es2
1,10
0,00
01,
000,
000
00
02,
100,
000
Anal
ytica
l cap
acity
stre
ngth
ened
train
ings
675
,644
75,6
4475
,644
15,6
4415
,644
258,
222
Prici
ng p
olicy
dev
elop
edpo
licy
110
0,00
015
5,87
30
00
255,
873
Priva
te se
ctor c
onsu
lt m
echa
nism
esta
blish
edm
eetin
gs25
192,
062
192,
062
192,
062
192,
062
192,
062
960,
311
15En
ablin
g ag
ribus
ines
s env
ironm
ent a
nd p
ublic
-priv
ate
dial
ogue
stre
ngth
ened
Regu
lato
ry. f
ram
ewor
k/su
ppor
t ins
titut
ions
for
cotto
n/to
bacc
o str
engt
hLu
mp
sum
170
,000
170,
000
170,
000
20,0
0070
,000
500,
000
High
-leve
l pub
lic-p
rivat
e co
ordi
natio
n fo
rum
s es
tabl
ished
and
effe
ctive
mee
tings
2054
,000
54,0
0054
,000
54,0
0054
,000
270,
000
Natio
nal A
gricu
ltura
l fai
r gro
unds
and
cent
re fo
r ex
celle
nce
esta
blish
ed
Lum
p su
m1
00
200,
000
100,
000
100,
000
400,
000
Tax/
non-
tax i
ncen
tive
mec
hani
sms d
evel
oped
Lum
p su
m1
050
,000
100,
000
00
150,
000
Prin
ciple
s for
Res
pons
ible
Agr
icultu
ral I
nves
tmen
ts (P
RAI)
mai
nstre
amed
Awar
enes
s cre
atio
n an
d ou
treac
h ac
tiviti
es
cond
ucte
din
vestm
ents
2060
,000
50,0
0050
,000
50,0
0050
,000
260,
000
Proc
edur
es/ g
uide
lines
dev
elop
ed/a
dopt
edin
vestm
ents
2015
0,00
00
00
015
0,00
0

127
National Agricultural Investment Plan
IA
IOOu
tput
sUn
it Ta
rget
Co
st Y
1Co
st Y
2Co
st Y
3Co
st Y
4Co
st Y
5To
tal c
ost
16En
ablin
g en
viro
nmen
t for
Agr
i-fina
nce
stre
ngth
ened
and
spec
ific p
olicy
inst
rum
ents
est
ablis
hed.
Esta
blish
mov
able
colla
tera
l reg
istry
syste
m1
100,
000
00
00
100,
000
Feas
ibili
ty st
udie
s/ ex
pert
cons
ulta
tions
to fo
ster
acce
ss to
fina
nce
cond
ucte
dLu
mp
sum
510
0,00
00
00
010
0,00
0
Stre
ngth
en e
nabl
ing
envir
onm
ent
Lum
p su
m5
010
0,00
00
00
100,
000
Gran
d To
tal
530,
854
72,4
29,2
4668
,470
,159
66,7
35,8
6762
,495
,028
63,1
83,7
6033
3,31
4,06
1

128
National Agricultural Investment Plan
Prog
ram
BIA
IOO
utpu
tsUn
it Ta
rget
Co
st Y
1Co
st Y
2Co
st Y
3Co
st Y
4Co
st Y
5To
tal c
ost
02St
rong
, wel
l-org
anis
ed a
nd in
clusi
ve F
Os co
nduc
t bus
ines
s and
pro
vide
serv
ices t
o th
eir m
embe
rs17
030
grou
ps tr
aine
dgr
oups
17,0
3064
9,52
21,
289,
522
689,
522
889,
522
1,28
9,52
24,
807,
612
FO’s
rece
ive lo
ng-te
rm tr
aini
ng p
acka
ges
FO’s
390
8,31
18,
311
8,31
18,
311
8,31
141
,555
04In
stitu
tiona
l fee
ding
pro
gram
sOr
char
ds e
stabl
ished
at sc
hool
ssc
hool
s5,
000
200,
000
200,
000
200,
000
200,
000
200,
000
1,00
0,00
0Sc
hool
feed
ing
prog
ram
s im
prov
edLu
mp
sum
561
,682
61,6
8281
,682
81,6
8210
1,68
238
8,41
11
mill
ion
inte
grat
ed h
ouse
hold
farm
ing
(IHF)
ga
rden
s esta
blish
ed
1,00
0,00
040
,000
,000
40,0
00,0
0040
,000
,000
40,0
00,0
0040
,000
,000
200,
000,
000
HHs d
irectl
y sen
sitise
d on
nut
ritio
nhh
s57
5,00
023
0,00
035
0,00
035
0,00
035
0,00
035
0,00
01,
630,
000
204
EPA
leve
l nut
ritio
n ca
re g
roup
s ope
ratio
nal
annu
ally
grou
ps1,
020
204,
000
204,
000
204,
000
204,
000
204,
000
1,02
0,00
0
4 co
okin
g de
mos
/EPA
annu
ally
deliv
ered
hhs
3,14
02,
512
2,51
22,
512
2,51
22,
512
12,5
6050
0,00
0 ho
useh
olds
trai
ned
on fo
od p
roce
ssin
g,
stora
ge an
d co
nser
vatio
nhh
s50
0,00
010
0,00
010
0,00
010
0,00
010
0,00
010
0,00
050
0,00
0
Annu
al vi
llage
food
/ nut
ritio
n fa
irm
eetin
gs3,
140
314,
000
314,
000
314,
000
314,
000
314,
000
1,57
0,00
0Nu
tritio
n ca
mpa
igns
(with
rela
ted
mee
tings
&
mat
eria
ls) u
nder
take
nca
mpa
igns
1011
5,93
611
5,93
611
5,93
611
5,93
611
5,93
657
9,67
8
05Kn
owle
dge
of fo
od sa
fety
issu
es e
nhan
ced
alon
g th
e va
lue
chai
nIn
form
atio
n on
aflat
oxin
diss
emin
ated
Lum
p su
m5
220,
000
95,0
0095
,000
85,0
0085
,000
580,
000
06Im
plem
enta
tion
of th
e La
nd P
olicy
supp
orte
dAn
nual
dist
rict a
ware
ness
mee
tings
on
acqu
iring
la
nd fo
r inv
estm
ent c
ondu
cted
mee
tings
140
560,
000
560,
000
560,
000
560,
000
560,
000
2,80
0,00
0
Sens
itise
com
mun
ities
on
land
righ
tsm
eetin
gs1,
020
494,
190
494,
190
494,
190
494,
190
498,
381
2,47
5,14
3Hh
s stre
ngth
ened
on
gend
er re
latio
nshh
s20
0,00
01,
025,
000
1,02
5,00
01,
025,
000
1,02
5,00
025
,000
4,12
5,00
0Pa
rticip
atio
n of
wom
en an
d yo
uth
in ag
ricul
tura
l va
lue
chai
ns an
d in
stitu
tions
incr
ease
dgr
oups
2,64
012
6,53
913
4,92
014
1,90
415
5,87
323
9,68
279
8,91
9
07Di
sast
er p
repa
redn
ess s
treng
then
ed20
250
Peop
le tr
aine
d on
disa
ster r
isk
man
agem
ent a
nd p
repa
redn
ess
farm
ers
20,2
5024
0,87
327
3,37
317
5,87
317
5,87
317
5,87
31,
041,
863
50,0
00 ho
useh
olds w
ith fo
od st
orag
e fac
ilities
in pl
ace
hhs
50,0
002,
564,
666
2,56
4,66
62,
639,
666
2,33
9,66
62,
339,
666
12,4
48,3
31Ge
nder
respo
nsive
guide
lines
in pl
ace f
or dis
aster
resp
onse
gu
idel
ines
10
20,0
0020
,000
00
40,0
00

129
National Agricultural Investment Plan
IAIO
Out
puts
Unit
Targ
et
Cost
Y1
Cost
Y2
Cost
Y3
Cost
Y4
Cost
Y5
Tota
l cos
tSt
rate
gic g
rain
rese
rves
(phy
sica
l and
virt
ual i
n pl
ace
to re
spon
d un
derta
ken
to re
duce
impa
cts n
atur
al d
isas
ters
on
hous
ehol
d-le
vel F
NS.
240,
000
MT o
f gra
in st
ored
MT
1,20
0,00
05,
800,
000
5,80
0,00
05,
800,
000
5,80
0,00
05,
800,
000
29,0
00,0
0054
stor
age
facil
ities
reha
bilit
ated
silos
543,
000,
000
2,10
0,00
075
0,00
025
0,00
00
6,10
0,00
0Fo
od d
elive
red
to 5
% o
f Mal
awia
n ho
useh
olds
peop
le4,
578,
825
56,2
50,0
0061
,875
,000
68,0
62,5
0074
,868
,750
82,3
55,6
2534
3,41
1,87
508
Adeq
uate
infra
stru
ctur
e in
pla
ce to
han
dle
dise
ase
outb
reak
s50
0 lit
res o
f her
bicid
es an
d pe
sticid
es al
ways
in st
ock
litre
s2,
500
5,00
05,
000
5,00
05,
000
5,00
025
,000
Quar
antin
e an
d ot
her f
acili
ties a
vaila
ble
lum
p su
m1
3,03
4,45
82,
934,
458
1,56
5,57
996
3,41
253
5,84
69,
033,
753
Anim
al h
ealth
pre
vent
ive
mea
sure
s5
mill
ion
poul
try va
ccin
atio
ns an
nual
lych
icken
27,0
00,0
0069
,841
69,8
4169
,841
69,8
4197
,777
377,
140
Cows
vacc
inat
ed/d
ippe
d tw
ice a
year
cattl
e16
,500
,000
2,60
0,00
02,
950,
000
3,30
0,00
03,
650,
000
4,00
0,00
016
,500
,000
Dairy
cows
scre
ened
for T
B/tic
ksca
ttle
443,
750
495,
870
557,
853
619,
837
681,
821
743,
804
3,09
9,18
5Go
at st
ock d
ewor
med
annu
ally
goat
s41
,250
,000
1,62
5,00
01,
843,
750
2,06
2,50
02,
281,
250
2,50
0,00
010
,312
,500
Pigs
dew
orm
ed an
d va
ccin
ated
annu
ally
pigs
14,0
25,0
003,
600,
000
4,55
0,00
05,
500,
000
6,45
0,00
07,
950,
000
28,0
50,0
00Pr
oced
ures
on
bios
afet
y of a
nim
als a
nd fi
sh in
pla
celu
mp
sum
150
,000
00
00
50,0
00Va
ccin
atio
n bo
xes i
n pl
ace
lum
p su
m1
1,00
0,00
00
00
01,
000,
000
500,
000
farm
ers t
rain
ed an
nual
ly on
anim
al
hygi
ene
and
dise
ase
prev
entio
nfa
rmer
s2,
500,
000
125,
000
125,
000
125,
000
125,
000
125,
000
625,
000
IPM
and
bio
tech
nolo
gy fo
r pla
nt p
rote
ctio
ns w
idel
y ad
opte
d10
0 pl
ant c
linics
esta
blish
edpl
ant c
linics
100
20,0
0020
,000
20,0
0020
,000
75,8
7315
5,87
35
grou
ps p
er E
PA fo
rmed
and
train
ed to
im
plem
ent I
MP
in th
eir c
omm
unity
grou
ps1,
020
51,0
0051
,000
51,0
0051
,050
51,0
0025
5,05
0
Agric
ultu
ral b
iote
chno
logi
es ap
plie
dlu
mp
sum
537
0,95
236
3,96
822
7,93
622
0,95
221
3,96
81,
397,
777
Mon
itorin
g &
cont
rol
2 m
illio
n ha
mon
itore
d an
d co
ntro
lled
for p
ests
annu
ally
ha10
,000
,000
30,6
80,2
3130
,722
,135
30,5
26,5
8130
,163
,409
30,1
07,5
3615
2,19
9,89
2
Pest
s and
dis
ease
s out
brea
ks a
re m
onito
red
and
cont
rolle
d2
mill
ion
ha m
onito
red
and
cont
rolle
d fo
r pes
ts an
nual
lyha
10,0
00,0
0036
0,00
036
0,00
036
0,00
036
0,00
036
0,00
01,
800,
000

130
National Agricultural Investment Plan
IAIO
Out
puts
Unit
Targ
et
Cost
Y1
Cost
Y2
Cost
Y3
Cost
Y4
Cost
Y5
Tota
l cos
t09
Rele
vant
, evi
denc
e ba
sed
exte
nsio
n ad
vice
del
iver
ed15
0,00
0 fa
rmer
s acti
ve in
chick
en p
ass-o
n gr
oups
farm
ers
150,
000
24,0
0024
,000
24,0
0024
,000
24,0
0012
0,00
018
0,00
0 ch
icken
s ann
ually
dist
ribut
ed to
pas
s-on
sche
mes
chick
en90
0,00
01,
257,
134
1,25
7,13
41,
257,
134
1,25
7,13
41,
257,
134
6,28
5,67
0
225,
000
farm
ers a
ctive
in g
oat p
ass-o
n pr
ogra
ms
farm
ers
166,
667
97,3
0197
,301
97,3
0115
3,17
415
3,17
459
8,25
036
400
farm
ers a
nnua
lly tr
aine
d on
smal
l sto
ck
man
agem
ent
farm
ers
182,
000
301,
992
301,
992
301,
992
301,
992
301,
992
1,50
9,95
8
45,0
00 fa
rmer
s acti
ve in
chick
en p
ass-o
n gr
oups
farm
ers
45,0
0031
,428
31,4
2831
,428
31,4
2831
,428
157,
142
45,0
00 g
oats
annu
ally
distr
ibut
ed to
pas
s-on
sche
mes
goat
s22
5,00
02,
199,
985
2,19
9,98
52,
199,
985
2,19
9,98
52,
199,
985
10,9
99,9
23
4500
bee
keep
ers t
rain
edfa
rmer
s4,
500
3,35
25,
587
2,79
483
80
12,5
71Liv
esto
ck co
mm
ittee
s rev
ampe
d in
280
0 vil
lage
sco
mm
ittee
s2,
800
7,00
07,
000
7,00
08,
400
9,80
039
,200
Effic
ient
rese
arch
par
tner
ship
sAn
imal
Gen
etic
Reso
urce
s Cen
tre e
stabl
ished
lum
p su
m2
020
0,00
00
00
200,
000
Germ
plas
m co
nser
ved
spec
ies
3,00
033
,496
33,4
9682
,384
82,3
8482
,384
314,
144
Mal
awi P
lan
Gene
tic C
entre
refu
rbish
edlu
mp
sum
10
83,8
090
00
83,8
0910
Live
stoc
k/fis
herie
s bre
edin
gSm
all s
tock
mul
tiplic
atio
n th
roug
h fa
rmer
br
eede
rsgo
ats
1,00
01,
578,
798
1,57
8,79
81,
578,
798
1,57
8,79
81,
578,
798
7,89
3,98
8
Supp
ly ch
ains
for o
rgan
ic an
d in
-org
anic
ferti
liser
stre
ngth
ened
2 m
illio
n fa
rmer
s ann
ually
invo
lved
in m
anur
e an
d in
orga
nic f
ertil
iser p
rodu
ction
farm
ers
10,0
00,0
001,
019,
045
1,01
9,04
51,
019,
045
1,01
9,04
51,
019,
045
5,09
5,22
3
Inve
stiga
te o
ptio
ns fo
r fer
tilise
r pro
ducti
on an
d tra
nspo
rtlu
mp
sum
10
200,
000
00
020
0,00
0
Natio
nal s
oil m
aps u
pdat
edm
aps
870
2,14
070
2,14
036
6,90
436
6,90
436
6,90
42,
504,
994
Pesti
cides
Con
trol B
oard
stre
ngth
ened
lum
p su
m1
050
,000
50,0
0050
,000
015
0,00
011
Agro
-fore
stry
are
as e
xpan
ded
and
man
agem
ent c
apac
ities
enh
ance
d

131
National Agricultural Investment Plan
IAIO
Out
puts
Unit
Targ
et
Cost
Y1
Cost
Y2
Cost
Y3
Cost
Y4
Cost
Y5
Tota
l cos
t15
0,00
0 fa
rmer
s tra
ined
annu
ally
in ag
ro-fo
restr
y pr
actic
esfa
rmer
s75
0,00
035
0,00
035
0,00
035
0,00
035
0,00
035
0,00
01,
750,
000
2 m
illio
n ha
of f
arm
er m
anag
ed n
atur
al
gene
ratio
n tre
e-pl
ante
d ar
eas e
stabl
ished
ha2,
000
560,
000
560,
000
560,
000
560,
000
560,
000
2,80
0,00
0
22,5
00 m
ini-t
ree
nurs
erie
s esta
blish
ed an
d pr
oper
ly m
anag
ednu
rser
ies
22,5
002,
550,
000
2,55
0,00
02,
550,
000
2,55
0,00
02,
550,
000
12,7
50,0
00
At le
ast 3
0,00
0 ha
and
2,50
0 km
of r
iver b
anks
pl
ante
d wi
th tr
ees
ha30
,000
180,
000
180,
000
180,
000
180,
000
180,
000
900,
000
Lake
and
rive
rs fi
sher
ies r
esou
rces
are
effi
cient
ly a
nd su
stai
nabl
y m
anag
edHI
V/AI
DS b
asel
ine
data
diss
emin
ated
and
com
mun
ity aw
aren
ess c
ampa
igns
cond
ucte
dstu
dies
16,
984
26,9
846,
984
6,98
46,
984
54,9
20
Land
use
pla
nnin
g an
d zo
ning
upd
ated
and
impl
emen
tatio
n ca
pacit
y en
hanc
edAg
ricul
tura
l and
pro
tecte
d ar
eas z
oned
ha82
,500
2,39
4,21
41,
672,
214
1,50
4,59
61,
497,
612
1,49
7,61
28,
566,
246
Distr
ict le
vel n
atur
al re
sour
ce m
anag
emen
t co
mm
ittee
s fun
ction
alco
mm
ittee
s14
025
3,96
825
3,96
825
3,96
825
3,96
825
3,96
81,
269,
841
Sust
aina
ble
use
and
man
agem
ent o
f wat
er re
sour
ces
1 de
ep w
ell e
stabl
ished
per
dist
rict
wells
280
245,
000
245,
000
245,
000
245,
000
980,
000
Wat
er re
sour
ces a
re m
anag
ed a
nd u
sed
sust
aina
bly
1500
live
stock
wat
erin
g po
ints
esta
blish
edpo
ints
1,50
075
,000
75,0
0075
,000
75,0
0075
,000
375,
000
200,
000
farm
ers t
rain
ed an
nual
ly on
rain
wat
er
harv
estin
gfa
rmer
s1,
000,
000
50,0
0050
,000
50,0
0050
,000
50,0
0025
0,00
0
3 da
ms c
onstr
ucte
d pe
r dist
rict
dam
s84
2,00
0,00
02,
000,
000
2,00
0,00
02,
000,
000
400,
000
8,40
0,00
0Ca
tchm
ent a
rea m
anag
emen
t stre
ngth
ened
ha
1,00
0,00
01,
466,
738
1,41
9,27
71,
175,
787
721,
822
1,15
1,34
35,
934,
966
Impr
oved
rain
wate
r har
vesti
ng an
d so
il m
oistu
re
man
agem
ent t
echn
olog
ies d
evel
oped
farm
ers
1,00
0,00
02,
252,
824
2,25
2,82
42,
252,
824
2,25
2,82
42,
252,
824
11,2
64,1
18
Gran
d To
tal
1,51
4,95
617
5,64
9,98
018
1,56
8,09
918
4,48
6,29
319
0,87
9,33
919
8,12
8,36
793
0,71
2,07
9

132
National Agricultural Investment Plan
Prog
ram
CIA
IO
Out
puts
Unit
Targ
et
Cost
Y1
Cost
Y2
Cost
Y3
Cost
Y4
Cost
Y5
Tota
l cos
t02
Stro
ng, w
ell-o
rgan
ised
and
inclu
sive
FOs
cond
uct b
usin
ess a
nd p
rovi
de se
rvice
s to
thei
r mem
bers
150
FO’s
linke
d to
war
ehou
ses o
r com
mod
ity
exch
ange
sFO
’s15
015
,000
15,0
0015
,000
15,0
0015
,000
75,0
00
250
agri-
busin
ess F
O’s f
orm
edFO
’s25
051
,819
51,8
1951
,819
51,8
1951
,819
259,
094
500
FO le
ader
s tra
ined
peop
le50
030
,171
30,1
7130
,171
30,1
7130
,171
150,
856
05Kn
owle
dge
of fo
od sa
fety
issu
es e
nhan
ced
alon
g th
e va
lue
chai
nPr
oces
sors
/SM
Es tr
aine
d on
food
han
dlin
gSM
Es5,
642
244,
500
249,
148
266,
795
271,
894
264,
246
1,29
6,58
2Qu
ality
cont
rol a
ctiv
ities
und
erta
ken
80 in
spec
tion
visits
of p
roce
ssor
s und
erta
ken
visits
8057
,524
57,5
2457
,524
57,5
2457
,524
287,
618
mon
itorin
g of
food
pre
mise
s vis
its70
65,0
6965
,069
65,0
6965
,069
65,0
6932
5,34
709
Rele
vant
, evi
denc
e ba
sed
exte
nsio
n ad
vice
del
iver
ed24
5 va
lue
addi
tion
grou
ps fo
rmed
grou
ps24
524
,500
24,5
0024
,500
24,5
0024
,500
122,
500
2930
FO’s
train
ed o
n pr
oces
sing
FO’s
2,93
060
0,00
073
0,00
078
0,00
052
0,00
030
0,00
02,
930,
000
410,
000
farm
ers t
rain
ed an
nual
ly on
pos
t-ha
rves
t man
agem
ent
farm
ers
2,05
0,00
041
0,00
041
0,00
041
0,00
041
0,00
041
0,00
02,
050,
000
Equi
pmen
t dist
ribut
ed fo
r red
ucin
g po
st-ha
rves
t los
ses
equi
pmen
t2,
050,
000
41,3
00,0
0041
,300
,000
41,3
00,0
0041
,300
,000
41,3
00,0
0020
6,50
0,00
0
11La
ke a
nd ri
vers
fish
erie
s res
ourc
es a
re e
fficie
ntly
and
sust
aina
bly
man
aged
20 Fi
sher
ies l
andi
ng si
tes a
nd m
arke
ting
facil
ities
and
2 do
ckin
g sta
tions
esta
blish
edfa
ciliti
es22
279,
363
174,
602
174,
602
453,
965
174,
602
1,25
7,13
4
12Irr
igat
ion
sche
mes
are
pro
perly
man
aged
and
mai
ntai
ned
acco
rdin
g to
thei
r eco
nom
ic po
tent
ial
500
mat
chin
g gr
ants
disb
urse
d fo
r irri
gatio
n in
vestm
ents
gran
ts50
010
4,76
110
4,76
110
4,76
110
4,76
110
4,76
152
3,80
6
Irrig
atio
n fa
rmer
s lin
ked
to m
arke
ts an
d fin
ance
linka
ges
5066
,349
66,3
4966
,349
66,3
4966
,349
331,
744
13Av
aila
bilit
y an
d qu
ality
of m
echa
niza
tion
equi
pmen
t and
serv
ices e
nhan
ced
Feas
ibili
ty st
udy o
n m
achi
nery
fund
cond
ucte
dstu
dies
150
,000
00
00
50,0
00

133
National Agricultural Investment Plan
IA
IOO
utpu
tsUn
it Ta
rget
Co
st Y
1Co
st Y
2Co
st Y
3Co
st Y
4Co
st Y
5To
tal c
ost
14Do
mes
tic m
arke
t acc
ess i
mpr
oved
5,00
0 km
of r
ural
feed
er ro
ads r
ehab
ilita
ted/
upgr
aded
kms
5,00
050
,000
,000
50,0
00,0
0050
,000
,000
50,0
00,0
0050
,000
,000
250,
000,
000
7500
km o
f rur
al fe
eder
road
s spo
t-im
prov
edkm
s7,
500
18,7
50,0
0018
,750
,000
18,7
50,0
0018
,750
,000
18,7
50,0
0093
,750
,000
Rura
l col
d sto
rage
facil
ities
esta
blish
edM
T5,
000
1,81
1,42
71,
811,
427
1,81
1,42
71,
811,
427
1,81
1,42
79,
057,
134
Rura
l mar
ket f
acili
ties e
stabl
ished
and
reha
bilit
ated
facil
ities
251
1,05
0,95
01,
257,
933
1,50
1,20
11,
374,
665
1,49
0,00
06,
674,
749
Rura
l mar
ket f
acili
ties r
ehab
ilita
ted
cent
res
316
3,00
0,00
03,
000,
000
3,00
0,00
03,
000,
000
3,80
0,00
015
,800
,000
Regi
onal
and
inte
rnat
iona
l tra
de fa
cilita
ted
Activ
e in
tern
atio
nal t
rade
pro
mot
ion
unde
rtake
nlu
mp
sum
12,
031,
563
2,12
9,34
02,
227,
117
1,75
7,78
71,
738,
231
9,88
4,03
7
Scop
e an
d ef
ficie
ncy
of C
om E
X an
d W
R sy
stem
s enh
ance
d40
0,00
0 M
T add
ition
al q
ualit
y sto
rage
capa
city
esta
blish
edM
T40
0,00
026
,850
,000
26,7
80,0
0018
,950
,000
15,0
50,0
0011
,150
,000
98,7
80,0
00
Farm
ers a
nd S
MEs
trai
ned
in w
areh
ouse
re
ceip
t sys
tem
s and
com
mod
ity e
xcha
nges
entit
ies
500
100,
000
100,
000
100,
000
175,
000
175,
000
650,
000
Incr
ease
d in
crem
enta
l val
ue o
f war
ehou
se
rece
ipt fi
nanc
ing
entit
ies
1,55
11,
075,
548
2,05
3,31
92,
542,
204
2,54
2,20
42,
542,
204
10,7
55,4
80
15Ag
ribus
ines
s inv
estm
ent p
rom
otio
n an
d PP
Ps im
plem
ente
d36
abat
toirs
(rur
al/u
rban
) esta
blish
edab
atto
irs36
155,
000
255,
000
255,
000
330,
000
180,
000
1,17
5,00
05
spec
ial e
cono
mic
zone
s for
agrib
usin
ess
deve
lope
dzo
nes
547
3,73
352
3,73
352
3,73
382
2,93
71,
237,
982
3,58
2,11
9
6 ad
ditio
nal c
omm
odity
valu
e ch
ain
plat
form
s es
tabl
ished
and
exist
ing
plat
form
s ful
ly fu
nctio
nal
plat
form
s10
622,
349
722,
349
822,
349
922,
349
1,02
2,34
94,
111,
745
75 A
gro-
proc
esso
rs co
nnec
ted
to e
lectr
icity
SMEs
751,
200,
000
2,00
0,00
02,
000,
000
1,20
0,00
01,
100,
000
7,50
0,00
0In
vestm
ent c
omm
itmen
ts un
der N
ew A
llian
ce
fully
impl
emen
ted
perc
ent
100
29,6
00,0
0029
,600
,000
29,6
00,0
0029
,600
,000
29,6
00,0
0014
8,00
0,00
0
Unde
rtake
annu
al ag
ribus
ines
s inv
estm
ent
fora
/fairs
nat
iona
l/dist
rict l
evel
slu
mp
sum
519
0,00
019
0,00
019
0,00
019
0,00
019
0,00
095
0,00
0

134
National Agricultural Investment Plan
IA
IOO
utpu
tsUn
it Ta
rget
Co
st Y
1Co
st Y
2Co
st Y
3Co
st Y
4Co
st Y
5To
tal c
ost
Tech
nica
l and
Bus
ines
s Ski
lls o
f Coo
pera
tives
and
SM
Es in
agr
ibus
ines
s enh
ance
d15
0 tra
inin
gs fo
r coo
ps co
nduc
ted
on va
rious
te
chni
cal a
nd b
usin
ess a
spec
ts re
late
d to
valu
e ad
ditio
n
lum
p su
m15
060
,000
60,0
0060
,000
60,0
0060
,000
300,
000
300
train
ings
pro
vided
for a
grib
usin
ess S
MEs
, wo
men
and
yout
h on
vario
us te
chni
cal a
nd
busin
ess a
spec
ts
SMEs
300
130,
000
140,
000
140,
000
140,
000
140,
000
690,
000
Busin
ess m
ento
rshi
p fo
r 200
0 yo
uths
and
wom
en ag
ribus
ines
s ent
repr
eneu
rs fa
cilita
ted
peop
le2,
000
800,
000
800,
000
800,
000
800,
000
800,
000
4,00
0,00
0
Train
ing
of S
MEs
SMEs
400
13,9
6813
,968
13,9
6813
,968
13,9
6869
,841
150
train
ings
for c
oops
in ag
ribus
ines
s m
anag
emen
tlu
mp
sum
150
60,0
0060
,000
60,0
0060
,000
60,0
0030
0,00
0
16En
ablin
g en
viro
nmen
t for
agr
i-fina
nce
stre
ngth
ened
and
spec
ific p
olicy
inst
rum
ents
est
ablis
hed.
Feas
ibili
ty st
udie
s and
exp
ert c
onsu
ltatio
ns
on n
ew in
strum
ents
to fo
ster a
cces
s to
finan
ce
cond
ucte
d
studi
es3
100,
000
00
00
100,
000
Feas
ibili
ty st
udie
s and
exp
ert c
onsu
ltatio
ns
on n
ew in
strum
ents
to fo
ster a
cces
s to
finan
ce
cond
ucte
d
studi
es3
150,
000
00
00
150,
000
Tech
nica
l ass
istan
ce, r
efina
nce
and
risk s
harin
g fa
ciliti
es e
stabl
ished
lu
mp
sum
160
0,00
07,
500,
000
12,4
00,0
0040
0,00
040
0,00
021
,300
,000
Inve
stm
ent s
uppo
rt p
rovi
ded
to a
grib
usin
ess S
MEs
, with
pri
ority
to w
omen
and
you
th14
0 SM
Es (w
ith p
riorit
y to
wom
en an
d yo
uth)
an
nual
ly re
ceive
mat
chin
g gr
ants
for b
usin
ess
start-
up
SMEs
700
586,
044
586,
044
586,
044
586,
044
586,
044
2,93
0,21
9
50 S
MEs
(with
prio
rity t
o wo
men
and
yout
h)
annu
ally
rece
ived
mat
chin
g gr
ants
for
busin
ess e
xpan
sion
thro
ugh
envir
onm
enta
lly
frien
dly i
nves
tmen
ts.
SMEs
250
500,
000
500,
000
500,
000
500,
000
500,
000
2,50
0,00
0
Gran
d To
tal
86,8
5918
3,20
9,63
819
2,11
2,05
519
0,17
9,63
317
3,45
7,43
217
0,21
1,24
690
9,17
0,00
5

135
National Agricultural Investment Plan
Prog
ram
D IA
IOO
utpu
tsUn
it Ta
rget
Co
st Y
1Co
st Y
2Co
st Y
3Co
st Y
4Co
st Y
5To
tal c
ost
02St
rong
, wel
l-org
anis
ed a
nd in
clusi
ve F
Os co
nduc
t bus
ines
s and
pro
vide
serv
ices t
o th
eir m
embe
rs25
0 gr
oups
pro
ducin
g un
der c
ontra
ctgr
oups
250
20,0
4026
,720
33,4
0040
,080
46,7
6016
7,00
039
0 FO
’s re
ceive
long
-term
trai
ning
pac
kage
sFO
’s39
01,
465,
000
1,45
0,00
01,
650,
000
1,10
0,00
01,
300,
000
6,96
5,00
003
Publ
ic ex
tens
ion
wor
kers
at d
ecen
tralis
ed le
vels
equ
ippe
d an
d ho
used
to d
o th
eir j
ob15
,000
fron
t lin
e sta
ff ha
ve re
quire
d eq
uipm
ent
staff
15,0
003,
558,
728
3,76
8,25
03,
558,
728
3,55
8,72
83,
558,
728
18,0
03,1
62
26 la
bora
torie
s and
rela
ted
facil
ities
m
aint
aine
dla
bs26
560,
946
393,
330
386,
346
141,
904
41,9
041,
524,
430
4 Go
vern
men
t live
stock
farm
s hav
e el
ectri
city
farm
s4
83,8
0883
,808
00
016
7,61
68
fishe
ries v
esse
ls av
aila
ble
vess
els
835
0,00
050
,000
00
040
0,00
004
Nutri
tion
educ
atio
n13
100
farm
ers a
nnua
lly se
nsiti
sed
on b
io
forti
fied
varie
ties
farm
ers
65,5
0039
3,00
039
3,00
039
3,00
039
3,00
039
3,00
01,
965,
000
05Kn
owle
dge
of fo
od sa
fety
issu
es e
nhan
ced
alon
g th
e va
lue
chai
nFa
rmer
s and
fish
erm
en tr
aine
d on
food
safe
ty
and
aflat
oxin
man
agem
ent
farm
ers
200,
170
771,
500
771,
500
154,
000
154,
000
154,
000
2,00
5,00
0
FO’s/
SMEs
trai
ned
on fo
od sa
fety
and
aflat
oxin
m
anag
emen
tFO
’s90
027
9,07
027
9,07
027
9,07
027
9,07
027
9,07
01,
395,
350
06Im
plem
enta
tion
of th
e La
nd P
olicy
supp
orte
d91
000
ha o
f lan
d re
giste
red
ha91
,000
75,6
0031
5,60
031
5,60
031
5,60
075
,600
1,09
8,00
0Pa
rticip
atio
n of
wom
en a
nd y
outh
in a
gricu
ltura
l val
ue ch
ains
and
inst
itutio
ns in
crea
sed
Stra
tegy
dev
elop
ed o
n de
cent
em
ploy
men
tstu
dy1
100,
000
50,0
000
010
0,00
025
0,00
0St
rong
, wel
l-org
anis
ed a
nd in
clusi
ve F
Os co
nduc
t bus
ines
s and
pro
vide
serv
ices t
o th
eir m
embe
rs17
030
grou
ps tr
aine
dgr
oups
17,0
3021
0,00
021
0,00
021
0,00
021
0,00
021
0,00
01,
050,
000
07Di
sast
er p
repa
redn
ess s
treng
then
edCr
op o
r live
stock
insu
ranc
e pr
oduc
ts pi
lote
dlu
mp
sum
150
0,00
050
0,00
050
0,00
00
01,
500,
000
08IP
M a
nd b
iote
chno
logy
for p
lant
pro
tect
ions
wid
ely
adop
ted
25,0
00 fa
rmer
s tra
ined
on
IPM
farm
ers
5,00
037
5,00
037
5,00
037
5,00
037
5,00
037
5,00
01,
875,
000
Impo
rts an
d ex
ports
insp
ecte
d fo
r pes
ts an
d di
seas
eslu
mp
sum
550
0,00
050
0,00
050
0,00
050
0,00
050
0,00
02,
500,
000

136
National Agricultural Investment Plan
IAIO
Out
puts
Unit
Targ
et
Cost
Y1
Cost
Y2
Cost
Y3
Cost
Y4
Cost
Y5
Tota
l cos
t09
Rele
vant
, evi
denc
e ba
sed
exte
nsio
n ad
vice
del
iver
ed# o
f lea
d fa
rmer
s inc
reas
ed fr
om 2
0 to
35
thou
sand
lead
farm
ers
150,
000
4,46
5,65
25,
170,
952
4,52
0,95
25,
270,
952
6,02
0,95
225
,449
,460
10,0
00 cl
uste
rs o
pera
tiona
l per
year
villa
ges
50,0
001,
000,
000
1,00
0,00
01,
000,
000
1,00
0,00
01,
000,
000
5,00
0,00
010
0 wa
ter p
oint
s esta
blish
edwa
ter p
oint
s10
022
5,00
030
0,00
040
5,00
045
0,00
012
0,00
01,
500,
000
1000
FFS
oper
atio
nal p
er ye
arfa
rmer
fiel
d sc
hool
s5,
000
1,00
0,00
01,
000,
000
1,00
0,00
01,
000,
000
1,00
0,00
05,
000,
000
1000
gre
en b
elts
oper
atio
nal p
er ye
arvil
lage
s5,
000
500,
000
500,
000
500,
000
500,
000
500,
000
2,50
0,00
010
00 m
odel
villa
ges o
pera
tiona
l per
year
villa
ges
5,00
050
0,00
050
0,00
050
0,00
050
0,00
050
0,00
02,
500,
000
1020
gra
zing
area
s esta
blish
edar
eas
1,02
01,
020,
000
1,02
0,00
01,
020,
000
1,02
0,00
01,
020,
000
5,10
0,00
011
min
-feed
mill
s esta
blish
ed fo
r pou
ltry f
eeds
mill
s11
07,
200
21,6
0021
,600
28,8
0079
,200
15 d
ams r
esto
cked
with
fish
dam
s15
20,9
5262
,856
167,
616
62,8
560
314,
280
190,
000
ha an
nual
ly in
terc
ropp
ed w
ith
nitro
gen
fixin
g pl
ants
ha95
0,00
01,
630,
000
1,48
0,00
01,
480,
000
1,48
0,00
01,
480,
000
7,55
0,00
0
2200
0 an
nual
fiel
d da
ys o
n GA
Pfie
ld d
ays
110,
000
1,10
0,00
01,
100,
000
1,10
0,00
01,
100,
000
1,10
0,00
05,
500,
000
300,
000
ha an
nual
ly un
der G
APha
1,50
0,00
01,
443,
160
1,48
9,20
01,
533,
130
1,56
8,72
013
,609
,650
19,6
43,8
6040
0 fa
rmer
s usin
g sta
ll fe
edin
gfa
rmer
s40
05,
880
6,86
07,
350
8,33
010
,780
39,2
0040
0,00
0 fa
rmer
s rec
eive
annu
al sp
ecia
lised
ex
tens
ion
on cr
ops t
hey a
re p
rodu
cing
farm
ers
2,00
0,00
080
0,00
080
0,00
080
0,00
080
0,00
080
0,00
04,
000,
000
5000
fish
farm
ers a
nnua
lly tr
aine
d on
dee
p po
nd fi
sh p
rodu
ction
syste
mfa
mer
s25
,000
707,
000
707,
000
707,
000
707,
000
700,
000
3,52
8,00
0
5000
0 fo
dder
tree
s pla
nted
amon
gst f
arm
ers
trees
50,0
002,
500
2,50
02,
500
2,50
02,
500
12,5
008
pond
or c
age
cultu
re sc
hem
es e
stabl
ished
sche
mes
850
,000
97,7
7797
,777
97,7
7797
,777
441,
108
Annu
al d
istric
t agr
icultu
ral f
airs
und
erta
ken
fairs
140
420,
000
420,
000
420,
000
420,
000
420,
000
2,10
0,00
0In
puts
supp
lied
to fa
rmer
s for
dem
onstr
atio
n pu
rpos
eslu
mp
sum
51,
270,
000
1,27
0,00
01,
270,
000
1,27
0,00
01,
270,
000
6,35
0,00
0
Effic
ient
rese
arch
par
tner
ship
s18
micr
o-nu
trien
t bio
-forti
fied
crop
s dev
elop
ed
tech
nolo
gies
1828
9,68
228
9,68
233
9,68
233
9,68
233
9,68
21,
598,
410
abou
t 10
new
varie
ties o
r tec
hnol
ogie
s de
velo
ped
& re
leas
ed an
nual
lyte
chno
logi
es10
17,0
00,0
0017
,000
,000
17,0
00,0
0017
,000
,000
17,0
00,0
0085
,000
,000
abou
t 450
00 o
n-fa
rm p
artic
ipat
ory d
emos
on
GAP
cond
ucte
d an
nual
lyde
mos
229,
000
978,
000
1,02
0,00
01,
380,
000
1,47
6,00
02,
016,
000
6,87
0,00
0

137
National Agricultural Investment Plan
IAIO
Out
puts
Unit
Targ
et
Cost
Y1
Cost
Y2
Cost
Y3
Cost
Y4
Cost
Y5
Tota
l cos
tab
out 5
feed
tech
nolo
gies
dev
elop
ed an
nual
lyte
chno
logi
es5
204,
000
204,
000
204,
000
204,
000
204,
000
1,02
0,00
0De
taile
d an
alys
is of
site
-spec
ific c
onstr
aint
s af
fecti
ng ag
per
form
ance
lu
mp
sum
51,
000,
000
1,00
0,00
01,
000,
000
1,00
0,00
01,
000,
000
5,00
0,00
0
10Ef
ficie
nt se
ed su
pply
syst
ems e
stab
lishe
d 90
0,00
0 fa
rmer
s ann
ually
rece
iving
vouc
her
for l
egum
e se
ed su
bsid
yfa
rmer
s4,
500,
000
6,48
0,00
06,
480,
000
6,48
0,00
06,
480,
000
6,48
0,00
032
,400
,000
900,
000
farm
ers a
nnua
lly re
ceivi
ng vo
uche
r fo
r mai
ze se
ed su
bsid
yfa
rmer
s4,
500,
000
2,25
0,00
02,
250,
000
2,25
0,00
02,
250,
000
2,25
0,00
011
,250
,000
950
com
mun
ity se
ed b
anks
esta
blish
edse
ed b
anks
950
69,0
0072
,600
77,4
0082
,200
85,8
0038
7,00
0FI
SP p
rogr
am im
plem
ente
dlu
mp
sum
511
5,00
011
5,00
011
5,00
011
5,00
011
5,00
057
5,00
0Ha
of s
eed
mul
tiplic
atio
n fie
lds i
nspe
cted
by
SSU
incr
ease
d fro
m 1
5,00
0 to
25,
000
ha10
7,55
515
5,55
017
0,00
020
0,00
025
0,00
030
0,00
01,
075,
550
Impo
rt pr
oced
ures
sim
plifi
ed
certi
ficat
es50
,000
140,
000
140,
000
140,
000
140,
000
140,
000
700,
000
Nurs
erie
s for
tree
s and
vege
tabl
es e
stabl
ished
ha75
9,75
029
,750
9,75
09,
750
9,75
068
,750
Quan
titie
s of b
asic
seed
pro
duce
d in
crea
sed
from
105
to 3
25 M
T ann
ually
MT
2,50
531
,395
89,7
0014
9,50
020
9,30
026
9,10
074
8,99
5
Quan
titie
s of s
eed
mul
tiplie
d by
farm
ers
MT
13,0
0026
9,75
033
0,98
035
7,69
036
7,60
088
4,59
02,
210,
610
Live
stoc
k an
d fis
herie
s gen
epoo
l im
prov
ed a
nd b
reed
ing
stoc
k m
ade
avai
labl
e to
farm
ers
# live
stock
artifi
cially
inse
min
ated
annu
ally
incr
ease
d fro
m 1
0000
to 6
0000
inse
min
atio
ns30
0,00
03,
112,
857
6,06
2,85
79,
062,
857
12,0
62,8
5718
,062
,857
48,3
64,2
85
5 m
illio
n fin
gerli
ngs p
rodu
ced
annu
ally
finge
rling
s25
,000
,000
1,29
4,88
91,
334,
889
1,33
4,88
91,
330,
000
1,33
0,00
06,
624,
667
5 m
illio
n fin
gerli
ngs r
esto
cked
annu
ally
finge
rling
s25
,000
,000
1,29
1,90
41,
291,
904
1,29
1,90
41,
291,
904
1,29
1,90
46,
459,
520
Heife
r pas
s-on
sche
me
impl
emen
ted
lives
tock
1,40
020
1,12
030
1,68
050
2,80
058
6,60
075
4,20
02,
346,
400
Lives
tock
bre
edin
g an
imal
s sou
rced
incr
ease
d fro
m 3
450
to 1
0000
annu
ally
lives
tock
20,7
506,
176,
700
6,75
2,00
06,
377,
500
6,45
2,80
06,
503,
000
32,2
62,0
00
Lives
tock
cons
erva
tion
prot
ocol
s dev
elop
edlu
mp
sum
175
0,00
050
0,00
00
00
1,25
0,00
0Su
pply
chai
ns fo
r org
anic
and
in-o
rgan
ic fe
rtilis
er st
reng
then
ed30
0 fe
rtilis
er sa
mpl
es an
alys
ed an
nual
lysa
mpl
es1,
500
121,
000
121,
000
121,
000
121,
000
121,
000
605,
000
900,
000
farm
ers a
nnua
lly re
ceivi
ng vo
uche
r fo
r fer
tilise
r sub
sidy
farm
ers
4,50
0,00
037
,350
,000
37,3
50,0
0037
,350
,000
37,3
50,0
0037
,350
,000
186,
750,
000
Area
-spec
ific f
ertil
iser r
ecom
men
datio
ns
deve
lope
dm
aps
1021
1,29
619
1,29
619
1,29
643
5,74
143
5,74
11,
465,
370

138
National Agricultural Investment Plan
IAIO
Out
puts
Unit
Targ
et
Cost
Y1
Cost
Y2
Cost
Y3
Cost
Y4
Cost
Y5
Tota
l cos
t11
Lake
and
rive
rs fi
sher
ies r
esou
rces
are
effi
cient
ly a
nd su
stai
nabl
y m
anag
ed50
,000
fish
er fo
lk in
cludi
ng w
omen
and
yout
h tra
ined
on
impr
oved
tech
nolo
gies
fishe
rmen
50,0
0073
0,00
075
0,00
075
4,88
975
4,88
973
4,88
93,
724,
667
Fishe
ries t
echn
olog
ies d
evel
oped
and
anal
ysed
lum
p su
m5
117,
714
114,
222
114,
222
114,
222
114,
222
574,
602
12Ar
ea u
nder
func
tiona
l irr
igat
ion
syst
ems i
ncre
ased
36,8
00 h
a of i
rriga
tion
sche
mes
are
deve
lope
dha
36,8
0065
,802
,745
69,5
91,9
4573
,381
,145
77,1
70,3
4581
,906
,845
367,
853,
025
5,10
0 ha
of i
rriga
tion
sche
mes
are
reha
bilit
ated
ha5,
100
2,37
5,84
13,
298,
241
4,68
1,84
16,
065,
441
7,44
9,04
123
,870
,405
Irrig
atio
n sc
hem
es a
re p
rope
rly m
anag
ed a
nd m
aint
aine
d ac
cord
ing
to th
eir e
cono
mic
pote
ntia
l10
0 irr
igat
ion
asso
ciatio
ns tr
aine
d an
nual
lyFO
’s50
050
,000
50,0
0050
,000
50,0
0050
,000
250,
000
64 n
ew W
UAs e
stabl
ished
and
all e
xistin
g W
UAs t
rain
ed an
nual
lyW
UAs
1,23
043
,280
46,4
8049
,680
52,8
8056
,080
248,
400
Adva
nced
ext
ensio
n se
rvice
s pro
vided
to
farm
ers i
n irr
igat
ed ar
eas
ha8,
000
487,
321
502,
321
532,
321
532,
321
517,
321
2,57
1,60
5
13Av
aila
bilit
y an
d qu
ality
of m
echa
niza
tion
equi
pmen
t and
serv
ices e
nhan
ced
Drau
ght a
nim
al se
rvice
s im
prov
edan
imal
s19
711
5,83
611
5,83
611
5,83
611
5,83
611
5,83
657
9,18
0Go
vern
men
t mec
hani
zatio
n sc
hem
es m
ake
mor
e tra
ctors
and
CA-co
mpl
iant
ripp
ers
avai
labl
e to
farm
ers
equi
pmen
t72
544,
112
328,
224
78,2
2432
8,22
457
8,22
41,
857,
008
Ince
ntive
s pro
vided
to in
crea
se im
porta
tion
of
tracto
rs an
d CA
impl
emen
ts by
priv
ate
secto
rtra
ctors
500
8,00
6,98
58,
006,
985
8,00
6,98
58,
006,
985
8,00
6,98
540
,034
,925
Know
ledg
e an
d sk
ills o
f pro
vide
rs a
nd u
sers
of m
echa
niza
tion
serv
ices s
treng
then
ed30
0 m
echa
niza
tion
dem
os co
nduc
ted
dem
os30
041
,880
41,8
8041
,880
41,8
8041
,880
209,
400
425
Heal
th an
d sa
fety
trai
ning
s con
ducte
dfa
rmer
s42
52,
508,
750
2,51
3,12
52,
513,
125
2,51
7,50
02,
521,
875
12,5
74,3
7575
0 m
achi
nery
ope
rato
rs/m
echa
nics
trai
ned
artis
ans
750
20,0
0020
,000
20,0
0020
,000
20,0
0010
0,00
014
Effe
ctiv
enes
s, sc
ope
and
fairn
ess o
f con
tract
farm
ing
impr
oved
Ca
pacit
y of F
Os to
eng
age
in co
ntra
ct fa
rmin
g en
hanc
edFO
’s55
019
6,60
019
8,10
019
7,10
019
7,60
019
6,10
098
5,50
0
Cont
ract
Farm
ing
strat
egy d
issem
inat
ed /
stake
hold
ers s
ensit
ised
FO’s
1,00
019
6,70
024
6,70
024
6,70
024
6,70
019
6,70
01,
133,
500
Incr
ease
d nu
mbe
r of f
arm
ers o
pera
ting
unde
r co
ntra
ct fa
rmin
g ar
rang
emen
tsfa
rmer
s10
0,00
039
7,80
039
7,80
039
7,80
039
7,80
039
7,80
01,
989,
000

139
National Agricultural Investment Plan
IAIO
Out
puts
Unit
Targ
et
Cost
Y1
Cost
Y2
Cost
Y3
Cost
Y4
Cost
Y5
Tota
l cos
tM
ARKE
T INF
O av
aila
bilit
y an
d us
e en
hanc
edFa
rmer
s abl
e to
acce
ss an
d us
e m
arke
t in
form
atio
n sy
stem
sfa
rmer
s1,
500,
000
613,
968
1,10
0,00
01,
613,
968
2,10
0,00
03,
113,
968
8,54
1,90
4
16Fa
rmer
s, w
omen
and
you
th a
ble
to u
se fi
nanc
ial s
ervi
ces e
ffect
ivel
yFa
rmer
s, wo
men
and
yout
h gr
oups
capa
citat
ed
on fi
nanc
ial l
itera
cy an
d m
anag
emen
t ski
llsgr
oups
600
600,
000
600,
000
600,
000
600,
000
600,
000
3,00
0,00
0
Finan
cial l
itera
cy ca
mpa
igns
cond
ucte
dlu
mp
sum
526
,600
35,0
0042
,000
56,0
0014
0,00
029
9,60
0Fin
ancia
l lite
racy
cam
paig
ns co
nduc
ted
targ
etin
g 22
0,00
0 fa
rmer
slu
mp
sum
566
,285
64,1
900
00
130,
475
Gran
d To
tal
913,
927
187,
847,
146
197,
219,
010
204,
281,
053
213,
270,
174
240,
414,
911
1,04
3,03
2,29
4

140
National Agricultural Investment Plan
Anne
x 4:
NAI
P Bu
dget
by
Inte
rven
tion
Area
sAl
l val
ues a
re in
con
stan
t 201
7 U
S do
llars
Inte
rven
tion
Area
1IO
PO
utpu
tsUn
it Ta
rget
Co
st Y
1Co
st Y
2Co
st Y
3Co
st Y
4Co
st Y
5To
tal c
ost
Impr
oved
mul
ti-se
ctor
al co
ordi
natio
n, p
artn
ersh
ips a
nd m
utua
l acc
ount
abili
tyA
204
EPA
leve
l stru
cture
s mee
t bia
nnua
llym
eetin
gs4,
080
408,
000
408,
000
408,
000
408,
000
408,
000
2,04
0,00
028
Dist
rict c
oord
inat
ion
struc
ture
s mee
t 2-4
tim
es
per y
ear
mee
tings
1,66
034
2,50
034
7,00
034
2,00
034
2,00
034
2,00
01,
715,
500
628
villa
ge le
vel s
tructu
res m
eet b
iann
ual
mee
tings
7,90
693
8,60
012
5,60
093
8,60
012
5,60
012
5,60
02,
254,
000
ADD
leve
l coo
rdin
atio
n fu
nctio
nal
mee
tings
4027
,936
27,9
3627
,936
27,9
3627
,936
139,
682
ASW
G m
eets
4 tim
es p
er ye
arm
eetin
gs20
44,0
0044
,000
44,0
0044
,000
44,0
0022
0,00
0Bi
annu
al co
ordi
natio
n m
eetin
gs fo
r FO’
s, CS
Os,
priva
te se
ctor a
nd su
b-se
ctors
mee
tings
102,
000
2,00
02,
000
2,00
02,
000
10,0
00
Coor
dina
tion
troik
a fun
ction
allu
mp
sum
114
,000
14,0
0014
,000
14,0
0014
,000
70,0
00EM
C fu
nctio
nal
mee
tings
1012
,000
12,0
002,
000
2,00
02,
000
30,0
00In
tra-m
inist
eria
l coo
rdin
atio
n str
uctu
res
TA3
10,0
0010
,000
5,00
00
025
,000
MoA
IWD
com
mun
icatio
n str
ateg
y dev
elop
edstr
ateg
y1
50,0
000
00
050
,000
NAIP
secr
etar
iat f
uncti
onal
lum
p su
m5
110,
000
80,0
0080
,000
80,0
0080
,000
430,
000
Secto
r tar
getin
g in
har
mon
ised
lum
p su
m5
11,0
0011
,000
11,0
0010
,000
10,0
0053
,000
STM
func
tiona
l m
eetin
gs20
54,0
004,
000
4,00
04,
000
4,00
070
,000
TWGs
mee
t as p
er TO
R wi
th h
igh
atte
ndm
eetin
gs27
031
3,00
031
3,00
031
3,00
031
3,00
031
3,00
01,
565,
000
Incr
ease
d ca
pacit
y to
gen
erat
e, a
naly
se a
nd u
se d
ata,
info
rmat
ion,
kno
wle
dge
and
inno
vatio
nsA
Outco
me
leve
l sur
veys
bi-a
nnua
llysu
rvey
610
0,00
050
0,00
00
500,
000
100,
000
1,20
0,00
0Pr
oduc
tion-
leve
l sur
veys
annu
ally
surv
ey15
735,
000
735,
000
735,
000
735,
000
735,
000
3,67
5,00
0Sp
ecifi
c sur
veys
und
erta
ken
as re
quire
dlu
mp
sum
518
0,00
040
,000
00
100,
000
320,
000
M&E
syst
ems a
nd p
erfo
rman
ce m
anag
emen
t in
agric
ultu
re fu
nctio
ning
and
up
to d
ate
ANa
tiona
l lev
el M
&E sy
stem
s im
prov
ed
lum
p su
m1
720,
000
480,
000
350,
000
400,
000
350,
000
2,30
0,00
0PA
F dev
elop
ed fo
r the
agric
ultu
ral s
ecto
rlu
mp
sum
140
,000
40,0
000
00
80,0
00Se
ctor-w
ide
HQ an
d de
cent
ralis
ed M
ISlu
mp
sum
11,
040,
000
1,04
0,00
079
0,00
079
0,00
079
0,00
04,
450,
000
MoA
IWD
oper
atio
nal a
nd re
curr
ent c
osts
cove
red
AVe
hicle
flee
t con
tinuo
usly
mai
ntai
ned
vehi
cles
450
100,
000
200,
000
200,
000
200,
000
200,
000
900,
000

141
National Agricultural Investment Plan
IOP
Out
puts
Unit
Targ
et
Cost
Y1
Cost
Y2
Cost
Y3
Cost
Y4
Cost
Y5
Tota
l cos
tM
oAIW
D op
erat
iona
l, re
curr
ent c
osts
AHQ
-ADD
-Dist
rict m
onito
ring
of ac
tiviti
eslu
mp
sum
56,
385,
555
6,38
5,55
56,
385,
555
6,38
5,55
56,
385,
555
31,9
27,7
77In
crea
sing
staffi
ng le
vels
mai
ntai
ned
lum
p su
m5
16,0
00,0
0019
,200
,000
20,8
00,0
0022
,400
,000
24,0
00,0
0010
2,40
0,00
0M
oAIW
D fu
nctio
nal a
t EPA
, Dist
rict, A
DD an
d HQ
leve
lslu
mp
sum
54,
120,
000
4,12
0,00
04,
120,
000
4,12
0,00
04,
120,
000
20,6
00,0
00
Gran
d To
tal
495
31,7
57,5
9234
,139
,092
35,5
72,0
9236
,903
,092
38,1
53,0
9217
6,52
4,95
9
Inte
rven
tion
Area
2IO
PO
utpu
tsUn
it Ta
rget
Co
st Y
1Co
st Y
2Co
st Y
3Co
st Y
4Co
st Y
5To
tal c
ost
Lega
l fra
mew
ork
and
inst
itutio
nal s
uppo
rt fo
r FOs
stre
ngth
ened
AAg
ricul
tura
l Coo
pera
tive
Insti
tute
esta
blish
edlu
mp
sum
10
500,
000
250,
000
250,
000
250,
000
1,25
0,00
0Co
oper
ative
Act
revis
edac
t1
175,
000
00
00
175,
000
Farm
ers O
rgan
izatio
ns D
evel
opm
ent S
trate
gy
deve
lope
dac
t1
050
,000
00
050
,000
FO d
atab
ase
esta
blish
ed an
d up
date
d re
gula
rlylu
mp
sum
512
0,41
511
7,91
511
7,91
511
7,91
511
7,91
559
2,07
7Ge
nder
capa
city g
aps a
re id
entifi
edre
ports
50
150,
000
100,
000
00
250,
000
TA p
rovid
ed to
5 FO
supp
ortin
g in
stitu
tions
TA10
500,
000
500,
000
00
01,
000,
000
Stro
ng, w
ell-o
rgan
ised
and
inclu
sive
FOs
cond
uct b
usin
ess a
nd p
rovi
de se
rvice
s to
thei
r mem
bers
B17
030
grou
ps tr
aine
dgr
oups
17,0
3064
9,52
21,
289,
522
689,
522
889,
522
1,28
9,52
24,
807,
612
390
FO’s
rece
ive lo
ng-te
rm tr
aini
ng p
acka
ges
FO’s
390
8,31
18,
311
8,31
18,
311
8,31
141
,555
C25
0 gr
oups
pro
ducin
g un
der c
ontra
ctgr
oups
250
20,0
4026
,720
33,4
0040
,080
46,7
6016
7,00
039
0 FO
’s re
ceive
long
-term
trai
ning
pac
kage
sFO
’s39
01,
465,
000
1,45
0,00
01,
650,
000
1,10
0,00
01,
300,
000
6,96
5,00
0D
150
FO’s
linke
d to
war
ehou
ses o
r com
mod
ity
exch
ange
sFO
’s15
015
,000
15,0
0015
,000
15,0
0015
,000
75,0
00
250
agri-
busin
ess F
O’s f
orm
edFO
’s25
051
,819
51,8
1951
,819
51,8
1951
,819
259,
094
500
FO le
ader
s tra
ined
peop
le50
030
,171
30,1
7130
,171
30,1
7130
,171
150,
856
Gran
d To
tal
1,57
13,
035,
279
4,18
9,45
92,
946,
139
2,50
2,81
93,
109,
499
15,7
83,1
95

142
National Agricultural Investment Plan
Inte
rven
tion
Area
3IO
PO
utpu
tsUn
it Ta
rget
Co
st Y
1Co
st Y
2Co
st Y
3Co
st Y
4Co
st Y
5To
tal c
ost
Capa
city
of p
ublic
sect
or in
stitu
tions
to p
rovi
de a
gricu
ltura
l ext
ensi
on se
rvice
s stre
ngth
ened
A10
0 sta
ff re
ceive
shor
t-ter
m tr
aini
ngsta
ff10
020
0,00
020
0,00
020
0,00
020
0,00
020
0,00
01,
000,
000
Stud
. gra
duat
e fro
m M
Col
. of F
ish.
staff
150
75,0
0014
0,00
014
0,00
014
0,00
012
0,00
061
5,00
020
staf
f upg
rade
d to
PhD
leve
lsta
ff20
200,
000
200,
000
200,
000
200,
000
200,
000
1,00
0,00
0Fie
ld Fo
od/N
utrit
ion
Offic
ers r
e. (E
PA)
staff
204
540,
000
194,
400
00
073
4,40
0Fie
ld Fo
od an
d Nu
tritio
n Of
f. tra
ined
staff
204
113,
980
113,
980
113,
980
113,
980
113,
980
569,
901
225
staff
upgr
aded
to B
SC le
vel
staff
225
900,
000
900,
000
900,
000
900,
000
900,
000
4,50
0,00
022
5 sta
ff up
grad
ed to
MSC
leve
lsta
ff22
51,
350,
000
1,35
0,00
01,
350,
000
1,35
0,00
01,
350,
000
6,75
0,00
028
dist
rict l
evel
M&E
offi
cers
recr
uite
dsta
ff28
16,8
000
00
016
,800
300
agri-
busin
ess o
ffice
rs re
crui
ted
staff
300
540,
000
540,
000
00
01,
080,
000
Ext.
staff
train
ed o
n va
rious
tech
. issu
esta
ff3,
000
1,32
4,38
21,
308,
871
1,27
6,92
21,
267,
922
1,27
2,12
26,
450,
218
61 re
sear
cher
s rec
ruite
dsta
ff61
558,
000
360,
000
90,0
0090
,000
01,
098,
000
HR m
gt in
MoA
IWD
mod
erni
sed
lum
p su
m1
10,5
0010
,500
10,5
0050
01,
000
33,0
00M
oAIW
D re
-stru
cture
dlu
mp
sum
13,
150,
000
030
,000
30,0
000
3,21
0,00
0
HIV/
AIDS
nut
ritio
n su
pple
men
ts (st
aff)
lum
p su
m1
11,1
7511
,175
11,1
7511
,175
11,1
7555
,873
Train
ing
need
s ass
essm
ent
lum
p su
m1
15,0
000
00
015
,000
Publ
ic ex
tens
ion
wor
kers
at d
ecen
tralis
ed le
vels
equ
ippe
d an
d ho
used
to d
o th
eir j
obA
10 7
-ton
lorri
es av
aila
ble
lorri
es10
00
500,
000
00
500,
000
Vehi
cles p
rocu
red
for fi
eld
oper
atio
nsve
hicle
s10
06,
500,
000
00
00
6,50
0,00
0
bord
er p
ost o
ffice
s/hou
ses m
aint
aine
dSi
tes
1353
0,49
853
0,49
879
5,74
779
5,74
779
5,74
73,
448,
237
Offic
es, p
ower
and
hous
ing
at E
PAs
EPAs
204
5,20
0,00
05,
000,
000
5,00
0,00
05,
000,
000
5,00
0,00
025
,200
,000
22 A
g Tra
inin
g Ce
ntre
s reh
abili
tate
dce
ntre
s22
250,
000
250,
000
250,
000
250,
000
100,
000
1,10
0,00
028
dist
rict o
ffice
s mai
ntai
ned
Distr
icts
2875
,000
75,0
0075
,000
90,0
0010
5,00
042
0,00
0M
otor
bike
s for
fron
tline
staf
fm
otor
bike
s3,
500
3,00
0,00
04,
500,
000
3,00
0,00
00
010
,500
,000
Hous
ing
at re
sear
ch st
atio
ns im
prov
ed
Stat
ions
810
0,00
010
0,00
010
0,00
010
0,00
00
400,
000
ICT p
acka
ges a
t 28
distr
icts,
8 re
sear
ch st
atio
ns
and
14 n
atio
nal l
evel
offi
ces
ICT p
acka
ges
5035
0,00
035
0,00
035
0,00
035
0,00
035
0,00
01,
750,
000
CFr
ont l
ine
staff
have
requ
ired
equi
psta
ff15
,000
3,55
8,72
83,
768,
250
3,55
8,72
83,
558,
728
3,55
8,72
818
,003
,162
Labs
and
rela
ted
facil
ities
mai
ntai
ned
labs
2656
0,94
639
3,33
038
6,34
614
1,90
441
,904
1,52
4,43
0Go
vt li
vesto
ck fa
rms w
ith e
lectr
icity
farm
s4
83,8
0883
,808
00
016
7,61
68
fishe
ries v
esse
ls av
aila
ble
vess
els
835
0,00
050
,000
00
040
0,00
0Gr
and
Tota
l1,
461
29,5
63,8
1720
,429
,811
18,3
38,3
9714
,589
,955
14,1
19,6
5597
,041
,636

143
National Agricultural Investment Plan
Inte
rven
tion
Area
4IO
PO
utpu
tsUn
it Ta
rget
Co
st Y
1Co
st Y
2Co
st Y
3Co
st Y
4Co
st Y
5To
tal c
ost
Impr
oved
impl
emen
tatio
n, co
ordi
natio
n an
d m
onito
ring
of n
utrit
ion
rela
ted
activ
ities
in th
e ag
ricul
tura
l sec
tor
A28
dist
rict l
evel
Dist
rict N
utrit
ion
Coor
dina
ting
Com
mitt
ees o
pera
tiona
lm
eetin
gs14
056
,000
56,0
0056
,000
56,0
0056
,000
280,
000
Nutri
tion
polic
y enh
ance
dpo
licy
150
,000
00
00
50,0
00re
gion
al n
utrit
ion
data
colle
cted
annu
ally
surv
eys
2039
,111
39,1
1139
,111
39,1
1139
,111
195,
554
sem
i-ann
ual n
utrit
ion
foru
ms u
nder
take
nm
eetin
gs10
10,0
0010
,000
10,0
0010
,000
10,0
0050
,000
Inst
itutio
nal f
eedi
ng p
rogr
ams
BOr
char
ds e
stabl
ished
at sc
hool
ssc
hool
s5,
000
200,
000
200,
000
200,
000
200,
000
200,
000
1,00
0,00
0sc
hool
feed
ing
prog
ram
s im
prov
edlu
mp
sum
561
,682
61,6
8281
,682
81,6
8210
1,68
238
8,41
1Nu
tritio
n ed
ucat
ion
B1
mill
ion
inte
grat
ed h
ouse
hold
farm
ing
(IHF)
gar
dens
esta
blish
ed
hhs
1,00
0,00
040
,000
,000
40,0
00,0
0040
,000
,000
40,0
00,0
0040
,000
,000
200,
000,
000
115,
000
hhs a
nnua
lly d
irectl
y sen
sitise
d on
nut
ritio
nhh
s57
5,00
023
0,00
035
0,00
035
0,00
035
0,00
035
0,00
01,
630,
000
204
EPA
leve
l nut
ritio
n ca
re g
roup
s op
erat
iona
l ann
ually
EP
As1,
020
204,
000
204,
000
204,
000
204,
000
204,
000
1,02
0,00
0
4 co
okin
g de
mos
per
EPA a
nnua
lly d
elive
red
dem
os3,
140
2,51
22,
512
2,51
22,
512
2,51
212
,560
500,
000
hous
ehol
ds tr
aine
d on
food
pr
oces
sing,
stor
age
and
cons
erva
tion
hhs
500,
000
100,
000
100,
000
100,
000
100,
000
100,
000
500,
000
Annu
al vi
llage
food
and
nutri
tion
fairs
mee
tings
3,14
031
4,00
031
4,00
031
4,00
031
4,00
031
4,00
01,
570,
000
nutri
tion
cam
paig
ns (w
ith re
late
d m
eetin
gs &
mat
eria
ls) u
nder
take
nca
mpa
igns
1011
5,93
611
5,93
611
5,93
611
5,93
611
5,93
657
9,67
8
C13
100
farm
ers a
nnua
lly se
nsiti
sed
on b
io
forti
fied
varie
ties
farm
ers
65,5
0039
3,00
039
3,00
039
3,00
039
3,00
039
3,00
01,
965,
000
Gran
d To
tal
157,
287
41,7
76,2
4141
,846
,241
41,8
66,2
4141
,866
,241
41,8
86,2
4120
9,24
1,20
4

144
National Agricultural Investment Plan
Inte
rven
tion
Area
5IO
PO
utpu
tsUn
it Ta
rget
Co
st Y
1Co
st Y
2Co
st Y
3Co
st Y
4Co
st Y
5To
tal c
ost
Adeq
uate
food
safe
ty le
gisl
atio
n is
in p
lace
Apr
oduc
t-spe
cific q
ualit
y sta
ndar
ds d
evel
oped
lum
p su
m1
184,
920
109,
920
109,
920
34,9
2034
,920
474,
602
Appr
opria
te a
nd a
dequ
ate
food
safe
ty le
gisl
atio
n is
in p
lace
AFo
od S
afet
y and
Qua
lity B
ill an
d Ac
t dev
elop
edag
ency
10
015
0,00
00
015
0,00
0Fo
od sa
fety
and
qual
ity co
ntro
l age
ncy e
stabl
ished
agen
cy1
150,
000
00
150,
000
030
0,00
0pr
oduc
t-spe
cific q
ualit
y sta
ndar
ds d
evel
oped
lum
p su
m1
075
,000
075
,000
75,0
0022
5,00
0Kn
owle
dge
of fo
od sa
fety
issu
es e
nhan
ced
alon
g th
e va
lue
chai
nA
45 TW
G m
embe
rs an
d Go
vern
men
t offi
ces t
rain
ed o
n fo
od sa
fety
issu
estra
inin
gs45
143,
173
143,
173
143,
173
143,
173
143,
173
715,
866
Mul
ti-sta
keho
lder
pla
tform
s mee
t reg
ular
lym
eetin
gs35
40,0
0040
,000
40,0
0040
,000
40,0
0020
0,00
0Re
gula
r dat
a upd
atin
g on
aflat
oxin
and
othe
r foo
d-bo
rne
dise
ases
lum
p su
m5
134,
761
134,
761
134,
761
134,
761
134,
761
673,
806
Surv
eys o
n sta
tus o
f foo
d sa
fety
und
erta
ken
surv
ey61
560,
000
00
056
0,00
01,
120,
000
BIn
form
atio
n on
aflat
oxin
and
oth
er fo
od h
azar
ds
diss
emin
ated
lum
p su
m5
220,
000
95,0
0095
,000
85,0
0085
,000
580,
000
CFa
rmer
s and
fish
erm
en tr
aine
d on
pos
t-har
vest
man
agem
ent a
nd fo
od sa
fety
farm
ers
200,
170
771,
500
771,
500
154,
000
154,
000
154,
000
2,00
5,00
0
FO’s/
SMEs
trai
ned
on fo
od sa
fety
inclu
ding
aflat
oxin
m
anag
emen
tFO
’s90
027
9,07
027
9,07
027
9,07
027
9,07
027
9,07
01,
395,
350
DPr
oces
sors
/SM
Es tr
aine
d on
food
han
dlin
gSM
Es5,
642
244,
500
249,
148
266,
795
271,
894
264,
246
1,29
6,58
2Qu
ality
cont
rol a
ctiv
ities
und
erta
ken
A2
labo
rato
ries a
ccre
dite
d in
tern
atio
nally
labs
20
200,
000
020
0,00
00
400,
000
3 la
bora
torie
s acc
redi
ted
inte
rnat
iona
llyla
bs2
00
015
0,00
00
150,
000
4 la
bora
torie
s acc
redi
ted
inte
rnat
iona
llyla
bs2
11,7
3311
,733
11,7
3311
,733
11,7
3358
,666
Qual
ity co
ntro
l sys
tem
dev
elop
edsy
stem
10
00
27,0
0010
0,00
012
7,00
0D
80 in
spec
tion
visits
of p
roce
ssor
s und
erta
ken
visits
8057
,524
57,5
2457
,524
57,5
2457
,524
287,
618
mon
itorin
g of
food
pre
mise
s vis
its70
65,0
6965
,069
65,0
6965
,069
65,0
6932
5,34
7Gr
and
Tota
l14
,238
2,86
2,25
12,
231,
898
1,50
7,04
61,
879,
144
2,00
4,49
710
,484
,837

145
National Agricultural Investment Plan
Inte
rven
tion
Area
6IO
PO
utpu
tsUn
it Ta
rget
Co
st Y
1Co
st Y
2Co
st Y
3Co
st Y
4Co
st Y
5To
tal c
ost
Impl
emen
tatio
n of
the
Land
Pol
icy su
ppor
ted
A28
Dist
rict l
and
regi
strie
s esta
blish
edsy
stem
s28
375,
000
3,42
0,00
03,
420,
000
3,42
0,00
03,
420,
000
14,0
55,0
00La
nd P
olicy
insti
tutio
nal a
spec
ts im
plem
ente
dlu
mp
sum
525
8,00
021
8,00
020
8,00
011
8,00
058
,000
860,
000
BAn
nual
dist
rict a
ware
ness
mee
tings
on
acqu
iring
land
fo
r inv
estm
ent c
ondu
cted
mee
tings
140
560,
000
560,
000
560,
000
560,
000
560,
000
2,80
0,00
0
Sens
itiza
tion
of co
mm
unity
mem
bers
on
land
righ
tsm
eetin
gs1,
020
494,
190
494,
190
494,
190
494,
190
498,
381
2,47
5,14
3C
9100
0 ha
of l
and
regi
stere
dha
91,0
0075
,600
315,
600
315,
600
315,
600
75,6
001,
098,
000
Parti
cipat
ion
of w
omen
and
you
th in
agr
icultu
ral v
alue
chai
ns a
nd in
stitu
tions
incr
ease
dA
200
Gove
rnm
ent s
taff
train
ed as
gen
der f
ocal
per
sons
staff
200
050
,000
50,0
000
010
0,00
0Ag
ricul
tura
l tra
inin
g cu
rricu
lar u
pdat
ed o
n ge
nder
, HI
V/AI
DSlu
mp
sum
130
9,52
20
00
030
9,52
2
Agric
ultu
re S
ecto
r gen
der a
nd H
IV st
rate
gy re
viewe
d str
ateg
y1
050
,000
00
050
,000
B20
0,00
0 hh
s stre
ngth
ened
on
gend
er re
latio
nshh
s20
0,00
01,
025,
000
1,02
5,00
01,
025,
000
1,02
5,00
025
,000
4,12
5,00
026
40 W
omen
/you
th g
roup
s stre
ngth
ened
grou
ps2,
640
126,
539
134,
920
141,
904
155,
873
239,
682
798,
919
CSt
rate
gy d
evel
oped
on
dece
nt e
mpl
oym
ent
study
110
0,00
050
,000
00
100,
000
250,
000
Stro
ng, w
ell-o
rgan
ised
and
inclu
sive
FOs
cond
uct b
usin
ess a
nd p
rovi
de se
rvice
s to
thei
r mem
bers
C17
030
grou
ps tr
aine
dgr
oups
17,0
3021
0,00
021
0,00
021
0,00
021
0,00
021
0,00
01,
050,
000
Gran
d To
tal
27,2
703,
533,
852
6,52
7,71
16,
424,
695
6,29
8,66
35,
186,
662
27,9
71,5
84

146
National Agricultural Investment Plan
Inte
rven
tion
Area
7IO
PO
utpu
tsUn
it Ta
rget
Co
st Y
1Co
st Y
2Co
st Y
3Co
st Y
4Co
st Y
5To
tal c
ost
Disa
ster
pre
pare
dnes
s stre
ngth
ened
AEa
rly w
arni
ng in
fo d
issem
inat
edlu
mp
sum
520
4,00
020
4,00
015
4,00
015
4,00
015
4,00
087
0,00
0La
nd zo
ned
and
map
ped
for d
isaste
r pr
epar
edne
ssha
50,0
0094
3,40
81,
188,
408
698,
408
698,
408
698,
408
4,22
7,03
9
Wea
ther
stat
ions
esta
blish
ed at
eac
h EP
Awe
athe
r sta
tions
204
1,75
0,00
02,
700,
000
3,20
0,00
03,
120,
000
3,12
0,00
013
,890
,000
B20
250
Peop
le tr
aine
d on
disa
ster r
isk
man
agem
ent a
nd p
repa
redn
ess
farm
ers
20,2
5024
0,87
327
3,37
317
5,87
317
5,87
317
5,87
31,
041,
863
50,0
00 h
ouse
hold
s with
food
stor
age
facil
ities
in p
lace
hh
s50
,000
2,56
4,66
62,
564,
666
2,63
9,66
62,
339,
666
2,33
9,66
612
,448
,331
Gend
er re
spon
sive
guid
elin
es in
pla
ce fo
r di
saste
r res
pons
e gu
idel
ines
10
20,0
0020
,000
00
40,0
00
CCr
op o
r live
stock
insu
ranc
e pr
oduc
ts pi
lote
dlu
mp
sum
150
0,00
050
0,00
050
0,00
00
01,
500,
000
Stra
tegi
c gra
in re
serv
es (p
hysi
cal a
nd v
irtua
l in
plac
e to
resp
ond
unde
rtake
n to
redu
ce im
pact
s nat
ural
dis
aste
rs o
n ho
useh
old-
leve
l FNS
.B
240,
000
MT o
f gra
in st
ored
MT
1,20
0,00
05,
800,
000
5,80
0,00
05,
800,
000
5,80
0,00
05,
800,
000
29,0
00,0
0054
stor
age
facil
ities
reha
bilit
ated
silos
543,
000,
000
2,10
0,00
075
0,00
025
0,00
00
6,10
0,00
0Fo
od d
elive
red
to 5
% o
f Mal
awia
n ho
useh
olds
peop
le4,
578,
825
56,2
50,0
0061
,875
,000
68,0
62,5
0074
,868
,750
82,3
55,6
2534
3,41
1,87
5
Gran
d To
tal
316,
981
71,2
52,9
4777
,225
,447
82,0
00,4
4787
,406
,697
94,6
43,5
7241
2,52
9,10
8

147
National Agricultural Investment Plan
Inte
rven
tion
Area
8IO
PO
utpu
tsUn
it Ta
rget
Co
st Y
1Co
st Y
2Co
st Y
3Co
st Y
4Co
st Y
5To
tal c
ost
Adeq
uate
infra
stru
ctur
e in
pla
ce to
han
dle
dise
ase
outb
reak
sB
500
litre
s of h
erbi
cides
and
pesti
cides
alwa
ys
in st
ock
litre
s2,
500
5,00
05,
000
5,00
05,
000
5,00
025
,000
Quar
antin
e an
d ot
her f
acili
ties
lum
p su
m1
3,03
4,45
82,
934,
458
1,56
5,57
996
3,41
253
5,84
69,
033,
753
Anim
al h
ealth
pre
vent
ive
mea
sure
sB
5 m
illio
n po
ultry
vacc
inat
ed /y
ear
chick
en27
,000
,000
69,8
4169
,841
69,8
4169
,841
97,7
7737
7,14
0Co
ws va
ccin
ated
/dip
ped
2xye
arca
ttle
16,5
00,0
002,
600,
000
2,95
0,00
03,
300,
000
3,65
0,00
04,
000,
000
16,5
00,0
00Da
iry co
ws sc
reen
ed fo
r TB/
ticks
cattl
e44
3,75
049
5,87
055
7,85
361
9,83
768
1,82
174
3,80
43,
099,
185
Goat
stoc
k dew
orm
ed an
nual
lygo
ats
41,2
50,0
001,
625,
000
1,84
3,75
02,
062,
500
2,28
1,25
02,
500,
000
10,3
12,5
00Pi
gs d
ewor
med
/vac
cinat
ed /y
ear
pigs
14,0
25,0
003,
600,
000
4,55
0,00
05,
500,
000
6,45
0,00
07,
950,
000
28,0
50,0
00Pr
oced
ures
on
bios
afet
y of a
nim
als a
nd fi
sh
in p
lace
lum
p su
m1
50,0
000
00
050
,000
Vacc
inat
ion
boxe
s in
plac
e lu
mp
sum
11,
000,
000
00
00
1,00
0,00
050
0,00
0 fa
rmer
s tra
ined
/yea
r on
anim
al
hygi
ene
/ dise
ase
prev
ent.
farm
ers
2,50
0,00
012
5,00
012
5,00
012
5,00
012
5,00
012
5,00
062
5,00
0
IPM
and
bio
tech
nolo
gy fo
r pla
nt p
rote
ctio
ns w
idel
y ad
opte
dA
20 st
aff t
rain
ed in
bio
tech
nolo
gysta
ff20
139,
682
419,
045
558,
726
838,
089
838,
089
2,79
3,63
1Pl
ant p
rote
ction
regu
latio
n re
viewe
dpo
licy
10
050
,000
00
50,0
00B
100
plan
t clin
ics e
stabl
ished
clini
cs10
020
,000
20,0
0020
,000
20,0
0075
,873
155,
873
5 gr
oups
per
EPA
form
ed an
d tra
ined
to
impl
emen
t IM
P in
thei
r com
mun
itygr
oups
1,02
051
,000
51,0
0051
,000
51,0
5051
,000
255,
050
Agric
ultu
ral b
iote
chs a
pplie
dlu
mp
sum
537
0,95
236
3,96
822
7,93
622
0,95
221
3,96
81,
397,
777
C25
,000
farm
ers t
rain
ed o
n IP
Mfa
rmer
s5,
000
375,
000
375,
000
375,
000
375,
000
375,
000
1,87
5,00
0Im
ports
and
expo
rts in
spec
ted
for p
ests
and
dise
ases
lum
p su
m5
500,
000
500,
000
500,
000
500,
000
500,
000
2,50
0,00
0
Mon
itorin
g &
cont
rol
B2
mill
ion
ha m
onito
red
and
cont
rolle
d fo
r pe
sts an
nual
lyha
10,0
00,0
0030
,680
,231
30,7
22,1
3530
,526
,581
30,1
63,4
0930
,107
,536
152,
199,
892
Pest
s and
dis
ease
s out
brea
ks a
re m
onito
red
and
cont
rolle
dB
2 m
illio
n ha
mon
itore
d an
d co
ntro
lled
for
pests
annu
ally
ha10
,000
,000
360,
000
360,
000
360,
000
360,
000
360,
000
1,80
0,00
0
Gran
d To
tal
4,59
7,80
445
,102
,033
45,8
47,0
5045
,917
,000
46,7
54,8
2348
,478
,894
232,
099,
801

148
National Agricultural Investment Plan
Inte
rven
tion
Area
9 (p
art 1
- Re
leva
nt, e
vide
nce-
base
d ex
tens
ion
advi
ce d
eliv
ered
)IO
PO
utpu
tsUn
it Ta
rget
Co
st Y
1Co
st Y
2Co
st Y
3Co
st Y
4Co
st Y
5To
tal c
ost
Rele
vant
, evi
denc
e ba
sed
exte
nsio
n ad
vice
del
iver
edA
2 ag
ricul
tura
l res
ourc
e ce
ntre
s ope
ratio
nal
per d
istric
tce
ntre
s63
104,
761
104,
761
104,
761
140,
793
34,9
2048
9,99
7
Distr
ict le
vel d
atab
ases
on
exte
nsio
n es
tabl
ished
data
base
s28
251,
427
293,
331
209,
522
209,
522
209,
522
1,17
3,32
5
GAP
guid
elin
es co
ntin
uous
ly up
date
dgu
idel
ines
514
5,71
321
5,99
914
5,71
314
5,71
314
5,71
379
8,85
2Liv
esto
ck m
aste
rpla
n de
velo
ped
strat
egy
150
0,00
00
00
050
0,00
0
B15
0,00
0 fa
rmer
s acti
ve in
chick
en p
ass-o
n gr
oups
farm
ers
150,
000
24,0
0024
,000
24,0
0024
,000
24,0
0012
0,00
0
180,
000
chick
en an
nual
ly di
strib
uted
to
pass
-on
sche
mes
chick
en90
0,00
01,
257,
134
1,25
7,13
41,
257,
134
1,25
7,13
41,
257,
134
6,28
5,67
0
225,
000
farm
ers a
ctive
in g
oat p
ass-o
n pr
ogra
ms
farm
ers
166,
667
97,3
0197
,301
97,3
0115
3,17
415
3,17
459
8,25
0
3640
0 fa
rmer
s ann
ually
trai
ned
on sm
all
stock
man
agem
ent
farm
ers
182,
000
301,
992
301,
992
301,
992
301,
992
301,
992
1,50
9,95
8
45,0
00 fa
rmer
s acti
ve in
chick
en p
ass-o
n gr
oups
farm
ers
45,0
0031
,428
31,4
2831
,428
31,4
2831
,428
157,
142
45,0
00 g
oats
annu
ally
distr
ibut
ed to
pas
s-on
sche
mes
goat
s22
5,00
02,
199,
985
2,19
9,98
52,
199,
985
2,19
9,98
52,
199,
985
10,9
99,9
23
4500
bee
keep
ers t
rain
edfa
rmer
s4,
500
3,35
25,
587
2,79
483
80
12,5
71liv
esto
ck co
mm
ittee
s rev
ampe
d in
280
0 vil
lage
sco
mm
ittee
s2,
800
7,00
07,
000
7,00
08,
400
9,80
039
,200
C# o
f lea
d fa
rmer
s inc
reas
ed fr
om 2
0 to
35
thou
sand
lead
farm
ers
150,
000
4,46
5,65
25,
170,
952
4,52
0,95
25,
270,
952
6,02
0,95
225
,449
,460
10,0
00 cl
uste
rs o
pera
tiona
l per
year
villa
ges
50,0
001,
000,
000
1,00
0,00
01,
000,
000
1,00
0,00
01,
000,
000
5,00
0,00
010
0 wa
ter p
oint
s esta
blish
edwa
ter p
oint
s10
022
5,00
030
0,00
040
5,00
045
0,00
012
0,00
01,
500,
000
1000
FFS
oper
atio
nal p
er ye
arfa
rmer
fiel
d sc
hool
s5,
000
1,00
0,00
01,
000,
000
1,00
0,00
01,
000,
000
1,00
0,00
05,
000,
000
1000
gre
en b
elts
oper
atio
nal p
er ye
arvil
lage
s5,
000
500,
000
500,
000
500,
000
500,
000
500,
000
2,50
0,00
010
00 m
odel
villa
ges o
pera
tiona
l per
year
villa
ges
5,00
050
0,00
050
0,00
050
0,00
050
0,00
050
0,00
02,
500,
000
1020
gra
zing
area
s esta
blish
edar
eas
1,02
01,
020,
000
1,02
0,00
01,
020,
000
1,02
0,00
01,
020,
000
5,10
0,00
0

149
National Agricultural Investment Plan
IOP
Out
puts
Unit
Targ
et
Cost
Y1
Cost
Y2
Cost
Y3
Cost
Y4
Cost
Y5
Tota
l cos
t11
min
-feed
mill
s esta
blish
ed fo
r pou
ltry
feed
sm
ills
110
7,20
021
,600
21,6
0028
,800
79,2
00
15 d
ams r
esto
cked
with
fish
dam
s15
20,9
5262
,856
167,
616
62,8
560
314,
280
190,
000
ha an
nual
ly in
terc
ropp
ed w
ith
nitro
gen
fixin
g pl
ants
ha95
0,00
01,
630,
000
1,48
0,00
01,
480,
000
1,48
0,00
01,
480,
000
7,55
0,00
0
2200
0 an
nual
fiel
d da
ys o
n GA
Pfie
ld d
ays
110,
000
1,10
0,00
01,
100,
000
1,10
0,00
01,
100,
000
1,10
0,00
05,
500,
000
300,
000
ha an
nual
ly un
der G
APha
1,50
0,00
01,
443,
160
1,48
9,20
01,
533,
130
1,56
8,72
013
,609
,650
19,6
43,8
6040
0 fa
rmer
s usin
g sta
ll fe
edin
gfa
rmer
s40
05,
880
6,86
07,
350
8,33
010
,780
39,2
0040
0,00
0 fa
rmer
s rec
eive
annu
al sp
ecia
lised
ex
tens
ion
on cr
ops t
hey a
re p
rodu
cing
farm
ers
2,00
0,00
080
0,00
080
0,00
080
0,00
080
0,00
080
0,00
04,
000,
000
5000
fish
farm
ers a
nnua
lly tr
aine
d on
dee
p po
nd fi
sh p
rodu
ction
syste
mfa
mer
s25
,000
707,
000
707,
000
707,
000
707,
000
700,
000
3,52
8,00
0
5000
0 fo
dder
tree
s pla
nted
amon
gst
farm
ers
trees
50,0
002,
500
2,50
02,
500
2,50
02,
500
12,5
00
8 po
nd o
r cag
e cu
lture
sche
mes
esta
blish
edsc
hem
es8
50,0
0097
,777
97,7
7797
,777
97,7
7744
1,10
8An
nual
dist
rict a
gricu
ltura
l fai
rs u
nder
take
nfa
irs14
042
0,00
042
0,00
042
0,00
042
0,00
042
0,00
02,
100,
000
Inpu
ts su
pplie
d to
farm
ers f
or
dem
onstr
atio
n pu
rpos
eslu
mp
sum
51,
270,
000
1,27
0,00
01,
270,
000
1,27
0,00
01,
270,
000
6,35
0,00
0
D24
5 va
lue
addi
tion
grou
ps fo
rmed
grou
ps24
524
,500
24,5
0024
,500
24,5
0024
,500
122,
500
2930
FO’s
train
ed o
n pr
oces
sing
FO’s
2,93
060
0,00
073
0,00
078
0,00
052
0,00
030
0,00
02,
930,
000
410,
000
farm
ers t
rain
ed an
nual
ly on
pos
t-ha
rves
t man
agem
ent
farm
ers
2,05
0,00
041
0,00
041
0,00
041
0,00
041
0,00
041
0,00
02,
050,
000
Equi
pmen
t dist
ribut
ed fo
r red
ucin
g po
st-ha
rves
t los
ses
equi
pmen
t2,
050,
000
41,3
00,0
0041
,300
,000
41,3
00,0
0041
,300
,000
41,3
00,0
0020
6,50
0,00
0

150
National Agricultural Investment Plan
Inte
rven
tion
Area
9 (P
art 2
– E
ffici
ent r
esea
rch
part
ners
hips
)IO
PO
utpu
tsUn
itTa
rget
Cost
Y1
Cost
Y2
Cost
Y3
Cost
Y4
Cost
Y5
Tota
l cos
tEf
ficie
nt re
sear
ch p
artn
ersh
ips
A2
tech
nolo
gy re
leas
e sta
keho
lder
m
eetin
gs co
nduc
ted
annu
ally
mee
tings
1041
,904
41,9
0441
,904
41,9
0441
,904
209,
522
ARET
dive
rsifi
catio
n pl
an d
evel
oped
study
10
50,0
000
00
50,0
00
Capa
city o
f nat
iona
l rep
osito
ry ce
ntre
s (p
lant
, live
stock
, fish
erie
s gen
etics
) up
grad
ed
lum
p su
m1
00
150,
000
00
150,
000
MIR
T stre
ngth
ened
lum
p su
m1
050
,000
00
050
,000
Rese
arch
coor
dina
tion
activ
ities
un
derta
ken
mee
tings
2062
,000
52,0
0042
,000
32,0
0032
,000
220,
000
Rese
arch
gra
nts p
rovid
ed to
50
stude
nts
stude
nts
5010
0,00
010
0,00
010
0,00
010
0,00
010
0,00
050
0,00
0
BAn
imal
Gen
etic
Reso
urce
s Cen
tre
esta
blish
edlu
mp
sum
20
200,
000
00
020
0,00
0
Germ
plas
m co
nser
ved
spec
ies
3,00
033
,496
33,4
9682
,384
82,3
8482
,384
314,
144
Mal
awi P
lan
Gene
tic C
entre
re
furb
ished
lum
p su
m1
083
,809
00
083
,809
C18
micr
o-nu
trien
t bio
-forti
fied
crop
s de
velo
ped
tech
nolo
gies
1828
9,68
228
9,68
233
9,68
233
9,68
233
9,68
21,
598,
410
abou
t 10
new
varie
ties o
r tec
hnol
ogie
s de
velo
ped
& re
leas
ed an
nual
lyte
chno
logi
es10
17,0
00,0
0017
,000
,000
17,0
00,0
0017
,000
,000
17,0
00,0
0085
,000
,000
abou
t 450
00 o
n-fa
rm p
artic
ipat
ory
dem
os o
n GA
P co
nduc
ted
annu
ally
dem
os22
9,00
097
8,00
01,
020,
000
1,38
0,00
01,
476,
000
2,01
6,00
06,
870,
000
abou
t 5 fe
ed te
chno
logi
es d
evel
oped
an
nual
lyte
chno
logi
es5
204,
000
204,
000
204,
000
204,
000
204,
000
1,02
0,00
0
Deta
iled
anal
ysis
of si
te-sp
ecifi
c co
nstra
ints
affe
cting
ag p
erfo
rman
ce
lum
p su
m5
1,00
0,00
01,
000,
000
1,00
0,00
01,
000,
000
1,00
0,00
05,
000,
000
Gran
d To
tal
321,
196
83,1
27,8
1984
,062
,254
83,7
89,0
2684
,283
,185
96,8
98,5
9843
2,16
0,88
1

151
National Agricultural Investment Plan
Inte
rven
tion
Area
10
IOP
Out
puts
Unit
Targ
et
Cost
Y1
Cost
Y2
Cost
Y3
Cost
Y4
Cost
Y5
Tota
l cos
tEf
ficie
nt se
ed su
pply
syst
ems e
stab
lishe
d A
Impo
rt pr
oced
ures
sim
plifi
ed
lum
p su
m1
150,
000
75,0
0015
0,00
00
037
5,00
0Pr
oced
ures
for r
elea
sing
new
varie
ties
revis
ed an
d str
eam
lined
(bla
nk)
30,0
0030
,000
00
060
,000
Seed
bill
pas
sed
lum
p su
m1
29,3
3329
,333
00
058
,666
Sem
i-aut
onom
ous S
eed
Serv
ices U
nit
esta
blish
edlu
mp
sum
184
6,15
242
3,07
60
00
1,26
9,22
8
C90
0,00
0 fa
rmer
s ann
ually
rece
iving
vo
uche
r for
legu
me
seed
subs
idy
farm
ers
4,50
0,00
06,
480,
000
6,48
0,00
06,
480,
000
6,48
0,00
06,
480,
000
32,4
00,0
00
900,
000
farm
ers a
nnua
lly re
ceivi
ng
vouc
her f
or m
aize
seed
subs
idy
farm
ers
4,50
0,00
02,
250,
000
2,25
0,00
02,
250,
000
2,25
0,00
02,
250,
000
11,2
50,0
00
950
com
mun
ity se
ed b
anks
esta
blish
edse
ed b
anks
950
69,0
0072
,600
77,4
0082
,200
85,8
0038
7,00
0FI
SP p
rogr
am im
plem
ente
dlu
mp
sum
511
5,00
011
5,00
011
5,00
011
5,00
011
5,00
057
5,00
0Ha
of s
eed
mul
tiplic
atio
n fie
lds
insp
ecte
d by
SSU
incr
ease
d fro
m
15,0
00 to
25,
000
ha10
7,55
515
5,55
017
0,00
020
0,00
025
0,00
030
0,00
01,
075,
550
Impo
rt pr
oced
ures
sim
plifi
ed
certi
ficat
es50
,000
140,
000
140,
000
140,
000
140,
000
140,
000
700,
000
Nurs
erie
s for
tree
s and
vege
tabl
es
esta
blish
edha
759,
750
29,7
509,
750
9,75
09,
750
68,7
50
Quan
titie
s of b
asic
seed
pro
duce
d in
crea
sed
from
105
to 3
25 M
T ann
ually
MT
2,50
531
,395
89,7
0014
9,50
020
9,30
026
9,10
074
8,99
5
Quan
titie
s of s
eed
mul
tiplie
d by
fa
rmer
sM
T13
,000
269,
750
330,
980
357,
690
367,
600
884,
590
2,21
0,61
0
FISP
refo
rms a
dvan
ced
AFI
SP re
form
opt
ions
mon
itore
d an
d di
scus
sed
amon
gst s
take
hold
ers
lum
p su
m5
175,
000
175,
000
175,
000
175,
000
175,
000
875,
000
FISP
refo
rm o
ptio
ns p
ilote
dlu
mp
sum
526
5,00
026
5,00
026
5,00
026
5,00
026
5,00
01,
325,
000
MT
3,00
050
0,00
050
0,00
050
0,00
050
0,00
050
0,00
02,
500,
000
FISP
refo
rm o
ptio
ns st
udie
dstu
dies
215
0,00
010
0,00
00
00
250,
000

152
National Agricultural Investment Plan
IOP
Out
puts
Unit
Targ
et
Cost
Y1
Cost
Y2
Cost
Y3
Cost
Y4
Cost
Y5
Tota
l cos
tLi
vest
ock
and
fishe
ries g
enep
ool i
mpr
oved
and
bre
edin
g st
ock
mad
e av
aila
ble
to fa
rmer
sA
Lives
tock
cons
erva
tion
prot
ocol
s de
velo
ped
lum
p su
m1
10,0
0010
,000
10,0
0010
,000
10,0
0050
,000
C# l
ivesto
ck ar
tificia
lly in
sem
inat
ed
annu
ally i
ncre
ased
from
100
00 to
600
00in
sem
inat
ions
300,
000
3,11
2,85
76,
062,
857
9,06
2,85
712
,062
,857
18,0
62,8
5748
,364
,285
5 m
illio
n fin
gerli
ngs p
rodu
ced
annu
ally
finge
rling
s25
,000
,000
1,29
4,88
91,
334,
889
1,33
4,88
91,
330,
000
1,33
0,00
06,
624,
667
5 m
illio
n fin
gerli
ngs r
esto
cked
an
nual
lyfin
gerli
ngs
25,0
00,0
001,
291,
904
1,29
1,90
41,
291,
904
1,29
1,90
41,
291,
904
6,45
9,52
0
Heife
r pas
s-on
sche
me
lives
tock
1,40
020
1,12
030
1,68
050
2,80
058
6,60
075
4,20
02,
346,
400
Lives
tock
bre
edin
g an
imal
s sou
rced
incre
ased
from
345
0 to
100
00 an
nual
lyliv
esto
ck20
,750
6,17
6,70
06,
752,
000
6,37
7,50
06,
452,
800
6,50
3,00
032
,262
,000
Lives
tock
cons
erva
tion p
roto
cols
deve
loped
lum
p su
m1
750,
000
500,
000
00
01,
250,
000
Live
stoc
k/fis
herie
s bre
edin
gB
Smal
l sto
ck m
ultip
licat
ion
thro
ugh
farm
er b
reed
ers
goat
s1,
000
1,57
8,79
81,
578,
798
1,57
8,79
81,
578,
798
1,57
8,79
87,
893,
988
Supp
ly ch
ains
for o
rgan
ic an
d in
-org
anic
ferti
liser
stre
ngth
ened
A3
soil
labs
refu
rbish
edla
bs3
488,
885
509,
838
509,
838
20,9
520
1,52
9,51
3Se
mi-a
uton
omou
s fer
tilise
r reg
ulat
ory
body
esta
blish
edag
ency
124
,444
097
7,77
10
01,
002,
215
B2
mill
ion
farm
ers/y
ear p
rodu
ce
man
ure/
inor
gani
c fer
tilise
r fa
rmer
s10
,000
,000
1,01
9,04
51,
019,
045
1,01
9,04
51,
019,
045
1,01
9,04
55,
095,
223
Inve
stiga
te o
ptio
ns fo
r fer
tilise
r pr
oduc
tion
and
trans
port
lum
p su
m1
020
0,00
00
00
200,
000
Natio
nal s
oil m
aps u
pdat
edm
aps
870
2,14
070
2,14
036
6,90
436
6,90
436
6,90
42,
504,
994
Pesti
cides
Con
trol B
oard
stre
ngth
ened
lum
p su
m1
050
,000
50,0
0050
,000
015
0,00
0C
300
ferti
liser
sam
ples
anal
ysed
annu
ally
sam
ples
1,50
012
1,00
012
1,00
012
1,00
012
1,00
012
1,00
060
5,00
0
900,
000
farm
ers a
nnua
lly re
ceive
vo
uche
r for
ferti
liser
subs
idy
farm
ers
4,50
0,00
037
,350
,000
37,3
50,0
0037
,350
,000
37,3
50,0
0037
,350
,000
186,
750,
000
Area
-spec
ific f
ertil
iser
reco
mm
enda
tions
dev
elop
edm
aps
1021
1,29
619
1,29
619
1,29
643
5,74
143
5,74
11,
465,
370
Gran
d To
tal
2,53
3,54
765
,999
,008
69,2
50,8
8571
,613
,941
73,5
20,4
5180
,297
,689
360,
681,
974

153
National Agricultural Investment Plan
Inte
rven
tion
Area
11
IOP
Out
puts
Unit
Targ
et
Cost
Y1
Cost
Y2
Cost
Y3
Cost
Y4
Cost
Y5
Tota
l cos
t
Agro
-fore
stry
are
as e
xpan
ded
and
man
agem
ent c
apac
ities
enh
ance
dA
Lega
l fra
mew
ork f
or ag
ro-fo
restr
y dev
& in
cent
ive m
echa
nism
s ide
ntifi
ed.
studi
es1
25,0
0025
,000
100,
000
75,0
0025
,000
250,
000
Tree-
cove
r den
sity o
n ag
ricul
tura
l lan
d es
tabl
ished
at n
atio
nal l
evel
studi
es1
750,
000
075
,000
150,
000
150,
000
1,12
5,00
0
BTra
inin
gs in
agro
-fore
stry p
racti
ces
farm
ers
750,
000
350,
000
350,
000
350,
000
350,
000
350,
000
1,75
0,00
0fa
rmer
man
aged
nat
ural
gen
erat
ion
tree-
plan
ted
area
s esta
blish
edha
2,00
056
0,00
056
0,00
056
0,00
056
0,00
056
0,00
02,
800,
000
Min
i-nur
serie
s esta
blish
ed/w
ell m
anag
ednu
rser
ies
22,5
002,
550,
000
2,55
0,00
02,
550,
000
2,55
0,00
02,
550,
000
12,7
50,0
0030
,000
ha/2
500k
m ri
ver b
anks
pla
ntha
30,0
0018
0,00
018
0,00
018
0,00
018
0,00
018
0,00
090
0,00
0La
ke a
nd ri
vers
fish
erie
s res
ourc
es a
re e
fficie
ntly
ad
sust
aina
bly
man
aged
AAn
nual
cens
us fi
sh/a
quat
ic en
viron
men
tsu
rvey
511
9,84
111
9,84
111
9,84
111
9,84
111
9,84
159
9,20
4
Fishe
ries m
aste
rpla
n de
velo
ped
studi
es1
00
020
0,00
00
200,
000
Fishe
ries m
aste
rpla
n de
velo
ped
studi
es1
4,88
94,
889
4,88
94,
889
4,88
924
,444
Lega
l/reg
ulat
ory f
ram
ewor
k for
fish
erie
s m
anag
emen
t rev
ised/
stren
gthe
ned
lum
p su
m1
422,
236
244,
443
555,
475
230,
475
230,
475
1,68
3,10
3
BHI
V/AI
DS b
asel
ine
data
diss
emin
ate
studi
es1
6,98
426
,984
6,98
46,
984
6,98
454
,920
CFis
her f
olk (
+wo
men
/ you
th tr
aine
d)fis
herm
en50
,000
730,
000
750,
000
754,
889
754,
889
734,
889
3,72
4,66
7Fis
herie
s tec
hs d
evel
oped
/ ana
lysed
lum
p su
m5
117,
714
114,
222
114,
222
114,
222
114,
222
574,
602
D20
Fish
erie
s lan
ding
site
s/mar
ketin
g fa
ciliti
es +
2 d
ocki
ng st
atio
ns e
stabl
ished
.fa
ciliti
es22
279,
363
174,
602
174,
602
453,
965
174,
602
1,25
7,13
4
Land
use
pla
nnin
g an
d zo
ning
upd
ated
and
impl
emen
tatio
n ca
pacit
y en
hanc
ed
BAg
ricul
tura
l/ pr
otec
ted
area
s zon
edha
82,5
002,
394,
214
1,67
2,21
41,
504,
596
1,49
7,61
21,
497,
612
8,56
6,24
6Di
strict
nat
ural
reso
urce
man
agem
ent
com
mitt
ee
com
mitt
ee14
025
3,96
825
3,96
825
3,96
825
3,96
825
3,96
81,
269,
841
Sust
aina
ble
use
and
man
agem
ent o
f wat
er re
sour
ces
B1
deep
wel
l esta
blish
ed p
er d
istric
twe
lls28
024
5,00
024
5,00
024
5,00
024
5,00
098
0,00
0

154
National Agricultural Investment Plan
IOP
Out
puts
Unit
Targ
et
Cost
Y1
Cost
Y2
Cost
Y3
Cost
Y4
Cost
Y5
Tota
l cos
t
Wat
er re
sour
ces a
re m
anag
ed a
nd u
sed
sust
aina
bly
B15
00 li
vesto
ck w
ater
ing
poin
tspo
ints
1,50
075
,000
75,0
0075
,000
75,0
0075
,000
375,
000
Farm
ers t
rain
ed o
n ra
in w
ater
har
vesti
ngfa
rmer
s1,
000,
000
50,0
0050
,000
50,0
0050
,000
50,0
0025
0,00
03
dam
s con
struc
ted
per d
istric
tda
ms
842,
000,
000
2,00
0,00
02,
000,
000
2,00
0,00
040
0,00
08,
400,
000
Catch
men
t are
a man
agem
ent s
treng
then
ed
ha1,
000,
000
1,46
6,73
81,
419,
277
1,17
5,78
772
1,82
21,
151,
343
5,93
4,96
6
Rain
wate
r har
vesti
ng/so
il m
oistu
re
man
agem
ent t
echs
fa
rmer
s1,
000,
000
2,25
2,82
42,
252,
824
2,25
2,82
42,
252,
824
2,25
2,82
411
,264
,118
Gran
d To
tal
238,
902
14,5
88,7
7013
,068
,263
13,1
03,0
7512
,846
,489
11,1
26,6
4764
,733
,245
Inte
rven
tion
Area
12
IOP
Out
puts
Unit
Targ
et
Cost
Y1
Cost
Y2
Cost
Y3
Cost
Y4
Cost
Y5
Tota
l cos
tAr
ea u
nder
func
tiona
l irr
igat
ion
syst
ems i
ncre
ased
ACa
pacit
y for
pla
nnin
g an
d im
plem
enta
tion
of ir
rigat
ion
work
and
sche
me
man
agem
ent
stren
gthe
ned
at n
atio
nal l
evel
lum
p su
m2
105,
793
105,
793
105,
793
105,
793
105,
793
528,
965
C36
,800
ha o
f irri
gatio
n sc
hem
es ar
e de
velo
ped
ha36
,800
65,8
02,7
4569
,591
,945
73,3
81,1
4577
,170
,345
81,9
06,8
4536
7,85
3,02
55,
100
ha o
f irri
gatio
n sc
hem
es ar
e re
habi
litat
edha
5,10
02,
375,
841
3,29
8,24
14,
681,
841
6,06
5,44
17,
449,
041
23,8
70,4
05Irr
igat
ion
sche
mes
are
pro
perly
man
aged
and
mai
ntai
ned
acco
rdin
g to
thei
r eco
nom
ic po
tent
ial
ACo
des o
f con
duct
for i
rriga
tion
man
agem
ent
deve
lope
d an
d th
eir i
mpl
emen
tatio
n m
onito
red
plan
s1,
200
62,9
5242
,000
42,0
0042
,000
42,0
0023
0,95
2
WUA
Act
enac
ted
lum
p su
m1
050
,000
00
050
,000
C10
0 irr
igat
ion
asso
ciatio
ns tr
aine
d an
nual
lyFO
’s50
050
,000
50,0
0050
,000
50,0
0050
,000
250,
000
64 n
ew W
UAs e
stabl
ished
and
all e
xistin
g W
UAs t
rain
ed an
nual
lyW
UAs
1,23
043
,280
46,4
8049
,680
52,8
8056
,080
248,
400
Adva
nced
ext
ensio
n se
rvice
s pro
vided
to
farm
ers i
n irr
igat
ed ar
eas
ha8,
000
487,
321
502,
321
532,
321
532,
321
517,
321
2,57
1,60
5
D50
0 m
atch
ing
gran
ts di
sbur
sed
for i
rriga
tion
inve
stmen
tsgr
ants
500
104,
761
104,
761
104,
761
104,
761
104,
761
523,
806
Irrig
atio
n fa
rmer
s lin
ked
to m
arke
ts an
d fin
ance
linka
ges
5066
,349
66,3
4966
,349
66,3
4966
,349
331,
744
Gran
d To
tal
7,83
569
,099
,042
73,8
57,8
9079
,013
,890
84,1
89,8
9090
,298
,190
396,
458,
902

155
National Agricultural Investment Plan
Inte
rven
tion
Area
13
IOP
Out
puts
Unit
Targ
et
Cost
Y1
Cost
Y2
Cost
Y3
Cost
Y4
Cost
Y5
Tota
l cos
tAv
aila
bilit
y an
d qu
ality
of m
echa
niza
tion
equi
pmen
t and
serv
ices e
nhan
ced
CDr
augh
t ani
mal
serv
ices i
mpr
oved
anim
als
197
115,
836
115,
836
115,
836
115,
836
115,
836
579,
180
Gove
rnm
ent m
echa
niza
tion
sche
mes
mak
e m
ore
tracto
rs an
d CA
-com
plia
nt ri
pper
s ava
ilabl
e to
fa
rmer
s
equi
pmen
t72
544,
112
328,
224
78,2
2432
8,22
457
8,22
41,
857,
008
Ince
ntive
s pro
vided
to in
crea
se im
porta
tion
of
tracto
rs an
d CA
impl
emen
ts by
priv
ate
secto
rtra
ctors
500
8,00
6,98
58,
006,
985
8,00
6,98
58,
006,
985
8,00
6,98
540
,034
,925
DFe
asib
ility
stud
y on
mac
hine
ry fu
nd co
nduc
ted
studi
es1
50,0
000
00
050
,000
Know
ledg
e an
d sk
ills o
f pro
vide
rs a
nd u
sers
of m
echa
niza
tion
serv
ices s
treng
then
edA
Stan
dard
s for
safe
ty m
easu
res a
nd sa
fegu
ards
de
velo
ped
stand
ard
113
,968
13,9
6813
,968
13,9
6813
,968
69,8
40
C30
0 m
echa
niza
tion
dem
os co
nduc
ted
dem
os30
041
,880
41,8
8041
,880
41,8
8041
,880
209,
400
425
Heal
th an
d sa
fety
trai
ning
s con
ducte
dfa
rmer
s42
52,
508,
750
2,51
3,12
52,
513,
125
2,51
7,50
02,
521,
875
12,5
74,3
7575
0 m
achi
nery
ope
rato
rs/m
echa
nics
trai
ned
artis
ans
750
20,0
0020
,000
20,0
0020
,000
20,0
0010
0,00
0Gr
and
Tota
l28
611
,301
,531
11,0
40,0
1810
,790
,018
11,0
44,3
9311
,298
,768
55,4
74,7
28

156
National Agricultural Investment Plan
Inte
rven
tion
Area
14
IOP
Out
puts
Unit
Targ
et
Cost
Y1
Cost
Y2
Cost
Y3
Cost
Y4
Cost
Y5
Tota
l cos
tDo
mes
tic m
arke
t acc
ess i
mpr
oved
D5,
000
km o
f rur
al fe
eder
road
s reh
abili
tate
d/up
grad
edkm
s5,
000
50,0
00,0
0050
,000
,000
50,0
00,0
0050
,000
,000
50,0
00,0
0025
0,00
0,00
0
7500
km o
f rur
al fe
eder
road
s spo
t-im
prov
edkm
s7,
500
18,7
50,0
0018
,750
,000
18,7
50,0
0018
,750
,000
18,7
50,0
0093
,750
,000
Rura
l col
d sto
rage
facil
ities
esta
blish
edM
T5,
000
1,81
1,42
71,
811,
427
1,81
1,42
71,
811,
427
1,81
1,42
79,
057,
134
Rural
mark
et fac
ilities
estab
lishe
d and
reha
bilita
tedfa
ciliti
es25
11,
050,
950
1,25
7,93
31,
501,
201
1,37
4,66
51,
490,
000
6,67
4,74
9
Rura
l mar
ket f
acili
ties r
ehab
ilita
ted
cent
res
316
3,00
0,00
03,
000,
000
3,00
0,00
03,
000,
000
3,80
0,00
015
,800
,000
Effe
ctiv
enes
s, sc
ope
and
fairn
ess o
f con
tract
farm
ing
impr
oved
C
Capa
city o
f FOs
to e
ngag
e in
cont
ract
farm
ing
enha
nced
FO’s
550
196,
600
198,
100
197,
100
197,
600
196,
100
985,
500
Cont
ract
Farm
ing
strat
egy d
issem
inat
ed /
stake
hold
ers s
ensit
ised
FO’s
1,00
019
6,70
024
6,70
024
6,70
024
6,70
019
6,70
01,
133,
500
Incr
ease
d nu
mbe
r of f
arm
ers o
pera
ting
unde
r co
ntra
ct fa
rmin
g ar
rang
emen
tsfa
rmer
s10
0,00
039
7,80
039
7,80
039
7,80
039
7,80
039
7,80
01,
989,
000
Enab
ling
envi
ronm
ent f
or a
gri-fi
nanc
e st
reng
then
ed a
nd sp
ecifi
c pol
icy in
stru
men
ts e
stab
lishe
d.A
Incr
ease
d in
crem
enta
l val
ue o
f war
ehou
se
rece
ipt fi
nanc
ing
lum
p su
m5
100,
000
00
00
100,
000
MAR
KET I
NFO
avai
labi
lity
and
use
enha
nced
AIC
T-bas
ed m
arke
t info
rmati
on sy
stem
oper
ation
alsy
stem
s1
978,
888
978,
888
978,
888
978,
888
978,
888
4,89
4,44
2C
Farm
ers a
ble
to ac
cess
and
use
mar
ket
info
rmat
ion
syste
ms
farm
ers
1,50
0,00
061
3,96
81,
100,
000
1,61
3,96
82,
100,
000
3,11
3,96
88,
541,
904
Regi
onal
and
inte
rnat
iona
l tra
de fa
cilita
ted
ABa
rcod
e in
stitu
tion
esta
blish
edin
stitu
tion
10
00
062
,857
62,8
57Go
vern
men
t sta
ff tra
ined
on
trade
issu
eslu
mp
sum
122
5,93
622
5,93
622
5,93
622
5,93
622
5,93
61,
129,
678
Non-
trade
bar
rier d
atab
ase
esta
blish
edda
taba
se1
025
3,76
80
00
253,
768
Trade
ban
s and
non
-trad
e ba
rrier
s red
uced
lum
p su
m1
158,
612
158,
612
158,
612
158,
612
158,
612
793,
060
Trade
-rela
ted
polic
ies u
pdat
edlu
mp
sum
136
6,58
636
8,05
336
9,51
924
0,94
224
0,94
21,
586,
042
DAc
tive i
nter
natio
nal tr
ade p
rom
otio
n un
derta
ken
lum
p su
m1
2,03
1,56
32,
129,
340
2,22
7,11
71,
757,
787
1,73
8,23
19,
884,
037
Scop
e an
d ef
ficie
ncy
of C
omEX
and
WR
syst
ems e
nhan
ced
AIn
crea
sed
incr
emen
tal v
alue
of w
areh
ouse
re
ceip
t fina
ncin
gUS
D50
,000
,000
295,
566
345,
566
295,
566
295,
566
295,
566
1,52
7,83
1

157
National Agricultural Investment Plan
IOP
Out
puts
Unit
Targ
et
Cost
Y1
Cost
Y2
Cost
Y3
Cost
Y4
Cost
Y5
Tota
l cos
tD
400,
000
MT a
dditi
onal
qua
lity s
tora
ge
capa
city e
stabl
ished
MT
400,
000
26,8
50,0
0026
,780
,000
18,9
50,0
0015
,050
,000
11,1
50,0
0098
,780
,000
Farm
ers a
nd S
MEs
trai
ned
in w
areh
ouse
re
ceip
t sys
tem
s and
com
mod
ity e
xcha
nges
entit
ies
500
100,
000
100,
000
100,
000
175,
000
175,
000
650,
000
Incr
ease
d in
crem
enta
l val
ue o
f war
ehou
se
rece
ipt fi
nanc
ing
entit
ies
1,55
11,
075,
548
2,05
3,31
92,
542,
204
2,54
2,20
42,
542,
204
10,7
55,4
80
Tran
spar
ent a
nd ru
les-
base
d m
arke
t and
trad
e po
licie
sA
ADM
ARC
succ
essfu
lly re
form
edstu
dies
21,
100,
000
1,00
0,00
00
00
2,10
0,00
0An
alyt
ical c
apac
ity st
reng
then
edtra
inin
gs6
75,6
4475
,644
75,6
4415
,644
15,6
4425
8,22
2Pr
icing
pol
icy d
evel
oped
polic
y1
100,
000
155,
873
00
025
5,87
3Pr
ivate
secto
r con
sulta
tion
mec
hani
sm
esta
blish
edm
eetin
gs25
192,
062
192,
062
192,
062
192,
062
192,
062
960,
311
Gran
d To
tal
2,32
1,09
110
9,66
7,85
011
1,57
9,02
010
3,63
3,74
599
,510
,834
97,5
31,9
3852
1,92
3,38
7

158
National Agricultural Investment Plan
Inte
rven
tion
Area
15
IOP
Out
puts
Unit
Targ
et
Cost
Y1
Cost
Y2
Cost
Y3
Cost
Y4
Cost
Y5
Tota
l cos
tAg
ribus
ines
s inv
estm
ent p
rom
otio
n an
d PP
Ps im
plem
ente
dD
36 ab
atto
irs (r
ural
/urb
an) e
stabl
ished
abat
toirs
3615
5,00
025
5,00
025
5,00
033
0,00
018
0,00
01,
175,
000
5 sp
ecia
l eco
nom
ic zo
nes f
or ag
ribus
ines
s dev
elop
edzo
nes
547
3,73
352
3,73
352
3,73
382
2,93
71,
237,
982
3,58
2,11
96
com
mod
ity va
lue
chai
n pl
atfo
rms e
stabl
ished
; ex
istin
g pl
atfo
rm fu
nctio
nal
plat
form
s10
622,
349
722,
349
822,
349
922,
349
1,02
2,34
94,
111,
745
Agro
-pro
cess
ors c
onne
cted
to e
lectr
ic.SM
Es75
1,20
0,00
02,
000,
000
2,00
0,00
01,
200,
000
1,10
0,00
07,
500,
000
Inve
stmen
t com
mitm
ents
unde
r New
Alli
ance
fully
im
plem
ente
dpe
rcen
t10
029
,600
,000
29,6
00,0
0029
,600
,000
29,6
00,0
0029
,600
,000
148,
000,
000
Annu
al ag
ribus
ines
s inv
estm
ent/f
ora a
nd fa
irs at
na
tiona
l and
dist
rict l
evel
slu
mp
sum
519
0,00
019
0,00
019
0,00
019
0,00
019
0,00
095
0,00
0
Enab
ling
agrib
usin
ess e
nviro
nmen
t and
pub
lic-p
rivat
e di
alog
ue st
reng
then
edA
Reg
. fra
mew
ork +
supp
ort i
nstit
utio
ns fo
r cot
ton/
toba
cco
stren
gthe
ned
lum
p su
m1
70,0
0017
0,00
017
0,00
020
,000
70,0
0050
0,00
0
High
-leve
l pub
lic-p
rivat
e co
ordi
natio
n fo
rum
s es
tabl
ished
and
effe
ctive
mee
tings
2054
,000
54,0
0054
,000
54,0
0054
,000
270,
000
Natio
nal A
gricu
ltura
l Fai
r gro
unds
and
cent
re fo
r ex
celle
nce
esta
blish
ed
lum
p su
m1
00
200,
000
100,
000
100,
000
400,
000
Tax a
nd n
on-ta
x inc
entiv
e mec
hani
sms d
evel
oped
lum
p su
m1
050
,000
100,
000
00
150,
000
Prin
ciple
s for
Res
pons
ible
Agr
icultu
ral I
nves
tmen
ts (P
RAI)
mai
nstre
amed
AAw
aren
ess c
reat
ion
and
outre
ach
activ
ities
cond
ucte
din
vestm
ents
2060
,000
50,0
0050
,000
50,0
0050
,000
260,
000
Proc
edur
es an
d gui
delin
es de
velop
ed an
d ado
pted
inve
stmen
ts20
150,
000
00
00
150,
000
Tech
nica
l and
Bus
ines
s Ski
lls o
f Coo
pera
tives
and
SM
Es in
agr
ibus
ines
s enh
ance
dD
150
train
ings
for c
oops
on
vario
us te
ch/b
usin
ess
aspe
cts o
f val
ue ad
d.lu
mp
sum
150
60,0
0060
,000
60,0
0060
,000
60,0
0030
0,00
0
Train
ings
for a
grib
usin
ess S
MEs
, wom
en, y
outh
on
tech
nica
l/bus
ines
sSM
Es30
013
0,00
014
0,00
014
0,00
014
0,00
014
0,00
069
0,00
0
Busin
ess m
ento
rshi
p fo
r 2,0
00 yo
uths
/ wom
en
agrib
usin
ess e
ntre
pren
eurs
facil
itate
dpe
ople
2,00
080
0,00
080
0,00
080
0,00
080
0,00
080
0,00
04,
000,
000
Train
ing
of S
MEs
SMEs
400
13,9
6813
,968
13,9
6813
,968
13,9
6869
,841
150 t
rainin
gs fo
r coo
ps in
agrib
usine
ss m
anag
emen
t lu
mp
sum
150
60,0
0060
,000
60,0
0060
,000
60,0
0030
0,00
0Gr
and
Tota
l10
633
,639
,050
34,6
89,0
5035
,039
,050
34,3
63,2
5434
,678
,299
172,
408,
705

159
National Agricultural Investment Plan
Inte
rven
tion
Area
16
IOP
Out
puts
Unit
Targ
et
Cost
Y1
Cost
Y2
Cost
Y3
Cost
Y4
Cost
Y5
Tota
l cos
tEn
ablin
g en
viro
nmen
t for
agr
i-fina
nce
stre
ngth
ened
and
spec
ific p
olicy
inst
rum
ents
est
ablis
hed.
AEs
tabl
ish m
ovab
le co
llate
ral r
egist
rysy
stem
110
0,00
00
00
010
0,00
0Fe
asib
ility
stud
ies a
nd e
xper
t con
sulta
tions
on
new
instr
umen
ts to
foste
r acc
ess t
o fin
ance
cond
ucte
dlu
mp
sum
510
0,00
00
00
010
0,00
0
Stre
ngth
en e
nabl
ing
envir
onm
ent
lum
p su
m5
010
0,00
00
00
100,
000
DFe
asib
ility
stud
ies a
nd e
xper
t con
sulta
tions
on
new
instr
umen
ts to
foste
r acc
ess t
o fin
ance
cond
ucte
dstu
dies
310
0,00
00
00
010
0,00
0
Feas
ibili
ty st
udie
s and
exp
ert c
onsu
ltatio
ns o
n ne
w in
strum
ents
to fo
ster a
cces
s to
finan
ce co
nduc
ted
studi
es3
150,
000
00
00
150,
000
Tech
nica
l ass
istan
ce, r
efina
nce
and
risk s
harin
g fa
ciliti
es
esta
blish
ed
lum
p su
m1
600,
000
7,50
0,00
012
,400
,000
400,
000
400,
000
21,3
00,0
00
Farm
ers,
wom
en a
nd y
outh
abl
e to
use
fina
ncia
l ser
vice
s effe
ctiv
ely
CFa
rmer
s, wo
men
and
yout
h gr
oups
capa
citat
ed o
n fin
ancia
l lite
racy
and
man
agem
ent s
kills
grou
ps60
060
0,00
060
0,00
060
0,00
060
0,00
060
0,00
03,
000,
000
Finan
cial l
itera
cy ca
mpa
igns
cond
ucte
dlu
mp
sum
526
,600
35,0
0042
,000
56,0
0014
0,00
029
9,60
0Fin
ancia
l lite
racy
cam
paig
ns co
nduc
ted
targ
etin
g 22
0,00
0 fa
rmer
slu
mp
sum
566
,285
64,1
900
00
130,
475
Inve
stm
ent s
uppo
rt pr
ovid
ed to
agr
ibus
ines
s SM
Es, w
ith p
riorit
y to
wom
en a
nd y
outh
D14
0 SM
Es (w
ith p
riorit
y to
wom
en an
d yo
uth)
annu
ally
rece
ive m
atch
ing
gran
ts fo
r bus
ines
s sta
rt-up
SM
Es70
058
6,04
458
6,04
458
6,04
458
6,04
458
6,04
42,
930,
219
50 S
MEs
(with
prio
rity t
o wo
men
and
yout
h) an
nual
ly re
ceive
d m
atch
ing
gran
ts fo
r bus
ines
s exp
ansio
n th
roug
h en
viron
men
tally
frie
ndly
inve
stmen
ts.
SMEs
250
500,
000
500,
000
500,
000
500,
000
500,
000
2,50
0,00
0
Gran
d To
tal
132
2,82
8,92
99,
385,
234
14,1
28,0
442,
142,
044
2,22
6,04
430
,710
,294

160
National Agricultural Investment Plan
Anne
x 5:
DCA
FS F
unde
d Pr
ojec
ts
Fina
ncie
rPr
ogra
m/ P
roje
ct N
ame
Budg
et (U
SD
Mill
ion)
Proj
ect
Perio
d Di
sbur
sem
ent L
ast
Year
USD
Mill
ion
Disb
urse
men
t to
date
(USD
Mill
ion)
Poss
ible
ca
rry
over
fo
r NAI
PW
BSh
ire R
iver B
asin
Man
agem
ent P
roje
ct12
5.00
020
12-2
018
20.8
370
.30
54.7
0W
BM
alaw
i Dro
ught
and
Resil
ienc
e Re
cove
ry P
roje
ct10
4.00
020
16-2
018
0.00
0.00
104.
00W
BM
alaw
i Flo
ods E
mer
genc
y Rec
over
y Pro
ject
80.0
0020
15-2
019
15.0
040
.00
40.0
0
DFID
Enha
ncin
g Co
mm
unity
Res
ilien
ce (C
limat
e Ch
ange
) 43
.474
N/A
10.6
435
.67
7.80
IFAD
SAPP
41.3
0320
12-2
021
2.96
11.7
229
.58
USAI
DUn
ited
in B
uild
ing
and
Adva
ncin
g Lif
e Ex
pecta
tions
(UBA
LE)
40.0
0020
14-2
019
10.2
912
.29
27.7
1Af
DBSI
VAP-
GAFS
P39
.600
2013
-201
86.
1018
.31
21.2
9US
AID
Agric
ultu
ral D
ivers
ifica
tion
38.0
0020
16 -2
021
0.00
3.11
34.8
9EU
Supp
ort t
o th
e im
plem
enta
tion
of th
e GB
A37
.200
2014
-201
90.
810.
8136
.39
EURu
ral R
oads
impr
ovem
ent P
rogr
am (R
rIMP)
37.1
0020
16-2
020
0.00
0.00
37.1
0RN
EAS
WAp
-SP
33.0
0020
13-2
017
3.85
7.69
25.3
1Fl
ande
rsSu
ppor
t to
ASW
Ap-S
P17
.900
2013
-202
09.
658.
25EU
Supp
ort t
o the
impl
emen
tatio
n of
the A
SWAp
(MDT
F+ ot
her t
echn
ical c
oope
ratio
n)32
.210
2013
-201
70.
1615
.60
16.6
1W
BAS
WAp
-SP
(Agr
icultu
ral S
ecto
r Wid
e App
roac
h - S
uppo
rt Pr
ojec
t) AF
130
.000
2012
-201
73.
3917
.01
12.9
9
WB
Agric
ultu
ral P
rodu
ctivit
y Pro
gram
for S
outh
ern
Afric
a (AP
PSA)
29
.800
2013
-201
94.
974.
6225
.18
IFAD
RLEE
P 25
.288
2009
-201
78.
0814
.54
10.7
5Af
DBAI
YAP
22.4
0020
12-2
017
0.00
22.4
0US
AID
Mal
awi I
mpr
oved
See
d Sy
stem
s and
Tech
nolo
gies
21.0
0020
14-2
018
6.00
12.9
08.
10DF
IDM
alaw
i Agr
icultu
re C
atal
ytic
Fund
(MAC
F)20
.953
2013
-202
14.
0111
.01
9.94
USAI
DNj
ira P
roje
ct20
.000
2014
-201
94.
268.
0012
.00
EUFa
rm In
com
e Di
vers
ifica
tion
Prog
ram
Pha
se II
(FID
P II)
19.0
8020
15-2
019
0.90
0.90
18.1
8Af
DBFC
RBSP
16.8
0020
17-2
018
0.00
16.8
0Iri
sh A
idAS
WAp
-SP
MDT
F15
.939
2013
-201
63.
9415
.94
0.00
RNE
NASF
AM S
trate
gic D
evel
opm
ent P
lan
III15
.380
2012
-201
72.
7711
.28
4.10
USAI
DSt
reng
then
ing
Agric
ultu
re an
d Nu
tritio
n Ex
tens
ion
Serv
ices
15.0
0020
15-2
020
0.44
3.50
11.5
0
UNDP
Gree
n Cl
imat
e Fu
nd12
.300
N/A
12.3
0RN
EW
e Ef
fect
- Mal
awi L
ake
Basin
Pro
gram
12.2
9220
14 - 2
019
1.72
5.51
6.78

161
National Agricultural Investment Plan
Fina
ncie
rPr
ogra
m/ P
roje
ct N
ame
Budg
et (U
SD
Mill
ion)
Proj
ect
Perio
d Di
sbur
sem
ent L
ast
Year
USD
Mill
ion
Disb
urse
men
t to
date
(USD
Mill
ion)
Poss
ible
ca
rry
over
fo
r NAI
IDM
alaw
i Oils
eeds
Sec
tor T
rans
form
atio
n Pr
ogra
m (M
OST)
11.8
3020
13-2
018
3.16
6.73
5.11
RNE
TLC
Man
agem
ent f
or A
dapt
atio
n to
Clim
ate
Chan
ge11
.230
2014
- 201
91.
785.
815.
42RN
EDe
velo
pmen
t Fun
d - S
usta
inab
le A
gricu
lture
Lead
Farm
er P
rogr
am10
.769
2014
- 201
92.
615.
055.
72Ge
rman
yM
ore
Inco
me
and
Empl
oym
ent i
n Ru
ral A
reas
(MIE
RA)
10.4
0020
15 - 2
019
0.00
3.80
6.60
Irish
Aid
Root
and
Tube
r Cro
ps fo
r Agr
icultu
ral T
rans
form
atio
n in
Mal
awi (
RTC-
ACTIO
N M
alaw
i) 10
.130
2016
-202
00.
001.
029.
11
Irish
Aid
Mal
awi S
eed
Indu
stry D
evel
opm
ent P
roje
ct Ph
ase
II (M
SIDP
II)
10.1
3020
16-2
020
0.00
1.02
9.11
USAI
DM
alaw
i Res
ilien
ce P
rogr
am10
.000
2016
-201
70.
0010
.00
0.00
DFID
DFID
-Dai
ry (S
HMPA
) + H
eife
r Int
erna
tiona
l9.
663
2014
-201
7 2.
836.
603.
06EU
Glob
al C
limat
e Ch
ange
Alli
ance
(GCC
A)8.
480
2015
-201
90.
000.
008.
48Ge
rman
yFo
od an
d Nut
rition
Secu
rity P
rogr
am (F
NSP)
(par
t of G
erm
an fu
nded
glob
al pr
ogra
m)
8.25
020
14-2
017
0.00
0.38
7.87
DFID
Mal
awi I
nnov
atio
n Ch
alle
nge
Fund
(MIC
F)8.
000
2013
-201
92.
053.
814.
20RN
EAI
CC - M
alaw
i Agr
icultu
re P
artn
ersh
ip (M
AP)
8.00
020
14 -2
019
1.42
3.35
4.65
WFP
Hom
e gr
own
scho
ol fe
edin
g to
supp
ort r
esili
ence
bui
ldin
g8.
000
2014
-201
70.
051.
146.
86Ge
rman
yGr
een
Inno
vatio
n Ce
ntre
s in
the A
gricu
lture
and
Food
Sec
tor
8.00
020
15 - 2
019
0.00
3.20
4.80
USAI
DFis
herie
s Int
egra
tion
of S
ocie
ty an
d Ha
bita
ts (F
ISH)
6.95
020
14 -0
193.
504.
562.
39FA
OSt
reng
then
ing
Com
mun
ity R
esili
ence
to C
limat
e Ch
ange
6.08
420
15-2
019
0.11
1.41
4.68
USAI
DBo
rlaug
Hig
her E
duca
tion
Agric
ultu
ral R
esea
rch
and
Deve
lopm
ent (
BHEA
RD)
6.00
020
13-2
018
2.30
4.30
1.70
Flan
ders
Mar
ketin
g Ca
pacit
y Bui
ldin
g Pr
ojec
t for
Sm
allh
olde
r Far
mer
s5.
850
2015
-202
01.
461.
464.
39JI
CAPr
ojec
t for
Pro
mot
ing
Catch
men
t Man
agem
ent A
ctivit
ies i
n M
iddl
e Sh
ire
(COV
AMS
II)5.
674
2013
-201
81.
494.
611.
07
Flan
ders
Mar
ketin
g Ca
pacit
y Bui
ldin
g Pr
ojec
t for
Sm
allh
olde
r Far
mer
s 4.
998
2015
-202
00.
000.
704.
30JI
CAEn
hanc
ing
Capa
city f
or M
ediu
m S
cale
Irrig
atio
n Sc
hem
e De
velo
pmen
t, O&
M4.
441
2015
-202
00.
531.
522.
92Fl
ande
rsSt
reng
then
ing
Farm
er O
rgan
izatio
ns an
d Ru
ral S
tructu
red
Trade
Mec
hani
sms
3.89
920
14-2
018
1.17
2.89
1.01
WFP
Food
Ass
istan
ce fo
r Ass
et C
reat
ion
Prog
ram
to S
uppo
rt Re
silie
nce
Build
ing
3.60
020
14-2
017
0.28
0.38
3.22
WFP
Purc
hase
for P
rogr
ess (
P4P)
to p
rom
ote
resil
ienc
e bu
ildin
g3.
346
2014
-201
70.
681.
122.
23EU
Prom
otin
g Re
spon
sible
Land
Gov
erna
nce
for S
usta
inab
le A
gricu
lture
in M
alaw
i3.
180
2015
-201
80.
000.
003.
18US
AID
New
Allia
nce
Polic
y Acc
eler
atio
n Su
ppor
t (NA
PAS)
Acti
vity
3.13
820
14 -2
017
1.08
1.18
1.96
FAO
Emer
genc
y sup
port
to sm
allh
olde
r far
mer
s affe
cted
by El
Niñ
o in
Sout
hern
Afri
ca2.
820
2016
-201
70.
000.
002.
82W
FPRu
ral R
esili
ence
(R4)
Initi
ative
2.58
020
14-2
017
0.10
0.15
2.43

162
National Agricultural Investment Plan
Fina
ncie
rPr
ogra
m/ P
roje
ct N
ame
Budg
et (U
SD
Mill
ion)
Proj
ect
Perio
d Di
sbur
sem
ent L
ast
Year
USD
Mill
ion
Disb
urse
men
t to
date
(USD
Mill
ion)
Poss
ible
ca
rry
over
fo
r NAI
PFA
OPe
sticid
e Ri
sk R
educ
tion
in M
alaw
i (FS
P)2.
550
2015
- 201
80.
001.
071.
48US
AID
ASW
Ap-S
P M
ulti
Dono
r Tru
st Fu
nd2.
500
2013
-201
80.
002.
500.
00JI
CASu
pple
men
tary
Bud
get (
WFP
)2.
500
2015
2.50
2.50
0.00
DFID
Supp
ort t
o Pr
ogra
m m
onito
ring
and
Eval
uatio
n2.
027
2011
-201
70.
691.
600.
43US
AID
Feed
the
Futu
re B
ridgi
ng A
ctivit
y2.
000
2016
-201
80.
003.
50-1
.50
Irish
Aid
Enha
ncin
g Sm
allho
lder
Prod
uctiv
ity an
d Re
turn
s thr
ough
Clim
ate S
mar
t Agr
icultu
re (C
SA)
1.94
020
16-2
021
0.23
0.23
1.71
Flan
ders
Agro
fore
stry F
ood
Secu
rity P
rogr
am II
1.82
020
13 - 2
018
0.47
0.57
1.25
Flan
ders
Righ
t to
Food
1.62
520
14 - 2
019
0.28
1.01
0.62
Flan
ders
Scal
ing
up R
adio
and
ICT’s
in e
nhan
cing
Exte
nsio
n De
liver
y1.
358
2014
- 201
90.
260.
900.
46FA
OEn
hanc
ed Ag
ricul
ture
Emer
genc
y Res
pons
e to t
ackle
the n
egat
ive ef
fects
of El
Niñ
o 1.
111
2016
- 201
80.
000.
001.
11
USAI
DDe
velo
pmen
t Cre
dit A
utho
rity (
DCA)
1.05
620
16 -2
021
0.00
1.10
-0.0
4US
AID
Deve
lopm
ent C
redi
t Aut
horit
y (DC
A)1.
052
2013
- 201
9N/
AN/
A
FAO
Stre
ngth
inte
grat
ed ad
apta
tion
plan
ning
and
impl
emen
tatio
n in
Sou
ther
n Af
rica s
mal
lhol
der a
g0.
855
2016
- 201
90.
000.
000.
85
Flan
ders
Supp
ort t
o Liv
esto
ck E
xten
sion
and
Train
ing
Serv
ices
0.84
520
12 - 2
015
0.00
0.16
0.69
Flan
ders
Asse
ssin
g/ e
nhan
cing
the
capa
city,
perfo
rman
ce/ i
mpa
ct of
plu
ralis
tic ag
ex
tens
ion
syste
m in
M.
0.50
420
16-2
019
0.00
0.19
0.31
FAO
Incr.
resil
ienc
e to
clim
ate
chan
ge in
the
fishe
ry se
ctor o
f sou
ther
n La
ke M
alaw
i an
d M
alom
be0.
470
2016
- 201
70.
000.
040.
43
AfDB
SIVA
P-AD
F0.
354
2013
- 201
80.
260.
09Fl
ande
rsSt
reng
then
ing
Distr
ict St
akeh
olde
r Pan
els F
or Im
prov
ed Ex
tens
ion
Serv
ice D
elive
ry.
0.26
020
13 -2
015
0.04
0.14
0.12
FAO
Stre
ngth
enin
g lin
kage
s bet
ween
smal
l acto
rs an
d bu
yers
in th
e Ro
ots a
nd
Tube
rs se
ctor i
n Af
rica
0.19
220
14 -
2018
0.00
0.12
0.07
FAO
Natio
nal A
dapt
atio
n Pl
ans -
Clim
ate
Smar
t Agr
icultu
re0.
074
2014
- 201
70.
030.
050.
03
FAO
Enha
nced
Cap
aciti
es fo
r Effe
ctive
Mob
iliza
tion/
Use
of R
esou
rces
for F
ood
Secu
rity a
nd N
utrit
ion
0.06
620
14 - 2
018
0.00
0.09
-0.0
3
Mar
y’ M
eals
Scho
ol Fe
edin
g Pr
ogra
m6.
090
2017
-201
80.
000.
006.
09
Chin
aTA
_ So
uth-
Sout
h Coo
pera
tion (
SSC)
with
the P
R Chi
na in
supp
ort o
f ASW
Ap: P
hase
II1.
139
2016
- 201
8NA
N/A
N/A
Tota
l11
72.8
4820
15.0
0014
2.20
442
2.55
674
8.10
1
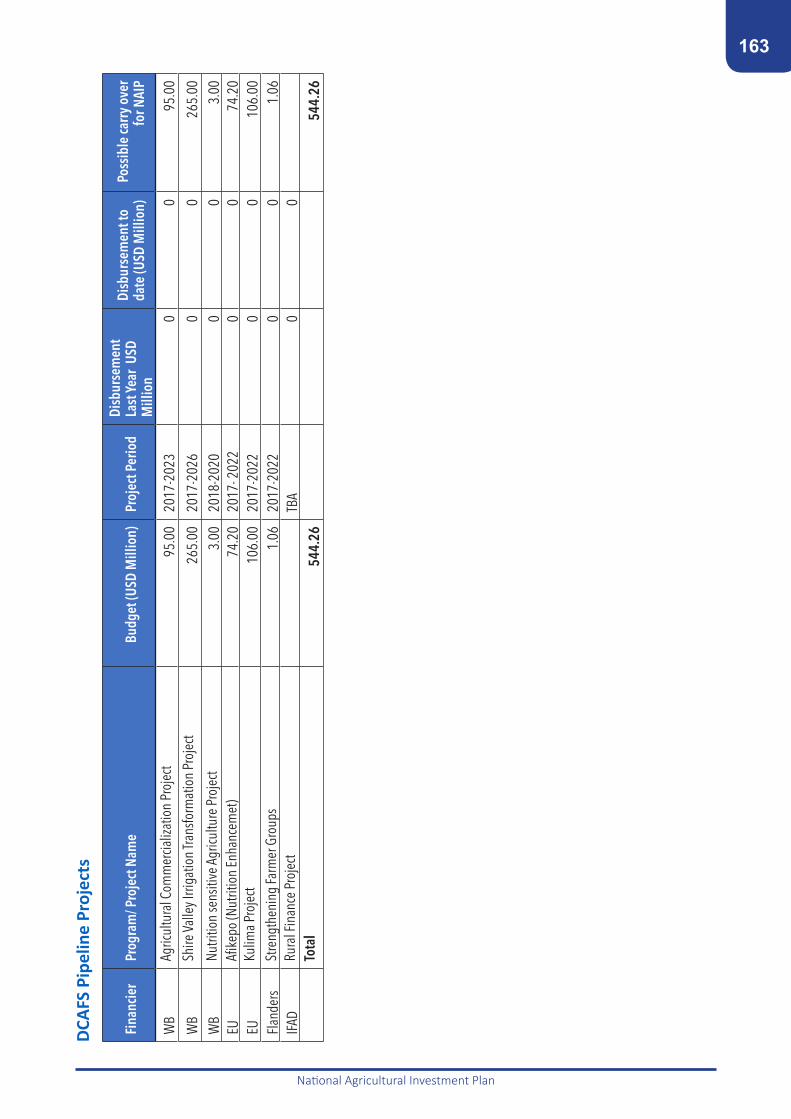
163
National Agricultural Investment Plan
DCAF
S Pi
pelin
e Pr
ojec
ts
Fina
ncie
rPr
ogra
m/ P
roje
ct N
ame
Budg
et (U
SD M
illio
n)Pr
ojec
t Per
iod
Disb
urse
men
t La
st Ye
ar U
SD
Mill
ion
Disb
urse
men
t to
date
(USD
Mill
ion)
Poss
ible
carr
y ov
er
for N
AIP
WB
Agric
ultu
ral C
omm
ercia
lizat
ion
Proj
ect
95.
00
2017
-202
30
0
9
5.00
WB
Shire
Valle
y Irri
gatio
n Tra
nsfo
rmat
ion
Proj
ect
265
.00
2017
-202
60
0
26
5.00
W
BNu
tritio
n se
nsiti
ve A
gricu
lture
Pro
ject
3
.00
2018
-202
00
0
3.00
EU
Afike
po (N
utrit
ion
Enha
ncem
et)
74.
20
2017
- 202
20
0
7
4.20
EU
Kulim
a Pro
ject
106
.00
2017
-202
20
0
10
6.00
Fl
ande
rsSt
reng
then
ing
Farm
er G
roup
s
1.0
6 20
17-2
022
00
1.
06
IFAD
Rura
l Fin
ance
Pro
ject
TBA
00
Tota
l
5
44.2
6
54
4.26

164
National Agricultural Investment Plan
Appe
ndix
5.1
: Map
ping
of D
CAFS
pro
ject
s by
NAI
P pi
llar
NAIP
pro
gram
Prog
ram
APr
ogra
m B
Prog
ram
CPr
ogam
me
DAS
WAp
sub-
prog
ram
Public mgt system
Capacity building
HIV & AIDS& Nutrition
Gender
Risk mgt
Diversification
Sustainable Lang mgt
Maize Sufficient
Irrigation and Water mgt
Results & mkt research
Framer-led extension
Agric. Exports
Agro-processing
Market dvpt
Total project Cost
Dono
rPr
ojec
t
WB
Shire
Rive
r Bas
in M
anag
emen
t Pr
ojec
t22
.875
20.1
25
10
.750
17
.375
9.37
544
.500
12
5.00
WB
Mal
awi D
roug
ht an
d Re
silie
nce
Reco
very
Pro
ject
3.00
0
55
.000
58.0
0
WB
Mal
awi F
lood
s Em
erge
ncy R
ecov
ery
Proj
ect
4.00
0
22
.000
26.0
0
DFID
Enha
ncin
g Co
mm
unity
Res
ilien
ce/
Clim
ate
Chan
ge
11.0
00
11.0
0022
.000
44.0
0
IFAD
SAPP
2.06
52.
891
0.00
02.
065
0.00
05.
782
0.00
00.
000
0.00
03.
717
24.7
820.
000
0.00
00.
0041
.30
USAI
DUn
ited
in B
uild
ing
and
Adva
ncin
g Lif
e Ex
pecta
tions
(UBA
LE)
4.
000
2.
000
4.00
016
.000
6.00
0
4.00
0
4.00
0
40.0
0
AfDB
SIVA
P-GA
FSP
7.
470
26.4
60
6.71
0
40.6
4US
AID
Agric
ultu
ral D
ivers
ifica
tion
0.93
818
.760
4.69
0
0.70
4
2.
345
3.75
211
.725
42.9
1EU
Supp
ort t
o th
e im
plem
enta
tion
of
the
GBA
2.97
64.
464
29.7
60
37.2
0
EURu
ral R
oads
impr
ovem
ent P
rogr
am
(RrIM
P)2.
412
2.41
2
32.2
7737
.10
RNE
ASW
Ap-S
P 2.
145
1.98
00.
017
0.01
70.
990
1.98
00.
541
10.8
970.
000
0.00
01.
201
0.00
00.
000
12.9
3632
.70
Flan
ders
Supp
ort t
o AS
WAp
-SP
4.
475
4.47
54.
475
4.
475
17.9
0EU
Supp
ort t
o th
e im
plem
enta
tion
of
the A
SWAp
(MDT
F+ o
ther
tech
nica
l co
oper
atio
n)
2.09
41.
933
0.16
10.
161
0.96
61.
933
0.52
810
.636
0.00
00.
000
1.17
20.
000
0.00
012
.626
32.2
1
WB
ASW
Ap-S
P (A
gricu
ltura
l Sec
tor W
ide
Appr
oach
- Sup
port
Proj
ect)
AF1
2.01
0
3.00
0
24
.990
30.0
0
WB
Agric
ultu
ral P
rodu
ctivit
y Pro
gram
fo
r Sou
ther
n Af
rica (
APPS
A)
14.8
702.
891
8.
582
3.45
7
29.8
0
IFAD
RLEE
P 2.
529
0.
000
1.51
70.
000
0.00
00.
000
0.00
00.
000
2.02
31.
517
0.00
010
.115
7.58
625
.29
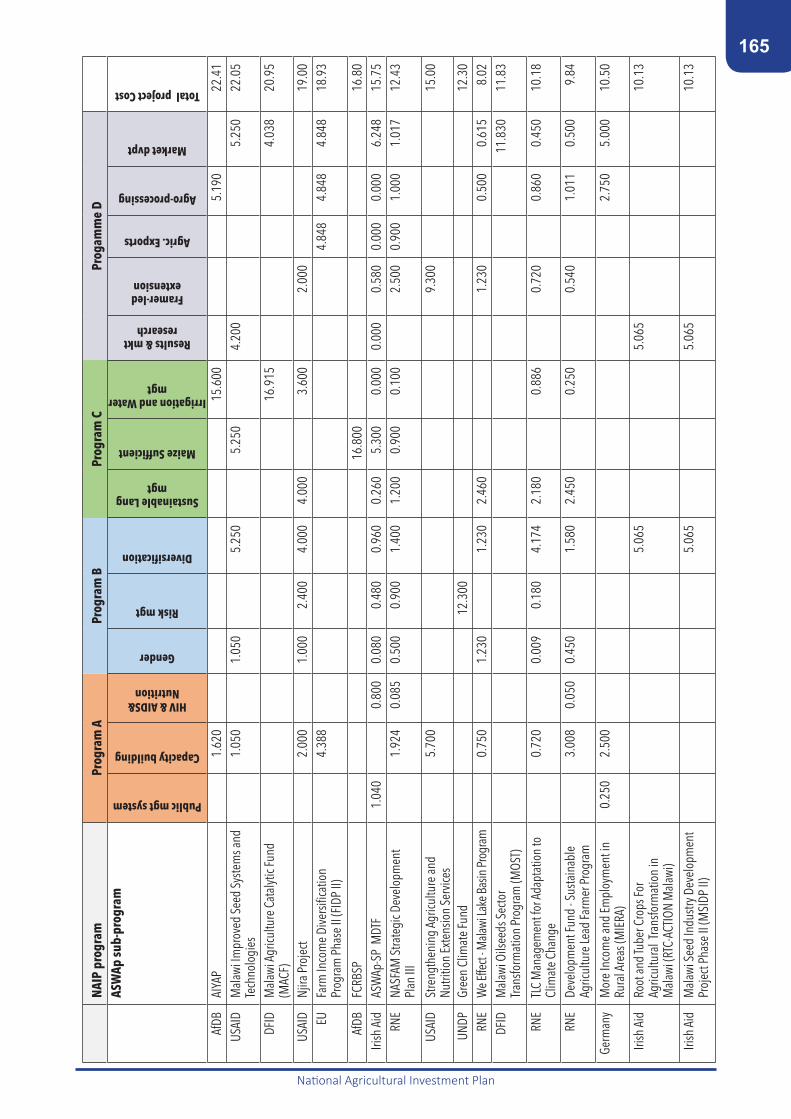
165
National Agricultural Investment Plan
NAIP
pro
gram
Prog
ram
APr
ogra
m B
Prog
ram
CPr
ogam
me
DAS
WAp
sub-
prog
ram
Public mgt system
Capacity building
HIV & AIDS& Nutrition
Gender
Risk mgt
Diversification
Sustainable Lang mgt
Maize Sufficient
Irrigation and Water mgt
Results & mkt research
Framer-led extension
Agric. Exports
Agro-processing
Market dvpt
Total project Cost
AfDB
AIYA
P
1.62
0
15
.600
5.
190
22
.41
USAI
DM
alaw
i Im
prov
ed S
eed
Syste
ms a
nd
Tech
nolo
gies
1.
050
1.
050
5.
250
5.
250
4.
200
5.
250
22.0
5
DFID
Mal
awi A
gricu
lture
Cat
alyt
ic Fu
nd
(MAC
F)
16
.915
4.03
820
.95
USAI
DNj
ira P
roje
ct
2.00
0
1.00
02.
400
4.00
04.
000
3.
600
2.
000
19
.00
EUFa
rm In
com
e Di
vers
ifica
tion
Prog
ram
Pha
se II
(FID
P II)
4.
388
4.
848
4.84
84.
848
18.9
3
AfDB
FCRB
SP
16.8
00
16
.80
Irish
Aid
ASW
Ap-S
P M
DTF
1.04
0
0.80
00.
080
0.48
00.
960
0.26
05.
300
0.00
00.
000
0.58
00.
000
0.00
06.
248
15.7
5RN
ENA
SFAM
Stra
tegi
c Dev
elop
men
t Pl
an II
I
1.92
40.
085
0.50
00.
900
1.40
01.
200
0.90
00.
100
2.
500
0.90
01.
000
1.01
712
.43
USAI
DSt
reng
then
ing
Agric
ultu
re an
d Nu
tritio
n Ex
tens
ion
Serv
ices
5.
700
9.30
0
15.0
0
UNDP
Gree
n Cl
imat
e Fu
nd
12
.300
12
.30
RNE
We E
ffect
- Mala
wi La
ke B
asin
Prog
ram
0.
750
1.
230
1.
230
2.46
0
1.23
0
0.50
00.
615
8.02
DFID
Mal
awi O
ilsee
ds S
ecto
r Tra
nsfo
rmat
ion
Prog
ram
(MOS
T)
11.8
3011
.83
RNE
TLC
Man
agem
ent f
or A
dapt
atio
n to
Cl
imat
e Ch
ange
0.
720
0.
009
0.18
04.
174
2.18
0
0.88
6
0.72
0
0.86
00.
450
10.1
8
RNE
Deve
lopm
ent F
und
- Sus
tain
able
Ag
ricul
ture
Lead
Farm
er P
rogr
am
3.00
80.
050
0.45
0
1.58
02.
450
0.
250
0.
540
1.
011
0.50
09.
84
Germ
any
Mor
e In
com
e an
d Em
ploy
men
t in
Rura
l Are
as (M
IERA
)0.
250
2.50
0
2.
750
5.00
010
.50
Irish
Aid
Root
and
Tube
r Cro
ps Fo
r Ag
ricul
tura
l Tra
nsfo
rmat
ion
in
Mal
awi (
RTC-
ACTIO
N M
alaw
i)
5.
065
5.
065
10.1
3
Irish
Aid
Mal
awi S
eed
Indu
stry D
evel
opm
ent
Proj
ect P
hase
II (M
SIDP
II)
5.
065
5.
065
10.1
3
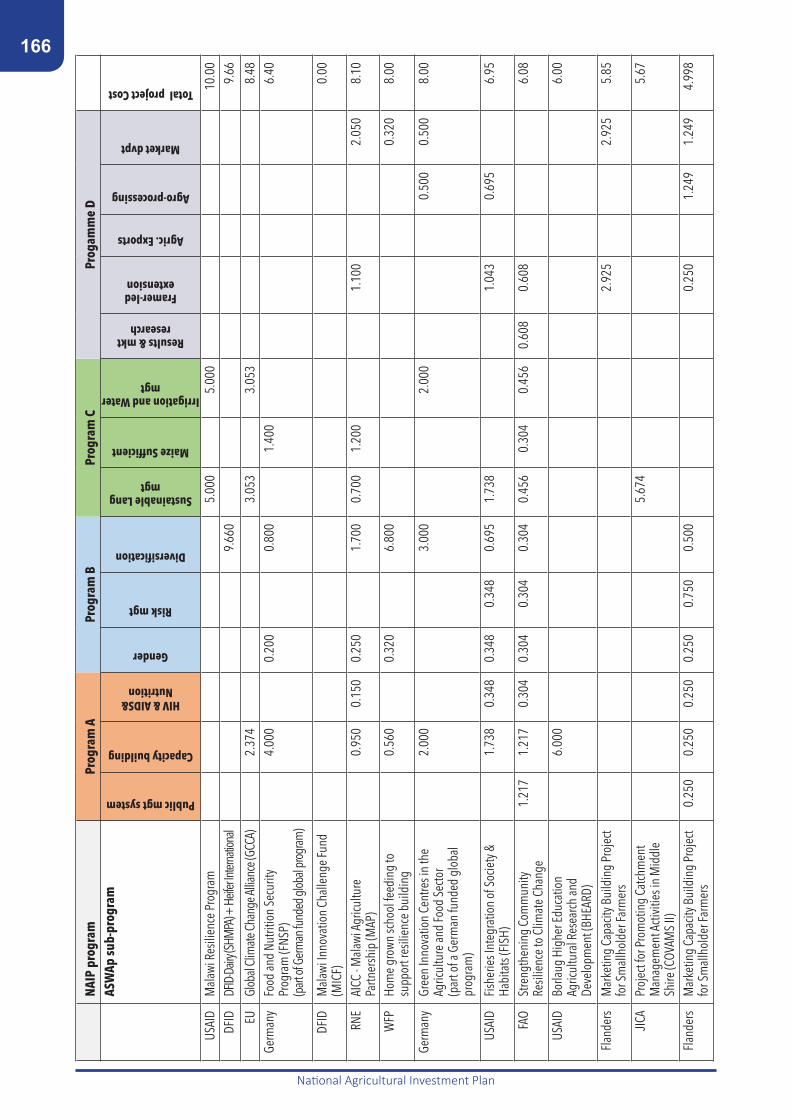
166
National Agricultural Investment Plan
NAIP
pro
gram
Prog
ram
APr
ogra
m B
Prog
ram
CPr
ogam
me
DAS
WAp
sub-
prog
ram
Public mgt system
Capacity building
HIV & AIDS& Nutrition
Gender
Risk mgt
Diversification
Sustainable Lang mgt
Maize Sufficient
Irrigation and Water mgt
Results & mkt research
Framer-led extension
Agric. Exports
Agro-processing
Market dvpt
Total project Cost
USAI
DM
alaw
i Res
ilien
ce P
rogr
am
5.
000
5.
000
10
.00
DFID
DFID
-Dair
y (SH
MPA
) + H
eifer
Intern
ation
al
9.66
0
9.
66
EUGl
obal
Clim
ate C
hang
e Allia
nce (
GCCA
)
2.37
4
3.
053
3.
053
8.
48Ge
rman
yFo
od an
d Nu
tritio
n Se
curit
y Pr
ogra
m (F
NSP)
(p
art of
Ger
man
fund
ed gl
obal
prog
ram)
4.
000
0.
200
0.
800
1.
400
6.40
DFID
Mal
awi I
nnov
atio
n Ch
alle
nge
Fund
(M
ICF)
0.00
RNE
AICC
- Mal
awi A
gricu
lture
Pa
rtner
ship
(MAP
)
0.95
00.
150
0.25
0
1.70
00.
700
1.20
0
1.
100
2.05
08.
10
WFP
Hom
e gr
own
scho
ol fe
edin
g to
su
ppor
t res
ilien
ce b
uild
ing
0.
560
0.
320
6.
800
0.
320
8.00
Germ
any
Gree
n In
nova
tion
Cent
res i
n th
e Ag
ricul
ture
and
Food
Sec
tor
(par
t of a
Ger
man
fund
ed g
loba
l pr
ogra
m)
2.
000
3.
000
2.00
0
0.50
00.
500
8.00
USAI
DFis
herie
s Int
egra
tion
of S
ocie
ty &
Ha
bita
ts (F
ISH)
1.
738
0.34
80.
348
0.34
80.
695
1.73
8
1.04
3
0.69
5
6.95
FAO
Stre
ngth
enin
g Co
mm
unity
Re
silie
nce
to C
limat
e Ch
ange
1.21
71.
217
0.30
40.
304
0.30
40.
304
0.45
60.
304
0.45
60.
608
0.60
8
6.08
USAI
DBo
rlaug
Hig
her E
duca
tion
Agric
ultu
ral R
esea
rch
and
Deve
lopm
ent (
BHEA
RD)
6.
000
6.00
Flan
ders
Mar
ketin
g Ca
pacit
y Bui
ldin
g Pr
ojec
t fo
r Sm
allh
olde
r Far
mer
s
2.
925
2.92
55.
85
JICA
Proj
ect f
or P
rom
otin
g Ca
tchm
ent
Man
agem
ent A
ctivit
ies i
n M
iddl
e Sh
ire (C
OVAM
S II)
5.67
4
5.67
Flan
ders
Mar
ketin
g Ca
pacit
y Bui
ldin
g Pr
ojec
t fo
r Sm
allh
olde
r Far
mer
s 0.
250
0.25
00.
250
0.25
00.
750
0.50
0
0.
250
1.
249
1.24
94.
998

167
National Agricultural Investment Plan
NAIP
pro
gram
Prog
ram
APr
ogra
m B
Prog
ram
CPr
ogam
me
DAS
WAp
sub-
prog
ram
Public mgt system
Capacity building
HIV & AIDS& Nutrition
Gender
Risk mgt
Diversification
Sustainable Lang mgt
Maize Sufficient
Irrigation and Water mgt
Results & mkt research
Framer-led extension
Agric. Exports
Agro-processing
Market dvpt
Total project Cost
JICA
The
proj
ect f
or E
nhan
cing
Capa
city
for M
ediu
m S
cale
Irrig
atio
n Sc
hem
e De
velo
pmen
t, Op
erat
ion
& M
aint
enan
ce (M
IDP2
)
4.44
4
4.44
4
Flan
ders
Stre
ngth
enin
g Fa
rmer
Or
gani
zatio
ns an
d Ru
ral S
tructu
red
Trade
Mec
hani
sms
3.
899
3.89
9
WFP
Food
Assis
tance
for A
sset
Cre
ation
pr
ogra
m to
supp
ort r
esilie
nce b
uild
ing
0.
360
1.44
00.
360
0.54
0
0.54
0
0.36
0
3.60
0
WFP
Purc
hase
for P
rogr
ess (
P4P)
to
prom
ote
resil
ienc
e bu
ildin
g
0.
000
EUPr
omot
ing
Resp
onsib
le La
nd
Gove
rnan
ce fo
r Sus
tain
able
Ag
ricul
ture
in M
alaw
i1.
049
1.04
9
1.
049
3.
148
USAI
DNe
w Al
lianc
e Po
licy A
ccel
erat
ion
Supp
ort (
NAPA
S) A
ctivit
y
3.13
8
3.
138
FAO
Emer
genc
y sup
port
to sm
allh
olde
r fa
rmer
s affe
cted
by E
l Niñ
o in
So
uthe
rn A
frica
0.70
50.
705
0.
705
0.
705
2.82
0
WFP
Rura
l Res
ilien
ce (R
4) In
itiat
ive
0.77
4
1.
806
2.
580
FAO
Pesti
cide R
isk Re
ducti
on in
Mala
wi (F
SP)
2.04
0
0.51
0
2.55
0US
AID
ASW
Ap-S
P M
ulti
Dono
r Tru
st Fu
nd0.
165
0.15
00.
001
0.00
10.
075
0.15
00.
041
0.82
60.
000
0.00
00.
091
0.00
00.
000
0.98
02.
480
JICA
Supp
lem
enta
ry B
udge
t (W
FP)
0.00
0DF
IDSu
ppor
t to
Prog
ram
mon
itorin
g an
d Ev
alua
tion
0.00
0
USAI
DFe
ed th
e Fu
ture
Brid
ging
Acti
vity
1.
200
0.20
0
0.
600
2.00
0Iri
sh A
idEn
hanc
ing
Smal
lhol
der P
rodu
ctivit
y an
d Re
turn
s thr
ough
Clim
ate
Smar
t Ag
ricul
ture
(CSA
)
1.94
0
1.94
0
Flan
ders
Agro
fore
stry F
ood
Secu
rity P
rogr
am II
0.91
0
0.91
0
1.82
0
Flan
ders
Righ
t to
Food
0.00
0

168
National Agricultural Investment Plan
NAIP
pro
gram
Prog
ram
APr
ogra
m B
Prog
ram
CPr
ogam
me
DAS
WAp
sub-
prog
ram
Public mgt system
Capacity building
HIV & AIDS& Nutrition
Gender
Risk mgt
Diversification
Sustainable Lang mgt
Maize Sufficient
Irrigation and Water mgt
Results & mkt research
Framer-led extension
Agric. Exports
Agro-processing
Market dvpt
Total project Cost
Flan
ders
Scal
ing
up R
adio
and
ICT’s
in
enha
ncin
g Ex
tens
ion
Deliv
ery
1.35
8
1.35
8
FAO
Enha
nced
Agr
icultu
re E
mer
genc
y Re
spon
se to
tack
le th
e ne
gativ
e ef
fects
of E
l Niñ
o in
Mal
awi 2
016
0.27
80.
278
0.
278
0.
278
1.11
2
USAI
DDe
velo
pmen
t Cre
dit A
utho
rity (
DCA)
1.
056
1.05
6US
AID
Deve
lopm
ent C
redi
t Aut
horit
y (DC
A)
1.05
2
1.
052
FAO
Stre
ngth
enin
g in
tegr
ated
ad
apta
tion
plan
ning
and
impl
emen
tatio
n in
Sou
ther
n Af
rica
smal
lhol
der a
gric
0.
855
0.85
5
Flan
ders
Supp
ort t
o Liv
esto
ck E
xten
sion
and
Train
ing
Serv
ices
0.00
0
Flan
ders
Asse
ssin
g an
d en
hanc
ing
the
capa
city,
perfo
rman
ce an
d im
pact
of p
lura
listic
agric
ultu
ral e
xten
sion
syste
m in
Mal
awi
0.50
4
0.50
4
FAO
Incr
easin
g re
silie
nce
to cl
imat
e ch
ange
in th
e fis
hery
secto
r of
sout
hern
Lake
Mal
awi a
nd
Mal
ombe
0.47
0
0.47
0
AfDB
SIVA
P-AD
F
0.
350
0.
350
Flan
ders
Stre
ngth
enin
g Di
strict
Sta
keho
lder
Pa
nels
For I
mpr
oved
Ext
ensio
n Se
rvice
Del
ivery
.
0.00
0
FAO
Stre
ngth
enin
g lin
kage
s bet
ween
sm
all a
ctors
and
buye
rs in
the
Root
s an
d Tu
bers
secto
r in
Afric
a
0.
048
0.
048
0.04
80.
048
0.19
2
FAO
Natio
nal A
dapt
atio
n Pl
ans -
Clim
ate
Smar
t Agr
icultu
re0.
015
0.01
5
0.
044
0.
074

169
National Agricultural Investment Plan
NAIP
pro
gram
Prog
ram
APr
ogra
m B
Prog
ram
CPr
ogam
me
DAS
WAp
sub-
prog
ram
Public mgt system
Capacity building
HIV & AIDS& Nutrition
Gender
Risk mgt
Diversification
Sustainable Lang mgt
Maize Sufficient
Irrigation and Water mgt
Results & mkt research
Framer-led extension
Agric. Exports
Agro-processing
Market dvpt
Total project Cost
FAO
Enha
nced
Cap
aciti
es fo
r Effe
ctive
M
obili
zatio
n an
d Us
e of
Res
ourc
es
for F
ood
Secu
rity a
nd N
utrit
ion
0.00
70.
013
0.01
30.
026
0.
007
0.06
6
Mar
y’s
Mea
lsSc
hool
Feed
ing
Prog
ram
6.09
0
6.09
0
Chin
aTe
chni
cal A
ssist
ance
_ S
outh
-Sou
th
Coop
erat
ion
(SSC
) with
the
PR
Chin
a in
supp
ort o
f ASW
Ap: P
hase
II
1.
139
1.13
9
Tota
l Res
ourc
e Al
loca
tion
by
Inte
rven
tion
Area
s57
.97
103.
858.
2611
.75
62.6
110
5.02
79.0
316
2.87
158.
6229
.27
62.6
68.
1439
.23
159.
9710
49.2
3
Tota
ls R
esou
rce
Allo
catio
n by
NA
IP P
rogr
am
161.
82
82
.62
59
7.46
207.
34
Prog
ram
Res
ourc
e En
velo
pe a
s %
age
of To
tal
15
.42
7.87
56
.94
19.7
610
0.00
Pipe
line
Proj
ects
W
BAg
ricul
tura
l Com
mer
cializ
atio
n Pr
ojec
t
9595
.00
WB
Shire
Valle
y Irri
gatio
n Tra
nsfo
rmat
ion
Proj
ect
265
26
5.00
WB
Nutri
tion
sens
itive
Agr
icultu
re Pr
ojec
t
3
3.
00
EUAfi
kepo
(Nut
ritio
n En
hanc
emen
t)
74
.2
74.2
0EU
Kulim
a
10.6
10.6
74
10
.6
105.
80Fl
ande
rsSt
reng
then
ing
Farm
er G
roup
s
1.
06
1.06
0To
tal P
ipel
ine
Reso
urce
Allo
catio
n by
NA
IP P
rog.
10
.6
87
.8
350.
66
95
544.
06
Pipe
line
Prog
ram
Res
ourc
e En
velo
pe
% o
f Tot
al
1.95
16.1
4
64.4
5
17
.46
100.
00
GRAN
D TO
TALS
BY
NAIP
PRO
GRAM
17
2.42
170.
42
948.
12
30
2.34
1593
.29
% P
rogr
am R
esou
rce
Allo
catio
ns
10.8
2
10
.70
59
.51
18.9
810
0.00

170
National Agricultural Investment Plan
Appe
ndix
5.2
: Prio
rities
of L
arge
r (U
SD 1
0 m
illio
n +)
DCA
FS F
inan
ced
Proj
ects
Proj
ect
Fund
erCo
vera
geM
ajor
Act
iviti
esM
ulti
Dono
r Tru
st Fu
nd
(ASW
Ap-S
P)
Vario
usAl
l dist
ricts;
the
road
s im
prov
emen
t com
pone
nt
cove
rs 1
0 di
strict
s
The
proj
ect t
arge
ts 1.
2 m
illio
n fa
rmer
s, 50
% o
f who
m fe
mal
e. It
pro
mot
es le
ad fa
rmer
conc
epts
in e
xten
sion
serv
ice d
elive
ry; p
rom
otin
g le
gum
es ad
optio
n; p
rom
otin
g co
nser
vatio
n fa
rmin
g; re
habi
litat
ing
rura
l roa
ds;
capa
city b
uild
ing
in la
nd ad
min
istra
tion
and
man
agem
ent s
ervic
es
Mal
awi D
roug
ht R
ecov
ery
and
Resil
ienc
e Pr
ojec
tW
orld
Ban
kT2
4 di
strict
s for
clim
ate
smar
t co
mpo
nent
15 di
strict
s for
resil
ience
co
mpo
nent
Proc
urem
ent a
nd d
istrib
utio
n of
mai
ze to
mee
t im
med
iate
food
secu
rity n
eeds
; pro
vidin
g in
puts
for a
sset
s cr
eatio
n ac
tiviti
es; p
rom
otio
n of
dro
ught
tole
rant
crop
s and
live
stock
dist
ribut
ion;
impr
ovem
ent o
f crit
ical
irrig
atio
n sc
hem
es; c
atch
men
t are
a con
serv
atio
n; w
ater
supp
ly im
prov
emen
t; im
prov
ing
early
war
ning
sy
stem
s; am
ongs
t oth
ers
Agric
ultu
ral P
rodu
ctivit
y Pr
ogra
m fo
r Sou
ther
n Af
rica
(APP
SA)
Wor
ld B
ank
5 di
strict
s Te
chno
logy
gen
erat
ion,
inclu
ding
upg
radi
ng o
f res
earc
h in
frastr
uctu
re; c
apac
ity d
evel
opm
ent;
and
stren
gthe
ning
of s
eed,
regu
lato
ry an
d re
late
d se
rvice
s; am
ongs
t oth
ers
The
Mal
awi A
gricu
ltura
l In
frastr
uctu
re an
d Yo
uth
in
Agrib
usin
ess P
roje
ct (A
IYAP
)
AfDB
2 di
strict
s of N
khat
a Bay
and
Nkho
ta-K
ota
Deve
lopi
ng tw
o la
rge
scal
e irr
igat
ion
targ
etin
g 10
,000
ben
eficia
ries w
ith sp
ecia
l foc
us o
n yo
uth
(abo
ut 5
0%);
prom
otin
g yo
uth
owne
rshi
p of
agrib
usin
ess;
and
ensu
ring
yout
h ac
cess
to fu
ndin
g/cr
edit
thro
ugh
seed
fund
s, am
ongs
t oth
ers.
Unite
d in
Bui
ldin
g an
d Ad
vanc
ing
Life
Expe
ctatio
ns
(UBA
LE)
USAI
DSe
vera
l dist
ricts
Targ
ets 2
50,0
00 fa
rmer
s and
succ
essfu
lly li
nkin
g th
em to
mar
kets;
incr
easin
g re
silie
ncy t
o sh
ocks
for
hous
ehol
ds an
d co
mm
uniti
es; a
nd su
ppor
ting
syste
ms a
nd st
ructu
res f
or re
ducin
g ch
roni
c mal
nutri
tion
and
food
inse
curit
y whi
le b
uild
ing
resil
ienc
e.
Shire
Valle
y Irri
gatio
n Pr
ojec
t, Ph
ase
IW
B2
distr
icts o
f Chi
kwaw
a and
Ns
anje
Esta
blish
ing
mar
ket-l
inke
d sm
allh
olde
r far
min
g ve
ntur
es; a
nd d
evel
opin
g pr
ofes
siona
lly o
pera
ted
irrig
atio
n se
rvice
s.
Gree
n Be
lt Au
thor
ity (G
BA)
EUM
ostly
lake
shor
e di
strict
sIn
stitu
tiona
l cap
acity
bui
ldin
g (N
atio
nal I
rriga
tion
Fund
); gr
ants
for t
he m
ediu
m sc
ale
irrig
atio
n sc
hem
es, e
tc.Fa
rm In
com
e Di
vers
ifica
tion
Prog
ram
(FID
P) II
EUOp
erate
s in 1
2 dist
ricts
in N
orth
ern,
Ce
ntral
and S
outh
ern R
egion
Supp
ortin
g sm
allh
olde
r agr
icultu
re p
rodu
ction
and
dive
rsifi
catio
n; ag
ri-bu
sines
s dev
elop
men
t; so
cial a
nd
farm
er g
roup
dev
elop
men
t.
Susta
inab
le A
gricu
ltura
l Pr
oduc
tion
Prog
ram
(SAP
P)IFA
DOp
erat
es in
6 d
istric
ts, Li
long
we
and
Chiti
paTa
rget
s 200
,000
farm
ers i
n un
derta
king
adap
tive
rese
arch
, kno
wled
ge m
anag
emen
t, fa
rmer
acce
ss to
seed
an
d pr
omot
ion
GAPs
Feed
the
Futu
re M
alaw
i Ag
ricul
tura
l Dive
rsifi
catio
n Ac
tivity
(AgD
iv)
USAI
DM
chin
ji, Li
long
we R
ural
, Ded
za,
Ntch
eu, B
alak
a, M
achi
nga,
Blan
tyre
Rur
al, a
nd M
ango
chi
distr
icts
Foste
rs in
clusiv
e an
d su
stain
able
gro
wth
and
impr
oves
the
nutri
tiona
l sta
tus o
f wom
en an
d ch
ildre
n th
roug
h a p
rove
n nu
tritio
n-se
nsiti
ve ap
proa
ch o
f lay
erin
g ag
ricul
ture
and
nutri
tion
beha
viour
chan
ge in
terv
entio
ns in
ru
ral c
omm
uniti
es. I
ncre
ases
the
com
petit
ivene
ss o
f hig
h-va
lue,
nut
rient
-rich
valu
e ch
ains
thro
ugh
supp
ort f
or
agric
ultu
ral e
nter
prise
s and
incr
ease
d ac
cess
to m
arke
ts an
d fin
ance
.
The
Enha
ncin
g Co
mm
unity
Re
silie
nce
Prog
ram
(ECR
P)DF
IDIn
corp
orat
ing
natu
ral r
esou
rce
man
agem
ent a
nd ri
sk re
ducti
on, a
nd co
mm
unity
capa
city b
uild
ing
in ad
voca
cy
Feed
the
Futu
re M
alaw
i Ag
ricul
tura
l Dive
rsifi
catio
n Ac
tivity
(AgD
iv)
USAI
DM
chin
ji, Li
long
we R
ural
, Ded
za,
Ntch
eu, B
alak
a, M
achi
nga,
Blan
tyre
Rur
al, a
nd M
ango
chi
distr
icts
The
Feed
the
Futu
re M
alaw
i AgD
iv fo
r Inc
omes
and
Nut
ritio
n ac
tivity
foste
rs in
clusiv
e an
d su
stain
able
gro
wth
in M
alaw
i’s a
gricu
ltura
l sec
tor a
nd im
prov
es th
e nu
tritio
nal s
tatu
s of w
omen
and
child
ren
unde
r five
thro
ugh
a pr
oven
nut
ritio
n-se
nsiti
ve a
ppro
ach
of la
yerin
g ag
ricul
ture
and
nut
ritio
n be
havio
ur ch
ange
inte
rven
tions
in
rura
l com
mun
ities
, whi
le a
t the
sam
e tim
e in
crea
sing
the
com
petit
ivene
ss o
f hig
h-va
lue,
nut
rient
-rich
val
ue
chai
ns th
roug
h su
ppor
t for
agric
ultu
ral e
nter
prise
s and
incr
ease
d ac
cess
to m
arke
ts an
d fin
ance
.

171
National Agricultural Investment Plan
Appe
ndix
5.3
: DoN
UTS
fund
ed p
roje
cts,
Prog
ram
Fund
ing
Partn
erBu
dget
Tim
e Fr
ame
Inte
rven
tions
Path
ways
to S
usta
inab
le Fo
od S
ecur
ity S
ocia
l Pr
otec
tion
USAI
DUS
D 30
m20
15-2
020
Nutri
tion
educ
atio
n an
d co
mm
unity
sani
tatio
n an
d hy
gien
e; an
d str
engt
heni
ng
nutri
tion
gove
rnan
ce
Orga
nise
d Ne
twor
k of S
ervic
es fo
r Ev
eryo
ne’s
Heal
thUS
AID
USD
105m
2016
-202
2Pr
imar
y hea
lth ca
re, m
anag
emen
t of m
oder
ate
and
seve
re m
alnu
tritio
n; an
d str
engt
heni
ng n
utrit
ion
gove
rnan
ce
Heal
th S
ecto
r Sup
port
DFID
GBP
13m
2016
-202
0Pr
imar
y hea
lth ca
re m
anag
emen
t of m
oder
ate
and
seve
re m
alnu
tritio
n; an
d wa
ter a
nd
sani
tatio
n.
One W
orld
No
Hung
erKF
WEU
R 1
m20
17-2
022
Nutri
tion
educ
atio
n, co
mm
unity
sani
tatio
n an
d hy
gien
e; p
rimar
y hea
lth ca
re,
man
agem
ent o
f mod
erat
e an
d se
vere
mal
nutri
tion;
mat
erna
l and
youn
g ch
ild fe
edin
g an
d ca
re p
racti
ces
Sour
ce: D
oNUT
S da
ta b
ase
Appe
ndix
5.4
: Pro
ject
s Sup
porti
ng T
IP S
WAP
Prog
ram
Fina
ncie
rOb
ject
ive/
activ
ities
Agro
-pro
cess
ing
and
Valu
e ad
ditio
n pr
ojec
tEn
hanc
ed In
tegr
ated
Fram
ewor
k (EI
F)Se
eks t
o de
velo
p re
gula
tory
fram
ewor
k for
Agr
o-Pr
oces
sing
Spec
ial E
cono
mic
Zone
s
The
Busin
ess E
nabl
ing
Envir
onm
ent P
roje
ctEI
FEs
tabl
ishin
g M
ITC as
a on
e-sto
p sh
op fo
r inv
esto
rs.
Revie
wing
and
upda
ting
the
Inve
stmen
t and
Pro
mot
ion
Act
Esta
blish
ing
a MITC
offi
ce in
Moz
ambi
que
A M
anuf
actu
res S
trate
gy
UNDP
& E
UIn
vesto
r Pro
file
Map
ping
for t
he m
anuf
actu
res s
ub-se
ctor;
Deve
lopi
ng an
Inve
stor F
acili
tatio
n Pr
ogra
m fo
r the
man
ufac
ture
s sub
-clus
ter
Esta
blish
ing
of in
dustr
ial f
orum
s for
the
man
ufac
ture
s sub
-clus
ter
Suga
r Can
e Pr
oduc
ts St
rate
gyEU
Feed
er ro
ads t
o re
duce
cane
hau
lage
dist
ance
for s
mal
lhol
der g
rowe
rsSm
allh
olde
r irri
gatio
n sc
hem
es d
evel
opm
ent i
n Dw
angw
a
Mal
awi O
ilsee
d Se
ctor T
rans
form
atio
n Pr
ogra
mDF
ID &
USA
IDIn
vesto
r pro
files
and
mar
chin
g gr
ant s
chem
es, im
prov
ed e
xten
sion
serv
ices a
mon
gst o
ther
sCo
mpe
titive
ness
and
Job
Crea
tion
Supp
ort
Proj
ect/S
kills
Dev
elop
men
t Pro
ject
ILO, W
orld
Ban
kSk
ills d
eficit
at va
rious
stag
es o
f the
valu
e ch
ain
Sour
ce: M
oITT

172
National Agricultural Investment Plan
Annex 6: Policy and Institutional Framework
Introduction1. Malawi has a very wide range of sectoral and sub-sectoral policies which are usually for a five-year
period, though not always systematically updated. Many of these are linked to global, continental and regional policy frameworks, treaties and commitments. To implement national policies, various plans, investment frameworks and strategies exist. While the NAIP is the implementation tool of the National Agricultural Policy (NAP), it also responds to a number of adjacent sectoral policies that are: (i) relevant for achieving its objectives: and (ii) whose objectives depend to a significant extent on agriculture. The alignment of the NAIP with adjacent policy frameworks is guided by the need to: (i) ensure consistency and coherence: (ii) address critical resource gaps in overlapping policy and investment areas; and (iii) avoid multiple programming of resources for the same activities in various investment frameworks. It is also important in view of Malawi’s commitments under the Malabo Declaration which stretch beyond the agricultural sector.
2. In view of the large number of policies, strategies, agreements and commitments with relevance to the NAIP, a comprehensive coverage is beyond the scope of this annex. Rather, the most important and relevant policy frameworks and strategies at international, continental, regional and national level are described, in that orde
6.1 International Policy Frameworks3. Malawi is signatory to the main international commitments related to agriculture, including the
Sustainable Development Goals (SDGs, 2015) and the Malabo Declaration (2014). The SDGs are globally agreed upon goals to be achieved by 2030. While the agricultural sector is mainly captured under SDG 2 (Zero Hunger), several objectives and interventions of other goals are directly relevant to the agricultural sector, including 5, 6, 12, 14, and 15. The targets include achieving zero hunger, gender equality, empowerment to women and girls, availability and sustainable management of water and sanitation for all, sustainable consumption and production patterns, that water bodies are conserved and sustainably used; and that terrestrial ecosystems are protected, restored and promoted, forests managed sustainably, desertification combatted and land degradation and biodiversity losses are halted. This calls for integrated and holistic approaches, looking beyond one sector at a time.
4. Notwithstanding its very low emissions, Malawi is a Party to the United Nations Framework Convention on Climate Change (UNFCCC) and the Paris Climate Agreement of December 2015. Under these agreements Malawi has made firm commitments to move the country’s development pathways towards a green economy based on national circumstances and capabilities. These commitments are defined under Malawi’sIntended Nationally Determined Contribution (INDC) in direct response to decisions adopted at the 19th and 20th Sessions of the Conference of the Parties (COP19 and 20). The INDC aims at achieving the objective of the UNFCCC as set out in Article 2 of the Convention and also contribute to sustainable development. These international policy commitments on climate change have guided the development of the national climate change and resilience policies (see below), with which the NAIP is aligned. Alignment with the major global climate agreements is also significant in terms of potential access to climate funding, for example through the Green Climate Fund (GCF).
5. The Enhanced Integrated Framework (EIF) is a global initiative of the World Trade Organisation (WTO) which brings together partners and resources to support least developed countries (LDCs) in harnessing trade for poverty reduction, inclusive growth and sustainable development. It provides financial and technical support to build trade capacity in 50 countries of which Malawi is one. The EIF is an aid-for-trade program designed to help participating countries develop sustainable trade strategies. The EIF is recognized under Goal 8a of SDG.
173
National Agricultural Investment Plan
6. The EIF has supported Malawi in identifying and quantifying the trade costs constraining Malawi’s competitiveness within regional and international markets. The TIP-SWAp (see below) was launched to support the implementation of the NES. Under the TIP-SWAp, a Joint Sector Strategy was developed to support the incorporation of trade activities into the sector strategies. Targeted strategic support in certain sectors has been provided with a strong emphasis on value chain addition and increased productivity. The NAIP aligns with the EIF mainly through Program D and IAs 14 and 15. It pursues better integration between the agricultural and trade agendas through an active role of MoITT in NAIP implementation and the integration of a number of activities and investments related to agricultural trade and exports.
7. CAADP. The main goal of CAADP is to enhance agriculture-led economic growth, eliminate hunger, reduce poverty, food and nutrition insecurities, and enable the expansion of exports. The CAADP process seeks to improve agricultural development through coherent a long-term framework that guides the planning and implementation of priority development and investment areas in current and future revisions of the national agricultural development and food security strategy. It helps to identify strategic options and sources of pro-poor growth for the agriculture sector, build knowledge management systems in the sector and embrace peer review mechanisms to enhance collective responsibility and local ownership. The compact sets the context for joint sector policy, budgetary and investment dialogue, and commitments to align, scale up and improve the quality of long-term sector investment. The compact confirms and provides consensus around the goals and priorities that Malawi has set to accelerate agricultural growth and improve FNS, and the partnerships and assistance that are required to achieve these goals. The NAIP is the main instrument to implement the CAADP process at country level.
8. The Scaling Up Nutrition is another global initiative that Malawi is party to, which also aims to support strategic investments and interventions to help eliminate under nutrition
6.2 Continental and Regional Agricultural and related Policies and Strategies9. The Malabo Declaration on Accelerated Agricultural Growth and Transformation for Shared
Prosperity and Improved Livelihoods resulted from the AU meeting of heads of state and government in June 2014, already summarized in chapter 2.
10. During the same meeting, the Heads of State also signed the African Union “Declaration on Nutrition Security for Inclusive Economic Growth and Sustainable Development in Africa.” The Declaration: (i) reaffirms the commitment of the Member States to end hunger by 2025; (ii) commits to bring down child stunting to 10% and underway to 5%, focusing on the first 1000 days is the only window of opportunity during which permanent and irreversible physical and mental damage would be avoided; (iii) commits Member States to positioning this goal as a high-level objective in national development plans and strategies. It further calls on Member States that have not yet done so to consider participation in the study on the Cost of Hunger in Africa; and requests the AU Commission, the RECs and development partners to facilitate establishment of a mechanism to monitor progress towards the elimination of child under-nutrition.
11. Malawi is also a participant in Compact 2025 which was launched by IFPRI in November 2015 as a new initiative for ending hunger and undernutrition by 2025. It is designed to support countries in achieving the Malabo and SDG long-term targets of eradicating hunger and under-nutrition. Compact 2025 brings stakeholders together to set priorities, innovate and learn, fine-tune actions, build on successes, and synthesise shareable lessons in order to accelerate progress. The Compact 2025 Scoping Report of May 2016 reports on a roundtable discussion for assessing how to end hunger and undernutrition in Malawi by 2025. The roundtable identified key knowledge, policy, and implementation gaps as well as opportunities, potential synergies, and priority areas for action.

174
National Agricultural Investment Plan
12. Formulation of the NAIP recognises the SADC Regional Agricultural Policy (RAP) of 2013 and its accompanying Investment and Implementation Plan for the period 2017-2022. The purpose of the RAP is to “define common agreed objectives and measures to guide, promote and support actions at regional and national levels in the agricultural sector of the SADC Member States in contribution to regional integration and the attainment of the SADC Common Agenda”. The overall objective of the Policy is to contribute to sustainable agricultural growth and socio-economic development. The Policy has four specific objectives each with a number of strategies:
• Enhance sustainable agricultural production, productivity and competitiveness through: (i) improved land administration, use and management; (ii) productivity-enhancing inputs; (iii) farm support systems and services; and (iv) forestry and fisheries development. Aligned with NAIP Program C and IAs 3, 9, 10, 11, 12 and 13.
• Improve regional and international trade and market access for agricultural products through: (i) improving the efficiency and effectiveness of the region’s input and output markets and stimulating broad farmers’ participation; (ii) improving the regional and international trade environment for agriculture; and (iii) improving the development of agriculture-related market infrastructure. Aligned with NAIP Program D and IAs 10, 14 and 15.
• Improve private and public-sector engagement and investment in agricultural value-chains through: (i) value chain promotion and mobilisation of financial capital for agriculture, agro-industry and agri-business. Private sector engagement is mainstreamed in the NAIP, especially through Program D and IAs 14, 15 and 16 and through the CAP-F process.
• Reduce social and economic vulnerability of the region’s population in the context of FNS and the changing economic and climatic environment through: (i) addressing chronic and transitory vulnerability to the diversity of food security risks in a changing economic environment; (ii) addressing climate change, variability and related vulnerability; (iii) mitigating gender-related vulnerability and marginalisation; (iv) mitigating HIV/AIDS related vulnerability and marginalisation; (v) mitigating the vulnerability of migrant/mobile rural people; and (vi) fighting against unemployment and marginalisation of the rural youth. FNS, climate change, vulnerability and gender issues are all mainstreamed in the NAIP as well as incorporated specifically in Program B and IAs 4, 5, 6, and 7
13. The purpose of the Investment and Implementation Plan is to define the financial resources that the region commits to mobilise, the priority areas where investment is to be made, and how that investment will be accessed and utilised by Member States. It also presents avenues by which the region expects to leverage public and private sector financing for the development of agriculture and related sectors. The total cost of the Plan is USD 565 million, to be mobilised through contributions by SADC Member States, PPPs, development partners, etc. Member states have agreed that the funds will be managed following the governance structure, rules and procedures that are/shall be adopted by the SADC ministers responsible for agriculture and food security.
14. The Investment and Implementation Plan defines the means by which the RAP will be implemented. It outlines priority programmes and sub-programmes, where investment needs to be focused. The Investment will be operationalised through an instrument-based implementation mechanism including “facilities”, under which is one or more “windows” that are each supported by one or more “measures”. Through the instrument-based mechanism, a programme, where applicable, can be implemented by drawing financial resources from one or more facilities.

175
National Agricultural Investment Plan
15. The COMESA Regional Agriculture Policy and Investment Framework (2010-2014) is the base document from which the COMESA Regional CAADP Compact and its accompanying Agriculture Policy and Investment framework have been prepared. These documents define the priority areas for CAADP regional investments and are intended to facilitate investment in areas where individual countries cannot effectively invest alone. It is an overarching framework that:
• Provides guidance to, and expedites, interventions that already exist at regional level, towards enhancing economic growth and food security.
• Promotes new regional policies and investments where gaps exist.
• Clarifies synergies and coordination among regional initiatives in agriculture-led economic growth and poverty reduction.
16. The goal of the Policy and the regional compact is to “contribute, through better policy coordination, policy implementation and budget support for agriculture, forestry and fisheries, to sustainable agricultural production and productivity, food security and regional integration, enhance competitiveness, and improve markets and trade of agricultural, fisheries and forestry products. It identifies three main priority areas and six crosscutting priorities:
• Priority Area 1: Agricultural production and productivity with a focus on staple foods, livestock produce, fisheries and forest produce
• Priority Area 2: Removing barriers to agricultural trade and linking farmers to markets with a focus on corridors (corridor development)
• Priority Area 3: Reducing social and economic vulnerability and enhancing resilience and food and nutrition security
Cross-cutting priority areas are: (i) gender and age mainstreaming; (ii) human and institutional capacity development and strengthening; (iii) information and knowledge management; (iv) climate change; (vi) resource mobilisation, and (vii) improved coordination.
17. Whilst the NAIP is a country-specific plan, it complements the COMESA Regional Policy and Compact which identifies regional priorities. Priority Area 1 aligns closely with NAIP Program C including IAs 9, 10, 11, 12 and 13. The NAIP complements Priority Area 2 through its support for markets and trade under Program D and IA 14. There is also support for Priority Area 3 via NAIP’s food and nutrition security, empowerment and disaster risk management initiatives under Program B and IAs 4, 6 and 7. The COMESA cross-cutting priorities are also reflected in the NAIP.
6.3 National Policies and StrategiesMalawi Growth and Development Strategy MGDS IIIThe overarching national development plan is the Malawi Growth and Development Strategy. The third phase (MGDS III) was prepared in parallel with the NAIP and is currently in draft form pending publication. It covers the period 2017 to 2022 and is the fourth medium-term national development strategy aligned to the country’s long-term development aspirations articulated in Vision 202035. The five key priority areas (KPAs) are summarized in chapter 2. KPA 1 recognises that the agricultural sector is the mainstay of the economy which can significantly support industrial development. However, its potential is hampered by dependency on rain fed agriculture with its attendant challenges stemming from climate change and poor water management. The agricultural content of MGDS III is derived from the National Agricultural Policy which was developed and approved in 2016 (see following paragraph). Since the NAIP operationalizes the NAP, it is also aligned with MGDS III.
35The previous development strategies that were developed to implement Vision 2020 were the Malawi Poverty Reduction Strategy Paper (MPRSP), and MGDS I and II.

176
National Agricultural Investment Plan
18. The integration of agriculture and climate change in one KPA underlines the strong linkages between the two. A number of strategies are proposed including adaptation and mitigation of climate change impacts. Adaptation will protect against the effects of climate change, thereby reducing vulnerability of communities and ecosystems. MGDS III notes that investment in climate change adaptation has been found to have the largest multiplier effect on poverty alleviation, education, health, agriculture and water development, economic growth, urbanisation and governance.
19. While addressing the challenges in agriculture, other areas such as environment, forestry, water resources, parks and wildlife, women and youth productivity, health, education, energy, industrial production and transportation will also be leveraged. This is in recognition of the fact that efforts to improve agricultural productivity and sustainability will not yield meaningful results unless water resource management and transportation infrastructure which enhances rural access are improved. This priority area will contribute to higher productivity and resilience.
Sectoral and Sub-Sectoral Development Plans20. Malawi has a wide range of sectoral and sub-sectoral policies, plans and strategic frameworks.
The main policy document for the agricultural sector is the National Agricultural Policy. The most relevant related sectors include the mandates of MoITT, MoLHUD, MoLGRD, MoHP, MoNREM, and MoFEP&D.
The National Agricultural Policy (NAP)21. The development of a comprehensive NAP is in the important step forward. In the past, the
ASWAp served as substitute for a sector policy. Development of a NAP is also timely delivery of a key policy commitment of Government under the New Alliance Framework. The NAIP will be the main implementation tool for the NAP, and is aligned to the policy and its objectives.
22. The NAP is intended to guide the design and implementation of the various subsector policies and strategies. Its emphasis is on farmer-led agricultural transformation and commercialisation that entails treating farming as a business. The policy will facilitate and harness dynamic transitions taking place within farming communities, in particular the movement of farming households into non-traditional high-value agricultural value chains and increased engagement in profitable off-farm and non-agricultural livelihoods. The NAP identifies eight PPAs:
1. Sustainable agricultural production and productivity
2. Sustainable irrigation development
3. Mechanisation of agriculture
4. Agricultural market development, agro-processing and value addition
5. Food and nutrition security
6. Agricultural risk management
7. Empowerment of youth, women and vulnerable groups in agriculture
8. Institutional development, coordination and capacity strengthening
23. Within these PPAs, there are a number of Policy Statements (totalling 54) with specific activities identified. These are further divided into strategies (equivalent to activities under the NAIP). The NAP also highlights the main implementing agencies for each strategy. Given the different scope of the PPAs, these have been divided into more manageable 16 IAs under the NAIP. Most of the 54 Policy Statements and underlying strategies are reflected in the IAs. Table 1 below shows how the 16 NAIP IAs have been linked to the eight PPAs.

177
National Agricultural Investment Plan
Table 1: NAP PPAs and NAIP Intervention Areas
NAP Policy Priority Areas NAIP Intervention Areas
I. Institutional dev. coordination and Capacity Development 3.8
IA1: Coordination and M&EIA2: Farmer-Based Organizations IA3: Public Agricultural Services Delivery
II. Food & Nutrition Security 3.5IA4: Diverse, Nutritious Food Available and ConsumedIA5: Food Safety and Quality Standards
III. Empowerment of youth, women and vulnerable groups 3.7
IA6: Empowerment and Tenure Security
IV. Agricultural Risk Management 3.6IA7: Disaster Risk Reduction SystemsIA8: Pest and Disease Management
V. Sustainable production and productivity 3.1
IA9: Agricultural Innovation SystemsIA10: Access to InputsIA11: Natural Resource Management
VI. Sustainable irrigation development 3.2 IA12: Sustainable Irrigation Development
VII. Mechanisation 3.3 IA13: Mechanization
VIII. Market development, agro-processing and value addition 3.4
IA14: Market Systems and Access to MarketsIA15: Agri-business Development IA16: Access to Finance
24. In some cases, PPAs and/or strategies have placed under a different IA or have been clustered in a slightly different manner under the respective intermediate outcomes. This has resulted from a prioritization exercise during the NAIP formulation process, the integration of inputs provided by key stakeholders from adjacent sectors during that process, and, in some cases, to improve the coherence of the NAIP. The NAIP budget file allows tracing the linkages between NAP strategies and NAIP activities, outputs, IAs and Programs.
Sub-Sectoral and Thematic Strategies and Plans within the Agricultural Sector25. Within the Agricultural Sector and under the NAP umbrella, there is a large number sub-sectoral
and thematic strategies, policies and plans including, but not limited to the following:
• Agricultural Extension and Advisory Services Strategy (currently being developed)
• Agricultural Research Master Plan (currently being updated)
• Agricultural Risk Management Strategy
• Contract Farming Strategy (currently adopted by MoAIWD but awaiting Amendment of the Competition and Fair Trade Act)
• Cotton Strategic Plan for Malawi (2011-2016)
• Crop Production Policy
• Farmer Organisation Development Strategy (2016)
• Fertiliser Strategy (2007) – to be updated once the Policy is approved
• Fisheries and Aquaculture Policy (2016-2021)
• Food Security Policy (August 2006)
• Guidelines for Sustainable Land Management Voucher System Implementation, Catchment Management, Conservation Agriculture, and Strategic Grain Reserve Management;

178
National Agricultural Investment Plan
• HIV/AIDS Agricultural Sector Policy and Strategy
• Land Resource Conservation Policy
• Livestock Policy (currently being updated)
• National Fertiliser Policy (currently being developed)
• National Fisheries Policy (2016-21)
• National Irrigation Policy (2016), Development Strategy (2012) and Irrigation Master Plan (2015)
• Seed Policy (going through approval process, currently with OPC)
• Strategic Plan for the Tobacco Industry (2012-2017)
The most relevant subsector policies are briefly described below.
26. The National Livestock Policy defines MoAIWD’s mandate to develop the livestock industry in the country. The policy also serves as an operational tool to guide the implementation of the National Livestock Development Master Plan. The goal of the policy is to contribute towards improved household, national food security and poverty reduction through sustainable private sector and farmer demand driven livestock services. The NAIP will finance the development of a Livestock Development Master Plan and includes a broad range of livestock-related activities such as improved veterinary services, livestock biosecurity services, pass-on schemes, feeding technologies and the establishment of village livestock committees, among others.
27. The Contract Farming Strategy (2016) aims at creating an enabling environment for contract farming activities to take place in Malawi in an efficient, competitive and fair manner. The ultimate impact sought is to create wealth, and to reduce poverty and inequality by increasing profitable market access for farmers and buyers of agricultural output, through contract farming arrangements where appropriate. Contract farming is addressed under Program D, IA 14 which will promote contract farming in conjunction with the Fair Trade Commission.
28. The National Irrigation Policy (2016) aims at addressing critical issues affecting the irrigation sector that include spatial and temporal water shortages, customary land tenure disputes, and poor operation and maintenance of infrastructure. The NIP attempts to provide solutions to these challenges by addressing three priority areas of sustainable irrigation development, management and capacity development. The Policy is well anchored in the National Water Policy, Agriculture Policy, National Environmental Policy and others and forms the foundation for the Irrigation Sector Master Plan. The NAIP will support the implementation of the first five-year episode of the master plan under Program C, IA 12.
29. The National Fisheries Policy (2012-17) is designed to meet the challenges and emerging issues of the fisheries sector, and to provide linkages with the emerging cross-cutting policies, plans and activities of national and regional bodies where they affect or interact with fisheries. The goal of the Policy is to promote sustainable fisheries and aquaculture development in order to contribute to economic growth in Malawi. It expects to achieve four key outcomes: (i) enhanced capacity to sustainably manage and develop fisheries and aquaculture; (ii) improved protein and micronutrient intake for Malawians; (iii) increased decent employment opportunities, including outside the fisheries sector; and (iv) increased earnings for people and government from fish exports and domestic trade. The Fisheries Policy is reflected in the NAIP through a number of measures to improve fisheries and aquaculture productivity under Program C, capacity building for fisheries institutions under Program A (IA 3), food safety (IA 5), hatcheries (IA 10), and improved lake and rivers fishery management (IA 11) etc.
179
National Agricultural Investment Plan
30. The National Agricultural Extension and Advisory Strategy is currently being prepared to replace the expired National Extension Policy. The review focuses on establishing the extent to which the policy changed the extension approach from supply-driven to demand-driven services and how decentralisation of the extension services increases the chances for farmers to participate both in the decision-making process and in accessing the services. The overall conclusion of the review was that the Extension Policy principles remain relevant and in line with best practice. However, there are some gaps relating to ICT-based extension and poor linkages with nutrition and other innovation stakeholders. The new Strategy therefore builds on past successes while eliminating or mitigating implementation challenges that have previously negatively affected the quality of extension services. The review report was released and has formed the basis for development of the successor strategy, which awaits the final validation by stakeholders. It is expected to continue the pluralistic extension approach but placing a stronger focus on strengthening the capacity of the public sector to guide and coordinate extension service provision at all levels. Extension services receive multiple mentions in the NAIP and are a core element of the capacity building to be undertaken in Program A; as well as being a central part of the innovation systems approach to be implemented under IA 9.
Other related Policies and Strategies31. Whilst the NAIP is firmly rooted in the NAP, there are a number of other important policies and
strategies developed by other ministries and agencies that have an important influence on the objectives and implementation modalities of the NAIP. These are briefly reviewed as follows:
A) Trade and private sector development 32. The National Trade Policy (2017-21) aims to make Malawi a globally competitive export-oriented
economy, generating higher and sustainable livelihoods through trade. It proposes structural transformation of the productive sector and linking value chains to regional and global export markets and prioritises market access (especially non-tariff barriers), business environment, narrow productive base, high entry cost for small scale producers and traders, and implementation gap. The National Export Strategy (NES), 2013-18, provides a roadmap for how to build the productive base, and achieve competitive export growth. It sets a realistic plan for how the productive base of the economy can be developed in a way that ensures export competitiveness and to maximise the contribution of exports to economic and social development through the development of the private sector in a manner that is balanced with economic empowerment of the rural and urban poor, smallholder farmers, youth and women.
33. The NES builds on Private Sector Development Policy and Strategy, the new National Energy Policy and the Greenbelt Initiative, amongst others. It identifies four priority actions: (i) developing export clusters that can complement the exports of traditional products such as tobacco and tea; (ii) improving the enabling environment for private sector growth; (iii) developing institutions that are key for sustainable growth; and (iv) addressing the skills gap which is this is critical for job creation and economic empowerment. Priority clusters in the NES are oilseed products, sugar cane products and manufacturing.
34. The National Industrial Policy (2017-21) aims to increase the proportion of manufacturing in GDP through structural transformation of the Malawian economy. It has seven objectives: (i) to enhance the provision of appropriate skills and technology; (ii) to improve business environment for the manufacturing sector; (iii) to improve access to key business services; (iv) to support provision of support infrastructure (enablers); (v) to facilitate participation of MSMEs in manufacturing and provide market linkages; (vi) to address the environmental and social sustainability concerns of industrialisation; and (vii) to address the governance challenge in terms of policy formulation and implementation. The expected policy outcomes are: (i) increased productivity of the industrial sector; (ii) increased diversification of industrial products; (iii) increased value addition of primary products; and (iv) reduced trade deficit.

180
National Agricultural Investment Plan
35. The main implementation vehicles are the Trade, Industry and Private Sector (TIP) Sector Wide Approach (TIP-SWAp) and the Joint Sector Plan. While the TIP-SWAp has formally ended, the coordination structures within and across ministries are still in place, especially the commodity-specific groups for product and standards development, as well as coordination and information sharing amongst stakeholders.
36. The Joint Sector Plan is a prioritised investment plan, similar to the NAIP, for the trade sector, developed in 2016. It identifies the investments required under the trade sector, which is heavily under-financed. The NAIP co-finances several activities under these frameworks, to be implemented by MoITT and its subsidiaries (including MITC, MBS and others). The activities are those which are relevant to agriculture and to meeting the NAIP’s overall development objectives and only if not financed elsewhere or through line ministry funding. The trade policy and export strategy are reflected in the NAIP under Program D and IA 14 which promotes market and trade development. The NAIP also includes a number of interventions from the JSP directly related to agriculture as well as some which are wider in scope as these did not have secured funding at the time of NAIP development but a seen as critical to development of the sector. Appendix 6.2 attached indicates the linkages between the JSP and the NAIP.
37. In view of its particular relevance, a detailed mapping showing how specific areas of the JSP are captured under the NAIP can be found in appendix 6.2
B) Food and Nutrition Security38. The nutrition area of the NAIP is guided by the Malawi National Nutrition Policy, 2016-2020, the
draft National Nutrition Strategic Plan, 2017-2021 and the draft Agriculture Sector Food and Nutrition Strategy 2017-2021.
39. The National Nutrition Policy is intended to provide a guiding framework to uphold the government’s commitment to eliminate malnutrition. It aims at ensuring that evidence-based nutrition interventions are developed and implemented in alignment with the overall national development agenda, the Scaling-up Nutrition movement and global declarations and commitments to which Malawi is a signatory.
40. The policy vision is “a well-nourished Malawian population that effectively contributes to the economic growth and prosperity of the country”. The goal is “to attain optimal nutrition for all Malawians by 2020 with emphasis on children under the age of five, pregnant and lactating women, and other vulnerable groups”. The expected outcomes of this policy are:
• Reduced number of children under 5 who are stunted by 20 percent
• Reduced rate of anaemia in children and women of reproductive age by 25 percent
• Reduced rate of infants born with low birth weight by 15 percent
• No increase in the rate of overweight among children, adolescents, and adults
• Increased rate of exclusive breastfeeding in the first 6 months by 20 percent
• Wasting in children, adolescents, and adults is reduced and maintained at less than 5 percent
• Improved multi-sectoral programming and coordination of nutrition interventions
• Increased funding, commitment, and accountability for nutrition
• Increased capacity and leadership for nutrition

181
National Agricultural Investment Plan
41. The policy has eight priority areas which include: (i) prevention of undernutrition; (ii) gender equality, protection, participation and empowerment; (iii) treatment and control of acute malnutrition; (iv) prevention and management of over nutrition and nutrition-related non-communicable diseases; (v) social mobilisation and behaviour change communication; (vi) nutrition during emergency situations; (vii) creating an enabling environment for nutrition; and (viii) nutrition research and surveillance. A detailed outline of each priority area, strategy and activities is provided in a separate National Nutrition Strategic Plan. The draft Strategic Plan specifies the detailed strategies and activities required to achieve the outcomes of the Policy in each of the eight priority areas.
42. Of particular relevance is the draft Agriculture Sector Food and Nutrition Strategy which spans the same five-year time frame as the NAIP. The strategy is based on the guiding principles that the agriculture and food sector has the primary role of feeding people, and that food systems provide for all people’s nutritional needs and contribute to economic growth. It is therefore essential that an enabling policy environment support programmes and investments in agriculture and food systems. The goal of the strategy is to “achieve a sustainable and diverse food system and nutrition education that contributes to a well-nourished nation and economic growth. This will be pursued via nine strategic objectives:1. Ensure stable availability of all food groups through sustainable and diversified
production 2. Ensure stable access to all food groups3. Ensure stable utilisation of all food groups for diversified diets4. Strengthening nutrition education, behaviour change communication strategy and
systems5. Strengthening capacity by improving leadership and management capacity systems and
procedures6. Improving staffing levels through filling of existing vacancies and recruiting new staff in
critical specialised areas7. Enhance a coordinated implementation arrangement to improve active participation of
all stakeholders8. Improving resource allocation to institutions to ensure that agriculture and nutrition
programs have adequate human, physical and financial resources.9. Ensure clear agriculture and nutrition indicators and a good progress tracking system
43. The Strategy will be implemented by all stakeholders involved in agriculture and nutrition-related activities at national, district as well as community level. It advocates for close linkages between agricultural and nutrition programmes to ensure that the country achieves FNS. Implementation will be coordinated by MoAIWD in collaboration with MoHP. The two institutions will ensure that the strategy is implemented as planned and provide policy guidance to agriculture sector stakeholders during the implementation process. Other agencies involved in implementing the strategy include MoLGRD, MoEST, MoGCDSW, MoLYSMD, MoICT, MoITT, MoFEP&D, MoJCA, the Ministry responsible for Climate Change, CSOs, NGOs and CBOs.
44. The Multi-Sectoral Nutrition Policy and Strategic Plan (2017-2021) was recently reviewed and approved to provide guidance and direction on strategies to improve nutrition in Malawi. It seeks to create awareness on the magnitude of the nutrition problems and impact on the individual, household and national economic development, growth, and prosperity; and galvanise the nation towards the Malabo and SDG long-term targets of eradicating under nutrition.

182
National Agricultural Investment Plan
45. In light of these policies, nutrition is one of the major underlying themes of the NAIP as part of the food security thrust and includes measures such as nutrition education, school feeding, bio-fortified crop selection, nutrition in agricultural extension services etc. Nutrition is also a key element of Program B and IA 4 which supports improved implementation of nutrition-related activities in the agricultural sector, institutional feeding programmes and nutrition education at grassroots level.
C) Resilience and Climate Change46. The National Resilience Plan is an overarching framework, monitored and developed by OPC. The
plan draws on five sub-sectors identified as pivotal to breaking the cycle of food insecurity. The sectors/sub-sectors include agriculture and food security (MoAIWD), catchment protection and management (MoNREM); control of floods through dams, dykes and river training (MoAIWD); early warning systems (MoNREM); and social support programs (MoFEP&D). The resilience plan brings together a number of sectoral key indicators into one holistic picture. It includes programs and outputs where MoAIWD is designated the implementer, as well as others. The plan has five components: (i) Agriculture and Food Security (completely covered under the NAIP): (ii) Catchment Protection and Management (substantially covered under IA 11); (iii) Flood Control (where construction of dams and disaster risk management are included under the NAIP); (iv) Early Warning Systems (with major interventions included under IA 7); and (v) Social Support Programs (where the focus in the NAIP is on coordination with the MNSSP). The details are provided in Appendix 6.1 attached.
47. Malawi’s climate change planning framework is guided by its membership of the UNFCCC. The national guiding documents include the National Environmental Policy (2004) and the National Climate Change Policy (2012), as well as three implementation frameworks, namely the National Climate Change Investment Plan (NCCIP, 2013-2018); the Malawi National Adaptation Plan (NAP), currently under development; and the National Adaptation Program of Action to Combat Climate Change (2006). The NCCIP has identified four key priority areas to promote climate change management in Malawi as: adaptation; mitigation; climate change research, technology development and transfer; and capacity building. Under the four themes, a total of 11 programs will be pursued in the implementation of the NCCIP.
48. Climate change mitigation and adaptation measures are mainstreamed in many parts of the NAIP, particularly under Programs B and C. Specific adaptation measures are incorporated in IA 7 (disaster risk management), IA 9 (climate-smart agricultural technologies), IA 10 (climate adapted varieties), IA 11 (sustainable NRM and climate resilience) and IA12 (irrigation). Mitigation measures include tree planting (IA 10), the promotion of agricultural practices with a lower carbon footprint (IA 9 and 10), and the reduction of post-harvest losses (IA 14). The NAIP is also aligned to the Climate Change Investment Plan as shown in Appendix 6.3 attached.
D) Gender and Youth 49. The National Gender Policy (2015) aims to mainstream gender in the national development
process to enhance participation of women and men, girls and boys for sustainable and equitable development for poverty eradication. The policy is rooted in Malawi’s constitution which recognises and promotes gender equality, and in the various versions of the MGDS. It also has linkages to policies covering health, food and nutrition security, HIV and AIDS, education, agriculture, environment, and youth; as well as a number of international agreements and conventions.

183
National Agricultural Investment Plan
50. The goal of the gender policy is “to reduce gender inequalities and enhance participation of women, men, girls and boys in socio-economic development processes.” It seeks to achieve seven broad objectives: (i) to advocate for increased access, retention and completion to quality education for girls and boys; (ii) to ensure women, men, boys and girls sexual and reproductive health rights, and HIV/AIDS status are improved; (iii) to strengthen gender mainstreaming in all sectors of the economy; (iv) to reduce poverty among women and other vulnerable groups through economic empowerment; (v) to promote women’s participation in decision making positions in both politics and public life; (vi) to reduce gender based violence; and (vii) to strengthen the capacity of the national gender machinery.
51. The policy targets the following six priority areas: (i) gender in education and training; (ii) health; (iii) agriculture, food security and nutrition; (iv)natural resources, environment and climate change; (v) economic development; and (vi)governance and human rights. The policy also prioritises gender perspective in gender based violence and capacity of the national gender machinery.
52. As a cross-cutting issue gender is mainstreamed throughout the NAIP through measures such as minimum participation rates for women, youth and other vulnerable/disadvantaged groups and disaggregation of indicators by gender. In parallel with the mainstreaming measures the gender policy is also reflected in IA 6 through initiatives to ensure that women, youth and other vulnerable groups are empowered regarding secure access to land.
53. The vision of the National Youth Policy (2103) is an educated, healthy, well trained, cultured, vibrant and productive youth. The goal is to create an enabling environment for all young people to develop to their full potential in order to contribute significantly to personal and sustainable national development. The design and implementation of appropriate youth development and empowerment programs will facilitate the creation of an enabling environment where the youth are able to contribute effectively to national development. The NAIP is reflects the key elements of the youth policy under Program B including participation of youth in FOs (IA 2), empowerment of women and youth in relation to land tenure security (IA 6) and numerous other youth and gender mainstreaming initiatives.
D) Financial Inclusion54. Issues of financial inclusion and poverty reduction are owned by MoFEP&D, and of particular
relevance to the NAIP are the Financial Sector Development Strategy(2016 – 20) and the Financial Inclusion Strategy (2015 – 20), as well as the National Social Support Policy(currently being updated). The Malawi Social Support Program (MNSSP) operationalises the latter, based on its vision of “enhancing the quality of life for those suffering from poverty and hunger, and improved resilience of those who are vulnerable to risks and shocks”. MSSP has been successful in providing Social Cash Transfers (SCTs) to the ultra-poor and labour constrained households, and is currently developing a Unified Beneficiary Registry to improve and simplify its targeting. MNSSP is funded by several donors through the Local Development Fund. Linkages with the MNSSP are within NAIP Programs A and B and IA 4 and 9. IA 16 and Program A and D contribute to the implementation of the Financial Sector Development Strategy and Financial Inclusion Strategy in the agricultural sector.

184
National Agricultural Investment Plan
E) Land Tenure55. The National Land Policy is owned by MoLHUD, and addresses the constraints to Malawi’s social
and economic development caused by land ownership and user rights issues. The policy provides an institutional framework for land management and procedures for more effective land based investment selection and land market transactions. It also sets forth, as a national guideline for action, the incorporation of desirable principles of land use and management, effective civic education and broad public appreciation of the constraints and trade-offs that need to be made. The Land Policy was approved in 2016 and will be implemented under the new Land Law which was also enacted in 2016. The new policy and law poses different regime than past policies, with more focus on formalising customary systems. MoLHUD is undertaking a national campaign on the land laws to educate stakeholders on what the laws mean and how they will affect society. The NAIP will address the challenges of implementing the far-reaching provisions of the new law, under IA 6 which incorporates measures to empower women and youth in relation to land tenure security.
F) Decentralisation56. The Decentralisation Policy (1998), and its implementation tool, the draft Integrated Rural
Development Strategy are the mandate of MoLGRD. These are being implemented gradually with line ministry staff being moved to local government bodies in 2016. This means that, in future, implementation of agricultural programs will be through Local Governments and their staff, to a much higher extent than through the current structures. It also means that local development priorities and those of the agricultural sector may become more aligned and harmonised in terms of planning and implementation. The decentralisation process embraces many aspects of governance in Malawi, none more so than agricultural extension services at District level and below. This is reflected particularly in Program C and IA 9 which supports the development of decentralised management structures in the agricultural extension system. The decentralisation policy also informs the overall NAIP implementation and coordination arrangements described in Chapter 6 of the main report.
6.4 Agricultural Sector Stakeholders57. Implementing various agricultural policy objectives requires coordinated activities of a broad
range of state and non-state actors – Government and its subsidiaries (parastatals, boards and trusts); non-state actors like NGOs and CSOs; private sector (including farmers, farmers organizations and private sector companies of different kinds and sizes); and donors. This section provides a brief overview of the key stakeholders and their main roles.
58. Government as a whole has a dual function: provision of public goods and services to its people; and to provide an enabling environment for stakeholders to operate through strong, transparent and implemented policies. As identified in the NAP, the ministries directly responsible for implementation of NAIP are: MoAIWD (the lead ministry), MoFEP&D, MoITT, MoLHUD, MoNREM, MoHP, MoLGRD, MoTPW and MoGSWCD. Other important ministries, though not directly part of NAIP implementation, include Ministry of Foreign Affairs; Ministry of Justice and Constitutional Affairs, Ministry of Labour and Vocational Training, Ministry of Youth Development and Empowerment and Ministry of Education

185
National Agricultural Investment Plan
59. The Ministry of Agriculture, Irrigation and Water Development (MoAIWD) is the government agency with overall responsibility for implementation of the NAIP. It is expected to undertake a lead role through its departments and units, which may be subject to significant re-organisation according to the recent Core Functional Analysis (CFA), and development of a Strategic Plan for implementation of its recommendations. The re-organisation process is envisaged to off-load non-core functions to non-state actors, while focusing on core functions of Government. These are defined as: policy formulation (including provision of guidelines and standards), stakeholder coordination, M&E of implementation of all functions and activities in the sector.
60. The CFA, which was finalised in July 2016, recommends a major re-structuring of upper management hierarchy MoAIWD which will have a bearing on the way that the NAIP is managed and coordinated. The objective of the exercise was to streamline MoAIWD functions so that technical departments focus only on those functions that are core to their mandates. It is expected that once the shedding off of functions takes place and they are relocated to players in the sector who possess the necessary capacities, it will result in the public service in the agriculture sector becoming more effective and efficient in the delivery of services to beneficiaries.
61. The CFA recommended a high-level re-organisation of the Ministry structure which reflects the strategic intent of the MoAIWD. It does not go down to the Departmental and Unit structures, and does not consider issues related to the merging of the irrigation and agricultural ministries which took place during the course of the exercise. The key recommendations of the CFA are summarised in Box 1.
Box 1: Core Functional Analysis: Key RecommendationsOptions for the Structure of MoAIWD
• Option 1: Chief Director has responsibility for technical operations including the ASWAp/NAIP Secretariat. All Support Services Departments report to the PS. This will ensure that there is focus on value addition required from these support areas and that priority is given towards stakeholder engagement via the ASWAp/NAIP.
• Option 2: Chief Director has responsibility for administrative functions and support service departments including the Department of Commercialisation. The ASWAp/NAIP would remain a Unit under the Planning Services Department. The coordination and supervision of agriculture-related State Corporations and Institutions should also come under this office.
Both Options reduce the number of positions reporting directly to the PS (currently around 20) providing better scope for coordination and supervision. They will ensure that the PS’s span of control is narrowed, but has better focus in terms of overall supervision of the Ministry.
In view of the importance of commercialisation in the growth of the sector and in the achievement of the government’s goals of poverty reduction and food security, there is need to create a separate department to deal with agriculture commercial issues. The department will house units such as Agri-business (currently under DAES), Trade and Marketing (currently under DAPS) and any others that can drive the commercialisation agenda and will report to the Chief Director.
It is recommended that for better coordination and to ensure that there is a focus on the major stakeholders, directorates be established which can house departments or functions that are more or less closely related. The proposed directorates will be: Lands, Extension and Crop Development; and Animal and Fisheries Development. The DARS, in view of its cross cutting nature, will stand alone and report directly to the Chief Director where the CD has responsibility for all Technical departments. Below the directorates will be Departments and specialised Units.
ADDs will continue to offer technical backstopping services to districts and carry the Ministry’s mandate at regional level. DADOs are in the process of being integrated into the decentralised structure under the District Commissioners. Once the process is finalised, the DADOs will no longer be part of the Ministry’s structure.

186
National Agricultural Investment Plan
62. MoITT plays an important role in creating an enabling environment and incentives for private investors, in areas such as trade policies, cooperatives, SME development, and investment promotion. It is the lead implementing agency for the NES, with important linkages to the agricultural sector.
63. To undertake various commercial and service oriented services on behalf a Government, a number of parastatals, boards and trusts are established. Parastatals, public boards and various line-ministry subsidiaries have been key for development of the agricultural sector and have in some cases substituted for private sector which has not always been vibrant in Malawi. Most of these have been formed through Acts of Parliament and have access to public funds. Their roles are both in provision of public goods and on a profit-making basis, such as State-Owned Enterprises, or research institutions which operate on a cost recovery basis and Trusts. Trusts do not regularly access public funding but may get Government support for accessing credit or donor funding.
64. The Agricultural Technologies Clearing Committee (ATCC) formed under MoAIWD and is mandated to pass agricultural technologies which have been tested in Malawi’s conditions and have scientifically proven to be viable and demand-driven to increase productivity to both smallholder farmers as well as commercial farmers to improve livelihoods and economic development in the country. Varieties may be developed by public or private research services, but need to pass through this committee before being released into the public.
65. The Agricultural Research and Extension Trust (ARET) is a research institution responsible for conducting research and providing technical and extension services on tobacco. The Trust was established on 1st September 1995 to foster development and dissemination of technologies for Malawi’s tobacco industry. It amalgamated the services of two institutions, Tobacco Research Institute of Malawi (TRIM) and the Estate Extension Service Trust (EEST), who separately provided research and extension services respectively. ARET is entirely owned and controlled by tobacco farmers, who provide funding to the Trust through a levy.
66. ADMARC is a parastatal which was established to promote Malawi economy by increasing the volume and quality of agricultural exports, to develop new foreign markets for consumption of Malawian agricultural produce and to support Malawi’s farmers. ADMARC plays a role in supplying inputs and providing extension services to farmers, making it easy for farmer to access inputs and providing them with ready market for their produce. Government has also used ADMARC to regulate the price of key commodities like maize.
67. The Malawi Bureau of Standards (MBS) is a statutory organization established in 1972 that is responsible for the preparation and publication of standards; promotion of standards and quality in Malawi; implementation of Malawi standards through relevant conformity assessment programs; National Metrology System. The MBS is governed by a Board of Directors (Malawi Standards Board) which is appointed by Government.
68. The Green Belt Initiative (GBI) was a Presidential Initiative of 2010, aiming to increase the irrigated area in the country, through coordination of actors and attracting private sector investment. The initiative has had a slow start. Recently, the GBI has undergone transformation to become Green Belt Authority (GBA). The Authority is responsible for: (i) marketing irrigation projects to investors: (ii) conducting market analyses and; (iii) conducting feasibility studies of potential irrigation schemes and promoting PPPs and Joint Ventures in irrigation.

187
National Agricultural Investment Plan
69. National Food Reserve Agency (NFRA) deals with management and maintenance of physical food stocks and financial resources for tackling national food insecurity and responding to emergency needs of vulnerable populations. The Mandate of NFRA includes procuring, store and releasing grain as determined by the Trustees in line with procedure and operations manual. NFRA has recently developed new guidelines for transparent management of the Strategic Grain Reserves.
70. Malawi Investment and Trade Centre (MITC) is a trade and investment promotion agency which acts as a one-stop for business start-ups and potential investors. MITC provides support to potential investors and facilities exports across sectors. Specifically, it analyses prospective project for financial, social and environmental concerns; coordinated pre-planning and evaluation of sites and post-site visits; sources joint venture domestic and national partners; and profiling local investment opportunities.
71. Reserve Bank of Malawi (RBM). The mandate of the Reserve Bank is to regulate the banking sector, to provide for the supervision of banks and financial institutions; and for matters connected therewith. From ensuring price stability which makes farm inputs prices predictable to determining exchange rate policy which affects farmer incomes especially on exportable crops, the central bank is key.
72. National Statistics Office (NSO) is responsible for collection, compilation, analysis, abstraction, publication and dissemination of statistical information; and for matters connected therewith and incidental thereto. NSO provides information for decision making which includes export information, population statistics and trends in the economy.
73. Malawi Plant Genetic Resource Centre is based at Chitedze Agricultural Research Station, making it the country’s depository centre of plant germplasm. The MPGRC is key in making agriculture adaptive to changing climate conditions, producing drought resistant crops, high yielding varieties and more productive livestock in terms of meat, milk and other products.
74. Root and Tuber Crops Development Trust (RTCDT) has a mission is to spearhead the development of a vibrant root and tuber crops industry. RTCDT is central to promote root and tuber crops which have become more important in food security drive due to their resilient to drought and dry spell. The root and tuber crops also play a key role in food processing.
75. The Competition and Fair-Trading Commission (CFTC) has a mandate to regulate, monitor, control and prevent acts or behaviours which would adversely affect competition and fair trading in Malawi.
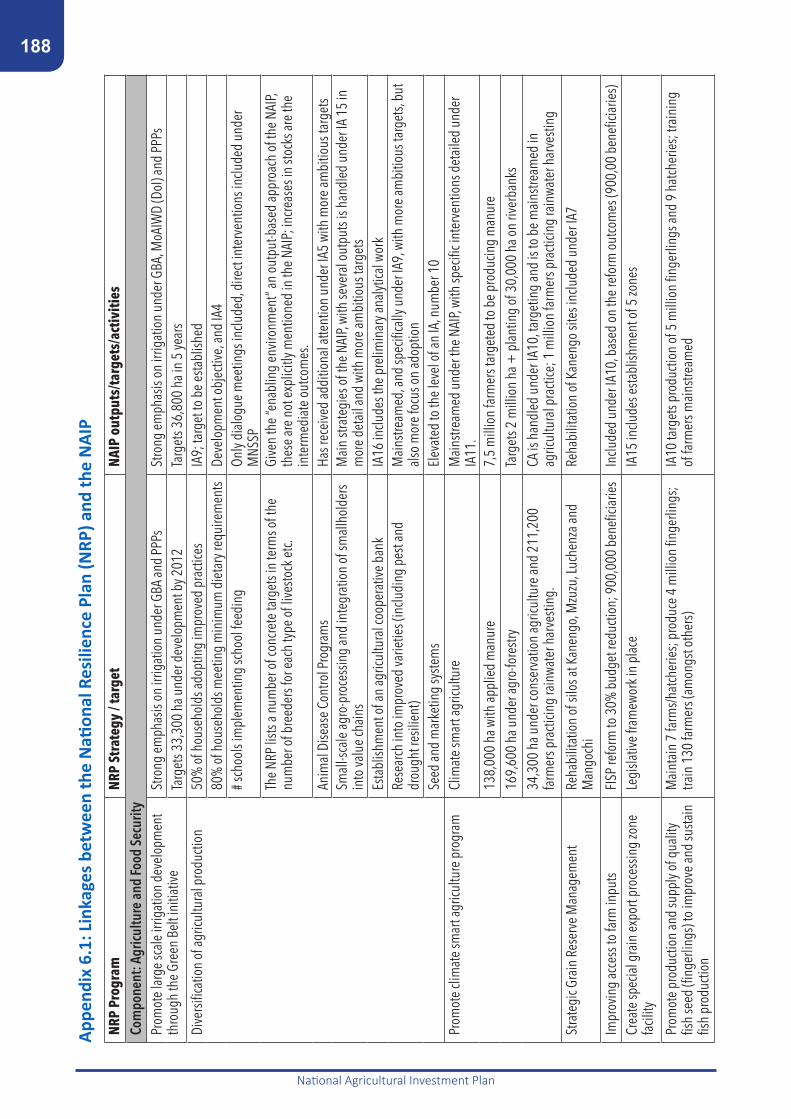
188
National Agricultural Investment Plan
Appe
ndix
6.1
: Lin
kage
s bet
wee
n th
e N
ation
al R
esili
ence
Pla
n (N
RP) a
nd th
e N
AIP
NRP
Prog
ram
NRP
Stra
tegy
/ ta
rget
NAIP
out
puts
/targ
ets/
activ
ities
Com
pone
nt: A
gricu
lture
and
Food
Sec
urity
Pr
omot
e la
rge
scal
e irr
igat
ion
deve
lopm
ent
thro
ugh
the
Gree
n Be
lt in
itiat
iveSt
rong
em
phas
is on
irrig
atio
n un
der G
BA an
d PP
PsSt
rong
em
phas
is on
irrig
atio
n un
der G
BA, M
oAIW
D (D
oI) a
nd P
PPs
Targ
ets 3
3,30
0 ha
und
er d
evel
opm
ent b
y 201
2Ta
rget
s 36,
800
ha in
5 ye
ars
Dive
rsifi
catio
n of
agric
ultu
ral p
rodu
ction
50%
of h
ouse
hold
s ado
ptin
g im
prov
ed p
racti
ces
IA9;
targ
et to
be
esta
blish
ed
80%
of h
ouse
hold
s mee
ting
min
imum
die
tary
requ
irem
ents
Deve
lopm
ent o
bjec
tive,
and
IA4
# sch
ools
impl
emen
ting
scho
ol fe
edin
gOn
ly di
alog
ue m
eetin
gs in
clude
d, d
irect
inte
rven
tions
inclu
ded
unde
r M
NSSP
The
NRP
lists
a num
ber o
f con
cret
e ta
rget
s in
term
s of t
he
num
ber o
f bre
eder
s for
eac
h ty
pe o
f live
stock
etc.
Give
n th
e “e
nabl
ing
envir
onm
ent”
an o
utpu
t-bas
ed ap
proa
ch o
f the
NAI
P, th
ese
are
not e
xplic
itly m
entio
ned
in th
e NA
IP; i
ncre
ases
in st
ocks
are
the
inte
rmed
iate
out
com
es.
Anim
al D
iseas
e Co
ntro
l Pro
gram
sHa
s rec
eive
d ad
ditio
nal a
ttent
ion
unde
r IA5
with
mor
e am
bitio
us ta
rget
sSm
all-s
cale
agro
-pro
cess
ing
and
inte
grat
ion
of sm
allh
olde
rs
into
valu
e ch
ains
Mai
n str
ateg
ies o
f the
NAI
P, wi
th se
vera
l out
puts
is ha
ndle
d un
der I
A 15
in
mor
e de
tail
and
with
mor
e am
bitio
us ta
rget
sEs
tabl
ishm
ent o
f an
agric
ultu
ral c
oope
rativ
e ba
nkIA
16 in
clude
s the
pre
limin
ary a
nalyt
ical w
ork
Rese
arch
into
impr
oved
varie
ties (
inclu
ding
pes
t and
dr
ough
t res
ilien
t)M
ains
tream
ed, a
nd sp
ecifi
cally
und
er IA
9, w
ith m
ore
ambi
tious
targ
ets,
but
also
mor
e fo
cus o
n ad
optio
nSe
ed an
d m
arke
ting
syste
ms
Elev
ated
to th
e le
vel o
f an
IA, n
umbe
r 10
Prom
ote
clim
ate
smar
t agr
icultu
re p
rogr
amCl
imat
e sm
art a
gricu
lture
Mai
nstre
amed
und
er th
e NA
IP, w
ith sp
ecifi
c int
erve
ntio
ns d
etai
led
unde
r IA
11.
138,
000
ha w
ith ap
plie
d m
anur
e 7,
5 m
illio
n fa
rmer
s tar
gete
d to
be
prod
ucin
g m
anur
e 16
9,60
0 ha
und
er ag
ro-fo
restr
yTa
rget
s 2 m
illio
n ha
+ p
lant
ing
of 3
0,00
0 ha
on
river
bank
s34
,300
ha u
nder
cons
erva
tion
agric
ultu
re an
d 21
1,20
0 fa
rmer
s pra
cticin
g ra
inwa
ter h
arve
sting
. CA
is h
andl
ed u
nder
IA10
, tar
getin
g an
d is
to b
e m
ains
tream
ed in
ag
ricul
tura
l pra
ctice
; 1 m
illio
n fa
rmer
s pra
cticin
g ra
inwa
ter h
arve
sting
Stra
tegi
c Gra
in R
eser
ve M
anag
emen
tRe
habi
litat
ion
of si
los a
t Kan
engo
, Mzu
zu, L
uche
nza a
nd
Man
goch
iRe
habi
litat
ion
of K
anen
go si
tes i
nclu
ded
unde
r IA7
Impr
ovin
g ac
cess
to fa
rm in
puts
FISP
refo
rm to
30%
bud
get r
educ
tion;
900
,000
ben
eficia
ries
Inclu
ded
unde
r IA1
0, b
ased
on
the
refo
rm o
utco
mes
(900
,00
bene
ficia
ries)
Crea
te sp
ecia
l gra
in e
xpor
t pro
cess
ing
zone
fa
cility
Legi
slativ
e fra
mew
ork i
n pl
ace
IA15
inclu
des e
stabl
ishm
ent o
f 5 zo
nes
Prom
ote
prod
uctio
n an
d su
pply
of q
ualit
y fis
h se
ed (fi
nger
lings
) to
impr
ove
and
susta
in
fish
prod
uctio
n
Mai
ntai
n 7
farm
s/hat
cher
ies;
prod
uce
4 m
illio
n fin
gerli
ngs;
train
130
farm
ers (
amon
gst o
ther
s)IA
10 ta
rget
s pro
ducti
on o
f 5 m
illio
n fin
gerli
ngs a
nd 9
hat
cher
ies;
train
ing
of fa
rmer
s mai
nstre
amed
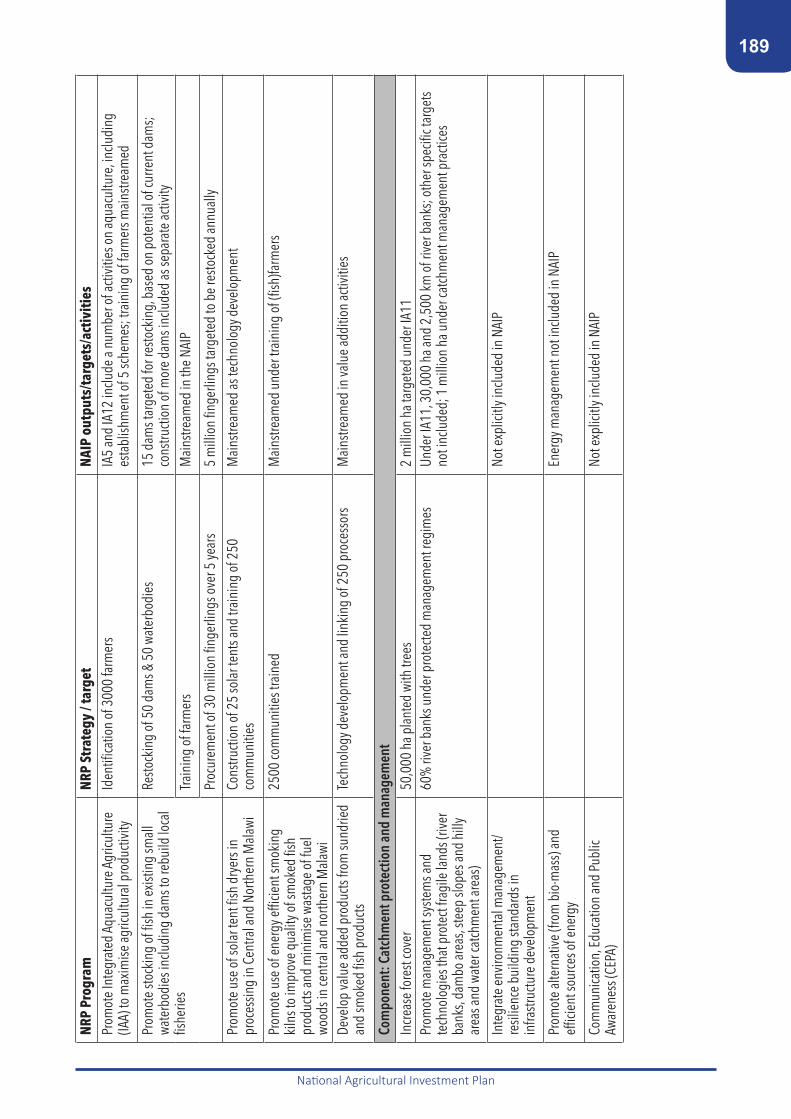
189
National Agricultural Investment Plan
NRP
Prog
ram
NRP
Stra
tegy
/ ta
rget
NAIP
out
puts
/targ
ets/
activ
ities
Prom
ote
Inte
grat
ed A
quac
ultu
re A
gricu
lture
(IA
A) to
max
imise
agric
ultu
ral p
rodu
ctivit
y Id
entifi
catio
n of
300
0 fa
rmer
sIA
5 an
d IA
12 in
clude
a nu
mbe
r of a
ctivit
ies o
n aq
uacu
lture
, inclu
ding
es
tabl
ishm
ent o
f 5 sc
hem
es; t
rain
ing
of fa
rmer
s mai
nstre
amed
Prom
ote
stock
ing
of fi
sh in
exis
ting
smal
l wa
terb
odie
s inc
ludi
ng d
ams t
o re
build
loca
l fis
herie
s
Resto
ckin
g of
50
dam
s & 5
0 wa
terb
odie
s 15
dam
s tar
gete
d fo
r res
tock
ing,
bas
ed o
n po
tent
ial o
f cur
rent
dam
s; co
nstru
ction
of m
ore
dam
s inc
lude
d as
sepa
rate
activ
ity
Train
ing
of fa
rmer
sM
ains
tream
ed in
the
NAIP
Proc
urem
ent o
f 30
mill
ion
finge
rling
s ove
r 5 ye
ars
5 m
illio
n fin
gerli
ngs t
arge
ted
to b
e re
stock
ed an
nual
ly
Prom
ote
use
of so
lar t
ent fi
sh d
ryer
s in
proc
essin
g in
Cen
tral a
nd N
orth
ern
Mal
awi
Cons
tructi
on o
f 25
sola
r ten
ts an
d tra
inin
g of
250
co
mm
uniti
es
Mai
nstre
amed
as te
chno
logy
dev
elop
men
t
Prom
ote
use
of e
nerg
y effi
cient
smok
ing
kiln
s to
impr
ove
qual
ity o
f sm
oked
fish
pr
oduc
ts an
d m
inim
ise w
asta
ge o
f fue
l wo
ods i
n ce
ntra
l and
nor
ther
n M
alaw
i
2500
com
mun
ities
trai
ned
Mai
nstre
amed
und
er tr
aini
ng o
f (fis
h)fa
rmer
s
Deve
lop
valu
e ad
ded
prod
ucts
from
sund
ried
and
smok
ed fi
sh p
rodu
cts
Tech
nolo
gy d
evel
opm
ent a
nd li
nkin
g of
250
pro
cess
ors
Mai
nstre
amed
in va
lue
addi
tion
activ
ities
Com
pone
nt: C
atch
men
t pro
tect
ion
and
man
agem
ent
Incr
ease
fore
st co
ver
50,0
00 h
a pla
nted
with
tree
s 2
mill
ion
ha ta
rget
ed u
nder
IA11
Prom
ote
man
agem
ent s
yste
ms a
nd
tech
nolo
gies
that
pro
tect
fragi
le la
nds (
river
ba
nks,
dam
bo ar
eas,
steep
slop
es an
d hi
lly
area
s and
wat
er ca
tchm
ent a
reas
)
60%
rive
r ban
ks u
nder
pro
tecte
d m
anag
emen
t reg
imes
Un
der I
A11,
30,
000
ha an
d 2,
500
km o
f rive
r ban
ks; o
ther
spec
ific t
arge
ts no
t inc
lude
d; 1
mill
ion
ha u
nder
catch
men
t man
agem
ent p
racti
ces
Inte
grat
e en
viron
men
tal m
anag
emen
t/ re
silie
nce
build
ing
stand
ards
in
infra
struc
ture
dev
elop
men
t
Not e
xplic
itly i
nclu
ded
in N
AIP
Prom
ote
alte
rnat
ive (f
rom
bio
-mas
s) an
d ef
ficie
nt so
urce
s of e
nerg
y En
ergy
man
agem
ent n
ot in
clude
d in
NAI
P
Com
mun
icatio
n, E
duca
tion
and
Publ
ic Aw
aren
ess (
CEPA
)No
t exp
licitl
y inc
lude
d in
NAI
P

190
National Agricultural Investment Plan
NRP
Prog
ram
NRP
Stra
tegy
/ ta
rget
NAIP
out
puts
/targ
ets/
activ
ities
Com
pone
nt: F
lood
Con
trol
by
cons
truc
tion
of D
ykes
, Dam
s and
Riv
er Tr
aini
ng
Cons
tructi
on o
f dam
s inc
lude
d fo
r wat
er m
anag
emen
t
Com
pone
nt: E
arly
War
ning
Sys
tem
s
Enha
nce
early
war
ning
syste
mIn
stalla
tion
of w
eath
er, h
ydro
logi
cal, c
onve
ntio
nal w
eath
er
and
hydr
olog
ical s
yste
ms
Wea
ther
stat
ions
at E
PA le
vel (
204)
inclu
ded
unde
r IA
7
Syste
ms a
nd p
latfo
rms f
or d
issem
inat
ion
of e
arly
warn
ing
mes
sage
s im
prov
ed
Inclu
ded
unde
r IA7
Com
pone
nt: S
ocia
l Sup
port
Pro
gram
s
Rela
ted
to M
NSSP
Stra
tegi
es o
f coo
rdin
atio
n ar
e in
clude
d

191
National Agricultural Investment Plan
Appe
ndix
6.2
: Lin
kage
s bet
wee
n th
e Jo
int S
ecto
r Pla
n an
d th
e N
AIP
JSP
pilla
rJS
P ac
tivity
NAIP
out
put/a
ctiv
ityPi
llar 1
: Mar
ket D
evel
opm
ent a
nd A
cces
sM
arke
t Dev
elop
men
t –
Oilse
eds
Deve
lop
exte
nsio
n co
ordi
natio
n pl
atfo
rmPl
atfo
rm is
in p
lace
and
deta
iled
unde
r the
Ext
ensio
n Po
licy –
supp
ort i
s pr
ovid
ed to
esta
blish
men
t of d
atab
ases
(IA9
)Im
plem
ent S
ADC
seed
har
mon
izatio
n pr
otoc
ols a
nd d
evel
op se
mi-
auto
nom
ous S
eed
Serv
ices U
nit
Both
inclu
ded
unde
r IA1
0
Facil
itate
link
age
of se
ed co
mpa
nies
to sm
alle
r irri
gatio
n sc
hem
es fo
r the
pr
oduc
tion
of o
ilsee
ds cr
ops
A str
ateg
y of t
he N
AIP,
mai
nstre
amed
Sim
plify
ing
of e
xistin
g ex
port
proc
edur
es re
late
d to
oils
eeds
crop
sIA
14 in
clude
s sev
eral
mea
sure
s (fo
r all
crop
s)Im
plem
ent d
ivers
ifica
tion
plan
for t
he A
gricu
lture
Res
earc
h an
d Ex
tens
ion
Trust
Inclu
ded
unde
r IA9
Mar
ket D
evel
opm
ent
– Sug
ar C
ane
Prod
ucts
(SCP
)
Deve
lop
SCP
regu
lato
ry fr
amew
ork
Supp
ort t
o TIP
-SW
AP TW
Gs in
clude
d (IA
1); n
o re
fere
nces
to sp
ecifi
c co
mm
oditi
es
Impl
emen
t SCP
clus
ter e
xten
sion
serv
ices s
trate
gyNo
t det
aile
d ou
t to
spec
ific c
omm
oditi
es
Impl
emen
t acc
ess t
o la
nd st
rate
gy fo
r all
prio
rity c
luste
rs in
cludi
ng S
CPIA
6 in
clude
s a n
umbe
r of a
ctivit
ies r
elat
ed to
the
upda
ted
Land
Pol
icy
Mar
ket D
evel
opm
ent –
M
anuf
actu
ring
TWGs
; TA;
Adv
isory
and
Supp
ort C
entre
; Su
ppor
t to T
IP-S
WAP
TWGs
inclu
ded
(IA1)
;
Inve
stor F
acili
tatio
n Pr
ogra
m fo
r man
ufac
ture
s sub
-clus
ters
Not i
nclu
ded
Regu
lato
ry fr
amew
ork f
or S
pecia
l Eco
nom
ic Zo
nes a
nd E
xpor
t Pro
cess
ing
Zone
s In
clude
d un
der I
A15
Info
rmat
ion
pack
age
on ac
cess
to fi
nanc
eTra
inin
g of
farm
ers i
nclu
ded
unde
r IA1
6
Mar
ket D
evel
opm
ent -
To
bacc
oSu
ppor
t to
inte
grat
ed p
rodu
ction
syste
mA
strat
egy o
f the
NAI
PCF
TC to
ens
ure
appr
opria
te re
gula
tory
fram
ewor
k A
strat
egy u
nder
the
NAIP,
but
no
com
mod
ity-sp
ecifi
c ref
eren
ces
Mar
ket D
evel
opm
ent -
Tea
Impl
emen
tatio
n an
d en
actm
ent o
f the
Land
Bill
In
clude
d un
der I
A5
Mar
ket A
cces
s – Tr
ade
Polic
y and
Trad
e Ag
reem
ents
Impr
ove
trade
pol
icies
and
capa
citie
s St
udie
s on
trade
pol
icy in
clude
d un
der I
A5 an
d IA
14

192
National Agricultural Investment Plan
JSP
pilla
rJS
P ac
tivity
NAIP
out
put/a
ctiv
ityM
arke
t Acc
ess –
Trad
e Fa
cilita
tion
Natio
nal T
rade
Facil
itatio
n Co
mm
ittee
mee
tings
; Aut
omat
ed sy
stem
s for
cu
stom
s and
bor
ders
; aud
it; M
alaw
i Rev
enue
Aut
horit
y; R
isk M
anag
emen
t Un
it, C
omm
ercia
l Cou
rt;
Not i
nclu
ded,
but
com
plim
enta
ry ac
tiviti
es to
ward
s tra
de fa
cilita
tion
are
the
thru
st of
IA14
Rem
ove
mul
tiple
tarif
fs A
strat
egy o
f the
NAI
P; in
clude
d un
der t
rade
stud
ies (
IA14
)
Esta
blish
one
-stop
bor
der p
osts
Not e
xplic
itly i
nclu
ded,
but
vario
us ac
tiviti
es re
late
d to
ag b
orde
r pos
ts (IA
3)
and
quar
antin
e fa
ciliti
es (I
A8)
Revie
w Co
ntro
l of G
oods
Act
Revie
w of
subs
idia
ry le
gisla
tion
inclu
ded
unde
r IA1
4Es
tabl
ish S
MS
syste
m to
diss
emin
ate
mar
ket p
rices
to fa
rmer
s In
clude
d un
der I
A14,
with
spec
ific r
efer
ence
to N
ES
Vario
us st
udie
s on
expo
rt ba
ns
Inclu
ded
unde
r IA1
4 on
trad
e stu
dies
Im
plem
ent t
he M
APAC
MAP
AC ac
tiviti
es in
clude
d an
d up
grad
ed to
full
IA (I
A 5)
Prom
ote
agric
ultu
ral e
xpor
tsA
strat
egy o
f the
NAI
PPr
omot
e co
mm
ercia
l pro
ducti
on an
d ag
ro-p
roce
ssin
g A
strat
egy o
f the
NAI
P
Pilla
r 2: P
rivat
e Se
ctor
Dev
elop
men
tId
entif
y and
addr
ess e
xpor
t inf
orm
atio
n ga
ps
Vario
us tr
ade
studi
es in
clude
d un
der I
A14
Acce
ss to
inpu
ts – e
nerg
y IA
15
inclu
des e
stabl
ishm
ent o
f rur
al e
lectr
ifica
tion
for a
gro-
proc
esso
rs, b
ut
natio
nal l
evel
initi
ative
s not
inclu
ded
Acce
ss to
inpu
ts – f
arm
in
puts
Refo
rm se
ed p
olicy
Inclu
ded
unde
r IA1
0Im
prov
e ta
rget
ing
and
impl
emen
tatio
n of
FISP
, incr
ease
focu
s on
seed
sIn
clude
d un
der I
A10
Impl
emen
t MoU
on
Harm
oniza
tion
of S
ADC
and
COM
ESA
seed
pro
toco
ls In
clude
d un
der I
A10
Acce
ss to
inpu
ts – l
and
Fast-
track
impl
emen
tatio
n of
amen
dmen
ts to
land
regi
strat
ion,
inclu
ding
au
tom
ated
land
s reg
istry
and
land
info
rmat
ion
man
agem
ent s
yste
ms
Inclu
ded
unde
r IA1
0 wi
th a
wide
rang
e of
activ
ities
Allo
cate
sign
ifica
nt in
vestm
ents
in th
e ca
pacit
y of l
and
adm
inist
ratio
nIn
clude
d un
der I
A10
with
a wi
de ra
nge
of ac
tiviti
esSu
ppor
t mec
hani
zatio
n of
smal
l-sca
le ag
ricul
ture
to im
prov
e la
nd p
rodu
ctivit
y an
d re
duce
pre
ssur
e on
land
IA13
dea
ls ex
plici
tly w
ith m
echa
niza
tion
Impl
emen
t Fin
ancia
l Sec
tor D
evel
opm
ent P
olicy
De
velo
pmen
t and
impl
emen
tatio
n of
War
ehou
se R
ecei
pt an
d Co
mm
odity
Ex
chan
ge R
egul
ator
y Fra
mew
ork
Inclu
ded
unde
r IA1
4

193
National Agricultural Investment Plan
Pilla
r 3: S
kills
Dev
elop
men
t and
Bus
ines
s Adv
isor
y Se
rvice
s
Acce
ss to
Bus
ines
s Adv
isory
Se
rvice
s – Ex
tens
ion
Coor
dina
tion
prog
ram
, tra
inin
g fa
rmer
s, str
engt
heni
ng D
AES
and
targ
etin
g NE
S pr
iorit
y cro
psTra
inin
g of
farm
ers i
nclu
ded
unde
r IA9
, and
DAE
S str
engt
heni
ng u
nder
IA
3 (a
nd IA
1)
Acce
ss to
Bus
ines
s Ad
visor
y Ser
vices
– Co
oper
ative
s Sup
port
Stre
ngth
en ca
pacit
y of s
mal
lhol
der e
nter
prise
s and
coop
erat
ives t
o be
tter
impl
emen
t stra
tegi
es fo
r coo
pera
tives
em
powe
rmen
tIn
tegr
al p
art o
f IA2
Colla
bora
te w
ith st
akeh
olde
rs o
n pr
oces
sing
and
prod
uct m
arke
ting
Stra
tegy
of I
A2
Prom
ote
good
corp
orat
e go
vern
ance
and
acco
unta
bilit
y No
t dire
ctly i
nclu
ded
but i
mpl
ied
thou
gh TA
for c
ertifi
catio
n et
c.
Facil
itate
and
mob
ilise
pro
duce
rs/tr
ader
s and
serv
ice p
rovid
ers t
o be
trai
ned
in
qual
ity, s
tand
ards
, pric
ing,
labe
lling
, exp
ort p
roce
dure
s and
bus
ines
s man
agem
ent
Inclu
ded
unde
r IA1
4
Orga
nise
buy
er-se
ller m
eetin
gs to
facil
itate
conn
ectio
n to
mar
kets
Inclu
ded
unde
r IA1
4
Deve
lop
a tra
inin
g pr
ogra
m o
n qu
ality
cont
rol i
n ex
istin
g co
oper
ative
s TA
inclu
ded
unde
r IA2

194
National Agricultural Investment Plan
Appe
ndix
6.3
: Lin
kage
s bet
wee
n th
e Cl
imat
e Ch
ange
Inve
stm
ent P
lan
(CCI
P) a
nd th
e N
AIP
CCIP
Inve
stm
ent A
reas
CCIP
obj
ectiv
esNA
IP in
terv
entio
ns
Adap
tatio
nIn
tegr
ated
Wat
ersh
ed
Man
agem
ent P
rogr
amIn
tegr
ated
land
use
man
agem
ent p
lans
in p
riorit
y wat
ersh
eds a
nd re
serv
oirs
with
str
ong
capa
city o
n go
vern
ance
and
mon
itorin
g sy
stem
s IA
7 in
clude
s pre
para
tion
of d
isaste
r-res
ilien
t lan
d us
e pl
ans,
and
IA11
on
gen
eral
agric
ultu
ral l
and
use
plan
ning
Im
prov
e fo
rest
and
land
cove
r on
degr
aded
area
s of w
ater
shed
s and
rese
rvoi
rs b
y pr
omot
ing
com
mun
ity fo
rest
resto
ckin
g us
ing
a lan
dsca
pe ap
proa
ch
Impr
ovem
ent o
f for
est c
over
is in
clude
d un
der I
A11,
and
issue
s of l
and
cove
r in
GAP
guid
elin
es, m
ains
tream
ed an
d up
scal
ed u
nder
IA9.
Redu
ce se
dim
ent l
oad
in ke
y sel
ecte
d re
serv
oirs
serv
ed b
y sel
ecte
d ca
tchm
ent a
reas
No
t inc
lude
d
Impr
ovin
g Cl
imat
e Ch
ange
Com
mun
ity
Resil
ienc
e th
roug
h Ag
ricul
ture
Pro
ducti
on
Impr
ove
soil
ferti
lity a
nd la
nd u
se m
anag
emen
t in
key a
reas
As ab
ove
(IA 9
and
11)
Enha
nce
susta
inab
le ir
rigat
ion
farm
ing
syste
ms i
n se
lecte
d di
strict
s pro
ne to
cli
mat
e ch
ange
effe
ctsIrr
igat
ion
farm
ing
syste
ms a
re an
ove
rarc
hing
prio
rity o
f the
NAI
P, un
der
IA12
Prom
ote
clim
ate
chan
ge ad
aptiv
e ag
ricul
tura
l tec
hnol
ogie
s tar
getin
g cli
mat
e ch
ange
pro
ne ar
eas
Clim
ate
chan
ge ad
aptiv
e pr
oper
ties a
re m
ains
tream
ed in
rese
arch
(IA9
), as
wel
l as u
nder
pes
t and
dise
ase
man
agem
ent (
IA8)
Incr
ease
hou
seho
ld in
com
e th
roug
h su
stain
able
agric
ultu
ral d
ivers
ifica
tion
in
sele
cted
distr
icts p
rone
to cl
imat
e ch
ange
Incr
ease
d ho
useh
old
inco
me
is an
ove
rarc
hing
targ
et o
f the
NAI
P
Clim
ate
Chan
ge
Proo
fing
of In
frastr
uctu
re
Deve
lopm
ent
Deve
lop
trans
port
infra
struc
ture
that
will
with
stand
clim
ate
chan
ge im
pacts
Road
s inc
lude
d un
der I
A15
are
up to
clim
ate
chan
ge /
all y
ear s
tand
ards
Enha
ncin
g Di
saste
r Risk
M
anag
emen
t En
hanc
e m
ains
tream
ing
of cl
imat
e ch
ange
rela
ted
disa
ster r
isk m
anag
emen
t in
all
secto
ral p
lann
ing
proc
esse
sIA
7 is
dedi
cate
d to
Disa
ster R
isk M
anag
emen
t, in
cludi
ng sp
ecifi
c su
ppor
t to
M&E
syste
ms a
nd tr
aini
ng o
f far
mer
s in
pann
ing
Impr
ove
disa
ster r
isk m
anag
emen
t inf
orm
atio
n sy
stem
sIm
prov
e co
mm
unity
bas
ed e
arly
warn
ing
syste
ms f
or va
rious
secto
ral
deve
lopm
ent p
rogr
ams a
nd p
roje
cts
Stre
ngth
en p
repa
redn
ess c
apac
ity fo
r effe
ctive
resp
onse
and
reco
very
Miti
gatio
n In
vest
men
ts
Redu
ction
of Em
ission
s fro
m
Defo
resta
tion a
nd Fo
rest
Degr
adati
on (R
EDD+
)
Incr
ease
area
und
er af
fore
statio
n an
d re
fore
statio
n Sp
ecifi
c tar
gets
are
inclu
ded
on ag
ro-fo
restr
y and
tree
-pla
ntin
g un
der
IA11
Clim
ate
Chan
ge R
esea
rch,
Tech
nolo
gy D
evel
opm
ent a
nd Tr
ansf
er
Clim
ate
Chan
ge
Adap
tatio
n Te
chno
logy
De
velo
pmen
t
Gene
rate
clim
ate
chan
ge ad
apta
tion
tech
nolo
gies
suita
ble
for M
alaw
i Ag
ricul
tura
l res
earc
h, im
prov
ed va
rietie
s etc.
is m
ains
tream
ed w
ith
clim
ate
chan
ge ad
apta
tion
tech
nolo
gies
(dro
ught
, pes
t tol
eran
t etc.
Pr
omot
e cli
mat
e ch
ange
adap
tatio
n te
chno
logi
es su
itabl
e fo
r Mal
awi

195
National Agricultural Investment Plan
Annex 7: Value Chain Prioritisation
Background
1. The key role of the private sector in the NAIP is consistent with the Malabo Declaration’s invitation for countries to establish a Country Agribusiness Partnership Framework (CAP-F). The purpose of the CAP-F is to: (i) enabling policy reforms through multi-stakeholder engagement and institutional support systems; and (ii) collaborations that will allow sharing of resources and capabilities for improving the efficiency of priority value chains. The CAP-F should be aligned with and complement the priority investments and value chains under the NAIP.
2. Value chain prioritisation is an important element of the CAP-F process. Initial identification of priorities is based on the IFPRI CGE model, stakeholder consultations, prioritisation in other policy frameworks and literature review. The approach was to identify priority subsectors that score well according to key selection criteria, such as potential for poverty reduction, broad-based growth, dietary diversity, diversification of production and trade, and potential for value addition. Within these subsectors, priority value chains will be selected during the CAP-F process based on further consultations with the private sector as more information from value chain studies becomes available. Currently the NAPAS Malawi project has conducted 12 value chain studies that can be the basis for selection of value chains to be developed. These include groundnut, pigeon peas, roots and tubers (cassava, sweet potato, Irish potato, and yams), macadamia nuts, tea, coffee, tomato, banana, and mango. GIZ is also conducting several value chains under the MIERA project.
3. Under the CAP-F, support to the priority value chains will be mainstreamed throughout the NAIP. Each priority value chain will select from a menu of intervention areas. The NAIP will support coordination platforms for each priority value chain, which will develop value chain-specific strategies that articulate needs and priorities. Such platforms will also help to orchestrate public, private and non-state actors and facilitate PPPs.
General Approach to Value Chain Prioritisation4. The need for diversification of the agricultural sector poses the question: “which value chains
other than maize and tobacco to focus on”? Prioritising value chains would allow a more focused use of limited public resources and institutional capacity and facilitate coordination and synergies between different NAIP intervention areas and actors in the agri-food system. This does not mean that the NAIP will only support these value chains; in view of the diversity of agro-ecologic conditions, the need for household-level diversification for food and nutrition-security purposes and resilience, and changing market opportunities there is need for balancing support for priority VC and other, location specific VCs. However, priority value chains would receive specific attention in targeting public investments, support services and policy reforms under the NAIP. For example, research efforts, the release of new varieties, access to inputs, technologies and extension services would be focused on the respective value chains.
5. Efforts to promote public-private partnerships with agribusiness would also be centred on these priority VCs and would involve continuous dialogue between public and private actors through multi-stakeholder value chain platforms to address specific policy, legal and regulatory issues or institutional bottlenecks. It would also include PPPs whereby public infrastructure investments in roads, irrigation or rural electrification would be linked to private investments in a way that maximises inclusion of local communities safeguarding the environment and food and nutrition security. PPPs would also entail partnerships in providing support services such as extension, business development, strengthening of farmer organisations and access to finance.
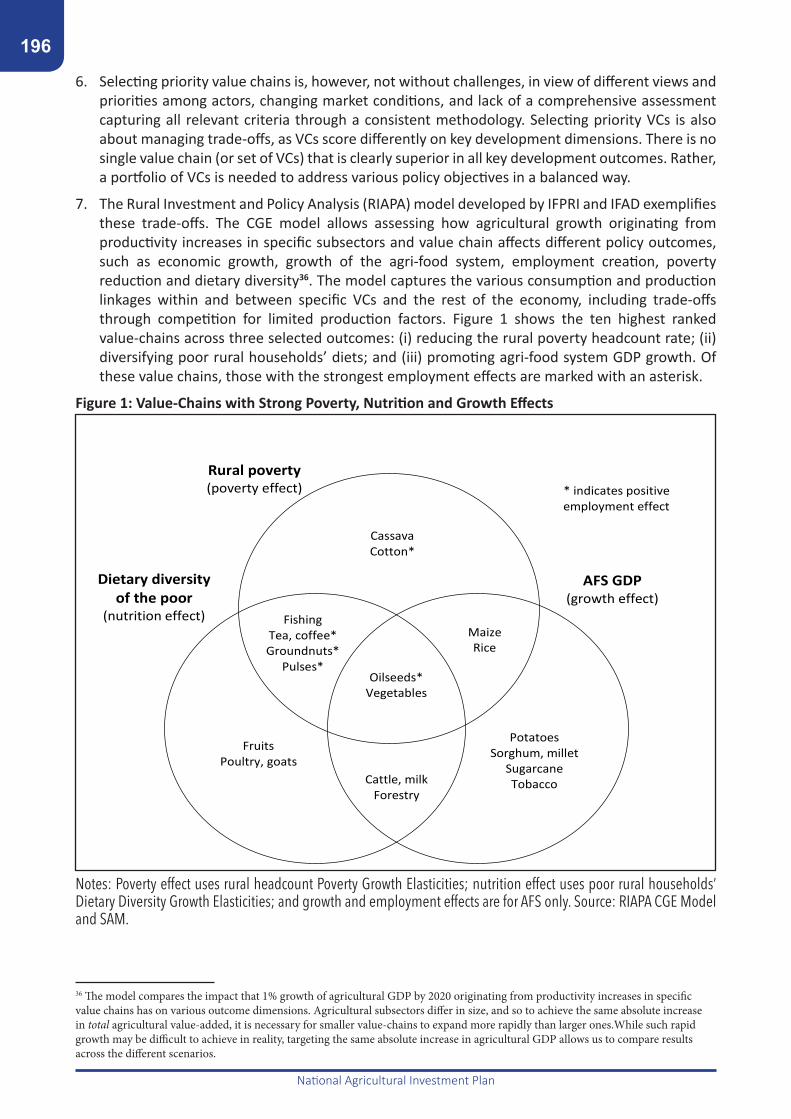
196
National Agricultural Investment Plan
6. Selecting priority value chains is, however, not without challenges, in view of different views and priorities among actors, changing market conditions, and lack of a comprehensive assessment capturing all relevant criteria through a consistent methodology. Selecting priority VCs is also about managing trade-offs, as VCs score differently on key development dimensions. There is no single value chain (or set of VCs) that is clearly superior in all key development outcomes. Rather, a portfolio of VCs is needed to address various policy objectives in a balanced way.
7. The Rural Investment and Policy Analysis (RIAPA) model developed by IFPRI and IFAD exemplifies these trade-offs. The CGE model allows assessing how agricultural growth originating from productivity increases in specific subsectors and value chain affects different policy outcomes, such as economic growth, growth of the agri-food system, employment creation, poverty reduction and dietary diversity36. The model captures the various consumption and production linkages within and between specific VCs and the rest of the economy, including trade-offs through competition for limited production factors. Figure 1 shows the ten highest ranked value-chains across three selected outcomes: (i) reducing the rural poverty headcount rate; (ii) diversifying poor rural households’ diets; and (iii) promoting agri-food system GDP growth. Of these value chains, those with the strongest employment effects are marked with an asterisk.
Figure 1: Value-Chains with Strong Poverty, Nutrition and Growth Effects
Oilseeds* Vegetables
Maize Rice
Rural poverty (poverty effect)
Dietary diversity of the poor
(nutrition effect)
AFS GDP (growth effect)
Fishing Tea, coffee* Groundnuts*
Pulses*
Potatoes Sorghum, millet
Sugarcane Tobacco
Fruits Poultry, goats
* indicates positive employment effect
Cattle, milk Forestry
Cassava Cotton*
Notes: Poverty effect uses rural headcount Poverty Growth Elasticities; nutrition effect uses poor rural households’ Dietary Diversity Growth Elasticities; and growth and employment effects are for AFS only. Source: RIAPA CGE Model and SAM.
36 The model compares the impact that 1% growth of agricultural GDP by 2020 originating from productivity increases in specific value chains has on various outcome dimensions. Agricultural subsectors differ in size, and so to achieve the same absolute increase in total agricultural value-added, it is necessary for smaller value-chains to expand more rapidly than larger ones.While such rapid growth may be difficult to achieve in reality, targeting the same absolute increase in agricultural GDP allows us to compare results across the different scenarios.

197
National Agricultural Investment Plan
8. Figure 1 shows that only two products are in the top-ten on all three outcome indicators: vegetables and oilseeds (with the latter also featuring within the 10 most effective VCs for employment creation). Oilseeds37 are a good option for achieving multiple objectives, even though they are not the most effective value chains for any particular outcome. Table 1 displays the top five value chains ranked according to their potential contribution to different development. The results show that traditional export crops such as tobacco and sugarcane score high on their contribution to overall economic growth and growth of the agri-food system. Tobacco also has an important positive impact on dietary diversity at household level, due to consumption and income linkages. Cotton is an effective value chain for employment generation and poverty reduction, but less effective in stimulating overall economic growth. Dairy and meat value chains are strong in contributing to economic growth and dietary diversity but are less effective in poverty reduction and employment generation.
Table 1: Top-5 Value Chains Ranked According to Their Potential Contribution to Different Development Outcome Indicators
Rank GDP growth Agri-food system growth Employment National poverty
headcount
1 Cattle, milk Cattle, milk Cotton Vegetables2 Forestry Sugarcane Tea, coffee Fishing3 Sugar cane Tobacco Groundnuts Cotton4 Tobacco Sorghum, millet Oilseeds are Tea, coffee
5 Maize Oilseeds Pulses Rice
6 Vegetables Vegetables Cattle, milk7 Fishing Cattle, milk Vegetables8 Cotton Fruits Fruits
9 Oilseeds Tobacco Pulses
10 Rice Sugarcane Groundnuts
*Measured through respective elasticities in response to 1% growth of overall agricultural GDP resulting from productivity increased in the respective value chains.
9. The results of the CGE models are a starting point for the identification of priority subsectors/value chains. However, for various reasons, additional information and analysis of specific value chains is needed.
• The model includes individual value chains but also clusters which complicates the comparisons. For example, oilseeds include sunflower and soybean, whereas cotton is analysed separately. Dairy and cattle production are lumped together, making it difficult to disaggregate which of the observed effects are due to dairy versus meat production.
• While the rankings convey value-chains’ relative strengths across outcome indicators, they do not show differences in absolute terms. For example, the first-ranked VC can be far more effective in achieving one outcome than the next best value-chain. Such a strong effect on one outcome might outweigh concerns about this value-chain’s weaker effect on other outcomes.
37Soybean, sunflower, sesame, cotton etc.

198
National Agricultural Investment Plan
• In addition to the outcomes covered in the CGE model, other criteria need to be considered for VC selection. These include (i) the feasibility of developing the respective sub-sectors/VC given their current structure, performance and governance; (ii) the interest of the private sector to invest in them; (iii) the alignment with existing policies (e.g., the priority subsectors identified under the NES, and the subsectors and commodities reflected in the NAP). Some outcomes require other indicators to be measured properly. For example, nutrition is measured through dietary diversity (contribution to a balanced food basket) but not based on the nutrition and health characteristics of individual crop and livestock products (e.g. in terms of micronutrient content, etc.).
• The model also does not look at environmental aspects including impacts and potential constraints. For example, fisheries production might be constrained by the need to maintain fishing stocks, hence growth would have to reside mainly from aquaculture.
• Export potential and competitiveness need to be considered.
10. Hence, the below selection of priority VCs is based on the results of the CGE model, stakeholder consultations, prioritisation in other policy frameworks (NES, ASWAp) and literature review. In any case, during NAIP formulation, value chain selection or prioritisation has to be carried out on the basis of limited information and based on the current market environment. However, at times, markets change rapidly and farmers and other private sector interest in specific VCs might not in reality materialise as anticipated during NAIP formulation.
11. Therefore, singling out a small number of target value chains for the next five years might be overly rigid. Rather, the approach is to select priority subsectors that score high on key selection criteria, such as their potential to contribute to poverty reduction, broad-based growth, dietary diversity, diversification of agricultural production and trade, and have potential for downstream value addition. Within these subsectors, priority value chains will eventually be selected based on further consultations with and interest from the private sector and as more information from VC studies becomes available. The selection of priority VCs will also be validated and fine-tuned during the CAP-F process. As NAIP implementation progresses, support to some VCs might be scaled down and other VCs might be added, depending on the responses and interests from key VC stakeholders and changing market trends. Based on the above considerations, the following subsectors are proposed to receive priority attention under the NAIP:
• Oilseeds (cotton, soybean, and others) are important smallholder crops with good market potential and prospects for export growth and downstream value addition. They have good potential to contribute to poverty reduction and dietary diversity, both directly - through oil edible oil consumption -, and indirectly, through increased incomes. The potential of oilseeds has already been identified under the NES and has been confirmed by the recent CGE model. There is an active Technical Working Group under the TIP/SWAP and a VC chain platform (in cotton) coordinating activities in the subsector. There is also an active private sector interest in these value chains.
• Legumes are another subsector with promising potential for broad-based, smallholder inclusive growth, poverty reduction and dietary diversity. Groundnuts are an important smallholder crop with domestic and export market potential and a nutrient-rich food if aflatoxin infestation would be better managed. Pigeon peas have shown a strong growth in recent years and export markets might be diversified beyond India. Other legumes such as common beans and cowpeas could also contribute to diversifying farming systems and diets. Due to their nitrogen-fixing properties, legumes play an important role in soil fertility management and reduce the need for mineral fertiliser. They can be integrated into cereal farming systems through mixed cropping or crop rotation. A Legumes Trust has been established to coordinate development of the subsector.

199
National Agricultural Investment Plan
• Horticultural crops, especially vegetables and, to a lesser extent, fruits score highly on the IFPRI model in terms of their contribution to poverty reduction and dietary diversity. They also contribute to overall growth, although to a lesser extent. While vegetables are a diverse category, the development of different types thereof requires similar interventions (e.g., coordination of production and marketing, investments in (cold) storage and transport and in irrigation). Moreover, the same actors are often involved at various levels of the value chain (seed suppliers, organised producers, wholesalers, processes and retailers). Hence, vegetables can be broadly considered as one value chain. Fruits are more diverse as they include mangoes, bananas, apples and oranges but also nuts such as macadamia and cashew. Further studies and stakeholder consultations are required to identify the fruit value chains with the highest potential for growth and value addition. Overall, development of fruit VCs is more challenging given investment requirements, gestation periods and post-harvest handling. Specific strategies may range from agro-forestry to out-grower schemes.
• Livestock, especially beef cattle and dairy, have strong domestic demand that will further expand with growing incomes. The IFPRI model shows strong potential in terms of poverty reduction, dietary diversity and overall growth. However, the subsector would require better organisation and its competitiveness needs to be further analysed. There has been strong demand growth for poultry meat and the value chain has strong backward linkages into oilseeds and maize (even though, trade-offs with foot security would have to be carefully managed in the latter case). Small stock such as goats and backyard poultry make important contributions to FNS, income diversification and more resilient livelihoods.
• Roots and tubers (especially cassava, Irish potato and orange-fleshed sweet potato), have strong potential to contribute to food and nutrition security. Cassava has been the second important food crop after maize but also has good potential for commercialisation and value addition, such as through processing into starch, high-quality cassava flour, beer and other products. It is drought-resistant, easy to cultivate and storable.
• Rice is a nice VC with good commercialisation and export potential. Malawi is producing high-quality rice with strong domestic and regional demand fetching price premia. There is a VC coordination platform and production and productivity could be increased strongly both on dryland and under irrigation.
12. The traditional crops, maize and tobacco, remain strategic and should not be neglected. The same applies to the traditional export crops such as sugar cane, tea and coffee. Nevertheless, activities should be better balanced between value chains and the above-mentioned subsectors should receive increasing attention under the NAIP. Support to the priority VCs should be mainstreamed throughout the NAIP. In other words, rather than having specific sub- components, each priority VC will draw from a menu of intervention areas. Under the CAP-F, the NAIP will support value chain coordination platforms for each priority VC. These platforms will develop VC specific strategies within the overall NAIP framework that will articulate specific needs and priorities. Such platforms will also help to orchestrate public, private and non-state actors and facilitate specific PPPs.

200
National Agricultural Investment Plan
Annex 8: List of Organisations ConsultedGoM Ministries, Departments and Agencies
ADMARC Agricultural Development and Marketing CorporationDAES Department of Agricultural Extension ServicesDAHLD Department of Animal Health and Livestock Development (MoAIWD)
DAPS Department of Agricultural Planning Services (MoAIWD)DARS Department of Agricultural Research Services (MoAIWD)DLRC Department of Land Resources ConservationMITC Malawi Investment and Trade CentreMoAIWD Ministry of Agriculture, Irrigation and Water DevelopmentMoFEP&D Ministry of Finance, Planning and Economic DevelopmentMoITT Ministry of Industry, Trade and TourismMoTPW Ministry of Transport and Public WorksMITC Malawi Investment and Trade CentreNFRA National Food Reserve AgencyTCC Tobacco Control Commission
CIAR AgenciesCIAT International Centre for Tropical AgricultureCIP International Potato CentreIFPRI International Food Policy Research InstituteIITA International Institute of Tropical Agriculture
United Nations Agencies
FAOFAO Country Office, MalawiFAO Regional Office for Africa, AccraFAO Investment Centre, Rome
IFAD International Fund for Agricultural DevelopmentILO International Labour OfficeUNW United Nations WomenUNCDF United Nations Capital Development FundUNICEF United Nations Children’s FundWFP World Food Program
Other International OrganisationsAUC African Union Commission

201
National Agricultural Investment Plan
Development Partners and DP GroupsAGRA Alliance for a Green Revolution in AfricaDFID Department for International Development (UK)EU Delegation of the European UnionFICA Flanders International Cooperation AgencyGIZ Deutsche Gesellschaft für Internationale ZusammenarbeitJICA Japan International Cooperation AgencyUSAID United States Agency for International DevelopmentWB World BankDCAFS Donor Committee on Agriculture and Food SecurityDONUTS Donors on Nutrition Security GroupGerman EmbassyIrish AidNorwegian Embassy
NGOs/CBOsCONGOMA Council for Non-Government Organisations in MalawiCISANET Civil Society Agriculture NetworkNGO Board NGO Board of MalawiCW Concern WorldwideTLC Total Land CareFHi360 Family Health InternationalWVM World Vision Malawi
Farmer OrganisationsFUM Farmers Union of MalawiNASFAM National Smallholder Farmers’ Association of Malawi
Private SectorCotton CouncilCotton Ginners Africa Ltd.Malawi Chamber of Commerce and Industry (MCCI)Mtalimanja HoldingsDairiboard Malawi Ltd.Export Trading GroupUniversal Industries Sable Farming
AcademiaLUANAR Lilongwe University of Agriculture and Natural ResourcesUoP University of Pretoria
Programmes and ProjectsFTF Feed the FutureTIP SWAp Trade, Industry and Private Sector SWApPACA Partnership for Aflatoxins Control in AfricaRLEEP Rural Livelihoods Economic Enhancement ProgrammeNA New Alliance (for Food Security and Nutrition)GA Grow AfricaNAPAS New Alliance Policy Accreditation Support
SANE Strengthening Agriculture and Nutrition Extension Services in Malawi

202
National Agricultural Investment Plan
Annex 9: ReferencesAfrican Development Bank (2013). Malawi Country Strategy Paper 2013-2017. ORSB Department, African Development Bank.
African Development Bank (2013). Smallholder Irrigation and Value Addition Project: Project Appraisal Report (Volume I of II). African Development Bank Group.
Agar, J., Lewis-Donaldson, T., Mwabumba, M., Mwabutwa, C. and Mahlati, V. (2012). Status of Agricultural and Rural Finance in Malawi. FinMark Trust.
Agriculture Joint Sector Review Reports (2013/14, 2014/15 and 2016/17)
African Union (2016?). Country CAADP Implementation Guidelines under the Malabo Declaration. http://www.nepad.org/resource/country-caadp-implementation-guidelines-under-malabo-declaration
Arndt, C., Pauw, K. and Thurlow, J. (2016). The Economy wide Impacts and Risks of Malawi’s Farm Input Subsidy Program. American Journal of Agricultural Economics.
Benson, T., Nankhuni, F., Mabiso, A., and Maredia, M. (2016). The Quality of Agriculture and Food Security Policy Processes at National Level in Malawi. Results From the 2015 Malawi Agriculture and Food Security Policy Processes Baseline Survey. IFPRI and New Alliance Policy Acceleration Support: Malawi Project (NAPAS: Malawi)
Centre for Agricultural Research and Development (2014). Linkages between land, agricultural finance, inputs and markets: A contextual analysis of Malawi’s agricultural sector with a focus on Lilongwe, Mchinji and Salima districts. Centre for Agricultural Research and Development, Lilongwe University of Agriculture and Natural Resources, Lilongwe, Malawi.
Chibwana, C., Fisher, M., Jumbe, C. and Shively G. (2011). Measuring the Impacts of Malawi’s Farm Input Subsidy Program. Paper presented at the COMESA/ACTESA/MSU 5th AAMP Policy Symposium April 20-22, Kigali, Rwanda.
Chirwa E., and Dorward A. (2014). FISP policy Brief 2014/2: The implementation of the 2012/13 farm input subsidy program.
Chirwa, E. and Dorward, A. (2013). Agricultural Input Subsidies: The Recent Malawi Experience. Oxford University Press, Oxford, United Kingdom.
Chirwa, E., Matita, M., Mvula, P., Mhango, W., Harman, L. and Dorward, A. (2015). Evaluation of the 2014/15 Farm Input Subsidy Program, Malawi. Draft Report. Ministry of Agriculture, Irrigation and Water Development.
CISANET (2015). Financial Data Collection from the Non-State Actors (NGOs), Civil Society Agricultural Network (CISANET).
CISANET (2015). Proceedings of the National Agricultural Conference 2015, Science and Technology for Agricultural Development. CISANET
Department of fisheries (2015). Economic Report on Fisheries sector contribution, Department of Fisheries (MoAIWD). Ministry of Agriculture, Irrigation and Water Development, Lilongwe, Malawi
Department of Land Resources and Conservation (2015). Status on Implementation of SLWM TWG Activities. Departments of Land Resources Conservation and Irrigation Services, Ministry of Agriculture, Irrigation and Water Development, Lilongwe, Malawi.
Dorward, A. and Chirwa, E. (2013). Impacts of the Farm Input Subsidy Program in Malawi: Informal Rural Economy Modelling. Future Agricultures Consortium Policy Brief 067
Dorward, A. and Chirwa, E. (2013). Targeting in the Farm Input Subsidy Program in Malawi: Issues and Options. Future Agricultures Consortium Policy Brief 066
Doward, A and Chirwa, E. (2015). Malawi Strategy Support Program: Strategic options for Agriculture development in Malawi, International Food Policy Research Institute

203
National Agricultural Investment Plan
Edelman, B., Lee, H. L., Mabiso, A. and Pauw, K. (2015). Strengthening storage, credit, and food security linkages: The role and potential impact of warehouse receipt systems in Malawi. Malawi Strategy Support Program (MaSSP) Working Paper 12, International Food Policy Research Institute (IFPRI), Lilongwe, Malawi.
Fairhust T (ed). (2012) Handbook of Integrated Soil Fertility Management. Africa Soil Health Consortium, Nairobi.
FANRPAN (2014). A comprehensive copying and assessment study of climate smart agriculture policies in Malawi. FANRPAN
FAO (2010). Investment in agricultural mechanization in Africa: Conclusions and recommendations of a Round Table Meeting of Experts. Food and Agriculture Organization of the United Nations (FAO)
FAO (2010). Guidelines for Measuring Household and Individual Dietary Diversity. Nutrition and Consumer Protection Division.
FAO (2012) The State of Food and Agriculture: Investing in Agriculture for a Better Future
FAO (2014). Review of food and agricultural policies in Malawi Country Report 2014. MAFAP
FAO (2014). Review of Food and Agricultural Policies in Malawi, MAFAP Country Report Series. Food and Agriculture Organization of the United Nations.
FAO (2015). Regional Overview of Food Insecurity Africa: African Food Security Prospects Brighter Than Ever. Food and Agricultural Organization of the United Nations.
FAO (Undated). Food and Agricultural Organisation report on analytical summary-Food Safety and Nutrition
FAO and WHO (2005). Situation Analysis of Food Safety Systems in Malawi. Food and Agricultural Organization/World Health Organization Regional Conference report
Feed the Future (2010) Malawi Implementation Plan. Available at http://www.feedthefuture.gov/
Financial Data Collection and Presentation of Malawi Government and Its Development Partner’s Investment in the Agriculture, Irrigation and Water Development Sector, Ministry of Agriculture, Irrigation and Water Development, 2015
FinMark Trust (2014). Access to Finance in Malawi: FinScope Consumer Survey Malawi.
Foundation for World Agriculture and Rurality (2014). Developing a typology of agricultural holdings for improved policy design: a preliminary case study of Malawi. Foundation for World Agriculture and Rurality Working Paper 6
Gajigo, O. and Lukoma, A. (2011). Infrastructure and Agricultural Productivity in Africa. Market Brief, African Development Bank.
Giertz, Å., Caballero, J., Dileva, M., Galperin, D and Johnson, T. (2015). Managing Agricultural Risk for Growth and Food Security in Malawi. World Bank Group, Agriculture Global Practice Note 15.
Government of Malawi (2000). National Irrigation Policy and Development Strategy. Ministry of Agriculture and Irrigation, Lilongwe, Malawi.
Government of Malawi (2002). Malawi National Land Policy 2002. Ministry of Lands and Housing, Lilongwe, Malawi.
Government of Malawi (2006). Land reform and poverty reduction in Malawi; a paper presented at the decision maker’s meeting on administration of Land for poverty reduction and economic growth.
Government of Malawi (2006). Policy Document on Livestock in Malawi. Ministry of Agriculture, Department of Animal Health and Livestock Development, Ministry of Agriculture and Food Security

204
National Agricultural Investment Plan
Government of Malawi (2010). Malawi CAADP Compact to support the successful implementation of the agricultural sector wide approach.
Government of Malawi (2011). Malawi Agricultural Sector Wide Approach: A prioritised and harmonised Agricultural Development Agenda: 2011-2015. Ministry of Agriculture and Food Security, Lilongwe, Malawi.
Government of Malawi (2013). Malawi Growth and Development Strategy II 2012 – 2016. Ministry of Economic Planning and Development, Lilongwe, Malawi.
Government of Malawi (2013). Malawi National Export Strategy 2013 - 2018. Ministry of Industry and Trade, Lilongwe, Malawi.
Government of Malawi (2013). National Climate Change Investment Plan 2013–2018. Ministry of Environment and Climate Change Management, Environmental Affairs Department, Lilongwe, Malawi
Government of Malawi (2013). National Youth Policy. Ministry of Youth and Sports, Lilongwe, Malawi
Government of Malawi (2015). Integrated Pest Management Plan (IPMP) under Malawi Floods Emergency Recovery Project (MFERP)
Government of Malawi (2015). Country Cooperation Framework for New Alliance for Food Security and Nutrition in Malawi, 2013-22, revised version.
Government of Malawi (2016). Contract Farming Strategy. Ministry of Agriculture, Irrigation and Water Development. Lilongwe, Malawi
Government of Malawi (2016). Malawi Agricultural Sector Wide Approach: A prioritised and harmonised Agricultural Development Agenda: 2011-2015. Review of achievements and implementation Final Report. Ministry of Agriculture, Irrigation and Water Development. Lilongwe, Malawi
Government of Malawi (2016). Malawi Growth and Development Strategy (MGDS) II Review and Country Situation Analysis Report. Ministry of Finance, Economic Planning and Development, Lilongwe, Malawi.
Government of Malawi (2016). National Agriculture Policy. Ministry of Agriculture, Irrigation and Water Development. Lilongwe, Malawi
Government of Malawi (2016). National Fisheries and Aquaculture Policy. Ministry of Agriculture, Irrigation and Water Development. Lilongwe, Malawi.
Government of Malawi (2016). National Industrial Policy 2016. Ministry of Industry and Trade, Lilongwe, Malawi
Government of Malawi (2016). National Irrigation Policy 2016: Prosperity Through Irrigation. Ministry of Agriculture, Irrigation and Water Development. Lilongwe, Malawi
Government of Malawi (2016). National Trade Policy. Ministry of Industry and Trade, Lilongwe, Malawi
Grow Africa – Agricultural Partnership take root across Africa 2013-2014 Annual Report on Private – sector investment in support of Country-led transformations in African Agriculture
Hatibu, N. and Mahoo, H (1999). Rain water harvesting technologies for agricultural production: A case of Dodoma, Tanzania. IN: PG Kambutho & TE Simalenga (eds). Conservation Tillage with Animal Traction. A resource book of the Animal Traction Network for Eastern and Southern Africa, ATNESA, Harare, Zimbabwe.
Hatibu N, Young MDB, Gowing JW, Mahoo HF, Mzirai OB (2003). Developing improved dryland cropping systems for maize in semi-arid Tanzania. Part 1. Experimental benefits of rain water harvesting. Journal of Experimental Agriculture 39 (3) 279-292.
IFAD (2008). International Fund for Agricultural Development (IFAD) policy report (2008). Improving access to land and tenure security.
IFAD (2017). Investing in Rural People in Malawi IFAD report. International Fund for Agricultural Development
205
National Agricultural Investment Plan
IFPRI (2016). Maize Price Band Analysis. Malawi Strategy Support Program (MaSSP) Working Paper 12, International Food Policy Research Institute (IFPRI), Lilongwe, Malawi.
IFPRI 2015: MaSSP Report: Mapping the Linkages between agriculture, food security and nutrition in Malawi
IMF (2015). Malawi Selected Issues. International Monetary Fund IMF Country Report No. 15/346, Washington D.C
IRLADP (2014). Documenting lessons learnt of the Irrigation, Rural Livelihoods and Agricultural Development Project (IRLADP). Ministry of Agriculture, Irrigation and Water Development, Lilongwe, Malawi
Kasungu ADD (2015). Kasungu ADD Annual Progress Report (2013/14 and 2014/15). Ministry of Agriculture, Irrigation and Water Development, Lilongwe, Malawi
Kasungu ADD (2015). Kasungu ADD Department of Animal Health and Livestock Development ASWAp Reports (2013/14 and 2014/15). Ministry of Agriculture, Irrigation and Water Development, Lilongwe, Malawi
Kasungu ADD (2015). Kasungu ADD NGO Information Report. Ministry of Agriculture, Irrigation and Water Development, Lilongwe, Malawi
Khaila, S. W. (2012). Re-Thinking Agricultural Extension in Malawi. CISANET Policy Paper
Lal R (1978). Influence or within and between role mulching on soil temperature, soil moisture, root development and yield of maize (Zea Mays L) in a tropical soil. Field crops Research 1: 127-139.
Livestock and Pastures Commodity Group Presentations of on-going activities and experiments Reports (2013/14, 2014/15 and 2015/16)
LRCD (2015). Land Resources and Conservation Department – Physical Output targets and annual achievement for the 2014-15 financial year. Ministry of Agriculture, Irrigation and Water Development, Lilongwe, Malawi
LUANAR and IFPRI (2014). Eight Years of the FISP – Impact and What Next? Brief for the Minister of Agriculture, Irrigation, and Water Development on the National Symposium on the Farm Input Subsidy Program (FISP) of the Government of Malawi. Lilongwe University of Agriculture and Natural Resources and International Food Policy Research Institute
Lunduka et al. (2013). What are the farm level impacts of Malawi’s farm input subsidy program? A critical review. Agricultural economics 44 (2013) 563-579
Malawi Government (2006). Food Security Action Plan Volume I. Ministry of Agriculture and Food Security, Lilongwe, Malawi.
Malawi Government (2006). Food Security Policy 2006. Ministry of Agriculture and Food Security, Lilongwe, Malawi.
Malawi Government (2010). Road Sector Program Investment Program for the Road Sector in Malawi 2010 to 2020 Final Report. Ministry of Transport and Public Infrastructure
Malawi Government (2011). ASWAp Guideline for Collecting Data of Key Performance Indicators. Ministry of Agriculture, Irrigation and Water Development, Lilongwe, Malawi.
Malawi Government (2012). Opportunities for Private Sector Investment in the Malawian Agricultural Sector. Ministry of Agriculture and Food Security, Lilongwe, Malawi.
Malawi Government (2013). 2013/2014 FISP Implementation Guidelines. Ministry of Agriculture and Food Security
Malawi Government (2013). Agriculture Technology Transfer of the Malawi Agricultural Sector Wide Approach Support Project, Baseline Report Draft 1, Ministry of Agriculture and Food Security, Lilongwe, Malawi.
Malawi Government (2015a). Agriculture Sector Performance Reports (2011/12, 2012/13, 2013/14 and 2014/15). Ministry of Agriculture, Irrigation and Water Development, Lilongwe, Malawi.

206
National Agricultural Investment Plan
Malawi Government (2015b). Annual Economic Report on fisheries contribution. Ministry of Agriculture, Irrigation and Water Development, Fisheries Department, Lilongwe, Malawi.
Malawi Government (2015c). Annual Sector Reports, 2011/12 – 2014/15. Ministry of Agriculture, Irrigation and Water Development, Lilongwe, Malawi.
Malawi Government (2015d). ASWAp Monitoring and Evaluation Plan, Ministry of Agriculture, Irrigation and Water Development. Lilongwe, Malawi.
Malawi Government (2015e). Department of Agriculture Extension Services Annual Reports (2011/12, 2012/13, 2013/14 and 2014/15), Ministry of Agriculture, Irrigation and Water Development, Lilongwe, Malawi.
Malawi Government (2015f). Guidelines for Implementing Conservation Agriculture in Malawi (Draft). Ministry of Agriculture, Irrigation and Water Development, Lilongwe, Malawi
Malawi Government (2016a). Malawi National Adaptation Plan Stocktaking Report.
Malawi Government (2016b). ATCC Released technologies from 2012 to 2016. Prepared by ATTC Secretariat, Department of Agricultural Research Services, Lilongwe, Malawi.
Malawi Government (2016c). Demographic and Heath Survey, 2015-16, National Statistics Office, Zomba, Malawi
Malawi Government (2016c). Department of Animal Health and Livestock Development (MoAIWD), Annual Reports (2013/14, 2014/15 and 2015/16. Ministry of Agriculture, Irrigation and Water Development, Lilongwe, Malawi.
Malawi Government (2016d). Department of Crops Annual Progress Reports (2010/11, 20111/12, 2012/13, 2013/14 and 2014/15). Ministry of Agriculture, Irrigation and Water Development, Lilongwe, Malawi.
Malawi Investment and Trade Centre (2015). Malawi in Brief 2015. Lilongwe, Malawi
Malawi Post 2015 Development Agenda National Consultations on Post MDGs, 2013 Report.
Malawi Vulnerability Assessment Committee annual and seasonal briefs
Mapila, M., Kirsten, J.F and Meyer, F.H. (Undated). The impact of Agricultural Innovation Systems interventions on rural livelihood outcomes in Malawi
Mchinji ASWAp-SP Annual Progress Report (2012/13 and 2014/15)
MIM (2013). Budget Analysis & Tracking of the Agricultural Sector in Malawi 2013, Malawi Institute of Management, Lilongwe, Malawi.
Ministry of Agriculture and Food Security / NEPAD Planning and Coordination Agency (2014). Joint Sector Review Assessment
Ministry of Agriculture and Irrigation (2000). Agricultural Extension in the new millennium: Towards pluralist and demand driven services in Malawi. Ministry of Agriculture and Irrigation, Lilongwe, Malawi.
Ministry of Agriculture Irrigation and Water Development (2015). 2015/2016 FISP Implementation Guidelines. Ministry of Agriculture, Irrigation and Water Development, Lilongwe, Malawi
Ministry of Agriculture, Irrigation and Water Development (MoAIWD), 2014). Final Report on the Implementation of the Agricultural Inputs Subsidy Program (2013-14). Ministry of Agriculture, Irrigation and Water Development, Lilongwe, Malawi
MoAIWD (2015). Final Report on the Implementation of the Agricultural Inputs Subsidy Program (2014-15). Ministry of Agriculture, Irrigation and Water Development, Lilongwe, Malawi
MoAIWD (2015). Technology Adoption Study Report: Under the Agriculture Sector Wide Approach Support Project (ASWAp-SP). Ministry of Agriculture, Irrigation and Water Development, Lilongwe, Malawi

207
National Agricultural Investment Plan
MoAIWD (2015). Sector Working Group Minutes, Ministry of Agriculture, Irrigation and Water Development, 2010/11 – 2014/15. Ministry of Agriculture, Irrigation and Water Development, Lilongwe, Malawi.
MoAIWD (2016). A draft report on the internal consultation meeting on agriculture extension delivery and policy held on 20th January, 2016 in Mangochi. Ministry of Agriculture, Irrigation and Water Development, Lilongwe, Malawi
MoAIWD (2017). Agriculture Sector Performance Report:July 2016 - June 2017
Mkandawire, et al (2016): Compact 2025. Malawi - Ending Hunger& Undernutrition. Challenges and Opportunities. Scoping Report for Round Table Discussion. May 2016
MoAIWD (2015). Guidelines for Collecting Data of Key Performance Indicators. Ministry of Agriculture, Irrigation and Water Development, Lilongwe, Malawi
Mzuzu ADD (2015). Mzuzu ADD Annual Reports (2012/13 and 2014/15). Ministry of Agriculture, Irrigation and Water Development, Lilongwe, Malawi
Mzuzu ADD (2015). Mzuzu ADD Semi-Annual Highlights of Achievements Reports, 2014/15. Ministry of Agriculture, Irrigation and Water Development, Lilongwe, Malawi
NAPAS (2016). The Quality of Agriculture and Food Security Policy Processes at National Level in Malawi. New Alliance Policy Acceleration Support (NAPAS) Malawi Working Paper: (NAPAS: MALAWI - Michigan State University (MSU)/International Food Policy Research Centre IFPRI/, January 2016)
NAPAS (2016). The Quality of Agriculture and Food Security Policy Processes at National Level in Malawi, NAPAS Working Paper and brief
NASFAM (2013). Impact Assessment of NASFAM Programs and Services under SDP III, National Agriculture Smallholder Farmers of Malawi.
National Statistical Office (NSO), 2008. Population and Housing Census
NSO (2010). Malawi Demographic and Health Survey, 2010.
NSO (2017): Malawi Demographic and Health Survey 2015-16
NEPAD (2005). Government of the Republic of Malawi support to NEPAD–CAADP Implementation. New Partnership for Africa’s Development (NEPAD) Comprehensive Africa Agriculture Development Program (CAADP).
Nkhatabay District Agriculture Office (2015). Nkhatabay District Agriculture Office Progress of District Agriculture Extension Services Systems (DAESS). Ministry of Agriculture, Irrigation and Water Development, Lilongwe, Malawi
Nkhatabay District Fisheries Office (2015). Nkhatabay District Fisheries Office Annual Reports (2013/14 and 2014/15). Ministry of Agriculture, Irrigation and Water Development, Lilongwe, Malawi
Nkhatabay District Fisheries Office (2015). Nkhatabay District Fisheries Office Biannual Reports (2012/13, 2013/14 and 2014/15). Ministry of Agriculture, Irrigation and Water Development, Lilongwe, Malawi
NSO and ICF International (2016). Malawi Demographic and Health Survey 2015-16: Key Indicators Report. National Statistical Office (NSO) and ICF International.
OXFAM (2014). A Mapping of policies and legal frameworks around food and climate justice in Malawi.
Pauw, K. and Thurlow, J. (2014). Malawi’s Farm Input Subsidy Program: Where Do We Go from Here? IFPRI, Malawi Strategy Support Program.
Posthumus, H; Baltissen, G; Mweninguwe, R; Veldiwisch, G; and Bekman, W. (2015). Irrigation and Rural Livelihoods Agricultural Development Project (IRLADP) Final Report.
Ricker-Gilbert J., Jayne T. and Black J. (2009). Does Subsidizing Fertiliser Increase Yields? Evidence from Malawi. Michigan State University.

208
National Agricultural Investment Plan
Rockstrom J (2003). Water for food and nature in drought-prone tropics: vapour shift in rainfed agriculture. Royal Transactions B: Biological Sciences 358 (1440), 1997-2009.
Rwelamira, J. (2015). Strengthening Farmers Organizations and Civil Society Organizations. Background paper, feeding Africa conference, Senegal.
Salephera Consulting (2015). Technology Adoption Study Report under the Agriculture Sector Wide Approach Support Project (ASWAP-SP). Report Produced for The Ministry of Agriculture, Irrigation and Water Development and the World Bank.
Shire Valley ADD (2015). Shire Valley ADD ASWAp-SP Semi-annual Progress Reports (2012, 2013, 2014 and 2015). Ministry of Agriculture and Irrigation, Lilongwe, Malawi.
Shire Valley ADD (2015). Shire Valley ADD Crop Development Progress Reports (2012/13, 2013/14 and 2014/15). Ministry of Agriculture and Irrigation, Lilongwe, Malawi.
Shire Valley ADD (2015). Shire Valley ADD Progress Reports (2013/14 and 2014/15). Ministry of Agriculture and Irrigation, Lilongwe, Malawi.
Thierfelder, C. and Wall, P. C. (2009). Effects of Conservation Agriculture Techniques on Infiltration and Soil Water Content in Zambia and Zimbabwe. Soil Tillage Research 105 (2): 217-227.
Thompson, J., Teshome, A., Hughes, D., Chirwa E., and Omiti, J. (2009). Challenges and Opportunities for Strengthening Farmers Organisations in Africa: Lessons from Ethiopia, Kenya and Malawi. Future Agricultures Consortium Policy Brief 03
Thurlow, J; Benfica, Rui (2017). Identifying Priority Value-Chains in Malawi. Paper presented during NAIP preparation workshop, based on results of the RIPA model.
UN Women, UNDP, UNEP and the World Bank (2015) The Cost of the Gender Gap in Agricultural Productivity in Malawi, Tanzania and Uganda, joint report of UN Women, UNDP, UNEP and the World Bank.
USAID (2013). Institutional Architecture Systems Assessment for Food Security Policy Change: Malawi
World Bank (2012). ASWAp-SP Additional Financing 2 (MDTF) project paper. World Bank.
World Bank (2012). Weather Index-based Crop Insurance in Malawi Facilitating Farmers’ Access to Agricultural Credit.
World Bank (2013). Agriculture Public Expenditure Review. African Development Bank
World Bank (2014). Republic of Malawi. Diagnostic Trade Integration Study (DTIS) Update.
World Bank (2015). Implementation Completion and Results Report, Rural Livelihoods and Agricultural Development Project (IRLADP).
World Bank (2016a).Malawi Economic Monitor. Absorbing Shocks, Building Resilience.May 2016.
World Bank (2016b). Wold Development Indicators (latest data available)
World Bank (2017a). Doing Business 2017: Equal Opportunities for All - Economy Profile 2017 Malawi.
World Bank (2017b).Enabling the Business of Agriculture 2017. Washington, DC: World Bank. doi:10.1596/978-1-4648-1021-3.
World Bank (2017c).Malawi Economic Monitor May 2017. Harnessing the Urban Economy.
WTO (2017). Trade Profile Malawi. http://stat.wto.org/CountryProfile/WSDBCountryPFView.aspx?Language=S&Country=MW


Designed by Agriculture Communication Branch,
P.O. Box 594, Lilongwe, Malawi
2018
Top Related