


Languages
Pages
Legal


Using the 4 R’s for improved
N management for corn and
water quality for MN??
Gyles Randall (Professor Emeritus) and
Jeff Vetsch (Assistant Scientist)Univ. of Minnesota
Southern Research and Outreach Center
Waseca, MN 56093
AGVISE Seminar Series
January 5, 6, & 7, 2016

Nitrogen
• Required at higher rates than any other
nutrient for optimizing corn yield and
profitability
• More than 600,000 tons of N are applied for
corn each year in Minnesota alone.
• N BMP’s soil (region) specific in Minnesota.

Region Specific BMPs for N


Randall

Lynn Betts, NRCS

Randall


RISK
Yield Loss & N LossEconomic and Environmental

Management Practices
1. Cropping system
2. Rate of N application
3. Time of N application
4. Nitrification inhibitors
5. Source of N
6. Cover Crops


4R Principles
• The 4R nutrient stewardship principles
are the same globally, but how they are
used locally varies depending on field
and site specific characteristics such as
soil, cropping system, management
techniques and climate.

4R’s– Right Source – Ensure a balanced supply of essential
nutrients, considering both naturally available sources and
the characteristics of specific products, in plant available
forms.
– Right Rate – Assess and make decisions based on soil
nutrient supply and plant demand.
– Right Time – Assess and make decisions based on the
dynamics of crop uptake, soil supply, nutrient loss risks, and
field operation logistics.
– Right Place – Address root-soil dynamics and nutrient
movement, and manage spatial variability within the field to
meet site-specific crop needs and limit potential losses from
the field.

Rate of N Application

Relative corn yield following soybean & residual soil
NO3 (0-5’ depth) as affected by N rate (Port Byron)
2006-10 average,
Olmsted CountyNitrogen rate, lb N ac-1
0 30 60 90 120 150 180
Resiu
al soil
nitra
te-N
(0-5
'), lb
ac-1
0
20
40
60
80
100
120
Rela
tive y
ield
, %
40
60
80
100 Nitrate
Yield
97.4% of max yield

Continuous Corn, 2001–03 Olmsted Co.

Effect of N rate for corn after soybean on NO3-N
concentrations in tile drainage water in 2001.
15-A
pr
22-A
pr
29-A
pr
6-M
ay
13-M
ay
20-M
ay
27-M
ay
3-Ju
n
10-J
un
17-J
un
24-J
un
Date
10
15
20
25
30
35
40
Nit
rate
Co
nc
(mg
/L)
80 lb N/A 120 160

Time of N Application
and
N-Serve

April – June Rainfall
30-yr normal = 10.7”
1997 = 8.5” (20% below)
1998 = 11.8” (10% above)
1999 = 15.8” (48% above)

Corn yield as affected by time of application.
Years
Time/Placement 1997-’98 1999 3-yr Avg.
Yield (bu/A)1/
Fall/under row 188 145 174
April/between rows 188 181 1861/ Across all four tillage systems.

Primary points
• Although 3-yr average tillage system yields
ranged from 176-184, there was no interaction
between Time of N and Tillage
• Spring N in 1999 increased grain yield by 36 bu/A,
silage yield by 1.3 T/A, and N recovery by 42%
compared to a late October application.
- fall N can be risky

Corn yield as influenced by N-Serve, time of
application, and N-Serve at Waseca, 1981-82.
N Treatment Time of Application
Source N-Serve Fall Spring
- - - Yield (bu/A) - - -
None -- 104
Urea No 157 164
“ Yes 155 167
An. Ammonia No 162 168
“ Yes 170 173

Corn grain yield after soybeans as affected by fall and
spring application of N-Serve with anhydrous
ammonia at Waseca, 1994-99.
N-Serve
Time of Application No Yes
- - - 6-Yr Avg. Yield (bu/A) - - -
Fall (late Oct.) 161 171
Spr. (April)* 172 176
* A yield response to spring-applied N-Serve occurred in years when
June rainfall was excessive, but the 4 bu/A (6-yr avg.) increase was
not statistically significant.

Corn yield, N recovery, and NUE as influenced by
time of application and N source at Waseca.
N Management 3-Yr Avg.
Time Source N-Serve Yield N recovery NUE
bu/A % bu/lb FN
Fall Urea No 152 43 0.36
“ “ Yes 158 47 0.42
“ AA No 168 60 0.51
“ “ Yes 170 63 0.53
Spr. PP Urea No 185 76 0.66
“ AA No 182 84 0.64
-- None -- 112 -- --

Corn production and nitrate loss as affected
by time of N application and N-Serve.
7-Year Average Nitrate-N
N Treatment Corn N Economic Loss in
Time N-Serve Yield Recovery Return Drainage
Bu/A % $/A Lb/A/Inch
Fall No 131 31 67 3.8
“ Yes 139 37 78 3.1
Spring No 139 40 85 3.1
Split No 145 44 97 3.3
LSD (0.10) = 4
1987-93, Waseca, MN

Nitrogen (NO3) Loss
from Tile Drainage

Lamberton 1973-1985• Site history
- no N or manure for previous 10 yrs
- corn, soybean, small grain rotation
• Soil: Normania cl, mod. well drained
• Crop: Continuous corn
• Fertilizer N Rates (Spring), 1973-79
18 (as starter), 100, 200 & 400 lb N/A
• 12 - 45’x50’ separated drainage plots (3 reps)

1973-75 Nitrate-N Concentration
Annual Year
N rate 1973 1974 1975
lb N/A - - - - - - - mg/L - - - - - -
18 13 19 19
100 15 25 23
200 13 37 43
400 12 65 81
Annual flow (inches) 1.46 3.58 5.04

1973-75 Nitrate-N Loss
Annual Year
N rate 1973 1974 1975
lb N/A - - - - - - - lb N/A - - - - - -
18 4 15 17
100 5 20 22
200 4 27 53
400 5 48 107
• Corn yields were poor (70-110 bu/A) – Dry
• No movement of nitrate below 6’

1976-79 Nitrate-N Concentration Annual Year
N rate 1976 1977 1978 1979
lb N/A - - - - - - - - mg/L - - - - - - - -
18 * 28 21 16
100 * 48 53 47
200 * 73 119 106
400 * 150 191 172
Annual flow (Inches): 0.56 1.99 8.21
* = Drought, no tile flow

1976-79 Nitrate-N LossAnnual Year
N rate 1976 1977 1978 1979
lb N/A - - - - - - - - lb N/A - - - - - - - -
18 * 4 10 30
100 * 6 26 82
200 * 6 43 165
400 * 18 87 3741/
* = Drought, no tile flow & no grain yield. 1/ Nitrate moved below 10’ with 400-lb rate
• Corn yields (1977-79) = 131-139 bu/A.

Waseca 1975-1980• Site history
- corn in 1974, 150 lb N/A
• Soil: Webster cl, poorly drained
• Crop: Continuous corn
• Fertilizer N rates (Spring), 1975-79
0, 100, 200, & 300 lb N/A
• 12 – 45’ x 50’ separated drainage plots (3 reps)

1975-80 Nitrate-N Concentration
1975-79 Year1/
N rate 1977 1978 1979 19802/
lb N/A/yr - - - - - - mg/L - - - - - -
0 13 16 13 9
100 41 28 19 10
200 58 45 32 12
300 85 65 44 23
Ann. Tile Flow (In.) 4.8 5.6 17.1 2.91/ No drainage occurred in 1975-1976 – Dry. 2/ N was not applied in 1980.

Nitrate-N Leaching DepthLamberton: 400 lb N/A (1973-79)
1983 to 19’
1985 to 20’, 2X as much
in 12-20’ as in 0-5’
Waseca: 300 lb N/A (1975-79)
1979 to 10’
denitrification loss??


Corn-Soybean Rotation
Drainage Study, Waseca
1
174
18 C
4
19
2
20
3
21
Trt #
Plot # 5’
20’


Time and Rate of N
Application and
Nitrification Inhibitors
(N-Serve)

Effect of time of AA application and N-Serve on corn
yields after soybean from 1987-2001 at Waseca
Time of N Application
Parameter Fall Fall+N-Serve Spring
15-Yr Avg. Yield (bu/A) 144 153 156
15-Yr Avg. FW NO3-N Conc. (mg/L) 14.1 12.2 12.0
15-Yr N recovery in grain (%) 38 46 47
7-Yr Avg. Yield (bu/A)* 131 146 158
* Seven years when statistically significant differences occurred.

Conclusions
• Adding a nitrification inhibitor (N-Serve™) to
fall-applied anhydrous increased corn yield
and NUE, while reducing nitrate concentration
in tile drainage.
• A preplant application of anhydrous increased
yield an average of 12 bu/ac in 7 of 15 years
(wet springs) at Waseca.
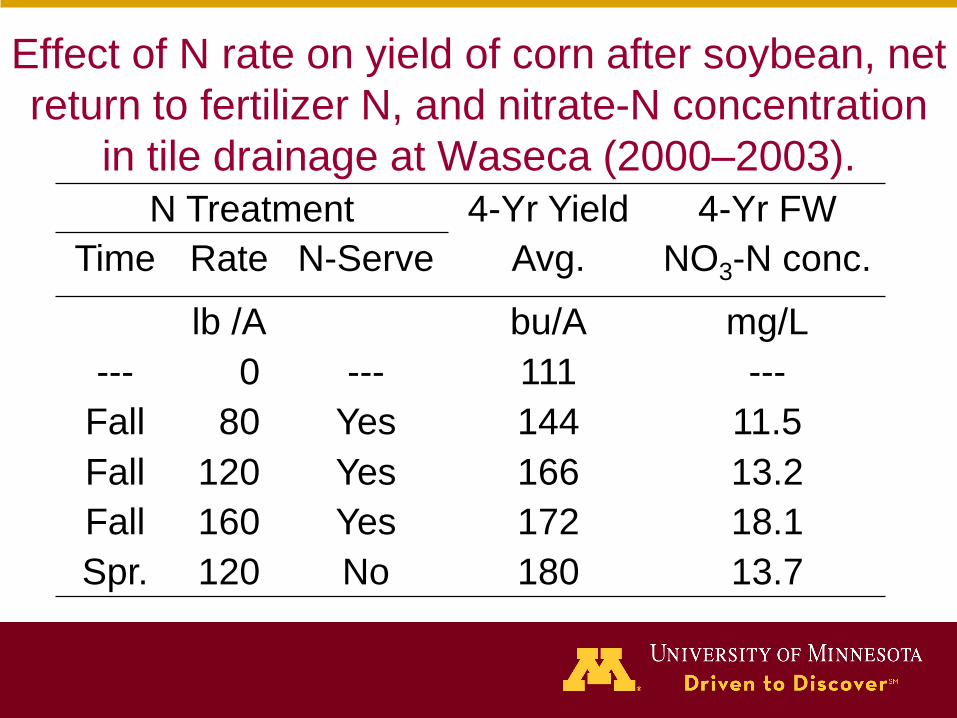
Effect of N rate on yield of corn after soybean, net
return to fertilizer N, and nitrate-N concentration
in tile drainage at Waseca (2000–2003).
N Treatment 4-Yr Yield 4-Yr FW
Time Rate N-Serve Avg. NO3-N conc.
lb /A bu/A mg/L
--- 0 --- 111 ---
Fall 80 Yes 144 11.5
Fall 120 Yes 166 13.2
Fall 160 Yes 172 18.1
Spr. 120 No 180 13.7

Nitrate-N concentrations and losses in tile water as
affected by rate and time of N application at Waseca.
FW 2000-2003
N application NO3-N NO3-N Lost
Rate Time N-Serve Conc. C Sb Total
lb N/A mg/L -- lb/A/4 cycles - -
80 Fall Yes 11.5 115 90 205
120 Fall Yes 13.2 121 99 220
160 Fall Yes 18.1 142 139 281
120 Spr. No 13.7 121 98 219

Conclusions• Nitrate losses were reduced 27% by
decreasing the application rate from 160 lb
N/A to the recommended rate of 120 lb N/A
for corn after soybean without reducing yield.
• Nitrate losses were reduced 14% by
decreasing the application rate to 80 lb N/A
from the recommended 120-lb rate BUT
yields were reduced by 17%.

Fall vs. Spring N Summary
Corn Yield: often higher with Spring N
Nitrate-N: Little difference in concentration
or loss between Fall and Spring
application, if proper/right N rate
is used.

1999 tile water NO3-N loading at Waseca vs.
NO3-N concentrations in the Le Sueur River 2.3
miles from Mankato.
7.4
16.6
15.7
12.0
10.8
16.2
15.2
12.7
15.6
14.1
11.9 11.6
31-M
ar
7-Apr
14-A
pr
21-A
pr
28-A
pr
5-M
ay
12-M
ay
19-M
ay
26-M
ay
2-Ju
n
9-Ju
n
16-J
un
23-J
un
30-J
un
Sampling Date
0
10
20
30
40
50
60
Nit
rate
-N L
oss
(lb
/A)
6.0
8.0
10.0
12.0
14.0
16.0
18.0
Nit
rate
-N (
pp
m)
Fall AA
PP AA
Le Sueur River

Source of N• Some fertilizer N sources
perform better than others.

Spring N Source Study at Waseca
• Nitrogen Sources– AA, urea, UAN
• Time of N application – Preplant incorporated and pre-emerge
• Nitrification inhibitors– N-Serve™
• Corn following soybean at 100 lb N/ac

Spring Nitrogen Source (2007-2010)N N Management Grain NUE
Source Time N-Inhibitor Yield Fert. N
bu/A bushel/lb N
Check None No 117 d
AA PP No 170 ab 0.59
AA PP N-Serve 176 ab 0.60
Urea PPI No 182 a 0.66
UAN PPI No 171 bc 0.55
UAN Pre No 166 c 0.49

The Effects of Nitrogen
Source and Time of
Application with and
without a Nitrification
Inhibitor

Continuous corn yield as affected by N rate
(UAN) and Instinct (Webster cl) in 2012.
Nitrogen rate, lb N ac-1
0 40 80 120 160 200 240
Yie
ld, b
u a
c-1
80
100
120
140
160
180
200
220
UAN
UAN+Instinct

Continuous corn yield as affected by N rate
(UAN) and Instinct (Webster/Nicollet cl) in 2013.
Nitrogen rate, lb N ac-1
0 40 80 120 160 200 240
Yie
ld, b
u a
c-1
80
100
120
140
160
180
200
220
UAN
UAN+Instinct

Corn yields as affected by Instinct and
N rate (stream injected UAN at V2).
• In a dry spring (2012) corn grain yields
were not affected by Instinct.
• In the wet spring of 2013 (6” of rain in 19
days after application) corn yields were
greater with Instinct .

Corn yield as affected by N source, time of
application and Instinct in south-central, MN.
Time and source of N and Instinct
F Ure
a
F Ure
a+NI
PP Ure
a
PP Ure
a+NI
PP UAN
PP UAN+NI
Co
rn y
ield
, b
u/a
c
120
140
160
180
200
2012
2013
On-farm N study
6 sites in 2012
5 sites in 2013

Effect of N Source and Timing on corn yield after
soybean at Waseca. Year
N Treatment 2011 2012 2013 3-Yr Avg.
- - - - - Yield (bu/A) - - - - -
Urea 188 a 168 a 193 ab 183
Urea + Instinct 187 a 170 a 197 a 185
AA 189 a 183 a 190 bc 187
AA + N-Serve 190 a 183 a 188 c 187
Fall 188 a 171 a 188 b 182
Spring 190 a 178 a 196 a 188
Wet spr.

2007 - 2010 Summary
Funding provided by AFREC

4-Yr Hydrologic Characteristics
Precipitation Drainage
Year May-Sept. Departure Total Time
inches % Ac-in
2007 24.99 +22 11.6 48% in Oct.
2008 17.01 -17 3.3 91% in A-Jun
2009 11.00 -46 0.8 64% in O-Nov.
2010 34.61 +69 21.0 28% in Mar.
46% in Sept.
Funding provided by AFREC

4-Yr Nitrate-N Results
Crop N Nitrate-N
Rotation Rate Time 4-Yr Avg. Conc. 4-Yr Total
lb/A mg/L lb/A
C-S-Corn 0 -- 6.1 37.7
“ 60 + 40 SPL 7.8 44.8
“ 120 PP 8.2 52.1
S-C-Corn 0 -- 4.6 34.0
“ 60 + 80 SPL 7.9 64.2
“ 160 PP 8.8 62.8
C-C-Soy 0 -- 5.5 30.5
“ 0 -- 8.4 40.9
“ 0 -- 8.7 38.3
Funding provided by AFREC

Crop N Grain Total
Rotation Rate Time Yield N uptake NUE
lb N/A bu/A lb N/A bu/lb N
C-S-Corn 0 -- 113 72 --
“ 60 + 40 SPL 182 141 0.69
“ 120 PP 186 142 0.61
Significance: NS NS --
S-C-Corn 0 -- 66 45
“ 60 + 80 SP 172 135 0.76
“ 160 PP 165 137 0.62
Significance: NS NS --
Funding provided by AFREC
4-Yr Corn Yield Results

4-Yr Corn Yield Summary
Funding provided by AFREC
1) Corn yields were 15 bu/A (9%) greater for C-S-
Corn than for S-C-Corn.
2) Corn grain yield and total N uptake were
similar between the 100% preplant N rate and
the 85% N rate split-applied.
3) NUE (bu/lb N) was consistently greater for the
split-applied 85% N rate. (Need to consider
economics).

Acknowledgement
• The authors are most grateful to the
Agricultural Fertilizer Research and
Education Council (AFREC) and Minnesota
Corn Growers for financial assistance for this
research project.
Funding provided by AFREC

CROPPING
SYSTEMS

Effect of CROPPING SYSTEM on drainage volume,
NO3-N concentration, and N loss in subsurface tile
drainage during a 4-yr period (1990-93) in MN.
Cropping Total Nitrate-N
System discharge Conc. Loss
Inches ppm lb/A
Continuous corn 30.4 28 194
Corn – soybean 35.5 23 182
Soybean – corn 35.4 22 180
Alfalfa 16.4 1.6 6
CRP 25.2 0.7 4

Conclusions• Cropping system has greater effect on
hydrology and nitrate losses than any
other management factor! (RISK)
• Perennial crops (alfalfa and grasses)
compared to row crops (corn and
soybean) reduce
– Drainage volume by 25 to 50%
– Nitrate loss by > 95%

Relative effectiveness of management
practices to reduce nitrate losses in ….Tile Drainage Ground water
Practice N. Corn Belt S.&C. Corn Belt N. Corn Belt
Cropping
system
VH (100)* VH VH (100)*
Rate of N L–H (10-40) M-H L-H (10-50)
Time of N L (5-20) M M-H (20-50)
Source of N
Man. vs. Fert.
VL (0-10) VL L (0-15)
Tillage VL (0-10) L VL (0-10)
Cover crop L (5-20) M L (5-20)
* Scale of effectiveness (0 – 100)

Engineered Tile Systems• Controlled drainage
• Drainage through perennial buffers
• Bio-reactors
• Constructed wetlands
• Closed loop management
• Two-tier ditches

Christianson, L.E., and R.D. Harmel. 2015. 4R Water
Quality Impacts: An assessment and synthesis of
forty years of drainage nitrogen losses. J. Environ.
Qual. October. Technical Report.
• Reviewed and quantitatively analyzed nearly 1000
site-years of subsurface tile drainage N load data to
develop a more comprehensive understanding of the
impacts of 4R practices (application of the right
source of nutrients, at the right rate and time, and in
the right places) within drained landscapes across
North America.

• They concluded that some of the 4R practices for reducing
nitrate-N loads were stronger than others.
- Optimizing N rate was important and
will continue to receive primary
research and regulatory focus
- The lack of significant differences between N
application timing or application methods
(placement and source) was inconsistent with
the current emphasis placed on timing as a WQ
improvement strategy.
Application timing analysis was
complicated by differences in application
rates between timing treatments; highest
application rates resulted in greatest N losses.

Will the 4R approach to N management be successful in
reducing nitrate-N losses to surface and ground water to meet
the goals of Nitrogen Loss Reduction Strategies being
established??
• They are directionally correct but will NOT accomplish the
goals themselves.
• Engineering options can be helpful depending on
geographic location and landscape.
• Shifting acreage away from corn to other cropping systems
is the most effective strategy as it decreases N inputs to
the landscape and consequently reduces N losses to water
significantly.

ThanksQuestions?Gyles Randall
http://sroc.cfans.umn.edu
Top Related