


Languages
Pages
Legal


International Journal of Signal Processing Systems Vol. 1, No. 2 December 2013
273©2013 Engineering and Technology Publishingdoi: 10.12720/ijsps.1.2.273-277
MUSIC Based on Uniform Circular Array and Its
Direction Finding Efficiency
Baofa Sun Department of Computer Science and Technology, Anhui Sanlian University, Hefei, China
Email: [email protected]
Abstract—The mathematical model of uniform circular
array was established and some simulation experiment
systems were constructed. The direction finding efficiency of
MUSIC based on uniform circular array was studied by
simulation experiments. Then MUSIC based on uniform
circular array was compared with MUSIC based on
uniform linear array. The conclusions are as following. Two
kinds of MUSIC can find the directions of independent
signals and their DF accuracy is close. They all cannot find
the directions of coherent signals. The advantage of MUSIC
based on UCA: the array size is smaller; it is easier to
increase antenna to improve the DF accuracy; the angle
distinguishing ability of signals is higher; there is neither
image vagueness nor aperture vagueness. The weakness of
MUSIC based on UCA: it cannot eliminate the coherence of
coherent signals; the ability to find the direction of weak
signal is poorer.
Index Terms—uniform circular array, uniform linear array,
MUSIC, simulation, direction finding
I. INTRODUCTION TO MUSIC BASED ON UCA
Ref. [1] discussed the MUSIC for direction finding
(DF) of independent waves, Ref. [2] discussed the
Smoothing algorithm for direction finding of coherent
signals and Ref. [3] discussed matrix decomposing
algorithm for pre-estimation of number and coherent state
of signals.
Above three algorithms are all based on uniform linear
array (ULA). Theoretical analyses and simulation experi-
ment results indicated that ULA was able to complete the
task of multiple emitter direction finding and pre-
estimation of number and coherent state of signals. The
structure of ULA is simple and mathematically modeling
based on ULA is easy. Because of these advantages,
researchers will choose ULA at first when they design
and layout antenna array. However, ULA is not perfect.
The weakness is mainly manifested in the following two
aspects.
The array is too long. Suppose a linear array is
composed of N antennas, the distance of two
adjacent antennas is d, then the array length is (N-
1)d. The array for DF is usually constituted with
more than 8 antennas, and the distance of two
adjacent antennas is generally half a wave-length.
Manuscript received August 28, 2013; revised November 16, 2013
Anhui Province Natural Science Fund Project: KJ2013B090.
The wave-length of short-wave signal used in the
wireless communication is usually in meter grade
or ten-meter grade. Therefore, the length of ULA
for DF of short-wave signal approaches tens of
meters or even hundreds of meters. Sometimes,
the number and the distance of antennas should be
increased to find the directions of signals more
accurately. This will increase the array length
further. For so long array, it is difficult to remain
the array uniform linear in battlefield. Even in
strategy DF, the unequal lengths of feedback lines
of antennas will make channel inconsistent or
unbalanced and thus arouse DF error although it is
possible to choice a neat and spacious place.
On the other hand, since the electromagnetic waves
traveling along the ground fade rapidly, researchers hope
to lift the transmitting or receiving antennas, i.e. to use
airborne or space borne electronic support system. Let the
emitting power of radio wave is 10W, the sensitivity of
electronic support system is 1~5 µV/m, then radio signal
traveling along the ground can be detected by ground-
based electronic support system in 10km. Whereas air to
air interception range for this signal is more than 150km.
Furthermore, airborne electronic support system can be
close to or even deep into the enemy battlefield. So
airborne electronic support system can greatly improve
SNR, and then improve DF accuracy. However, it is
unthinkable to layout ULA more than tens of meters or
even hundreds of meters in an aircraft (especially small
UAV) or in a satellite.
MUSIC based on ULA can not find 2-D directions
of signals. Radio communication signals can
arrive at receiver through ionosphere reflection in
short-wave band, so the DF must jointly measure
the azimuth and elevation of a signal. Therefore,
the array structure can't be straight line, but should
be plane array or three-dimensional array.
In view of the weakness of linear antenna array, it is
necessary to consider some other array structures, such as
circular array. Compared with linear array, the size of
circular array can be fixed. For a circumference with the
fixed radius, the number of antennas which are arranged
in it is flexible. Furthermore, to increase the number of
antennas does not increase the size of the array.
Circular array with 8 antennas is commonly applied to
DF. The mathematical model of circular array with 8
antennas is shown in Fig. 1. Eight antennas are arranged

International Journal of Signal Processing Systems Vol. 1, No. 2 December 2013
274©2013 Engineering and Technology Publishing
in a horizontal circle with the radius of d uniformly, the
north antenna is numbered as 0, the else antennas are
numbered as 1~7 clockwise.
At first, we consider the inducted voltage of one signal
at each antenna. For simple, we just find the azimuth of
signal, i.e. suppose the elevation of signal to be 90°.
Figure 1. The uniform circular array with 8 antennas
Let the signal at the center O of the circle is )(ts .
Connect the center O with the ith antenna and gain the
line )7,,2,1,0( iOi . The angle from the wave
vector P
to O0 is . Mark i as the angle from P
to
Oi , then 45ii . The phase difference
between the signal received by the ith antenna and )(ts
is )7,,1,0(cos)/2( id ii, so the signal
received by the ith antenna is
)7,,1,0()()()(cos2
ietsetstxidi jj
i.
In general, suppose K signals are narrowband plane
waves which are mutually independent, and mark
: the wavelength of K signals,
K ,,,
21 : the directions of K signals,
)7,,1,0;,,2,1(45 iKkik
i
k:
the angle from Oi to the wave vector of the kth signal, i
k
i
k d cos)/2( : the phase difference of the
kth signal between the signal received by the ith antenna
and )(tsk
,
Tjjj
k
kkk eeea ),,,()(710
:the direc-tion
vector of the kth signal,
)(,),()( 1 KaaA : the direction matrix of
K signals,
TK tststS )(,),()( 1 : the signal vector of K
signals at the center O of the circle,
)7,,1,0()( itni
: the noise received by the ith
antenna,
TtntntntN )(,),(),()(710
: the noise vector
received by the array,
TtxtxtxtX )(,),(),()(710
: the array induc-
tion voltage vector received by the array,
then the array induction voltage vector can be expressed
as following
)()()()()()(11
tNtsatsatXKK
)()()( tNtSA
The steps of MUSIC based on uniform circular array
(UCA) is as following: at first, record the array induction
voltage vector X(t); secondly, calculate the array
covariance matrix; thirdly, decompose the array
covariance matrix based on eigenvalue; fourthly,
construct the spatial spectrum function; and finally,
search azimuth angles along the spatial spectrum and get
the directions of signals.
These steps are exactly same as the MUSIC based on
ULA, so we shall not relate them any more.
II. INTRODUCTION TO SIMULATION SYSTEM OF
MUSIC BASED ON UCA
The simulation system of MUSIC based on UCA
consists of six modules, such as signal transmitter,
channel, UCA, receiver, MUSIC and the results display.
These modules form a complete simulation system of
MUSIC based on UCA according to the logic sequence,
as shown in Fig. 2.
Figure 2. The simulation system of MUSIC based on UCA
III. SIMULATION ANALYSES OF DF EFFICIENCY OF
MUSIC BASED ON UCA
In following experiments, the radius of UCA is 1.0λ,
the search step of MUSIC is 0.1° and the noise intensity
is -12dB except for special declare.
A. DF Efficiency of Independent Signals
The simulation system interface of MUSIC for
independent signals DF is shown in Fig.2. In the
simulation system, it is possible to find directions of 1, 2,
3 or 4 signals by setting the intensity of some signals to
be 0. In four experiments, the signals are independent for
their modulation modes are different. The signal
parameters and DF results of four experiments are shown
in Table I.
The experiment results indicate that MUSIC based on
UCA can find the directions of 1, 2, 3 or 4 independent
signals accurately, so MUSIC based on UCA has the
function of finding the directions of independent signals.
Experiment 1 shows that MUSIC based on UCA can
find the direction of one signal.

International Journal of Signal Processing Systems Vol. 1, No. 2 December 2013
275©2013 Engineering and Technology Publishing
TABLE I. THE SIGNAL PARAMETERS AND SIMULATION RESULTS OF INDEPENDENT SIGNALS
Number Signal parameters DF results
DF errors Signal Modulation mode Amplitude Angle(°) Angle(°) Peak value
1 1 2ASK 5.0 -50.0 -50.000000 818.375305 0.0
2 1 2ASK 5.0 -50.0 -49.899998 573.329773 0.100002
2 BPSK 5.0 48.0 48.000004 1058.373657 0.000004
3
1 2ASK 5.0 -50.0 -50.000000 270.664612 0.0
2 BPSK 5.0 48.0 48.000004 285.595612 0.000004
3 QPSK 4.0 170.0 169.900009 320.817078 0.099991
4
1 2ASK 5.0 -50.0 -50.000000 741.809570 0.0
2 BPSK 5.0 48.0 48.000004 743.294617 0.000004
3 QPSK 4.0 170.0 170.000000 395.218781 0.0
4 BFSK 4.0 240.0 240.000000 196.823456 0.0
B. Angle Distinguishing Ability
Two simulation experiments are to investigate the
angle distinguishing ability of two independent signals.
The search step of MUSIC is 1.0°. The signal parameters
and DF results of two experiments are shown in Table II.
Table II shows that the angle distinguishing ability of
two independent signals of MUSIC based on UCA
reaches to 2° at least and 1° at most when the search step
is 1.0°. Whereas the simulation experiments showed that
the angle distinguishing ability of two independent
signals of MUSIC based on ULA reached to 5° at least
and 4° at most. So the angle distinguishing ability of
MUSIC based on UCA is higher than MUSIC based on
ULA.
It must be pointed out that the angle distinguishing
ability is related to the search step. The angle distin-
guishing ability will be higher when the search step is
less. So we can improve the angle distinguishing ability
of MUSIC based on UCA by decreasing the search step
when necessary.
TABLE II. THE ANGLE DISTINGUISHING ABILITY OF MUSIC BASED ON UCA
Number Signal parameters DF results
DF errors Signal Modulation mode Amplitude Angle(°) Angle(°) Peak value
1 1 2ASK 5.0 48.0 48.000000 619.398987 0.0
2 BPSK 5.0 50.0 50.000000 696.122375 0.0
2 1 2ASK 5.0 49.0 - - ∞
2 BPSK 5.0 50.0 50.000000 787.617554 0.0
C. Mirror Image Vagueness
MUSIC based on ULA has the problem of mirror
image vagueness. In order to solve the problem, MUSIC
based on orthotropic ULAs should be used[2]
. For two
antenna arrays, MUSIC searches the angle in (-90°, 90°)
according to defined step respectively, and determines the
directions of signals by seeking the same angles of two
sets of angles found. The spectrum curve of MUSIC
based on ULA in (-90°, 90°) is symmetrical with the
curve in (90°, 270°), therefore, it is not necessary to
search in (-90°, 270°), it is enough to search only in (-90°,
90°). By this way, the search range of MUSIC based on
single ULA is reduced by half. During the simulation
experiment, MUSIC based on two ULAs search the angle
at the same time, then the time of simulation experiment
can be reduced one time by parallel processing
technology.
The simulation results show that MUSIC based on
UCA does not have the problem of mirror image
vagueness. During the simulation experiment, the search
range of MUSIC based on UCA is not (-90°, 90°), but (-
90°, 270°). Therefore, the search range is double to
MUSIC based on ULA, so the search time is doubled.
Under the same simulation environment and with the
same electromagnetic parameters, the running time of
MUSIC based on UCA is nearly double to MUSIC based
on orthogonal ULAs.
D. Aperture Vagueness
MUSIC based on ULA has the problem of aperture
vagueness. Aperture vagueness occurs when the distance
of two adjacent antennas is large than 0.5λ. Here, we
study whether MUSIC based on UCA has the problem of
aperture vagueness by simulation experiment. The
method is to observe the spectrum curve changing with
the change of radius of UCA. The electromagnetic
environments of six experiments are same. One signal is
2ASK modulation, direction angle is -38.0°; another
signal is BPSK modulation, direction angle is 57.0°. The
amplitudes of two signals are all 5.0. The experiment
results are shown in Table III.
Table III shows that the accuracy of DF improves
gradually with the radius of UCA increasing, and there is
no vagueness angle. Therefore, MUSIC based on UCA
does not have the problem of aperture vagueness.
International Journal of Signal Processing Systems Vol. 1, No. 2 December 2013
276©2013 Engineering and Technology Publishing
TABLE III. THE EXPERIMENT RESULTS OF MUSIC BASED ON UCA WITH DIFFERENT RADIUSES
Number Radius Angles of DF(°) Errors of DF(°)
Average error(°) -38.0 57.0 -38.0 57.0
1 0.1λ -38.000000 57.100002 0.0 0.100002 0.050001
2 0.5λ -37.899998 57.000004 0.100002 0.000004 0.050003
3 0.8λ -38.000000 56.900002 0.0 0.099998 0.049999
4 1.0λ -38.000000 57.000004 0.0 0.000004 0.000002
5 1.5λ -38.000000 57.000004 0.0 0.000004 0.000002
6 2.0λ -38.000000 57.000004 0.0 0.000004 0.000002
E. Influence of SNR on DF Accuracy
Above simulation experiments are carried out at -12dB
noise intensity. Next, we do the simulation experiment of
MUSIC based on UCA at different SNR. The electro-
magnetic environments of six experiments are same. One
signal is 2ASK modulation, direction angle is -38.0°;
another signal is BPSK modulation, direction angle is
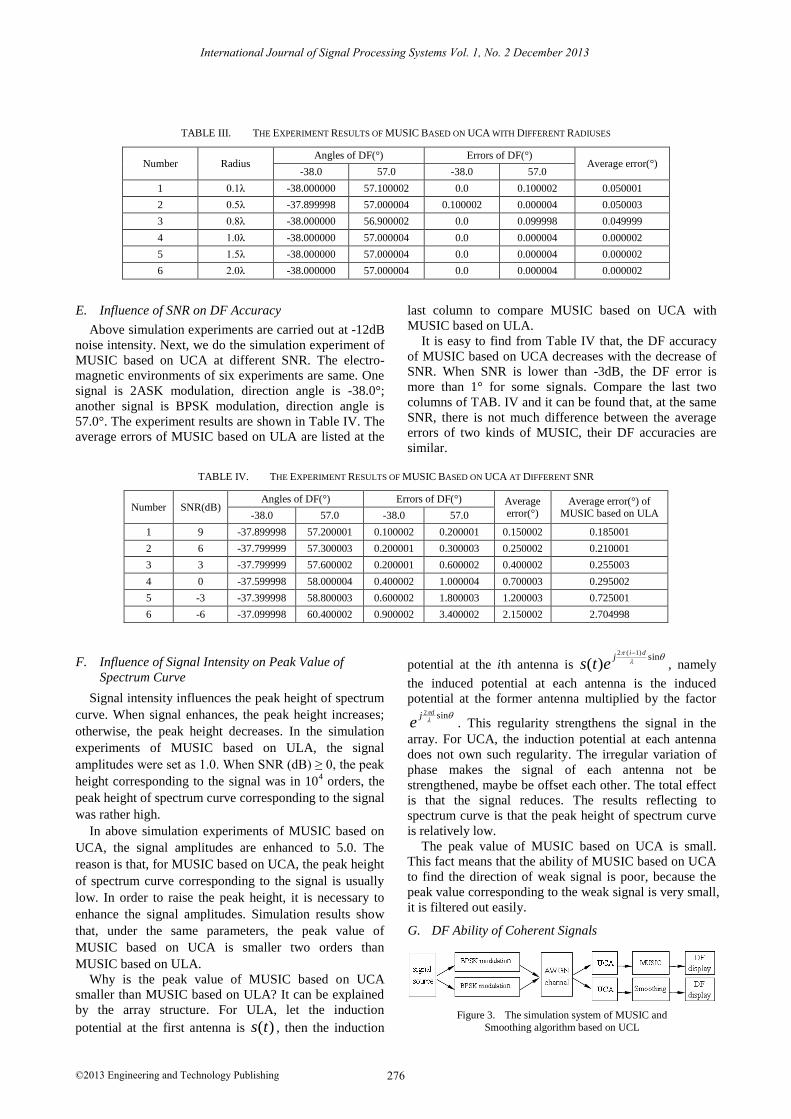
57.0°. The experiment results are shown in Table IV. The
average errors of MUSIC based on ULA are listed at the
last column to compare MUSIC based on UCA with
MUSIC based on ULA.
It is easy to find from Table IV that, the DF accuracy
of MUSIC based on UCA decreases with the decrease of
SNR. When SNR is lower than -3dB, the DF error is
more than 1° for some signals. Compare the last two
columns of TAB. IV and it can be found that, at the same
SNR, there is not much difference between the average
errors of two kinds of MUSIC, their DF accuracies are
similar.
TABLE IV. THE EXPERIMENT RESULTS OF MUSIC BASED ON UCA AT DIFFERENT SNR
Number SNR(dB) Angles of DF(°) Errors of DF(°) Average
error(°) Average error(°) of
MUSIC based on ULA -38.0 57.0 -38.0 57.0
1 9 -37.899998 57.200001 0.100002 0.200001 0.150002 0.185001
2 6 -37.799999 57.300003 0.200001 0.300003 0.250002 0.210001
3 3 -37.799999 57.600002 0.200001 0.600002 0.400002 0.255003
4 0 -37.599998 58.000004 0.400002 1.000004 0.700003 0.295002
5 -3 -37.399998 58.800003 0.600002 1.800003 1.200003 0.725001
6 -6 -37.099998 60.400002 0.900002 3.400002 2.150002 2.704998
F. Influence of Signal Intensity on Peak Value of
Spectrum Curve
Signal intensity influences the peak height of spectrum
curve. When signal enhances, the peak height increases;
otherwise, the peak height decreases. In the simulation
experiments of MUSIC based on ULA, the signal
amplitudes were set as 1.0. When SNR (dB) ≥ 0, the peak
height corresponding to the signal was in 104 orders, the
peak height of spectrum curve corresponding to the signal
was rather high.
In above simulation experiments of MUSIC based on
UCA, the signal amplitudes are enhanced to 5.0. The
reason is that, for MUSIC based on UCA, the peak height
of spectrum curve corresponding to the signal is usually
low. In order to raise the peak height, it is necessary to
enhance the signal amplitudes. Simulation results show
that, under the same parameters, the peak value of
MUSIC based on UCA is smaller two orders than
MUSIC based on ULA.
Why is the peak value of MUSIC based on UCA
smaller than MUSIC based on ULA? It can be explained
by the array structure. For ULA, let the induction
potential at the first antenna is )(ts , then the induction
potential at the ith antenna is
sin
)1(2
)(di
jets
, namely
the induced potential at each antenna is the induced
potential at the former antenna multiplied by the factor
sin2 dj
e . This regularity strengthens the signal in the
array. For UCA, the induction potential at each antenna
does not own such regularity. The irregular variation of
phase makes the signal of each antenna not be
strengthened, maybe be offset each other. The total effect
is that the signal reduces. The results reflecting to
spectrum curve is that the peak height of spectrum curve
is relatively low.
The peak value of MUSIC based on UCA is small.
This fact means that the ability of MUSIC based on UCA
to find the direction of weak signal is poor, because the
peak value corresponding to the weak signal is very small,
it is filtered out easily.
G. DF Ability of Coherent Signals
Figure 3. The simulation system of MUSIC and
Smoothing algorithm based on UCL

International Journal of Signal Processing Systems Vol. 1, No. 2 December 2013
277©2013 Engineering and Technology Publishing
The simulation system of MUSIC and Smoothing
algorithm based on UCA is shown as in Fig.3.
The modulation mode of two signals is BPSK, and the
amplitude of two signals is 5.0. The direction of one
signal is 45° and the direction of another signal is 70°.
Since the frequency and modulation mode of two signals
are same, two signals are coherent signals.
Run simulation program, the simulation result of
MUSIC is as shown in Fig. 4 and the simulation result of
Smoothing algorithm is as shown in Fig. 5. The
experiment results indicate that MUSIC and Smoothing
algorithm based on UCA aren’t able to find the directions
of coherent signals.
Figure 4. The simulation result of MUSIC based on UCA
Figure 5. The simulation result of Smoothing algorithm based on UCA
Ref. [4] pointed out that we could find the directions of
coherent signals based on UCA and the method was as
following: carry on Smoothing to the mode space of UCA
and gain the revised matrix; apply MUSIC to the revised
matrix and estimate the directions of coherent signals.
Ref. [5] put forward another method to find the directions
of coherent signals. For UCA, when the antenna number
is large enough, do discrete Fourier transform to the
mode space and turn it into the form of ULA, then apply
Smoothing algorithm based on ULA to distinguish
coherent signals. However, these methods increased DF
complications, therefore, UCA is worse than ULA for
distinguishing coherent signals.
IV. CONCLUSIONS
The DF simulation system of MUSIC based on UCA is
constructed. The efficiency of MUSIC based on UCA and
MUSIC based on ULA are summarized as follows
according to the simulation experiment results.
Two kinds of MUSIC are in common: they all have the
DF function of single signal; they all have the DF
function of multiple independent signals; the DF accuracy
is related to many factors such as SNR, the search step
length, the distance of two adjacent antennas, the number
of antennas; the DF accuracy of two kinds of MUSIC is
close in the same electromagnetic field; they all can not
find the directions of coherent signals.
The advantage of MUSIC based on UCA: the array
size is smaller; it is easy to increase antenna to improve
the DF accuracy; the angle distinguishing ability of
signals is higher than MUSIC based on ULA; there is no
image vagueness; there is no aperture vagueness. The weakness of MUSIC based on UCA: ULA can
eliminate the coherence of coherent signals by spatial smoothing technique, but UCA can not directly eliminate the coherence of coherent signals, even can not eliminate the coherence of coherent signals by spatial smoothing technique. This is the most serious defect of UCA. The ability of MUSIC based on UCA to find the direction of weak signal is poor compared with MUSIC based on ULA.
In summary, we recommend MUSIC based on UCA in airborne DF system for the following reasons. At first, it is easier to arrange the circular array on an aircraft or a satellite. Secondly, the signals with same frequency are independent for aerial reflectors around the antenna are fewer, this avoid the defect of MUSIC based on UCA. Finally, the high SNR of airborne antennas can heighten the spectrum peak, and increase probability of signal capture.
REFERENCES
[1] B. F. Sun and Z. X. Shi, “Simulation study of spatial estimation,”
Radar and ECM, Series no. 140, no. 3, pp. 9-13, Sep. 2004. (in Chinese)
[2] B. F. Sun, “MUSIC based on orthotropic ULAs for determining
unidirectional DOAs,” in Proc. ITA2013, Chengdu, 2013. (in press) [3] B. F. Sun, “Simulation study of estimation of number and coherent
state of signals,” Computer and Information Technology, Series no. 136, no. 1, pp. 21-23, Jan. 2005. (in Chinese)
[4] Y. L. Wang, H. Chen, Y. N. Peng, and Q. Wan, Theory and
Algorithm of Spatial Estimation, 1st ed. Peking, China: Tsinghua University Press, 2004, ch. 11, pp. 350-351. (in Chinese)
[5] X. C. Xiao, “Array signal processing with EW application:
Yesterday, today and tomorrow,” Electronic Warfare, Series no.
94, no. 1, pp. 1-7, Jan. 2004. (in Chinese)
Baofa Sun was born in Hefei, Abhui, China on Nov.
15 1965. Master of Science was earned in Anhui University in 1996, Ph. D. of signal and information
processing was earned in Electronic Engineering
Institute of PLA in 2005. He worked in Electronic Engineering Institute as a teacher from 1996 to 2008,
in Hefei Institute of Finance and Economics as the Dean of Engineering College from 2008 to 2010; in Anhui Sanlian
University as a tenured associate professor since 2010. He took charge
of and completed 3 projects of university level, participated in 4 projects of provincial level as main researcher. He published more than 50
papers. He published two books: Application of Number Theory (Peking: Education and Culture Press of China, 2006) and A Concise Course of
Computer Application Basis (Dalian, Liaoning: Dalian University of
Technology Press, 2011). His current research interests are including
computer application, communication system simulation, embedded
system and internet of things. Dr. Sun is the executive director of Anhui Provincial Association of Household Appliances. More than ten papers
of Dr. Sun won outstanding paper awards.
Top Related