


Languages
Pages
Legal


MPRAMunich Personal RePEc Archive
Financial Inclusion and Digital FinancialServices: Empirical evidence from Ghana
Francis Agyekum and Stuart Locke and Nirosha
Hewa-Wellalage
School of Business, Valley View University. Accra, Ghana, School ofAccounting, Finance and Economics, Waikato Management SchoolThe University of Waikato. Hamilton, New Zealand, School ofAccounting, Finance and Economics, Waikato Management SchoolThe University of Waikato. Hamilton, New Zealand
30 November 2016
Online at https://mpra.ub.uni-muenchen.de/82885/MPRA Paper No. 82885, posted 23 November 2017 11:03 UTC

1
Financial Inclusion and Digital Financial Services: Empirical evidence
from Ghana
ABSTRACT
The paper examines the relationship between increasing accessibility to digital financial
services (DFS) and financial inclusion in lower income countries (LICs). Banks and non-bank
organisations use DFS and the analysis indicates non-bank-based DFS emerges as the most
efficient means of delivering cost effective financial services to the previously unbanked.
Mobile cellular penetration and internet usage are mutually inclusive means through which
digital financial services foster financial inclusion. Analysis of data for Ghana, as a case study,
uses ordinary least squares and logistic regression models. The results in Difference-In-
Difference method confirms the positive significant trend of mobile money usage and negative
trend of bank-based DFS facilities over the period 2011-2014 in Ghana. Unambiguous policy
ramifications are emphasised, paying attention to technological deepening stimulate positive
outcomes of a broader and inclusive financial system.
Highlights
• Technological deepening plays in advancing financial inclusion in Ghana.
• Increase in mobile subscription rate of 1 percent leads to 1.19 percent increase in
credit to private sector.
• Increase in internet penetration of 1 percent leads to 17.2 percent increase in
financial inclusion in household.
• Delivering digital financial services extends financial inclusion to previously
‘unbanked’.
• Increased availability of financial services for the marginalised increases growth.
JEL classification: O30; O50; G20
Key words: Digital financial services (DFS), financial inclusion, Logistic regression,
Difference-in-Difference, LICs, Ghana.

2
INTRODUCTION
This paper examines the effect on participation in the financial sector in lower income countries
(LICs) of increasing accessibility to digital financial services (DFS). Analysis of data from
Ghana, as a case study, looks especially at the impact on financial inclusion (FI) of the mobile
phone rollout and internet usage. Our motivation stems from a concern for those who are
unbanked and financially excluded who may miss opportunities to improve their wellbeing.
Technological amenities may drive inclusion through delivery of digital financial services
(DFS) and an equitable participation in the gains has important policy implications. The
relative impacts may differ between financial (banks) and non-financial (non-bank) entities
offering DFS to their clients.
Financial inclusion captures the extent to which financial resources are available, accessible
and affordable to a population. The rapid growth in availability and adoption of ICT in many
parts of Africa (Adam and Wood 1999; Andrianaivo and Kpodar 2012; Kpodar and
Andrianaivo 2011a) proffers an opportunity for expanding financial inclusion. World Bank
(WDI) Report, (2014) by Mundial (2014) reveals mobile tele-density (telephone per 100
persons) in Ghana, rose from 1.3 percent in 2001 to 101 percent by 2012 and current ITU/ICT
database estimate is 115 percent. The internet penetration rate is relatively slower, averaging
50 percent per annum according to ITU estimates. The potential to enhance financial inclusion
leveraging new technology is present (Gelos and Roldós 2004; Kpodar and Andrianaivo 2011a;
2011b; Triki and Faye 2013) but the extent to which financial service delivery to the poor is
improving needs investigation.
Financial inclusion lacks precision in prior research, and may simply refer to the provision
of appropriate, affordable and widely accessible quality financial services to the marginalised
groups in society, when viewed from the supply side (Triki and Faye 2013). A demand side
perspective sees financial inclusion as needing to ensure access to financial services, which
include an opportunity to save, make payments, transfer and access insurance services (Hannig
and Jansen 2010).
Our empirical analysis, using data on Ghana, provides new insights flowing from a more
robust treatment than found in earlier research. For an outcome, variable account ownership
and usage are suitable proxy indicators of financial inclusion (Allen et al. 2016). Ownership of
a bank account increases savings, empowers females, and tends to incentivise consumption and
productive investment of entrepreneurs (Aportela 1999; Ashraf et al. 2010; Dupas and
Robinson 2013), promoting financial inclusivity for account holders.

3
Estimation of a binary model (logit) with a Difference-In-Difference approach as a
robustness check provides for more insightful dichotomous multiple-regression modelling.
Further, focusing on a single country brings out certain country-specific details and
characteristics not emphasised in cross-country studies (Allen, Demirgüç-Kunt, Klapper, and
Martinez Peria, 2012). Inclusion of structural rigidities suggests significant policy outcomes.
Clear signals for donor agencies with respect to critical matters requiring attention for the
attainment of inclusive growth, poverty reduction and a much broader impact from financial
inclusion flow from this form of analysis.
LITERATURE REVIEW
Theoretical Underpinnings
Transaction cost, Information Asymmetry and Financial inclusion
Until the recent telecommunication revolution, information cost to many developing
countries was significantly high (Norton 1992) due to high cost of information gathering and
dissemination (Waverman et al. 2005). This high transaction cost means that productivity
would be low. For the financial service providers who rely on reliable information to ascertain
the credit worthiness of clients, this would suggest that many economic agents would be
financially excluded in such countries.
Theoretical framework that are often used in accessing the marginal effect of ICT, is what is known
as the network externality effect (Andrianaivo and Kpodar 2012; Waverman et al. 2005). As an instance,
Waverman et al. (2005) argue, “telecommunication networks are part of social overhead capital”, in
which case socio-economic returns that accrue from it could potentially outweigh the private returns to
society. In this, the indirect effect of ICT amenities such as mobile phones and internet on growth for
instance, has attracted research attention (see e.g., Kpodar and Andrianaivo, 2011). The positive
externality of telecommunication network is its ability to allow costless flow of information to market
participants (Andrianaivo and Kpodar 2012; Norton 1992; Waverman et al. 2005). This indeed helps
overcome the problems of information asymmetry and transaction cost (Norton 1992), especially in
rendering financial services to the previously underserved. Kpodar, argues that this helps promote both

4
credit accessibility and deposit mobilisation, hence financial inclusion. Innovation that accompanies
ICT development means that cost of service will reduce translating into increased consumer surplus.
Seen as indirect effects, the Kpodar and Andrianaivo (2011a) regard ICT as a key factor that can
potentially deepen financial inclusion. The emergence of branchless banking services in serving the
previously excluded, can be attributed to ICT usage, with the ultimate positive impact towards financial
inclusion (Kpodar and Andrianaivo 2011a). Both time and distance costs of accessing formal banking
services, could prove to be costly for the poor and the marginalised. Consequently, technological
deepening that ensures effective communication network replaces the transportation cost to a physical
facility. In his study, Norton (1992) as also finds reduction in transaction cost associated with
advancement in ICT in a cross-country study involving 47 economies.
ICT, allows credit suppliers to remotely ascertain the credit worthiness of both existing and
potential clients. Consequently, Kpodar and Andrianaivo (2011a) argue that financial inclusion is
incentivised by ICT amenities such as mobile phones and internet because of their usefulness in
ensuring efficient credit allocation.
Growth, according to Hannig and Jansen (2010), emerges when financial intermediaries are in
a position to reduce information asymmetries. Transaction costs reduce with the emergence of
both financial instruments and institutions, as evidenced by a deepening of the long-run
relationship between borrowers and lenders (Levine (2005).
Theories of information asymmetry and transaction cost contribute to explaining the
financial constraints and exclusion borrowers encounter. Information opacity that characterises
operations of most LICs shows borrowers as less attractive, making them more prone to the
risk of not gaining financial inclusion (Dong and Men 2014; Stiglitz and Weiss 1981). Credit
rationing based on poor information promotes financial exclusion.
Prior research linking financial inclusion with economic growth and social development
raises issues of breadth and depth. Breadth relates to coverage, percentage of the population
covered, while depth encompasses how much service is available, variously interpreted as size
of credit or the number of instruments and services available. Not surprisingly, there is a range
of different variables and metrics, which lack cohesion. Transaction and information
technologies (Gelos and Roldós 2004) may offer a means to overcome difficulties in providing
sound credit administration to the poor (Kpodar and Andrianaivo 2011b).

5
Ang (2011) advances evidence suggesting that financial liberalisation reallocates talent
from the innovative sector to the financial system, thus retarding technological deepening. An
alternative view espoused by (Diniz et al. 2012) suggests ICT bridges a financial infrastructural
gap for service providers to incorporate new clients who were previously excluded from a
financial substructure. ICT, by enhancing access to credit and deposit facilities, assists the
allocation and transfer of financial credit thereby boosting financial inclusion. Mobile
technology, according to Rasmussen (2010), is bridging the gap in such African countries as
Kenya and South Africa.
Triki and Faye (2013) assert that financial inclusion is a key building block for inclusive
growth. Using generalised method of moment (GMM), Kpodar and Andrianaivo (2011b)
establish that mobile phone rollout significantly spurs economic growth in Africa, as it fosters
financial inclusion. Digital financial services evolving in most parts of Africa promote growth
at both the firm and national levels, promoting a premise that sustained growth is realisable
through greater financial inclusion. Opportunities offered by DFS, such as branchless banking,
allow those with limited or no access to the formal financial sector to engage in financial
transactions at relatively little cost. Research, to date, suggests technological deepening further
deepens the financial process and ultimately leads to inclusiveness.
DATA
World Bank sources predominantly provide our secondary data inputs. International
Telecommunication Union’s ICT statistics supplement World Bank reports on mobile
subscriber and internet users, which are part of the world development indicators (WDI) series.
Data cover 1996–2014. The Heritage Foundation/Wall Street1produces the Index of Economic
Freedom. Global Findex2 dataset provides the microdata covering account ownership and
usage of financial services, demographic characteristics of respondents including gender, age,
income, and education.
Table 1 presents the descriptive statistics for the variables. The decomposition of the
account ownership into financial institutions-based and MNOs-based helps with the analysis.
Approximately 37 percent of respondents own accounts with formal intermediaries compared
with 10 percent who own mobile-based accounts (mobile money/wallet). Internet penetration,
with the mean value of 4.62, is low compared with mobile penetration rate of 115 percent3.
1 (in World Bank domain sources) 2 In World Bank domain sources 3 That this rate exceeds 100% is expected, as it is common to find people using more than one handset with different
network providers, due to network coverage issues.

6
<<<<<<INSERT TABLE 1>>>>>>>>
Demographic characteristics such as age, income and educational attainments of respondents
serve as control variables in the micro-econometric model. Mean age of 34 suggests
respondents are mostly young, finding the use of smart phones with internet functionality
useful. The income variable indicates 18.7 percent fall within the poorest quintile, 20.1 percent
in the second-lower quintile, 18.0 percent in the median quintile, 20.1 percent in the mid-upper
quintile, and 23.1 percent within the richest quintile.
Educational levels, although uneven, do fairly reflect the educational attainment levels of
the adult population in Ghana. This has implications for financial inclusion if inclusion is
predominantly limited to those at top of the educational-ladder.
METHOD
An ordinary least square (OLS) model for the macro-dataset, (following Kendall et al. (2010))
and a logistic regression model for the micro-dataset provide the empirical estimations.
OLS deals with relationship between yi and xi such that the conditional mean function is
specified as: E(yi/xi) = xi′β …….(a); and the resultant estimator (β̂), which must satisfy
the basic assumption underlying the classical regression model is given below:
β̂ = min⏟β∈R
∑ (E(yi/xi) − xi′β)2n
i=1 1
where β̂ is the estimator that minimises the conditional mean function in equation 1. The
estimator, which is the sum of the error squared (Cameron and Trivedi 2005), is assumed to
be BLUE in Gauss–Markov sense (Drygas 1983; Harville 1976; Zyskind and Martin 1969).
Accordingly, it is assumed that the model is not only linear in parameters but also with an
error term, which is, both serially uncorrelated and homoscedastic.
Logistic regression is employed for the estimation of equation 5, using household-level
data with a dichotomous outcome variable (Angrist and Pischke 2008). Given that the error
follows a binomial distribution (Gujarati and Porter 1999), logistic serves as the appropriate
link function. As a link function, logit transforms the original F(π; 1,0) in a way that the
estimates π̂ behave as continuous, using a maximum likelihood estimation (MLE) process.
This way, the logit function spreads the outcome variable over the entire range of numbers.
Logit function is expressed as:
F(π) = log [π / (1- π)]
7
where π is the probability of ‘success’ or ‘that an event occurs’; and [π / (1- π)] is the odds of
an event occurring. The monotonic transformation from probability into odds suggests that
the odds increase with the probability, and vice versa.
Generally, the logistic model expressed as a probability can be specified as:
Pr(π) ob(y = 1lx) = (e(βX)
1+e(βX)) 2
where π is that probability of event occurring (agents getting included financially, in our
specific case). The y, which represents likelihood of financial inclusion, is a dummy variable
taking on binary values defined as:
y = {1, if individaul is includeed (owns an accounts)
0, if otherwise
The Xs are the explanatory variables and the βs are the coefficient estimates. The βs are
the logarithmic transformed odd ratios of the logit model.
ln (π
1 − π) = β0 + β1Xi1 + β2Xi2 + β3Xi3 + ⋯ . +βpXip
The Logistic regression model uses household-level data with a dichotomous outcome
variable (Angrist and Pischke 2008).
EMPIRICAL MODEL SPECIFICATION
FI=f(ICT, MEI, EFI) 3
Variables
Dependent Variable (DV): The FI, in equation 3, denotes financial inclusion.
Independent Variables (IVs): The main IVs are ICT indicators viz. mobile phone and
internet usage per population. National level indices such as macroeconomic indicators (MEI)
and Economic Freedom indicators (EFI) serve as useful control variables in the macro-model.
Specific econometric estimated model 1 (using the Macro-level data)
FIt = β0 + β1TIt + β2Xt + εt 4
The macro-level investigation, equation 4, relies on domestic private credit to GDP as an
indicator because it is found to be significantly associated with, and a key part of, financial
inclusion (Demirgüç-Kunt and Klapper 2012).
Specific econometric estimated model 2 (using the household/micro-level data)
FIi = β0 + β1TIi + β2Xi + εi 5

8
The DV in the household model, in equation 5, uses account ownership as a proxy of financial
inclusion, which has been used in many prior studies (Brown and Taylor 2011; Demirgüç-Kunt
et al. 2013; Friedline 2012; Friedline et al. 2014; Greeson et al. 2010; Kim et al. 2011; Mandell
2005). FIi measures likelihood of inclusion, the TIi, capturing Technological Infrastructure
and Xi, control variables. The βis are parameter estimates and ɛi is the non-stochastic error term.
Maximum-likelihood estimation approach with Logit model provides the link function.
Appendix 2 contains details of diagnostic test results.
FINDINGS
The hypothesis that ICT reduces information asymmetry and transaction cost necessary for
broader financial inclusion is tested. Technological infrastructure and mobile phone
penetration rates are positively correlated with financial inclusion as reported in Table 3,
supporting prior studies (see, e.g., (Kendall et al. 2010)). ICT influences services provision
through the supply of credit information. The resultant impact is a reduction of problems
relating to information asymmetry and the transaction cost of rendering financial services. This
results in more inclusion in the financial system. As this helps overcome issues relating to
information asymmetry and transaction cost of rendering financial services, the outcomes will
be a greater inclusion in the financial system.
<<<<<<INSERT TABLE 2>>>>>>>>
The macro-level analysis reported (see Table 2), shows a yearly increase in mobile subscription
rate of 1 percent leads to an approximate 1.19 percent increase in credit to the private sector,
after controlling for variables such as GDP per capita growth rate (GDP_pcg) and
unemployment (u-rate). The ‘Mobile Subscription’ indicator (MOBsub_Rate) has a significant
positive impact on financial inclusion, suggesting the widespread adoption of mobile network
services will impact favourably on the financial sub-sector.
Results from the household-level data (see Table 3) indicate a significant contribution by
ICT's towards financial inclusion in Ghana. The use of a mobile phone in financial transactions
increases the likelihood of being financially included as mobile technology allows the
previously unbanked to perform financial transactions via mobile phones. With such a unique
platform as a mobile money facility, payments for utility bills, fees, fund transfers (domestic

9
and cross-border) and other financial services, can be carried out (Donovan 2012; Jack and
Suri 2011; Kpodar and Andrianaivo 2011b).
Kpodar and Andrianaivo (2011b) also find a positive correlation between financial
inclusion and mobile penetration. They observe that mobile phone penetration enhances credit
allocation process, leading to broader inclusion in the financial system. ICT and mobile
network services ensure a better flow of information. This helps reduce both information
asymmetry and transaction costs of providing financial services to the poor (Donovan 2012;
Kpodar and Andrianaivo 2011b). This reduction in information asymmetry between lenders
and creditors is made possible as it ensures timely availability of information (Demirgüç-Kunt
et al. 2008). Jensen (2007) notes that the information flow helps reduce price volatility, adding
to the positive economic effects of mobile telephony. Financial inclusion is attainable because
ICT amenities bridge the infrastructural gap in delivering financial services to the marginalised
(Diniz et al. 2012).
Again, prior studies have empirically established that countries with wider platforms for
information sharing tend to experience significant levels of financial inclusion as higher bank
credits result (Djankov et al. 2007; Jappelli and Pagano 2002). LICs provide a better case for
policy consideration. Better information accessibility and transparent contract enforcement
deepen the financial system (Demirgüç-Kunt et al. 2008; Detragiache et al. 2005; Djankov et
al. 2007), thereby increasing participation in the credit industry.
The internet usage (INTSub_Rate) captures the number of people with access to the
worldwide web. The macro-level analysis suggests an inverse relationship between financial
inclusion proxy and internet penetration rate. The household-level analysis (Table 3, column
5), however, shows a robust positive marginal impact [ME(dy/dx)=0.172] at 5 percent
significance levels. The mixed outcome emanates from the nature of the dataset involved,
suggesting several explanations as to why the macro and micro results differ.
The macro-level analysis uses internet penetration rate over time (trend), incorporating no
direct reference to usage in financial transactions. The household data, however, obtains
specific information relating to the use of internet in financial transactions for the past year.
Characteristically of most LICs, home-based internet facilities in Ghana are a preserve of the
few affluent. There is also concern over internet security4, which has thwarted the efforts of
some intermediaries to introduce an internet-banking facility in Ghana. Figure 1 shows the
widespread usage of mobile phone unmatched by the internet accessibility trend in Ghana.
4 (known in Ghana as computer ‘Sakawa’)

10
<<<<<<<<<<<<Figure 1 >>>>>>>>>>>
Figure 1 shows the trends and relationship between mobile phone penetration rate, internet
usage and domestic credit to the private sector. It reveals that both internet and mobile
telephony were at the low rate of usage prior to the year 2003. However, the exponential rise
in the trend of the mobile penetration rate relative to internet over the same period supports the
econometric coefficient estimates. The proliferation of smart phones with internet facility as
an added feature in recent times probably plays a role in this rise.
Logistic Regression Results: Bank-based and Non-bank-based DFS
An important research question is whether wider financial inclusion emerges from the
traditional banking system or non-bank entities such as the MNOs. Both banks and non-bank
organisations offer digital financial services to their clients. The micro-level analysis using
Global Findex data, (see Table 3) controls for variables such as age, gender and income of the
respondents. The highly educated, the aged and rich (higher income group) individuals have a
high likelihood of financial inclusion. Gender does not appear to be a significant determinant
of financial inclusion, consistent with Annim et al. (2014).
Coefficients with odds ratios (ORs) less than 1 suggest a negative relationship and those
greater than 1 a positive relationship. Stronger positive relationships give higher coefficient
estimates for income for the baseline model (column 2) revealing that the ORs increase
consistently (1.10, 2.42, 3.68 & 6.39) from the lower (poor) to the higher (rich) income
quantiles.
The results (in odds ratios), indicate that likelihood of inclusion increases multiplicatively
by over 8 point (baseline) and approximately 9.8 (follow-up model) for each mobile cellular
usage for financial transaction. The marginal effect (ME= 0.396) of mobile facility usage in
financial transactions for the follow-up model (column 5) is found to be stronger than internet
usage (ME= 0.172). The level of significance reflects the robustness of the outcome on mobile
phone usage relative to the use of internet. This further confirms the previous observation that
mobile phone penetration in Ghana drives inclusion via DFS compared to internet usage. Triki
and Faye (2013) find comparable results for Kenya.
Account ownership with MNOs (non-bank-based) and with a financial intermediary (bank-
based) are subsequently used as dependent variables provide an opportunity to investigate

11
which emerging route of offering digital financial services promises greater inclusion outcome
in Ghana. The traditional (bank-based) mode of delivering DFS differs significantly from non-
bank-based DFS offered by MNOs, which appear to be pro-poor and non-discriminatory. The
income quintile has no significant impact on financial inclusion driven via MNO’s DFS.
Neither age nor income status determines whether individuals can use mobile-based DFS as
shown in Table 4 (columns 4 & 5). This pro-poor inclusion promotes further inclusive-growth,
resulting from innovative means of rendering financial services to the unbanked.
<<<<<<INSERT TABLE 3>>>>>>>>
Financial inclusion promoted by financial institutions significantly discriminates against the
lower income quintiles households (see Table 4, columns 2 & 3). Baseline model estimates
show significant likelihood of financial inclusion among the richer income quintiles.
Participation in the formal financial sector in Ghana, until recently, required individuals to have
a source of income. Although this requirement is being relaxed, following growing
competition in the sector, the notion that the formal banks will refrain from serving the poor
remains (Carbo et al. 2007; Dev 2006). Noticeably, there is a similar result for age of the
respondents. Participation in the formal financial sector appears to have an age bias. By
contrast, the only requirement for owning mobile-money account in Ghana is a registered SIM
card.
The strength of mobile-based DFS as an emerging trend in deepening financial inclusion
compared with the bank-based (debit/credit cards usage) is established. This operationally
defines the contemporaneous trade-offs between mobile-based DFS and bank-based DFS. The
contemporaneous trade-offs are observed as the likelihood of inclusion increases with the
mobile money usage (non-bank-based DFS) from the baseline year (2011) to the follow-up
year (2014). Simultaneously, the likelihood of inclusion reduces with bank-based DFS over the
same time spectrum. This appears consistent across the three equations (6,7 & 8) reported on
Table 4. For clarity, the effect observed of the bank-based DFS (debit/credit cards usage)
defines the contemporaneous trade-offs between mobile-based DFS and bank-based DFS. The
contemporaneous trade-off is observable as the likelihood of inclusion increases with the
mobile money usage (non-bank-based DFS) from the baseline year (2011) to the follow-up

12
year (2014). Simultaneously, the likelihood of inclusion reduces with bank-based DFS over the
same time spectrum, as summarised on Table 5. The trade-offs observed is expected to inform
policy concerning which of the routes of offering DFS in Ghana positively influence the
unbanked.
<<<<<<<<<<<<Figure 2 >>>>>>>>>>>
Figure 2; Shows the average marginal effect of usage of technological amenities and
financial inclusion, using the base year global Findex data (2011) data. Figure 3 below shows
comparable outcome using the follow-up (2014) Findex data.
<<<<<<<<<<<<Figure 3 >>>>>>>>>>>
The difference is the inclusion of internet variable on which data was available in the
follow-up period. The zero (dotted horizontal line) is the dividing policy benchmark. The
further up the line an indicator lies suggests stronger financial inclusion likelihood.
Consequently, users of the technological amenities, individuals with tertiary level education
and those within the rich quintile are strongly found to have high probability of being
financially included.
<<<<<<INSERT TABLE 4>>>>>>>>

13
<<<<<<INSERT TABLE 5>>>>>>>>
Robustness checks: Difference-in-difference Estimation method
One further robustness check, using Difference-In-Difference (DID) estimation affirms the
observed trade-offs between Bank-based and Non-bank-based DFS is consistent across the two
data spectra (2011-2014). The positive significant coefficient of variable “_diff” (0.210) in
Table 7 (Column 3), confirms the positive significant trend of mobile money usage over the
period (2011-2014). However, the usage of bank-based DFS facilities shows a negative trend
(-0.172) as one moves from the baseline to the follow-up period.
<<<<<<INSERT TABLE 6>>>>>>>>
SUMMARY
Overcoming structural rigidities, financial market imperfections and vast informalities endemic
in LICs assists integration of the poor into sharing inclusive growth. Indeed, an inclusive and
a broadened financial system will promote growth. Financial inclusion promotes growth
through a broadening of the system and technology can be a major catalyst for greater financial
inclusion.
The study confirms the significant role technological deepening plays in advancing
financial inclusion in Ghana, with potentially wider applicability to other LICs. Further
research is necessary to determine the generalisability of these Ghanaian findings. Theory and
prior research point towards the likelihood of the results obtained and the careful use of control
variables increases the potential for similar studies in other LICs obtaining similar results.
As delivery of digital financial services is made accessible and affordable for people who
were previously ‘unbanked,’ the take up increases rapidly. Financial inclusion and broader
participation through mobile cellular penetration and internet usage reduces both transaction
and information costs of rendering financial services, including to the poor. The resultant
benefits of cost reduction in providing services through expanding technological amenities
flow to financial services' providers and recipients.
An inclusive financial system is more likely when policy makers and relevant industry
players collaborate to create a technologically conducive atmosphere. An agenda toward
14
financial inclusion and technological advancement in LICs is unlikely to be fruitful if pursued
in isolation. Striking a healthy balance between pursuing an inclusive financial system, pro-
poor growth and a technologically advanced system is essential. Each aspect has a part to
contribute.
Paying attention to the observable trade-offs in emerging modes of delivering financial
services to the marginalised is important to attain inclusive and pro-poor growth. The drive
towards inclusion made possible by the mobile phone platform does not discriminate along
income, class or age group lines. Policy-makers, donors and industry players may need to pay
attention to technological deepening in order to achieve a broader and inclusive financial
system.
REFERENCES
Adam, L. and Wood, F. 1999: An investigation of the impact of information and communication
technologies in sub-Saharan Africa. Journal of information Science 25(4), 307-318.
Allen, F., Demirguc-Kunt, A., Klapper, L. and Pería, M.S.M. 2016: The foundations of financial
inclusion: Understanding ownership and use of formal accounts. Journal of financial
Intermediation(ISSN: 1042-9573).
Andrianaivo, M. and Kpodar, K. 2012: Mobile phones, financial inclusion, and growth. Review of
Economics and Institutions 3(2), 30.
Ang, J.B. 2011: Financial development, liberalization and technological deepening. European
Economic Review 55(5), 688-701.
Angrist, J.D. and Pischke, J.-S. 2008: Mostly harmless econometrics: An empiricist's companion. New
Jersey, USA.: Princeton University Press.
Annim, S., Awusabo-Asare, K., Abane, A., Amonoo, E. and Acheampong, I. 2014: Poverty Assessment
and a Comparative Study of Rural Microfinance Institutions and Government Programmes in
Ghana. Inter-university Consortium for Political and Social Research (ICPSR) [distributor].
Aportela, F. 1999: Effects of financial access on savings by low-income people. USA: MIT Department
of Economics Dissertation.
Ashraf, N., Karlan, D. and Yin, W. 2010: Female empowerment: Impact of a commitment savings
product in the Philippines. World Development 38(3), 333-344.
Brown, S. and Taylor, K. 2011: The saving behavior of children: Analysis of British panel data.
Cameron, A.C. and Trivedi, P.K. 2005: Microeconometrics: methods and applications. New York,
USA: Cambridge University Press.
Carbo, S., Gardener, E.P. and Molyneux, P. 2007: Financial exclusion in Europe. Public Money and
Management 27(1), 21-27.
Demirgüç-Kunt, A. and Klapper, L.F. 2012: Financial inclusion in Africa: an overview. World Bank
Policy Research Working Paper(6088).
Demirgüç-Kunt, A., Klapper, L.F. and Singer, D. 2013: Financial inclusion and legal discrimination
against women: evidence from developing countries. World Bank Policy Research Working
Paper(6416).
Demirgüç-Kunt, A., Levine, R. and Detragiache, E. 2008: Finance and economic development: The
role of government. Policy Working Paper 3955.

15
Detragiache, E., Gupta, P. and Tressel, T. 2005: Finance in lower-income countries: An empirical
exploration.
Dev, S.M. 2006: Financial inclusion: Issues and challenges. Economic and political weekly, 4310-4313.
Diniz, E., Birochi, R. and Pozzebon, M. 2012: Triggers and barriers to financial inclusion: The use of
ICT-based branchless banking in an Amazon county. Electronic Commerce Research and
Applications 11(5), 484-494.
Djankov, S., McLiesh, C. and Shleifer, A. 2007: Private credit in 129 countries. Journal of Financial
Economics 84(2), 299-329.
Dong, Y. and Men, C. 2014: SME Financing in Emerging Markets: Firm Characteristics, Banking
Structure and Institutions. Emerging Markets Finance and Trade 50(1), 120-149.
Donovan, K. 2012: Mobile money for financial inclusion. Information and communication for
development, 61-73.
Drygas, H. 1983: Sufficiency and completeness in the general Gauss-Markov model. Sankhyā: The
Indian Journal of Statistics, Series A, 88-98.
Dupas, P. and Robinson, J. 2013: Savings constraints and microenterprise development: Evidence from
a field experiment in Kenya. American Economic Journal: Applied Economics 5(1), 163-192.
Friedline, T. 2012: Predicting children's savings: The role of parents' savings for transferring financial
advantage and opportunities for financial inclusion. Children and Youth Services Review 34(1),
144-154.
Friedline, T., Johnson, P. and Hughes, R. 2014: Toward healthy balance sheets: Are savings accounts a
gateway to young adults’ asset diversification and accumulation? Federal Reserve Bank of St.
Louis Review 96(4), 359-389.
Gelos, R.G. and Roldós, J. 2004: Consolidation and market structure in emerging market banking
systems. Emerging Markets Review 5(1), 39-59.
Greeson, J.K., Usher, L. and Grinstein-Weiss, M. 2010: One adult who is crazy about you: Can natural
mentoring relationships increase assets among young adults with and without foster care
experience? Children and Youth Services Review 32(4), 565-577.
Gujarati, D.N. and Porter, D.C. 1999: Essentials of econometrics (Vol. 4th ed.). New York, NY USA:
McGraw-Hill/Irwin, The McGraw-Hill Companies, Inc.
Hannig, A. and Jansen, S. 2010: Financial inclusion and financial stability: current policy issues. ADBI
working paper series No. 259.
Harville, D. 1976: Extension of the Gauss-Markov theorem to include the estimation of random effects.
The Annals of Statistics, 384-395.
Hosmer Jr, D.W., Lemeshow, S. and Sturdivant, R.X. 2013: Applied logistic regression (Vol. 398).
USA: John Wiley & Sons.
Jack, W. and Suri, T. 2011: Mobile money: the economics of M-PESA. Cambridge, MA. USA. National
Bureau of Economic Research.
Jappelli, T. and Pagano, M. 2002: Information sharing, lending and defaults: Cross-country evidence.
Journal of Banking & Finance 26(10), 2017-2045.
Jensen, R. 2007: The digital provide: Information (technology), market performance, and welfare in the
South Indian fisheries sector. The quarterly journal of economics, 879-924.
Kendall, J., Mylenko, N. and Ponce, A. 2010: Measuring financial access around the world. World Bank
Policy Research Working Paper Series, 5253.
Kim, J., LaTaillade, J. and Kim, H. 2011: Family processes and adolescents’ financial behaviors.
Journal of family and economic issues 32(4), 668-679.
Kpodar, K. and Andrianaivo, M. 2011a: ICT, financial inclusion, and growth evidence from African
countries. USA. International Monetary Fund. 1455225010.
Kpodar, K. and Andrianaivo, M. 2011b: ICT, financial inclusion, and growth evidence from African
countries: International Monetary Fund.
Levine, R. 2005: Finance and growth: theory and evidence. Handbook of economic growth 1, 865-934.
Mandell, L. 2005: Financial literacy: Does it matter. Buffalo, NY: University of Buffalo. April, 2005.
Mundial, B. 2014: World Development Indicators 2014. Relaciones Internacionales. Retreived in 15
June, 2016, from
https://openknowledge.worldbank.org/bitstream/handle/10986/18237/9781464801631.pdf

16
Norton, S.W. 1992: Transaction costs, telecommunications, and the microeconomics of macroeconomic
growth. Economic Development and Cultural Change 41(1), 175-196.
Rasmussen, S.F. 2010: Mobile Banking in 2020. CGAP Advancing financial access for the world's
poor. http://www. cgap. org/p/site/c/home.
Stiglitz, J.E. and Weiss, A. 1981: Credit rationing in markets with imperfect information. The American
economic review 71(3), 393-410.
Stock, J.H., Watson, M.W. and Addison-Wesley, P. 2007: Introduction to econometrics (Vol. August
2, 2014; ISBN-13: 978-0201715958). USA: Pearson; 3rd edition
Thrikawala, S.S. 2016: Corporate Governance and Performance of Microfinance Institutions (Mfis): A
Comparative Study in Sri Lanka and India, University of Waikato.
Triki, T. and Faye, I. 2013: Financial inclusion in Africa. African Development Bank: Tunis.
Waverman, L., Meschi, M. and Fuss, M. 2005: The impact of telecoms on economic growth in
developing countries. The Vodafone policy paper series 2(03), 10-24.
Zyskind, G. and Martin, F.B. 1969: On best linear estimation and general Gauss-Markov theorem in
linear models with arbitrary nonnegative covariance structure. SIAM Journal on Applied
Mathematics 17(6), 1190-1202.
17
APPENDIX
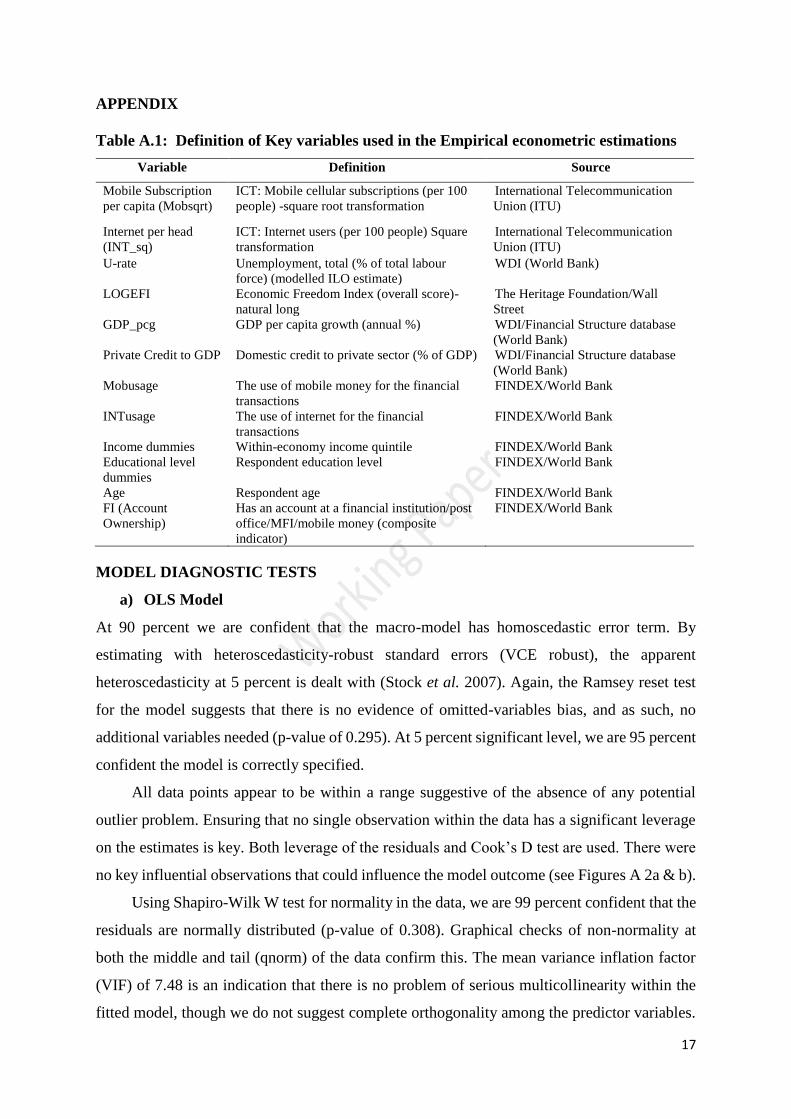
Table A.1: Definition of Key variables used in the Empirical econometric estimations
Variable Definition Source
Mobile Subscription
per capita (Mobsqrt)
ICT: Mobile cellular subscriptions (per 100
people) -square root transformation
International Telecommunication
Union (ITU)
Internet per head
(INT_sq)
ICT: Internet users (per 100 people) Square
transformation
International Telecommunication
Union (ITU)
U-rate Unemployment, total (% of total labour
force) (modelled ILO estimate)
WDI (World Bank)
LOGEFI Economic Freedom Index (overall score)-
natural long
The Heritage Foundation/Wall
Street
GDP_pcg GDP per capita growth (annual %) WDI/Financial Structure database
(World Bank)
Private Credit to GDP Domestic credit to private sector (% of GDP) WDI/Financial Structure database
(World Bank)
Mobusage The use of mobile money for the financial
transactions
FINDEX/World Bank
INTusage The use of internet for the financial
transactions
FINDEX/World Bank
Income dummies Within-economy income quintile FINDEX/World Bank
Educational level
dummies
Respondent education level FINDEX/World Bank
Age Respondent age FINDEX/World Bank
FI (Account
Ownership)
Has an account at a financial institution/post
office/MFI/mobile money (composite
indicator)
FINDEX/World Bank
MODEL DIAGNOSTIC TESTS
a) OLS Model
At 90 percent we are confident that the macro-model has homoscedastic error term. By
estimating with heteroscedasticity-robust standard errors (VCE robust), the apparent
heteroscedasticity at 5 percent is dealt with (Stock et al. 2007). Again, the Ramsey reset test
for the model suggests that there is no evidence of omitted-variables bias, and as such, no
additional variables needed (p-value of 0.295). At 5 percent significant level, we are 95 percent
confident the model is correctly specified.
All data points appear to be within a range suggestive of the absence of any potential
outlier problem. Ensuring that no single observation within the data has a significant leverage
on the estimates is key. Both leverage of the residuals and Cook’s D test are used. There were
no key influential observations that could influence the model outcome (see Figures A 2a & b).
Using Shapiro-Wilk W test for normality in the data, we are 99 percent confident that the
residuals are normally distributed (p-value of 0.308). Graphical checks of non-normality at
both the middle and tail (qnorm) of the data confirm this. The mean variance inflation factor
(VIF) of 7.48 is an indication that there is no problem of serious multicollinearity within the
fitted model, though we do not suggest complete orthogonality among the predictor variables.

18
At 5 percent level of significance, we are able to observe that both mobile cellular and internet
subscriptions rate do jointly have significant impact on financial inclusion using the F statistics.
Figure A.1: Diagnosis of influential observations (author’s analysis using the WDI-
macro-data)
Treatment of missing data
The trend of the governance data allowed for the three years that data were missing to be
replaced. A simple average of the years preceding and following the missing year was used
following this formulation (tm=(yt-1+yt+1)/2). In an event that the variable missing had no earlier
datum, the succeeding year’s data were used (Thrikawala 2016).
Logistic Regression model
A test on specification error was performed to ensure that the choice of logit as the link function
fit the data well. In view of this, it was assumed that there were no relevant variable(s) omitted
and the link function was correctly specified. This is informed by the predictive power of “_hat”
(p-value =0.000) and the variable ‘_hatsq” having no significant predictive power (p-value =
0.786).
Both Pearson’s and Hosmer and Lemeshow's goodness-of-fit were performed to ensure the
model fit well. The p-values of approx. 0.91 for the Hosmer and Lemeshow’s, and 0.36 for the
Pearson’s–X2 tests, are indicative that the estimated model fits the data well (Hosmer Jr et al.
2013). Also, the models’ mean VIF of 1.11 and the tolerance measure suggest that there is no
problem of multicollinearity.
The model’s predictive accuracy was assessed using sensitivity and specificity. The
receiver operating characteristic (ROC) curve was used. The curves help in examining the
predictive ability of the fitted model. This helps to ensure that those included financially are
correctly classified as such. The area under ROC curve of 0.76 which increased to 0.8 after
-.5
0.5
11.5
2
Co
ok'
s D
0 2 4 6 8 10 12 14 16 18 20id
Cook's Distance Measure of Influential Obs
.2726798
.3527912
.482041.6171718.83114911.1241131.3981281.9795292.852218
3.666409
4.8708935.810103
7.0757667.98583
8.477424
9.234443
10.04954
10.4015
-.5
0.5
11.5
2
Le
vera
ge
0 5 10 15 20id

19
dealing with few influential observations (IOs), suggests that the fitted model has fairly strong
predictive power (Hosmer Jr, Lemeshow, & Sturdivant, 2013) (See Figure A 3).
a. Prior to dealing with the IOs b. After dealing with IOs
Figure A.2: ROC Curves for the fitted regression model [before (b) and after (b)
dropping off influential observations]
Detection of some influential observations that could potentially have high leverage on the
model’s outcome is key to the logit model. Using three basic building blocks for logistic
regression diagnostics (Pearson residual, deviance residual and Pregibon leverage),
observations that could potentially have high leverage on the model outcome were rigorously
examined and given attention. Again, ensuring that the log-odds transformed model produced
a linear association between the predicted variable and the covariates, Lowes graph was
produced, which reasonably indicates that the relationship is linear (See Figure A.3.5).
Fig. A.3.1 Fig. A.3.2 Fig. A.3.3
0.0
00.2
50.5
00.7
51.0
0
Sen
sitiv
ity
0.00 0.25 0.50 0.75 1.001 - Specificity
Area under ROC curve = 0.7652
0.0
00.2
50.5
00.7
51.0
0
Sen
sitiv
ity
0.00 0.25 0.50 0.75 1.001 - Specificity
Area under ROC curve = 0.8009
02
46
810
H-L
dD
0 .2 .4 .6 .8 1Pr(FI=>AccOwn)
Deviance Residuals vs. Predicted Probabilities
5955484326252349
42
428335277065565958
18
605850514241404738373619353431302229
49
65353426
25
242127632524
60
26
70
413837363433316759282754
5026
4623
43
2270
45
66
3263
306059563324
38
236254595149265648338322534552
51
432642
49
484047303822264234651940
32
312230372952362835
27
262532
242330
2221
5828
20
5727
1926
18
25
17
24
16
5323
15
3822
59
215020
49
19
42
48
18
17
74
45
1580
5143
42
39
75
3038
45
6544
36
3542
3462
40
32
39
3159
38305837295736
28
27
34
2633
25
24
23
51
2921
49
28
20
48
27
19
55
2618
2553
45165223
50
75
20
484019
3972
18
3837
4436
3534
40
3230
3729
36
28
3527
68
26
33
25
32
24
2330
22
2954
282027196052
2618
25
17241622
55
21
75
67
20
661952
1870
17691662156166463858
28
44
63563354
40
32
61
5365
38
37583554
27
343352515345
3150
30
59505855
28
47
2049
54
48
45
39
25
38
4537
53
50
42
35
48
40
42502077
38
4032
18
37
31363046
35
37294542
36
28
8072413327
34
265039
312530
24
76
68312336
30
22
46
27
21373426
2025
27
19
43
3532
24
26
18
232517416130
22
2416402921
23
28
20
22
38
30
6627193765
18
20
36
5617
19
241618
34
26
54
2315
33
2553
22
1632
24
60522131
2030
58191828172718
46
2517
53
45165215
42
21
19
18
46
38
3716981535
42
40383037
3635
333290
28
2027
26
807770157574682181
67
807217716316
70
621574
68
67726671706256606259526564565850495560525345
58
50
52
44
494348504255474146484053
46
3851
45
3643354840424746384032
45
373931363830
43
353729423641
35
403239313325383032373123
36
2830
35
27
292128201932263123173022
16
211528222719
21
26
1820191618151722
16
21152019181716153026
22
25 25
24
40
50
3028
24
68
2815
23
37
27
1650
26
3835
25
17
347070
50
21
17
5730
62
20
20 29
3215
50
32
24
2843 35
30 2519
18
70 26
38
60 27
26
1515
21
70
3625
43
40 17
19
26
19
4238
30
30
2238
244030
26
2022
3426
15 3028 4220
46
5221
2330
27
26
28
27
21
31 30 40
27
17
40
45
27
3719
2724
4242
20
45
27
36
19
30
46
29
2121
4570
23
4030
37383023
58
4040
45
2024
36
23
17
38
18
45
25
30
17
40
21
38
20
30 4240
18
24
47621535
23 213636
17 18 35 2345
24
4042
3718
70
6045
27
5932
3834
22
40 2717
20
5518
29
40
26
30
45
34
3128
48
2518
5037
282421
20
2327
2222
4820
48 27
3216
27
6538
28
37572319
36
23
42
30
35
4018
2323
23
20
22
503016
38
30
22
18
37
3918 3819
27
383826
46
36 35
31
2022
25
30
20
39
21
3615
25 28
35
2030
33
23
222521
3018
2323
16
23
28
152572
44
3080
29
16
28
24
25
203445
26
21
23
30
2627
19
35
45
19
22
32
17
19
20
35 50
16
3045
3225
23
17
31
25
4518 45
26
35 38
19
4621
40
19
27
32
2480 16
171821
34
2521
46
2022
39
24
3833 19
80
30
22
30 29
15
34
50
30 31
20
32
38
2625
3828
2822
4545
15
35
26
242135 37
-8-6
-4-2
02
46
810
sta
nd
ard
ize
d P
ea
rson r
esid
ual
0 .2 .4 .6 .8 1Pr(AccOwn)
5955484326252349
42
428335277065565958
18
605850514241404738373619353431302229
49
65353426
25
242127632524
60
26
70
413837363433316759282754
5026
4623
43
2270
45
66
3263
306059563324
38
236254595149265648338322534552
51
432642
49
484047303822264234651940
32
312230372952362835
27
262532
242330
2221
5828
20
5727
1926
18
25
17
24
16
5323
15
3822
59
215020
49
19
42
48
18
17
74
45
1580
5143
42
39
75
3038
45
6544
36
3542
3462
40
32
39
3159
38305837295736
28
27
34
2633
25
24
23
51
2921
49
28
20
48
27
19
55
2618
2553
45165223
50
7520484019
3972
18
3837
4436
3534
40
3230
3729
36
283527
68
26
33
25
3224
2330
22
2954
282027196052
2618
25
17241622
55
21
75
67
20
661952
1870
17691662156166463858
28
44
63563354
40
32
61
5365
38
37583554
27
343352515345
3150
30
59505855
28
47
2049
54
48
45
39
25
38
4537
53
50
42
35
48
40
42502077
38
4032
18
37
31363046
35
37294542
36
28
8072413327
34
265039
312530
24
76
68312336
30
22
46
27
21373426
2025
27
19
43
3532
24
26
18
232517416130
22
2416402921
23
28
20
2238
30
6627193765
18
20
36
5617
19
241618
34
26
54
2315
33
2553
22
1632
24
60522131
2030
58191828172718
46
2517
53
45165215
42
21
19
18
46
38
3716981535
42
40383037
3635
333290
28
2027
26
807770157574682181
67
807217716316
70
621574
68
67726671706256606259526564565850495560525345
58
50
52
44
494348504255474146484053
46
3851
45
3643354840424746384032
45
373931363830
43
353729423641
35
403239313325383032373123
36
2830
35
27
292128201932263123173022
16
211528222719
21
26
1820191618151722
16
21152019181716153026
22
2525
24
40
50
3028
24
68
2815
23
37
27
1650
26
3835
25
17
347070
50
21
17
5730
62
20
2029
321550
32
24
284335
302519
18
7026
38
6027
26
1515
21
70
3625
43
4017
19
26
19
4238
30
30
2238
244030
26
2022
3426
1530284220
46
5221
2330
27
26
28
27
21
313040
27
17
40
45
27
3719
2724
424220
45
27
36
19
30
46
292121457023
4030
37383023
58
4040
45
2024
36
23
17
38
18
45
25
30
17
40
21
38
20304240
18
24
47621535
23213636
1718352345
24
4042371870
6045
27
5932
383422
402717
20
5518
29
40
26
30
45
34
3128
48
2518
5037
282421
20
232722224820
4827
3216
27
653828
37572319
36
23
42
30
35
4018
2323
23
20
22
503016
38
30
22
18
37
39183819
27
383826
46
3635
31
2022
25
30
20
39
21
3615
2528
35
2030
33
23
2225213018
2323
16
23
28
152572
44
308029
16
28
24
25
203445
26
21
23
30
2627
19
35
45
19
2232
17
19
20
3550
16
3045
322523
17
31
2545184526
3538
19
4621
4019
27
32
248016171821
34
2521
46
2022
39
24
383319
80
30
22
3029
15
34
50
3031
20
32
38
2625
3828
2822
4545
15
35
26
24213537
-10
-8-6
-4-2
02
46
810
sta
nd
ard
ize
d P
ea
rson r
esid
ual
0 200 400 600 800 1000id

20
Fig. A.3.4 Fig. A.3.5 Fig. A.3.6
Figure A.3: Key diagnostics for Logistics Regression Model
0.0
00.2
50.5
00.7
51.0
0
Sen
sitiv
ity/S
pe
cific
ity
0.00 0.25 0.50 0.75 1.00Probability cutoff
Sensitivity Specificity
0.2
.4.6
.81
AccO
wn
0 .2 .4 .6 .8 1Pr(FI=AccOwn)
bandwidth = .8
Lowess smoother
05
10
15
20
25
30
35
H-L
dX
^2
0 .2 .4 .6 .8 1Pr(FI=>AccOwn)
21
Full Contact details of the Corresponding Authors (*) and Co-authors are below:
*Corresponding Author: Francis K. Agyekum-PhD (Valley View University, Accra, Ghana)
Co-authors: Stuart Locke-Professor of Finance (Tel: +64(07)8384331, Email:
[email protected]) & Nirosha Hewa-Wellalage, PhD-Senior Lecturer ([email protected] ).
The School of Accounting, Finance and Economics, University of Waikato, Hamilton, New Zealand.
Top Related