


Languages
Pages
Legal


MR Tanker Market Summary & Outlook
April, 2007
Prepared by:Jerry Lichtblau
Mallory Jones Lynch Flynn & Associates, Inc.

2
MR Sector Issues/ConcernsNear-Term
State of spare refining capacity (“dearness of refined products”) and projected oil demand growthOPEC production cuts – market psychology impactVessel supply growthVegoil issues
Conversion of older tonnage – how many and how soonPreviously utilized fleet is old – approx. 130 Non –Chemical MR’s abt 120 pre ’90 blt The avg age of this portion will be 26+ as of Jan ‘07
Winter season dynamics going forwardInventories in Atlantic Basin – interplay of oil supply with overall tanker market -- impact of OPEC cuts Lack of “typical winter weather early in season” in Atlantic Basin – North America & Europe
Foreshadowing summer issues – weak spring melt – low river levels in Europe sub optimal use of nuclear plants power requirements to be met from
alternative energy sources (?? fuel oil Pmx/MR’s to be impacted ??)Orderbook & Phase-outs2009+ Impact of Refinery Expansion (AG/India)
3
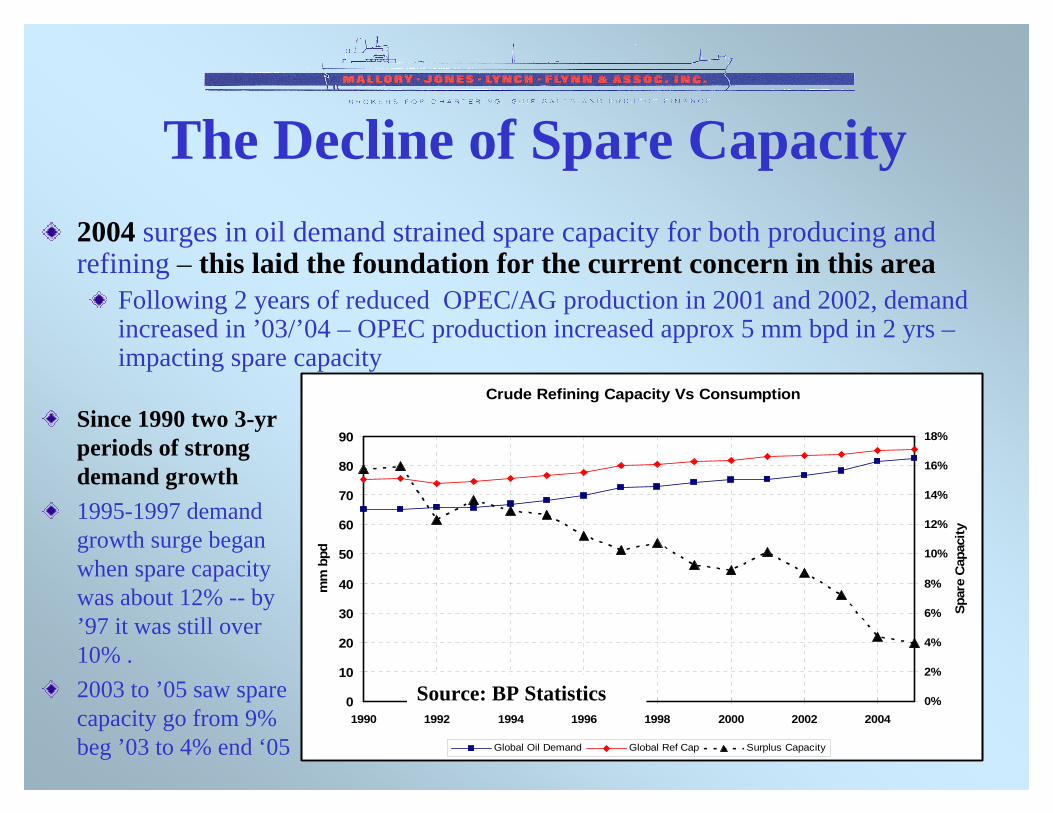
The Decline of Spare Capacity2004 surges in oil demand strained spare capacity for both producing and refining – this laid the foundation for the current concern in this area
Following 2 years of reduced OPEC/AG production in 2001 and 2002, demand increased in ’03/’04 – OPEC production increased approx 5 mm bpd in 2 yrs –impacting spare capacity
Since 1990 two 3-yr periods of strong demand growth1995-1997 demand growth surge began when spare capacity was about 12% -- by ’97 it was still over 10% .2003 to ’05 saw spare capacity go from 9% beg ’03 to 4% end ‘05
Crude Refining Capacity Vs Consumption
0
10
20
30
40
50
60
70
80
90
1990 1992 1994 1996 1998 2000 2002 2004
mm
bpd
0%
2%
4%
6%
8%
10%
12%
14%
16%
18%
Spar
e C
apac
ity
Global Oil Demand Global Ref Cap Surplus Capacity
Source: BP Statistics

4
Future Refined Product Capacity GrowthAdditional Refinery CapacityAdditional Atlantic basin capacity has come from and will likely continue to come from the expansion of existing facilities -Environmental and legal issues in the west resulting in additional refineries being planned/built/expanded closer to crude source – see chart below for refinery capacity growth by regionBy decades end total additions are estimated to be approximately 12 mm bpd*
* Source JP Morgan – Anticipating the Next Big Refinery Build Out

5
Historic Oil Demand Growth
Since 1990 global demand growth has grown an average of 1.5% (1.6% since ’97) but arrived at this point in a 5–3–5–3 pattern (5 yrs slow growth, 3 yrs rapid, 5 slow 3 rapid -- ?? entering slow period?).Additionally, when growth rate expands -- heavily Non-OECD drivenCommentary – last valid 2006 data in August ?? – Katrina impact – implies potential demand data issues until March/April of this year
Full year ‘06 information* indicates demand fell in OECD (though less then prelim estimates) Non-OECD growth similar to ‘05 – Through 8/06 – OECD (400k+) bpd & Non-OECD 1 mm+ bpd – by Yr. end Katrina impact reduced OECD demand drop to (325k) bpd while Non-OECD up 950k bpd * Basis Energy Intelligence Group (EIG)
U.S., W. Europe & Japan all down a combined 210k+ bpd & China up 400k bpd & India 100k bpdContinued Non-OECD growth requires continued shield from world mkt prices – this requires OECD to continue to buy Non-OECD products – Global eco. growth

6
Demand And InventoriesEnd 2006 Picture/Early 2007Oil demand growth slowing in face of rising prices
Easing demand felt most in developed world Inventories robust throughout year assisted by Contango Pricing– in U.S. and Europe –product stks easing until yr end, but mild winter early winter proceeds to reverse trendOPEC announced production cuts – (A) 1.2 mm bpd as of Nov. 1 – pragmatically wait for December #’s to gain true picture of compliance – prelim info that cuts abt 100k bpd over target (B) subsequent 500k bpd cut commencing Feb 1 – “stocks to return to avg levels”Mid/late Spring ’07?? – OPEC Compliance appears to be about 75% as of Jan. ‘07 Seasonal rebound in refining margins late winter into spring
IEA proj. demand growth ended 2006 on the decline but outlook has recovered somewhat – March #’s - 1% ’06/1.8% ’07 (about 850k/1.5mm bpd)
Caution should be paid to fact that following a February increase to above #’s IEA has eased Q1 estimates, but balanced them by raising Q4 projections
Projections for 2007 from other industry forecasters are somewhat softer -- the Energy Intelligence Group is projecting demand growth of 1.4%/1.2 mm bpd – note this is also an increase vs. earlier projections
Major question remains - After inventories tighten and OPEC cuts end will additional oil be demanded or will spare capacity begin to increase

7
Vessel Supply - MRMR’s are often thought of as one tanker sector – what this encompasses though varies depending upon ones perspective
Major directories include all vessels 10 to 60,000 dwt - 2006 began with nearly 1,350 of what are classified as “Handy tankers” in this size range. It is about 1,450 as 2007 began – this excludes specialty and IMO 1&2 chemical vessels that combine for over 900 tankers – “specialty” broken out as other on subsequent slidesMany of the tankers can also have the capability to service different marketsIn order to be relevant to the user, information for this size range needs to be classified into sectors that are broken into size and type ranges

8
MR Tanker SupplyProjected Jan. ’07 & Dec. ‘06 Orderbook
Quick StatsNon Specialty (excl. chemicals & other) – 2/3 30 to 60k/1/3 10 to 30k
Orderbook 10 to 30k incl. 25 ’06 deliveries is approximately 25% of PPC/IMO 3IMO 1 & 2 – 2/3 10 to 30k/1/3 30 to 60k – orderbook 70% 10 to 20k/ about 25% 30 to 60k

9
MR Tanker Supply Age Profile By Tanker Type
20-30k dwt portion likely to have void developing – nearly 2/3 of the approx.175 non specialty 20-30k dwt vessels are over 20 years of age with 3 on order.
About 135 vessels are 25-30k dwt – void from older portion to be filled by 35 to 40k orderbook ??The chemical fleet is heavily concentrated in the smaller sizes and young -- over half the fleet is 10-20k dwt & about 550 of the 850+ IMO 1/2 fleet is under 10 yrs of age (see slide after next for rest of fleet detail – 30 to 60k dwt)
The smaller dwt will be growing dramatically -- near 50% of 10-20k fleet is on order, but demand growth for segment to be longer haul – vegoil related

10
MR Tanker Supply Age Profile By Tanker Type
10 to 30 MR Fleet Profiled By Percentile

11
MR Tanker Supply Age Profile By Tanker Type
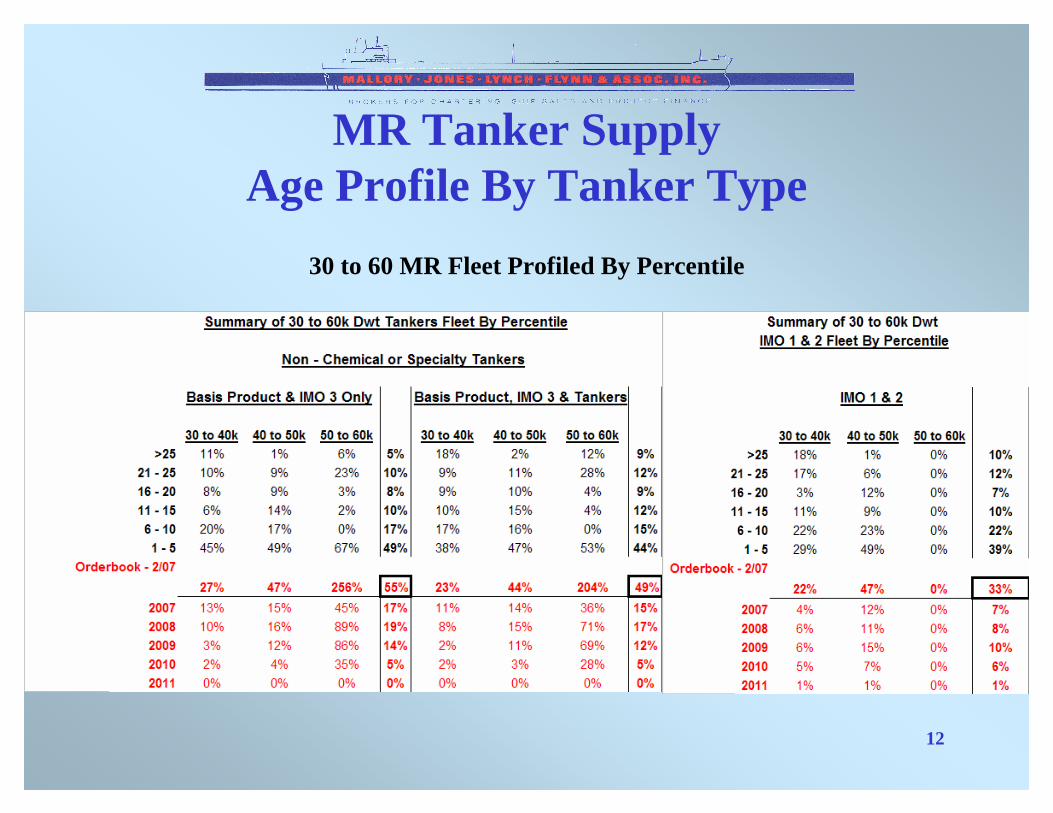
Over 250 non-chemical or specialty deliveries in last 5 yrs 40-50k (specifically 45/50k).
Near 250 more on order, but void noted in 25-30 to pull 30-40k, which in turn will pull 40 to 50k -- note age of 30-40k portionOrderbook likely to provide pressure, but not as strong as some fear
Non product portion of sector largely ignored.Negligible increase in long-haul portion of IMO 2 fleet for new vegoil transport delivering during year 11
12
MR Tanker Supply Age Profile By Tanker Type
30 to 60 MR Fleet Profiled By Percentile

13
Sector Issues/ConcernsOrderbook & Phase-outsNear 225 25 to 40k dwt vessels to phase-out by 2010 – Only 97 on orderComprises
Three-fourths of 25-30kFour out of ten of the 30 – 35kAbout a third of the 35-40k
Scenario different for 40-50k and 50-60k ranges 25-40k to absorb larger dwt NB’s?

14
Sector Issues/Concerns2009+ Impact of “Export“ Refinery Expansion (AG & India)Atlantic Basin any incremental growth much longer-haulPacific Basin benchmark route is Spore/Japan growth – incremental growth in distance not that large, growth in demand to come from China imports
Increased deliveries of Pmx and Afra coated vessels to provide competition
15
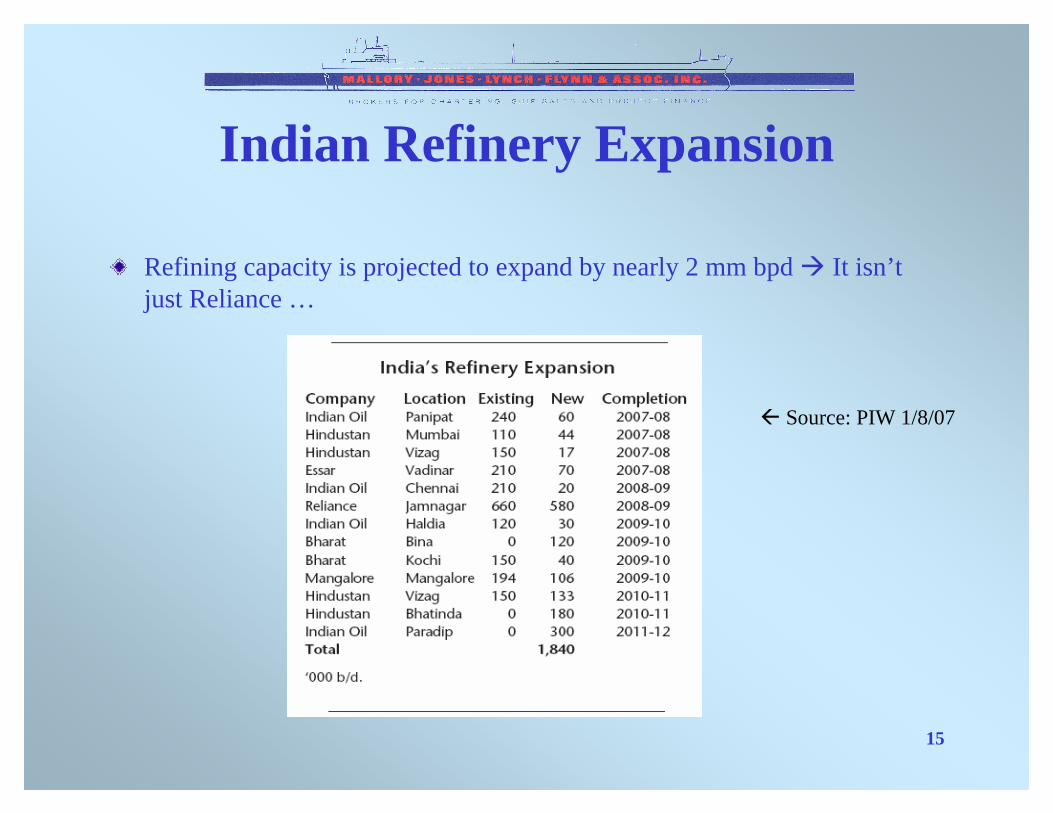
Indian Refinery Expansion
Refining capacity is projected to expand by nearly 2 mm bpd It isn’t just Reliance …
Source: PIW 1/8/07

16
Coated Pmx/Afra Sectors
Note: Coated aframax on order are approaching the number that are over 10 years of age – primary competition from Pmx – degree to be determined by logistics – storage, port issues, cargo stems etc..

17
Tanker Sector OutlookMR – Near-Term
Influx of new tonnage remains a concern – 2007 is the middle year of a 3yr period that will deliver nearly 450 vessels in the key 35 to 55k range – this will need to be balanced by:
The new IMO regs concerning vegoils provide the potential to exert counteracting pressuresPreliminary information is anecdotal, but experiencing 25% - 50% increase in voyage charter rates -- Indo/Rotterdam ($26k to $32k Dec to Jan) and Argentina/China (low $40’s/MT to $62.50/MT December to January change)Growth in demand thru increased actual growth, import growth, logistic inefficiencies such as contango pricing or other bottlenecks …New Spec changes for motor diesel in the U.S impacting logistical efficiency. …
U.S. spec changes that reduce sulfur content limits from 500 ppm to 15 ppm – as the concern has arisen from pipeline contamination as it will from last cargo increasing cleaning issues – reducing effective supplyRegarding the new IMO regs they will/have begun to recreate the vegoil fleet
Has consisted of oldest element of MR fleet – in 2004 was 150+ vessels mostly 30-45k dwt vessels -- 85% of which were old product carriers – avg vessel built 1981 – the age of these vessel will average 26 when new rules are implemented (only 8 blt after 1990)
Preliminary information relating to OPEC cutbacks indicate that inventories in the OECD have dropped significantly providing the potential for upside to rates due to U.S. driving season and Q 4 seasonal increase in global demand
18
Tanker Sector OutlookMR – Beyond Near-Term
The outcome for this sector will be the result of counteracting drivers –increased demand vs. increased supply
Increased demand coming from export oriented refineries being built near crude sources in AG & India – 5+ mm bpd capacity targeted for completion by decades end in these regions
The orderbook is large and this issue is often raised by pundits, but what isn’t discussed is…
It will take over 3 vessels carrying product from an AG or Indian refinery to equate to 1 vessel from a Caribbean refinery in providing imports to the USAC
Tempering supply growth is the fact that a large percentage of fleet will be impacted by IMO mandated phase-outs
Basis Product Carriers, IMO 3 and uncoated vessels – there were approx 1,340 vessels as of Jan’06 and we project 1,450+ as of Jan. ’07 --- 10 to 60k dwtAbout 450 or about 31% of Jan. ’07 fleet is S/H and about 150 or about 10% are D/B or D/S – more than 4 in 10 will therefore face IMO phase-out issues (but 40% of the approx 450 S/H vessels are sub 30k).
For 30-60k about 160 or 10% S/H and 110 are D/B or D/S – 25% Non-D/DExcluding the non-coated vessels the total vessels will fall to about 1,175 and the pcts to 18%/11% or 3 in 10 of the MR fleet (covering 10-60k fleet).

19
Top Related