


Languages
Pages
Legal

Morphing Banner Advertising by
Glen L. Urban
Guilherme Liberali
Erin MacDonald
Robert Bordley
and
John R. Hauser
April 2012
Glen L. Urban is the David Austin Professor of Marketing, MIT Sloan School of Management, Massachusetts Institute of Technology, E52-536, 77 Massachusetts Avenue, Cambridge, MA 02139. 617 253-6615, [email protected]. Guilherme (Gui) Liberali is a Visiting Scholar at MIT Sloan School of Management, and Assis-tant Professor of Marketing, Erasmus School of Economics, Erasmus University Rotterdam, 3000 DR Rotterdam, The Netherlands, [email protected]. Erin MacDonald is an Assistant Professor and Mack 2050 Challenge Scholar, Department of Mechanical Engineering, 2020 Black Engineering Building, Iowa State University, Ames, Iowa, 50011, [email protected]. Robert Bordley is Fellow at Booz-Allen-Hamilton, 101 W Big Beaver Rd # 505 Troy, MI 48084-5353 (formerly Technical Fellow at General Motors Research), [email protected]. John R. Hauser is the Kirin Professor of Marketing, MIT Sloan School of Management, Massa-chusetts Institute of Technology, E52-538, 77 Massachusetts Avenue, Cambridge, MA 02139, (617) 253-6615, [email protected]. This research was supported by the MIT Sloan School of Management, the Center for Digital Business at MIT (ebusiness.mit.edu), GM, WPP/Kantar, Google, CNET.com. We gratefully ac-knowledge the contributions of our industrial collaborators, research assistants, and faculty col-leagues: Dorothee Bergin, Angela Chow, Tousanna Durgan, Shirley S. Fung, Will Hansen, Patri-cia Hawkins, Douglas Hwang, Tom Kelley, Jong-Moon Kim, Clarence Lee, Jimmy Li, Cordelia Link, Ladan Nafissi, Andy Norton, Jonathon Owen, George Pappachen, Chris Perciballi, Joyce Salisbury, Linda Tan, David Vanderveer, and Kevin Wang.
Morphing Banner Advertising
Abstract
Morphing enables a website to learn (actively and near optimally) which banner adver-
tisements to serve to each cognitive-style segment in order to maximize outcome measures such
as click-through, brand consideration, or purchase. Consumer segments are identified automati-
cally from consumers’ clickstream choices. Morphing works best on high-traffic websites with
tens of thousands of visitors because large samples are necessary to reach steady state optimally.
This paper describes the first large-sample random-assignment field test of banner
morphing – over 100,000 consumers viewing over 450,000 banners on CNET.com. (Previously
published morphing evaluations evaluated morphing website characteristics and were based on
predictive simulations using only priming-study data.) On relevant webpages, CNET’s click-
through rates almost double relative to control banners. We supplement the CNET field test with
a focused experiment on an automotive information-and-recommendation website. The focused
experiment replaces automated learning with a longitudinal design which tests the premise of
morph-to-segment matching. Banners matched to cognitive styles, as well as the stage of the
consumer’s buying process and body-type preference, significantly increase click-through rates,
brand consideration, and purchase likelihood relative to a control.
Keywords: On-line advertising, banner advertising, behavioral targeting, website morphing,
cognitive styles, field experiments, electronic marketing, dynamic programming,
bandit problems, optimization of marketing.
Morphing Banner Advertising
1
1. Introduction
This paper describes the first random-assignment field test of morphing with a sample
size sufficient to observe steady-state behavior (116,168 unique CNET consumers receiving
451,524 banner advertisements). A banner advertisement morphs when it changes dynamically
to match cognitive-style segments which, in turn, are inferred from consumers’ clickstream
choices. The website automatically determines the best “morph” for a segment by solving a dy-
namic program that balances exploration (trying new “morphs” to learn their effectiveness) and
exploitation (using advertisements based on current expected outcomes). Advertising morphing
modifies methods used in website morphing (Hauser, Urban, Liberali and Braun [HULB], 2009),
which changes the look and feel of a website based on inferred cognitive styles. In HULB, cogni-
tive-style segments varied on inferred styles such as impulsive vs. deliberative and analyt-
ic/visual vs. holistic/verbal.
HULB projected a 20% improvement in sales for BT Group’s broadband-sales website,
but their projections were based on simulated consumers who behaved according to clickstream
preferences and morph x segment probabilities estimated in a priming study. HULB did not have
the resources to obtain sufficient in vivo sample to field-test website morphing.1
Large test samples are necessary in vivo because online morphing is designed for high-
traffic websites with tens of thousands of consumers visiting. High traffic websites value sales
from the 𝑛 + 1𝑠𝑡 consumer almost as much as sales from the 𝑛𝑡ℎ customer, hence the optimal so-
(By in vivo we
refer to websites visited by consumers for information search or purchasing. By in vitro we refer
to experiments in which we gather information from a panel of consumers. In vitro experiments
attempt to mimic in vivo field experiments, but never perfectly.)
1 Hauser, Urban and Liberali (2012) report a field test of website-morphing, but with a small sample. Their results are suggestive but not significant. The morphing algorithm may not have reached steady-state on their sample.
Morphing Banner Advertising
2
lution to the dynamic program often includes exploration well past the thousandth consumer per
segment. (Technically, the need for so many observations is driven by the relative value of sales
from 𝑛 + 1𝑠𝑡 customer as compared to sales to the 𝑛𝑡ℎ customer.) With sixteen consumer seg-
ments, HULB estimated a need for 40,000 consumers to realize substantial gains from morphing
(HULB, Figure 3, p. 209).
This first field test of banner morphing is promising. We observe an 83-97% lift in click-
through rates between test and control cells when banners appear on websites that are highly re-
levant to consumers. This is substantially more than simply placing banners on relevant webpag-
es as in behavioral-context targeting.
Click-through rates are an industry standard often used to judge banner effectiveness, but
some managers also seek brand consideration and purchase likelihood. To examine these depen-
dent measures, we supplement the large-sample field test with a smaller-sample random-
assignment in vitro test of banner-to-segment matching on an automotive information-and-
review website. We match banners to consumer segments defined by cognitive styles as well as
buying-process stages and body-type preference. We avoid the need for extremely large samples
with three longitudinal surveys in which the first two surveys measure advertising preference,
cognitive styles, and stage of buying process. In a third survey, separated from the pre-measures
by four and one-half (4½) weeks, consumers see banner advertising while searching for informa-
tion on automobiles and trucks. The sample (588 consumers) is sufficient because we substitute
direct measurement for Bayesian inference of segments and for optimal assignment by a dynam-
ic program. In vitro measurement enables us to examine the fundamental premise that morph-to-
segment matching improves brand consideration and purchase likelihood.
Morphing Banner Advertising
3
2. Banner Advertising – Current Practice
A banner advertisement is a paid advertisement that appears on a webpage. In the last ten
years online advertising revenue has tripled. Banner advertisements account for 24% of online
advertising revenue – about $6.2 billion in 2010. Banner advertisements cost roughly $10 per
thousand impressions. Click-through rates are low and falling from 0.005 click-throughs per im-
pression in 2001 to 0.001 in 2010 (PricewaterhouseCoopers 2011, Dahlen 2001). Conversion af-
ter click-through varies from 1% to 30% with an average of 2 to 4% (Nielsen 2008; Peterson
2009). As a result managerial interest is high for methods that improve banner effectiveness.
Current theory and practice attempts to increase click-through rates with a variety of me-
thods. The simplest method uses experiments on a training sample to find the best combination
of banner features. For example, Sundar and Kalyanaraman (2004) use laboratory methods to
examine the effect of the speed and order of animation. Gatarski (2002) uses a genetic algorithm
to search 40 binary features to achieve a 66% lift above a 1% click-through rate based on sixteen
“generations” seeing approximately 200,000 impressions.
Iyer, Soberman and Villas-Boas (2005) and Kenny and Marshall (2000) suggest that
click-through rates should improve when banners appear on webpages deemed to be relevant to
consumers. Early attempts matched textual context, e.g., “divorce” in a banner to “divorce” on
the webpage, but often had trouble distinguishing context, e.g., placing a banner for a divorce
lawyer on a gossip account of Christina Aguilera’s divorce (Joshi, Bagherjaeiran and Ratnapark-
ni 2011). Context matching improved when demographics and click logs were used to match re-
levant [banner] characteristics to consumers demographics, geographic location, and prior con-
sumption. In a related application to Yahoo!’s news articles rather than banners, Chu, et al.
(2009) use to increase click-through rates dramatically. Such context targeting is quite common.
Morphing Banner Advertising
4
For example, General Motors pays Kelly Blue Book to show a banner advertisement for the
Chevrolet Sonic when a consumer clicks on the compact-car category.
Relevance can also be based on past behavior. “Behavioral targeting leverages historical
user behavior to select the most relevant ads to display (Chan, Pavlov and Canny 2009, p. 209).”
These researchers use cookie-based observation of 150,000 prior banners, webpages, and queries
to identify which consumers are most likely to respond to banners. They report expected lifts of
approximately 26%.
Finally, laboratory experiments manipulate consumers’ goals (surfing the web vs. seeking
information) to demonstrate that banner characteristics such as size and animation are more or
less effective depending upon consumers’ goals (Li and Bukovac 1999; Stanaland and Tan
2010). This web-based research is related to classic advertising research that suggests advertising
quality and endorser expertise (likability) are more or less effective depending upon relevance
(involvement) for consumers (e.g., Chaiken 1980; Petty, Cacioppo and Schumann 1983).
Morphing differs from prior research in many ways. First, matching is based on cognitive
styles rather than context relevance or past behavior. Second, cognitive-style segments are in-
ferred automatically from the clickstream rather than manipulated (as in surfer vs. seeker re-
search). Third, morphing learns (near) optimally by trading off exploration versus exploitation to
identify automatically morph-to-segment matches. Banner morphing is a complement to context
or behavioral targeting. For example, morphing to match cognitive-style might be more effective
on webpages that are relevant to consumers.
3. Brief Review of Banner Morphing
The fundamental behavioral premise of banner morphing is that a banner advertisement is
more effective when it is customized for a cognitive-style segment. Given this premise, an online
Morphing Banner Advertising
5
morphing system must accomplish two tasks to succeed. First, we must assign a consumer to a
segment based on observing the consumer’s clickstream. Second, we must learn the best ban-
ner(s) to assign to each consumer segment. We describe briefly how HULB’s morphing algo-
rithms accomplish these tasks. Readers familiar with HULB may wish to skip to §4.
3.1. Assigning Consumers to Segments based on Clickstream Data
We identify segments with a small-sample priming study. For example, HULB asked 835
broadband consumers to complete a survey in which they answered 13 questions about their
cognitive styles, questions such as “I prefer to read text rather than listen to a lecture.” HULB
factor analyzed answers to the questions to identify four ipsative cognitive-style dimensions,.
Median splits on the cognitive dimensions identified sixteen (2x2x2x2) cognitive-style segments.
By observing clicks as consumers explore the priming website, we develop a model that
enables us to assign consumers to segments based on the clicks that consumers choose. For ex-
ample, when faced with multiple click choices, we might observe that analytic/visual consumers
are more likely than consumers in other segments to choose a tool that enables them to compare
broadband plans. When this is true it is natural to use Bayesian methods to infer the probability
that a consumer is analytic/visual when the consumer chooses that tool.
Following HULB, let 𝑟 index consumer segments, 𝑚 index alternative banner advertise-
ments (“morphs”), 𝑛 index consumers, 𝑡 index clicks, and 𝑗 index the various places on a web-
page where a consumer might click (called click alternatives). Let 𝑟𝑛 be consumer 𝑛’s segment
and 𝑐𝑛𝑡𝑗 = 1 indicate that consumer 𝑛 chose click alternative 𝑗 on the 𝑡𝑡ℎ click. Let 𝑐𝑛𝑇 be con-
sumer 𝑛’s clicks up to and including the 𝑇𝑡ℎ click. We decompose each click alternative into a
vector of characteristics, �⃗�𝑗𝑡𝑛. Click characteristics can be dummy variables for areas of website
(such as a comparison tool), expectations (click is expected to lead to graphics), or other descrip-
Morphing Banner Advertising
6
tions. We observe clicks, click characteristics, and consumers’ segments in a priming study and
use the priming-study data to estimate click-characteristic preferences, 𝜔��⃗ 𝑟, for each segment (lo-
git likelihood, details in HULB, p. 211). The estimated preferences enable us to assign a utility,
�⃗�𝑗𝑡𝑛′ 𝜔��⃗ 𝑟, to each click alternative and to form the likelihood of observing 𝑐𝑛𝑇. With this likelih-
ood, Pr(𝑐𝑛𝑡|𝑟𝑛 = 𝑟), prior beliefs, Pr0(𝑟𝑛 = 𝑟), and Bayes’ Theorem, we estimate the probabili-
ty, Pr(𝑟𝑛 = 𝑟|𝑐𝑛𝑡), that consumer 𝑛 belongs to segment 𝑟. We summarize the mathematical de-
tails and all notation in Appendix 1.
HULB fix the time to morph, 𝑡𝑜, exogenously. For website morphing they set 𝑡𝑜 = 10
clicks. We follow their strategy of a fixed time to morph. More complex algorithms have been
proposed to determine the optimal time to morph (Hauser, Urban and Liberali 2012), but these
algorithms were not available at the time of our experiments. Thus our experiments are conserva-
tive because morphing would likely do even better with improved algorithms.
3.2. Learning the Best Banner Advertisement for a Consumer Segment
Let 𝑝𝑟𝑚 be the probability of a good outcome (a sale, brand consideration, or a click-
through) given a consumer in segment 𝑟 experienced morph 𝑚 for all clicks after 𝑡𝑜. One subop-
timal method to estimate 𝑝𝑟𝑚would be to assign morphs randomly to a large number, 𝑁𝑙𝑎𝑟𝑔𝑒, of
consumers and observe outcomes. This strategy, similar to that used by Google’s web optimizer
and many behavioral or context targeting algorithms, is sub-optimal during the calibration period
because 𝑁𝑙𝑎𝑟𝑔𝑒 consumers experience morphs that may not lead to the best outcomes. A larger
𝑁𝑙𝑎𝑟𝑔𝑒, perhaps because the application requires that the 𝑝𝑟𝑚 be estimated with greater precision,
would mean even more consumers need to be given suboptimal banners.
We minimize opportunity loss during the calibration period by solving a dynamic pro-
gram that balances the opportunity loss incurred while exploring new morph-to-segment assign-
Morphing Banner Advertising
7
ments with the knowledge gained about the 𝑝𝑟𝑚’s. This knowledge enables us to assign morphs
more effectively to future consumers. To solve the dynamic program we parameterize the distri-
butions that summarize our uncertainty about the 𝑝𝑟𝑚’s and use observed outcomes to update the
posterior distributions. (The updating equations are in Appendix 1).
When we know a consumer’s segment, the solution to the dynamic program has a simple
form. Compute an index independently for each segment x morph combination. Call this index
the Gittins’ index, 𝐺𝑟𝑚𝑛. For the 𝑛𝑡ℎ consumer (in segment 𝑟), assign the morph, 𝑚∗, which has
the largest index. The important and surprising result is that this simple strategy is the optimal
solution to the dynamic program (Gittins 1979).
When we infer the consumer’s segment, we use the expected value of Gittins’ index,
𝐸𝐺𝑚𝑛 = ∑ Pr(𝑟𝑛 = 𝑟 | 𝑐𝑛𝑡)𝐺𝑟𝑚𝑛𝑟 to choose the best morph. The expected-Gittins’-index solu-
tion is not optimal, but it is extremely close to optimal (Krishnamurthy and Mickova 1999). Be-
cause 𝐺𝑟𝑚𝑛 → 𝑝𝑟𝑚 as 𝑛 → ∞, Gittins’ index converges to the true segment x morph probabili-
ties. The key difference between the expected-Gittins’-index strategy and the naïve calibration-
sample strategy (𝑁𝑙𝑎𝑟𝑔𝑒) is that the expected Gittins’ strategy (1) learns while minimizing oppor-
tunity loss, (2) continues to learn as 𝑛 gets large, and (3) can adapt when 𝑝𝑟𝑚 changes due to un-
observed shocks such as changes in tastes, new product introductions, or competitive actions.
Recalibration is automatic and optimal.
4. CNET Field Experiment
4.1. Smart Phone Banners on CNET.com
CNET.com is a high-volume website that provides news and reviews for high-tech prod-
ucts such as smart phones, computers, televisions, and digital cameras (about 4,300 annual re-
views). It has 8 million visitors per day and has a total market valuation of $1.8 billion (Barr
Morphing Banner Advertising
8
2008). Banner advertising plays a major role in CNET’s business model. Targeted banners de-
mand premium prices. For example, a computer manufacturer might purchase banner impres-
sions on web pages that provide laptop reviews. Non-targeted banners are priced lower and
placed on less-valuable web pages. Morphing provides an improved method by which CNET can
automate and optimize morph-to-segment targeting to provide higher value to its customers.
CNET accepted our proposal to compare the performance of morphing versus a control on their
website. They were also interested in any complementarities with behavioral or context targeting.
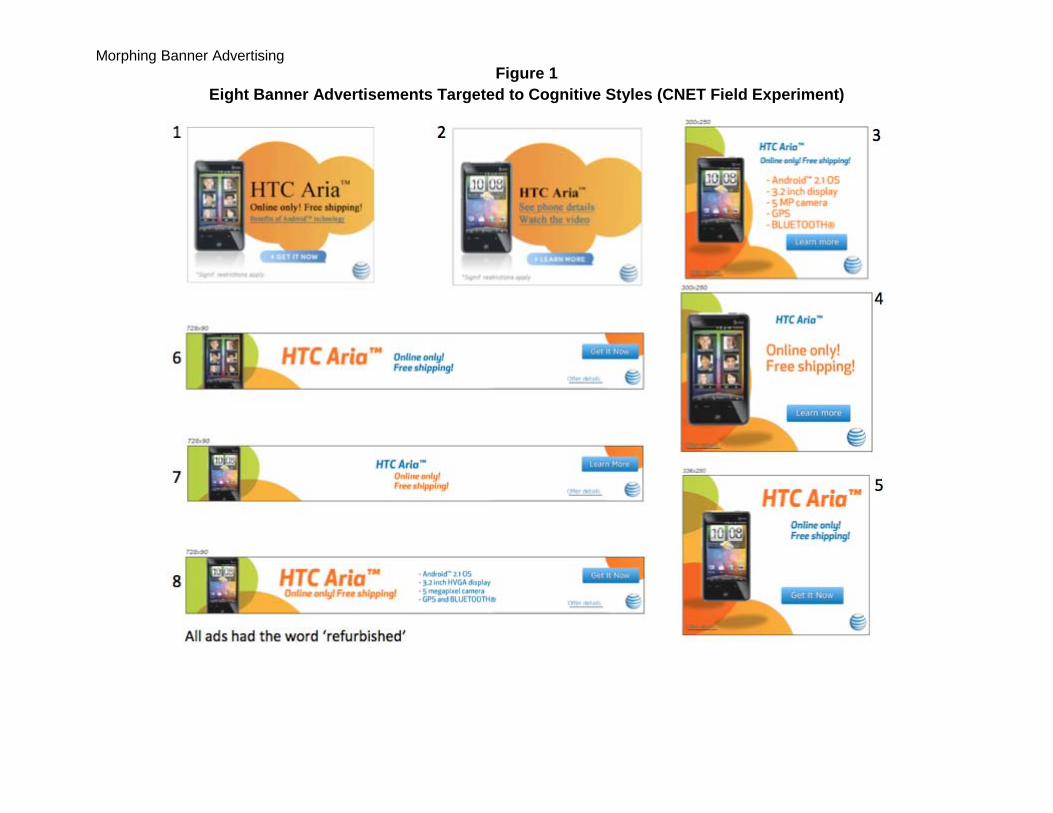
The banner context was AT&T smart phones. Consumers visiting CNET.com were as-
signed randomly to test and control cells. To assure sufficient sample for the morphing algorithm
to converge, we assigned 70% of the consumers to the test cell. CNET’s agency developed a
pool of eight AT&T banner advertisements about HTC refurbished smart phones. (AT&T was
out of stock on new HTC smart phones; AT&T followed industry practice to focus on refur-
bished smart phones when new phones were out of stock.) Industry experience suggests lower
click-through rates for refurbished products, but the decrease should affect the test and control
cells equally.
We tested eight potential banners which varied on characteristics likely to appeal diffe-
rentially to consumers with different cognitive styles. In the control cell, the banners were as-
signed randomly. In the test cell, the morphing algorithm inferred each consumer’s cognitive
style and learned the best banner for each cognitive-style segment. Figure 1 provides the banners.
4.2. Cognitive Styles and Banner Characteristics
We first identified a candidate set of scale items from the literature (HULB and refer-
ences therein; Novak and Hoffman 2009). Using the Greenfield Online panel, we asked 199 con-
sumers to rate themselves on these scales. Factor analysis and scale purification identified eleven
items likely to categorize CNET consumers. (Detailed scales and pre-study analyses are availa-
Morphing Banner Advertising
9
ble from the authors.)
We next invited 1,292 CNET users to complete a short questionnaire using the eleven pu-
rified scale items. We factor analyzed these items to identify three factors which we labeled im-
pulsive vs. deliberative, analytic vs. holistic, and instinctual vs. not. See Appendix 2. Following
standard procedures (e.g., Churchill 1979), we re-purified these scales resulting in three multi-
item ipsative cognitive-style dimensions with reliabilities of 0.75, 0.66, and 0.57, respectively.
CNET felt they could target most effectively consumer segments that varied on the two most-
reliable cognitive-style dimensions. Following HULB’s methods, the morphing algorithm used
four cognitive-style segments defined by median splits (2x2: impulsive vs. deliberative x analytic
vs. holistic).
CNET’s agency developed the eight banners, seven of which were targeted to cognitive
styles. Because morphing automates morph-to-segment matching, the banner designers did not
have to make the match themselves; they just had to assure sufficient variation among the ban-
ners. (The eighth banner, which did not end up best for any segment, was unconstrained by cog-
nitive styles.) The banners varied on action-links (“learn more” vs. “get it now”) and level of de-
tail provided (list of features vs. links to video, etc.). CNET designers also varied the banners on
characteristics they judged might appeal to different cognitive styles: font size, font color, back-
ground color, location, and shape. See Figure 1. CNET believed the eight banners had sufficient
variation in potential appeal, sufficient for the morphing algorithm to find the best banner(s) for
each consumer segment.
[Insert Figure 1 about here.]
4.3. Segment-Specific Click Preferences and Estimation of Segment-Membership
We decompose every click alternative into a vector of 22 click characteristics including
Morphing Banner Advertising
10
dummy variables for areas on the homepage (carousal, navigation bar, promotion bar, more sto-
ries, popular topics, etc.), areas on other pages (product-specific reviews, CNET says, inside
CNET, etc.), usage patterns (search category, social influences, tech-savvy news, etc.), and inde-
pendent judges’ evaluations of expected click outcomes (pictures, graphs, data, etc.). We esti-
mate segment-specific click-characteristic preferences, 𝜔��⃗ 𝑟, during the same priming study used
to identify the segments (1,292 CNET users). The preference weights enable us to write the like-
lihood, Pr(𝑐𝑛𝑡|𝑟𝑛 = 𝑟), for each consumer’s clicks on the CNET website. Coupled with prior be-
liefs about segment membership, this likelihood is sufficient to compute the posterior probabili-
ty, Pr(𝑟𝑛 = 𝑟|𝑐𝑛𝑡), that consumer 𝑛 belongs to segment 𝑟. Details of the estimation of the 𝜔��⃗ 𝑟 fol-
low HULB. Parameter values are given in Appendix 3.
To address the fact that consumers make repeated visits to CNET, we define consumers
as active or not active. An active consumer must make at least five clicks on tracked areas of the
website. We use cookies so that updating continues through multiple visits when necessary. Five
clicks give us sufficient observations to morph (𝑡0 = 5). In the control we track clicks but only to
determine whether a consumer is active. Before becoming active, consumers are not shown any
banners (neither in test nor control). After becoming active, test consumers see a banner selected
by the morphing algorithm and control consumers see a randomly chosen banner.
4.4. Modifications to Handle Multiple Sessions
For website morphing HULB did not track repeat sessions, but for banner morphing re-
peat sessions are common (as tracked with cookies). The same banner might be shown in many
sessions. CNET (and AT&T) consider the banner a success if the consumer clicks through in at
least one session. We adopt that definition of success. To account for interrelated sessions, we
use a strategy of temporary updates and potential reversals.
Morphing Banner Advertising
11
This is best illustrated with a three-session example. Suppose that a consumer sees the
same banner in three sessions and clicks through in the second session. A naïve application of
HULB would make three updates to the parameters of the posterior distributions for the success
probabilities, 𝑝𝑟𝑚. The updates would be based erroneously on observations of failure, success,
failure. Instead, using CNET’s success criterion, the correct posterior should be computed after
the third session based on one success because the banners achieved their collective goal of at
least one consumer click-through. Furthermore, until we reach the third session, updates should
represent all information collected to that point. To achieve these goals we use the following up-
dating strategy. After the first session (no click through), we update the posterior distribution
based on a failure – this is the best information we have at the time. After the second session
(click through), we reverse the failure update and update as if success. On the third session (no
click through), we do nothing because the update already reflects a success on CNET’s criterion.
The mathematical formulae are given in Appendix 1.
Finally, the morphing algorithm requires that we set priors for the segment x morph
click-through probabilities. HULB suggest that weakly-informative priors suffice. Our priors are
equal for all morphs and set to the historic click-through probability for banners for refurbished
smart phones. So that the priors are weakly informative, parameters of the prior distribution are
selected based on an effective sample size of forty consumers – small compared to the antic-
ipated number of CNET consumers.
4.5. Results of the CNET Field Experiment
CNET placed banners on their website for all active consumers in the test and control
cells during April 11, 2011 to May 13, 2011. Naturally, there were other banners placed on
CNET during the 31-day test period, but these banners were placed randomly between test and
Morphing Banner Advertising
12
control. Both we and CNET went to great lengths to ensure there were no systematic effects of
these banners or interactions with AT&T HTC advertising. Sampling appeared random – we de-
tected no systematic differences in the placement of control banners across estimated cognitive-
style segments (𝜒302 = 15.9,𝑝 = 0.98).
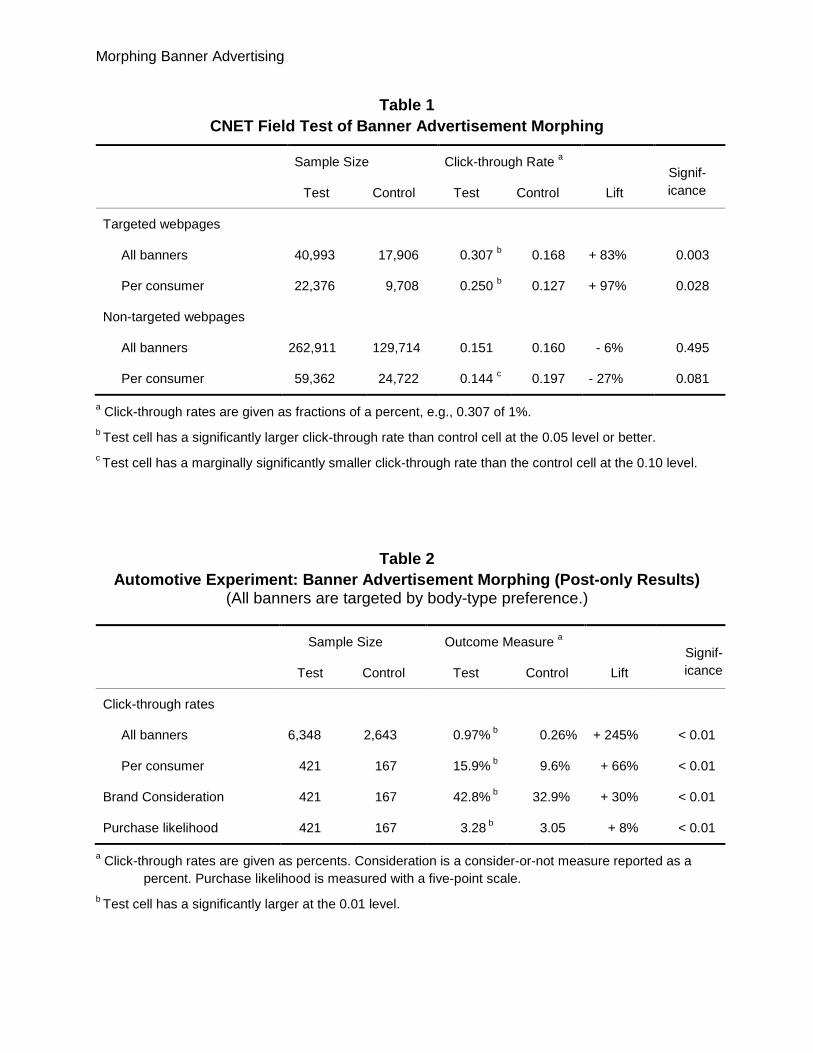
Table 1 summarizes the field-test results. Overall, 116,168 consumers saw 451,524 ban-
ners. Some banners were placed on pages where any smart phone was rated, compared, priced,
discussed, or pictured. Specifically, 32,084 consumers (27.4%) saw 58,899 targeted banners
(13.0%). Morphing really shines when combined with such context targeting. Morphing achieves
significant and substantial improvements for banners (𝑡 = 3.0,𝑝 = 0.003) and for consumers
(𝑡 = 2.2,𝑝 = 0.028). In both cases, click-through rates almost doubled (83% and 97% lifts, re-
spectively). To put this in vivo impact in perspective, targeting alone in the control cell did not
achieve a significant lift for either banners (𝑡 = 0.3,𝑝 = 0.803) or consumers (𝑡 = 1.4,𝑝 =
0.167).
[Insert Table 1 about here.]
Table 1 also cautions that gains to morphing are not universal. There was no significant
lift for banners or consumers when the banners were not on targeted webpages (𝑡 = 0.5,𝑝 =
0.495 and 𝑡 = 1.74,𝑝 = 0.081, respectively). Significant gains were realized only when morph-
ing was combined with targeting: interactions were significant for banners (𝜒2 = 161.8,𝑝 <
0.01) and for consumers (𝜒2 = 8.2, 𝑝 = 0.017). Although there is drop among non-targeted
banners, that drop is marginally significant at best. Morphing clearly interacts with targeting – an
interaction worth further investigation with future in vitro experiments.
This interaction should not surprise us; we expect cognitive-style morphing to be more
effective when the banner advertisements are targeted to webpages that are relevant to consum-
Morphing Banner Advertising
13
ers’ purchasing situations. Interactions of quality and source with relevance (involvement) have a
long history in advertising research (Chaiken 1980,; Petty, Cacioppo and Schumann 1983) and
are consistent with current prescriptive theories of targeting (Iyer, Soberman and Villas-Boas
2005; Kenny and Marshall 2000). To the extent that matching banners to cognitive styles facili-
tates preference learning, observed interactions between targeting and preference learning might
be enhanced by morphing (Lambrecht and Tucker 2011).
The success of targeted cognitive-style morphing raises an interesting hypothesis. Banner
morphing might have had an even larger lift if we had allowed the optimal morph to vary be-
tween targeted and non- targeted webpages. This hypothesis foreshadows our automotive expe-
riment where we define segments by cognitive styles and buying stage and where we target all
consumers by body-type preference.
5. Automotive Experiment to Test Matching Morphs to Segments
Because managers might be interested in metrics other than click-through rates, we sup-
plement the CNET field experiment with an in vitro automotive experiment. (Organizational dif-
ferences between CNET and AT&T, and proprietary concerns, made it impossible to track click-
through rates back to sales of AT&T telephones.) In a focused automotive experiment we ab-
stract from the mechanics of banner morphing (Gittins’ learning) to test whether morph-to-
segment matching increases brand consideration and purchase likelihood as well as click-through
rates. This focused experiment enables us to test the fundamental behavioral hypothesis motivat-
ing banner morphing; an hypothesis that banner advertisements are more effective when targeted
to consumer segments that vary on cognitive styles and, perhaps, other characteristics such as
buying stage or body-type preferences.
Brand consideration and purchase likelihood are more-intrusive measures than click-
Morphing Banner Advertising
14
through rates. To obtain these measures we invited consumers to complete questionnaires before
and after searching for information on an automotive information-and-review website. Because a
sample size of tens of thousands is not feasible with this design, we use longitudinal methods to
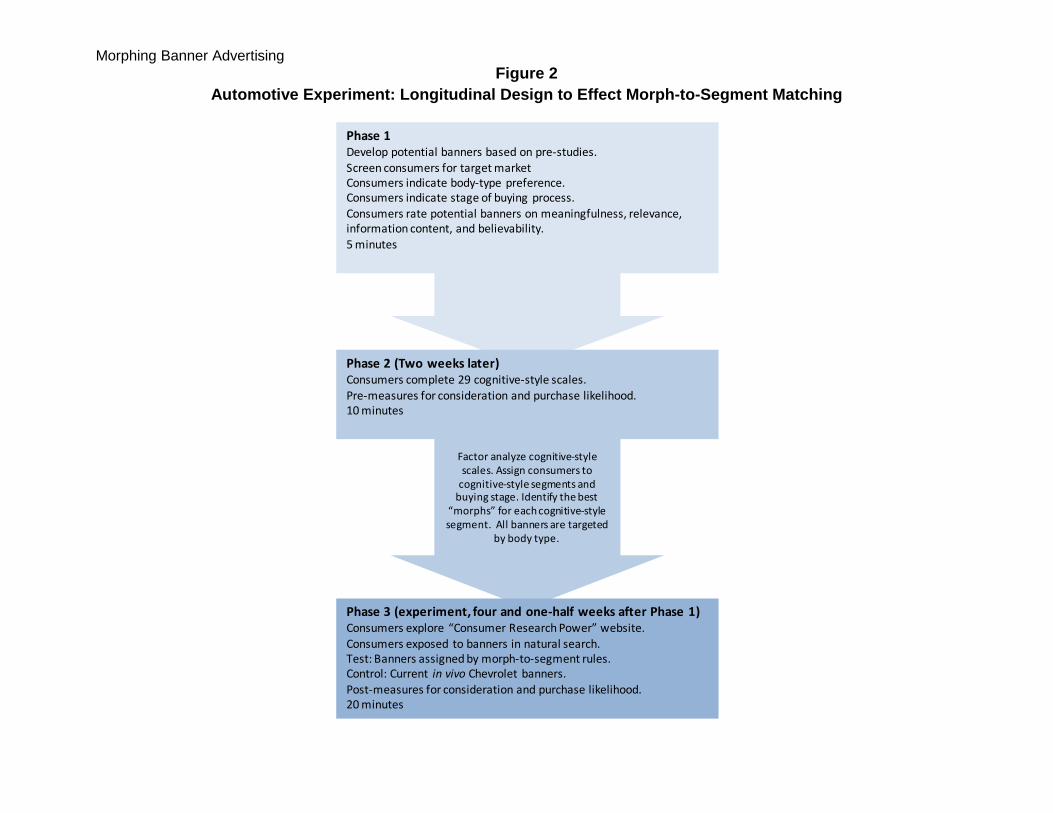
effect matching. See Figure 2. In Phase 1, consumers rate all test and control advertisements for
their buying-stage and preferred body-type. Two weeks later in Phase 2, consumers answer a se-
ries of scales that enable us to assign consumers to cognitive-style segments. In Phase 2 we also
obtain pre-measures of brand consideration and purchase likelihood. Phases 1 and 2 replace the
morphing algorithm with in vitro measurement. These phases enable us to assign each consumer
to a segment and to identify the best banners for each segment. The experiment occurs two and
one-half weeks later in Phase 3 (4½ weeks after rating banners), when consumers see banners
while exploring an automotive information-and-review website. In the test cell banners are
matched to cognitive styles (plus buying stage and body-type preference) while in the control
cell banners are matched only to body-type preference. (Note that this experiment also extends
the definition of consumer segment to include buying stage.)
[Insert Figure 2 about here.]
The experimental design, its implications, and potential threats to validity are best un-
derstood and evaluated within context. Thus, before we describe the Phase 3 experiment, we first
describe the website, the automotive consumer segments, and the test and control banner adver-
tisements.
5.1. Automotive Banners on an Information-and-Recommendation Website
Information and recommendation websites such as Edmunds’, Kelley Blue Book,
Cars.com, and AutoTrader, play a major role in automotive purchasing. For example, Urban and
Hauser (2004) estimate that at least 62% of automotive buyers search online before buying a car
Morphing Banner Advertising
15
or truck. Giffin and Richards (2011) estimate that 71% of automotive buyers search online and
that online search was more influential in purchase decisions than referrals from family or
friends, newspapers, and other media sources. Because information-and-recommendation web-
sites attract potential purchasers, automotive manufacturers invest heavily in banner advertising
on these websites. The importance of such expenditures motivated General Motors to test morph-
to-segment-matching of banner advertising for their Chevrolet brand. General Motors’ mana-
gerial motivation matched our scientific desire to test the premise of morph-to-segment match-
ing.
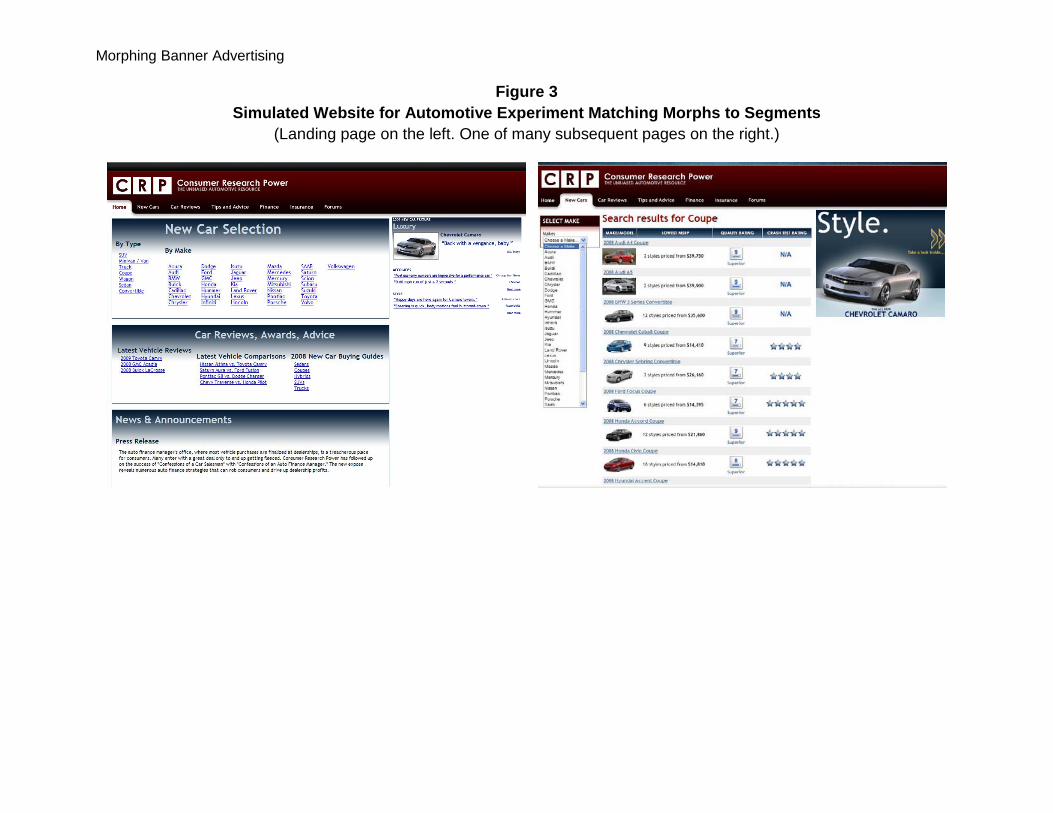
We created a website that simulated consumer experience on information-and-
recommendation websites. Figure 3 illustrates the landing page and an example search page. On
the automotive website consumers could search for information, receive tips and reviews, learn
about insurance, and read reviews just like they would on commercial information-and-
recommendation websites. To mimic best practices all test and control banners were targeted by
consumers’ expressed preferences for one of five body types. Such targeting is typical on com-
mercial websites as on Edmunds.com where body-type preference – coupe, convertible, sedan,
SUV, etc. – is displayed prominently on the landing page. Body-type targeting enhances external
validity but otherwise has no effect on the test-vs.-control comparisons.
[Insert Figure 3 about here.]
5.2. Cognitive Styles and Stage of the Automotive Buying Process
Body-type preference and the automotive buying process stage were measured in Phase
1; cognitive styles were measured in Phase 2. We defined buying-stage segments by: collection,
comparison, or commitment. “Collection” segments included consumers who indicated they
were more than a year away from buying a car or truck, but in the process of collecting informa-
Morphing Banner Advertising
16
tion. “Comparison” segments included consumers less than a year away from buying a car or
truck and who had already gathered information on specific vehicles or visited a dealer. “Com-
mitment” segments included consumers who plan to purchase in the next three months, who
have collected information on specific vehicles, and who have visited a dealer.
To identify cognitive styles we asked consumers to answer twenty-nine scales adapted
from Novak and Hoffman (2009). We factor analyzed their answers to identify three factors. We
labeled the first two factors as rational-vs.-intuitive and impulsive-vs.-deliberative. The third fac-
tor was hard to define. See Appendix 2. Following standard procedures (e.g., Churchill 1979),
we purified the scales resulting in three multi-item cognitive-style dimensions with reliabilities
of 0.87, 0.87, and 0.36, respectively. We selected the first two cognitive dimensions to define
2x2 consumer segments based on mean splits.2,3
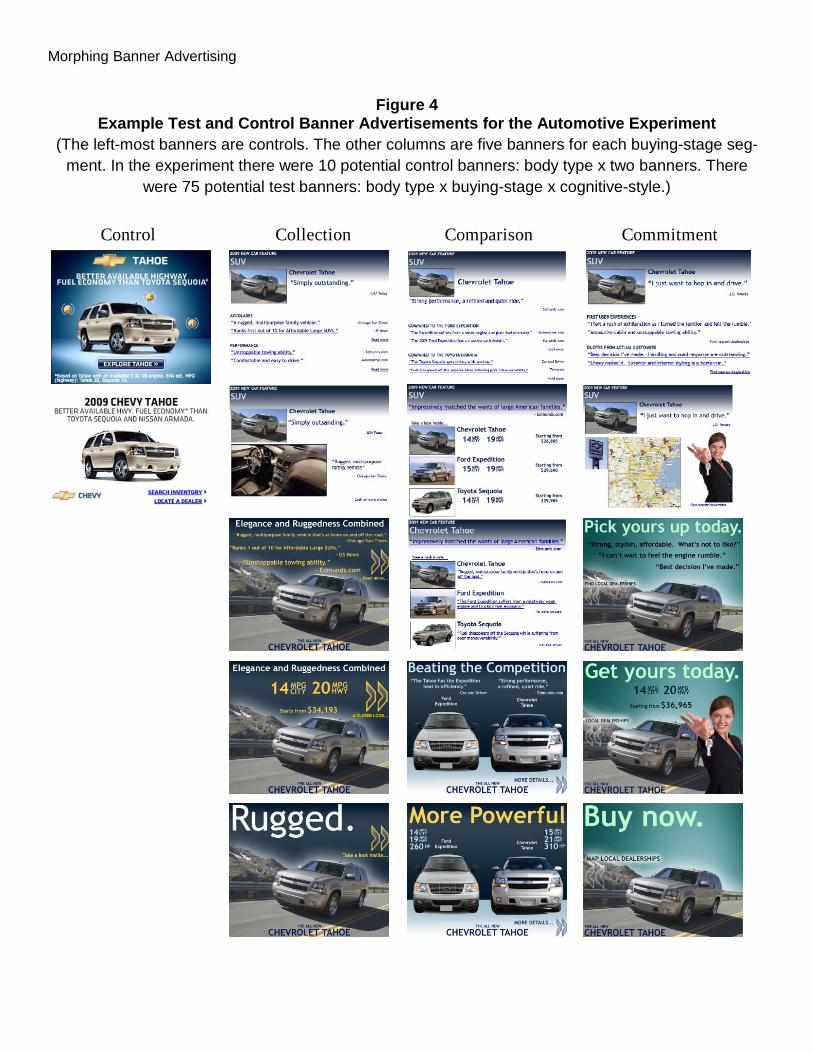
5.3. Test and Control Banner Advertisements
We created test banners that varied on graphics, amount of content, and format to span
the cognitive-style segments for each body type and buying stage. The designers sought to pro-
vide sufficient variation so that we could target the banners to each cognitive-style segment. Col-
lection-targeted banners emphasize information; comparison-targeted banners compare targeted
vehicles to competitors; and commitment-targeted banners stress test drives, finding a dealer, and
purchase details. In total there were 75 test banners: (five designs to appeal to different cognitive
styles) x (three information content designs to appeal to different stages of the buying process) x
(five body types for targeting).
2 Despite differences in the underlying scales, the type of consumer, and the buying context, the cognitive dimen-sions for high-tech consumers and automotive consumers are not dissimilar. For each set of consumers, one dimen-sion is impulsive vs. deliberative. The other dimension is either analytic vs. holistic (high tech) or rational vs. intui-tive (automotive). More experience might identify common dimensions that can be used across applications. 3 In the automotive experiment we used mean-splits rather than median-splits to define segments. There is no reason to believe this will affect the results. Indeed, the two categorizations are quite similar. When we correct for the dif-ferences between median- and mean- splits, we the test group is still significantly better than the control group.
Morphing Banner Advertising
17
There were ten control banners: two banner advertisements for each of five body types.
Control banners did not vary by cognitive style or buying stage. The control banners were the
banners that Chevrolet was using on real information-and-recommendation websites at the time
of the morph-to-segment-matching experiment. Figure 4 shows both control banners and all five
test banners for one body type (two control and fifteen test banners).
[Insert Figure 4 about here.]
This control was most relevant to General Motors’ business decisions, but if we are to use
it as a scientific control we must establish it is a valid control. The literature uses a random selec-
tion of “morphs” as a no-morphing control. If the current banners are better than a random selec-
tion of test banners, then any differences between test and control cells would underestimate the
gain due to morph-to-segment matching. We could then conclude that the improvement due to
matching is at least as large as we measure. However, if current banners are worse than a random
selection of test banners, then we could not rule out that the test banners are, on average, simply
better than the control banners.
We use the Phase 1 banner evaluations to compare potential test and control banners on
meaningfulness, relevance, information content, and believability. Using Phase 1 measures we
create an average score that combines the meaningfulness, relevance, information content, and
believability ratings. The average score for a test banner is 3.36 (out of 5); the average score for a
control banner is 3.70. The combined control banners are significantly larger than a randomiza-
tion of test banners (𝑡 = 10.3,𝑝 < 0.01). Even if we were to use only the two best test banners
for all consumers, the average score is still less than the control score (𝑡 = 2.7,𝑝 < 0.01). We
therefore conclude that the current Chevrolet banners are a sufficient control. If morph-to-
segment matching is superior to the current Chevrolet banners then it is highly likely that morph-
Morphing Banner Advertising
18
to-segment matching will be superior to either a randomly-selected set of test banners or to a
non-matched mix of the two best test banners.
5.4. Experimental Design and Dependent Measures
In Phase 3 consumers were invited to explore an information-and-recommendation web-
site called “Consumer Research Power.” Consumers search naturally as if they were gathering
information for a potential automotive purchase. They do so for a minimum of five minutes.
While consumers searched we recorded click-through on the banners. During this search we
placed banner advertisements for Chevrolet models as they would be placed in a natural setting.
Test consumers received banners that alternated between the best and second-best banner for
their cognitive-style segment where best was defined by the average over consumers in a cogni-
tive-style segment of the Phase 1 measures (meaningfulness, relevance, information content, and
believability). Test banners were also targeted by buying stage. Control consumers received ban-
ners that alternate between the two control Chevrolet banners.4
After consumers complete their search on “Consumer Research Power,” we measure
Chevrolet brand consideration and purchase likelihood. Dependent measures include click-
through rates for banners, click-through rates per consumer, post-measures of brand considera-
tion and purchase likelihood, and the difference in brand consideration and purchase likelihood
between the post-measures (after Phase 3) and the pre-measures (during Phase 2).
All banners, both test and con-
trol, were targeted by body-type preference.
5.5. Potential Threats to Validity
One potential threat to validity is that exposure to banners in Phase 1 might have conta- 4 Control consumers also received a more-general banner on the landing page. This more-general banner mimics in vivo practice. When we include the more-general banner in our analyses, the exposure-weighted rating of all control banners (3.75) remains significantly better than the exposure-weighted rating of the test banners (3.46) reaffirming the control as a valid control (𝑡 = 3.0,𝑝 < 0.01). To be conservative, we do not include clicks from landing-page banners for either the test or control cells.
Morphing Banner Advertising
19
minated the Phase 3 measures. We took steps to minimize this threat. The Phase 1 questionnaire
is relatively short (five minutes) and occurs 4½ weeks before the Phase 3 experiment. In Phase 1
consumers are not allowed to click through on the banners and, hence, do not receive the same
rich information experience as in Phase 3. Instructions were written carefully to disguise the
goals of the later phases – consumers believed the Phase 3 website experience was a test of the
website not an advertising test. We believe that the time delay, the number of banners rated, the
lack of active click-through in Phase 1, and instructions that disguised later phases combine to
limit contamination from Phase 1 to Phase 3.
More importantly, the experimental design minimizes potential false positives that might
be due to contamination. First, Phase 2 is more proximate in time than Phase 3. Contamination, if
any, should be larger in Phase 2 than in Phase 3, making it more difficult to show an effect on
Phase-3-vs.-Phase-2 measures. Second, contamination, if any, would affect test and control cells
equally and have no impact on statistical tests of differences that are invariant with respect to
constant effects.
Another potential threat to validity is that the morph-to-segment test chooses from more
banners than the control. If a consumer saw a greater variety of banners in the test cell, then we
would be concerned about biases due to wear-out in the control cell or biases because of greater
variety in the test cell. All else equal, greater variety in the banners that a consumer actually sees
increases the odds that a banner is the best banner for a consumer. Our design minimizes this
threat because each consumer sees two body-type-targeted banners in the test cell and two body-
type-targeted banners in the control cell.
5.6. Results of the Automotive Experiment Testing the Behavioral Premise of Morphing
We invited 2,292 members of the Gongos Automotive Panel to participate in a multi-
Morphing Banner Advertising
20
phase study of website design. Consumers were screened to be either an equal or sole decision
maker in automotive purchases and plan to purchase a new car or truck in less than three years.
This mimics standard practice. Of these, 1,299 consumers agreed to participate (61% response
rate) and 588 consumers completed Phases 1, 2 and 3 (45.3% completion rate). More consumers
were assigned to the test cell (70%) than the control cell (30%) so that we had sufficiently many
consumers in each consumer segment. All statistical tests take unequal cell sizes into account.
5.7. Test-vs.-Control Analyses (Post Only)
Because the pre-conditions were the same in the test and control cells, we begin with
post-only results. Table 2 reports the post-only comparisons for the morph-to-segment-matching
experiment. As in the CNET field experiment (on targeted webpages), the lift in click-through
rates is significant. The test-vs.-control difference in click-through rates is significant whether we
focus on impressions (245% lift, 𝑡 = 3.3,𝑝 < 0.01) or consumers (66% lift, 𝑡 = 4.4,𝑝 < 0.01).
The automotive experiment enables us to look beyond click-through rates to brand consideration
and purchase likelihood. Both measures increase significantly based on morph-to-segment
matching with consideration the most substantial (30% lift, 𝑡 = 4.9,𝑝 < 0.01 and 8% lift,
𝑡 = 4.1,𝑝 < 0.01, respectively).
[Insert Table 2 about here.]
5.8. Test-vs.-Control and Pre-vs.-Post Analyses
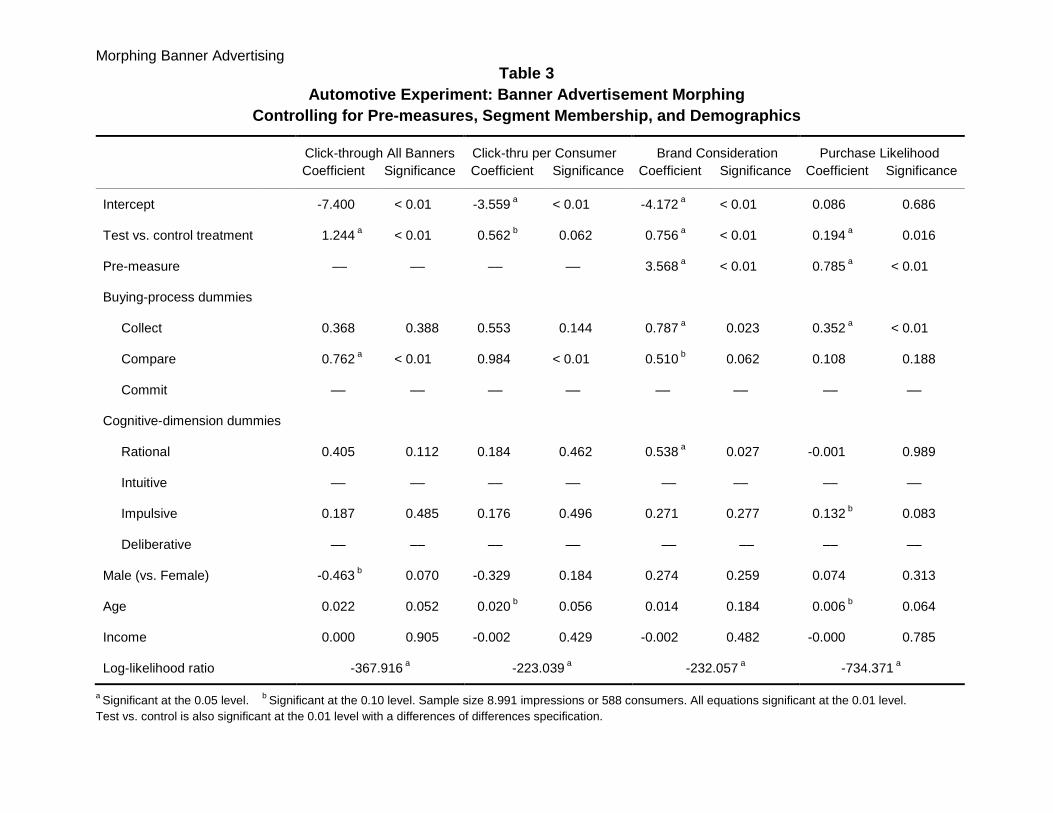
We increase statistical power by accounting for the pre-measures (as in differences of dif-
ferences) and for variation in segment membership or demographics due to stochastic variation
in random assignment. Table 3 reports the results where we control for pre-measures, segment
membership, and demographics. Click-through and brand consideration are quantal measures
(click or not; consider or not), therefore we use a logit formulation for these measures. Purchase
Morphing Banner Advertising
21
likelihood is a scaled measure, so a regression suffices. Click-through (all banners) and brand
consideration are significant at the 𝑝 < 0.01 level and purchase likelihood is significant at the
𝑝 = 0.02 level. Click-through (per consumer) is marginally significant at the 𝑝 = 0.06 level.
[Insert Table 3 about here.]
In Table 3 we used the pre-measure as an independent variable because the pre-measure
accounts for both measurement error and, partially, for unobserved heterogeneity in consumers’
propensity to consider or purchase Chevrolet. We can also remove unobserved heterogeneity
with double-difference formulations. When we do so, test vs. control is significant at the 0.01
level for both brand consideration and purchase likelihood (details from the authors).
Together Tables 2 and 3 suggest that morph-to-segment matching increases brand con-
sideration and purchase likelihood (for automotive consumers) as well as click-through rates.
When combined with the CNET field experiment, the focused automotive experiment suggests
that the effectiveness of banners is improved when morphing targets banners to consumers seg-
ments that vary on cognitive styles and behavioral-context characteristics (buying stage and
body-type preference). Both experimental results (CNET and automotive) reinforce the priming-
study-based simulations reported in HULB for website morphing.
6. Implications and Future Directions
Online morphing is a nascent, but promising, technology for improving the effectiveness
of banner advertising and website design. The original website morphing paper established the
potential for increasing sales if websites morphed their look and feel, but the evaluation was
based on data generated in a priming study. A subsequent field application tested website morph-
ing for a Suruga Bank website (Hauser, Urban and Liberali 2011). The Suruga Bank results were
also promising, but the small sample was not sufficient to test fully whether the expected Gittins’
Morphing Banner Advertising
22
index would converge to the best morph.
This paper provides experimental data for morphing banner advertisements. The CNET
field experiment establishes that an expected-Gittins’-index strategy enables a website to learn
automatically the best morph for each consumer segment. Click-through rates improve substan-
tially for targeted webpages on a high-traffic website. The automotive experiment tests the fun-
damental premise of matching morphs to consumer segments. Morph-to-segment matching im-
proves click-through rates, brand consideration, and purchase likelihood. (The automotive expe-
riment assumes the CNET result that, in steady state, the expected-Gittins’-index strategy would
identify the best morph-to-segment matches.)
The four tests of morphing to date (two for website morphing, two for banner morphing)
are promising. The expected-Gittins’-index provides near optimal learning; we know of no better
strategy. By the principle of optimality, the expected-Gittins’-index strategy is superior to a
strategy that relies on setting aside the first 𝑁𝑙𝑎𝑟𝑔𝑒 consumers for a random-assignment experi-
ment. Given the high traffic on these websites and the low click-through rates, the improvement
can be substantial. However, the current state of the art for morphing still requires a priming
study to (1) establish the definitions of consumer segments and (2) obtain data on click prefe-
rences for each segment (the 𝜔��⃗ 𝑟).
6.1. Norms Rather than Priming Studies
We envision future applications that rely on norms rather than priming studies. For ex-
ample, in the four applications to date the definitions of the cognitive-style segments are some-
what similar. With more applications, we might use meta-analyses to stabilize cognitive-style de-
finitions so that they might be used without a priming study. Similarly, meta analyses might pro-
vide strong priors for segment-based click-characteristic preferences, 𝜔��⃗ 𝑟. We might also identify
Morphing Banner Advertising
23
the click-alternative characteristics that best distinguish consumer segments. Such empirical ge-
neralizations would enable an advertiser to rely on norms or an abridged priming study. This dif-
fusion of knowledge has already taken place in pre-test markets for consumer packaged goods.
Initial studies explored the methods, but later studies built the normative databases. Today, most
new product forecasts rely on norms. When norms become established we expect morphing to
flourish.
6.2. Practical Challenges
The banner-morphing experiments in this paper, and the prior website-morphing tests, re-
lied on experienced professional designers to develop banners or websites to match consumer
segments. Morphing implementation identified the best banners for each segment which often
spurred further creative development. As we gain more experience we expect that scientific stu-
dies will lead to greater insight into the design challenge. Such studies are fertile grounds for
new research. The other practical challenge is transportable code. All code has been specific to
the application (and open source). Conjoint analysis, hierarchical Bayes, multinomial logit ana-
lyses, and other marketing science methods diffused widely when generalized software became
available. We hope for the same diffusion with banner and website morphing.
Morphing Banner Advertising
24
References
Barr, Colin. 2008. CBS buying CNET in online push. Fortune Daily Briefing, CNNMoney.com.
http://web.archive.org/web/20080517215301/http:/dailybriefing.blogs.fortune.cnn.com/2
008/05/15/cbs-buying-cnet-in-online-push/. Accessed February 2012.
Chaiken, S. 1980. Heuristic versus systematic information processing and the use of source ver-
sus message cues in persuasion. Journal of Personality and Social Psychology, 39, (5),
752-766.
Chen, Y., D. Pavolv, and J. F. Canny. 2009. Large-scale behavioral targeting. Proceedings of the
15th ACM SIGKDD International Conference on Knowledge Discovery and Data Mining,
New York, NY. 209-218.
Chu, W. S-T Park, T Beaupre, N. Motgi, A. Phadke, S. Chakraborty, and J. Zachariah. 2009. A
case study of behavior-driven conjoint analysis on Yahoo! Front Page Today module.
Proceedings of the 15th ACM SIGKDD International Conference on Knowledge Discov-
ery and Data Mining. 1097-1104.
Churchill, G. A., Jr. 1979. A paradigm for developing better measures of marketing constructs.
Journal of Marketing Research, 16 (February), 64-73.
Dahlen, M. 2001. Banner advertisements through a new lens. Journal of Advertising Research,
41 (4), 23-30.
Gatarski, R. 2002. Breed better banners: design automation through on-line interaction. Journal
of Interactive Marketing, 16 (1), 2-13.
Giffin, B. and J. Richards 2011. The role of the internet in the new and used vehicle purchase
process. Polk View (February), https://www.polk.com/knowledge/polk_views/
role_of_internet_in_new_and_used_vehicle_purchase_process. Accessed February 2012.
Morphing Banner Advertising
25
Gittins, J. C. 1979. Bandit processes and dynamic allocation indices. Journal of the Royal Statis-
tical Society. Series B (Methodological), 41 (2), 148–177.
Goldfarb, A. and C. E. Tucker. 2011. Online display advertising: targeting and obtrusiveness,
Marketing Science, 30 (3), 389-404.
Hauser, J. R., G. L. Urban, and G. Liberali. 2011. Website morphing 2.0: technical and imple-
mentation advances combined with the first field experiment of website morphing,
(Cambridge, MA: MIT Sloan School of Management), July.
Hauser, J. R., G. L. Urban, G. Liberali, and M. Braun. 2009. Website morphing. Marketing
Science, 28 (2), 202-224.
Iyer, G., D. Soberman, and J. M. Villas-Boas. 2005. The targeting of advertising. Marketing
Science, 24 (3), 461-476.
Joshi, A., A. Bagherjeiran, and A. Ratnaparkhi. 2011. User demographic and behavioral target-
ing for content match advertising. Proceedings of the Fifth International Workshop on-
Data Mining and Audience Intelligence for Advertising (ADKDD 2011), 53-60.
Kenny, D. and J. F. Marshall. 2000. Contextual marketing. Harvard Business Review, 78 (6),
119-25.
Krishnamurthy, V. and J. Mickova (1999), “Finite dimensional algorithms for the hidden Mar-
kov model multi-armed bandit problem. IEEE International Conference on Acoustics,
Speech, and Signal Processing, 5, 2865-2868.
Lambrecht A. and C. E. Tucker. 2011. When does retargeting work?: timing information and
specificity. London Business School. London UK.
Li, H. and J. L. Bukovac. 1999. Cognitive impact of banner ad characteristics: an experimental
study," Journalism & Mass Communication Quarterly, 76 (2), 341-53.
Morphing Banner Advertising
26
Novak, T. P. and D. L. Hoffman. 2009. The fit of thinking style and situation: new measures of
situation-specific experiential and rational cognition. Journal of Consumer Research, 36
(1), 56-72.
Petty, R. E., J. T. Cacioppo, and D. Schumann. 1983. Central and peripheral routes to advertising
effectiveness: the moderating role of involvement. Journal of Consumer Research. 10
(September), 135-146
PricewaterhouseCoopers. 2011. IAB Internet advertising revenue report.
http://www.iab.net/media/file/IAB_Full_year_2010_0413_Final.pdf. Accessed February
15, 2011.
Stanaland, A. J. S. and J. Tan. 2010. The impact of surfer/seeker mode on the effectiveness of
website characteristics. International Journal of Advertising, 29 (4), 569-595.
Sundar, S. S. and S. Kalyanaraman (2004). Arousal, memory, and impression-formation effects
of animation speed in web advertising. Journal of Advertising, 33 (1), 7-17.
Urban, G. L. and J. R. Hauser (2004). “Listening in” to find and explore new combinations of
customer needs. Journal of Marketing. 68 (April), 72-87.
Morphing Banner Advertising
Table 1 CNET Field Test of Banner Advertisement Morphing
Sample Size Click-through Rate a Signif-icance Test Control Test Control Lift
Targeted webpages
All banners 40,993 17,906 0.307 b 0.168 + 83% 0.003
Per consumer 22,376 9,708 0.250 b 0.127 + 97% 0.028
Non-targeted webpages
All banners 262,911 129,714 0.151 0.160 - 6% 0.495
Per consumer 59,362 24,722 0.144 c 0.197 - 27% 0.081
a Click-through rates are given as fractions of a percent, e.g., 0.307 of 1%. b Test cell has a significantly larger click-through rate than control cell at the 0.05 level or better. c Test cell has a marginally significantly smaller click-through rate than the control cell at the 0.10 level.
Table 2
Automotive Experiment: Banner Advertisement Morphing (Post-only Results) (All banners are targeted by body-type preference.)
Sample Size Outcome Measure a Signif-icance Test Control Test Control Lift
Click-through rates
All banners 6,348 2,643 0.97% b 0.26% + 245% < 0.01
Per consumer 421 167 15.9% b 9.6% + 66% < 0.01
Brand Consideration 421 167 42.8% b 32.9% + 30% < 0.01
Purchase likelihood 421 167 3.28 b 3.05 + 8% < 0.01
a Click-through rates are given as percents. Consideration is a consider-or-not measure reported as a percent. Purchase likelihood is measured with a five-point scale.
b Test cell has a significantly larger at the 0.01 level.
Morphing Banner Advertising
Table 3 Automotive Experiment: Banner Advertisement Morphing
Controlling for Pre-measures, Segment Membership, and Demographics
Click-through All Banners Click-thru per Consumer Brand Consideration Purchase Likelihood Coefficient Significance Coefficient Significance Coefficient Significance Coefficient Significance
Intercept -7.400 < 0.01 -3.559 a < 0.01 -4.172 a < 0.01 0.086 0.686
Test vs. control treatment 1.244 a < 0.01 0.562 b 0.062 0.756 a < 0.01 0.194 a 0.016
Pre-measure –– –– –– –– 3.568 a < 0.01 0.785 a < 0.01
Buying-process dummies
Collect 0.368 0.388 0.553 0.144 0.787 a 0.023 0.352 a < 0.01
Compare 0.762 a < 0.01 0.984 < 0.01 0.510 b 0.062 0.108 0.188
Commit –– –– –– –– –– –– –– ––
Cognitive-dimension dummies
Rational 0.405 0.112 0.184 0.462 0.538 a 0.027 -0.001 0.989
Intuitive –– –– –– –– –– –– –– ––
Impulsive 0.187 0.485 0.176 0.496 0.271 0.277 0.132 b 0.083
Deliberative –– –– –– –– –– –– –– ––
Male (vs. Female) -0.463 b 0.070 -0.329 0.184 0.274 0.259 0.074 0.313
Age 0.022 0.052 0.020 b 0.056 0.014 0.184 0.006 b 0.064
Income 0.000 0.905 -0.002 0.429 -0.002 0.482 -0.000 0.785
Log-likelihood ratio -367.916 a -223.039 a -232.057 a -734.371 a
a Significant at the 0.05 level. b Significant at the 0.10 level. Sample size 8.991 impressions or 588 consumers. All equations significant at the 0.01 level. Test vs. control is also significant at the 0.01 level with a differences of differences specification.
Morphing Banner Advertising
Figure 1 Eight Banner Advertisements Targeted to Cognitive Styles (CNET Field Experiment)
Morphing Banner Advertising
Figure 2 Automotive Experiment: Longitudinal Design to Effect Morph-to-Segment Matching
Factor analyze cognitive-style scales. Assign consumers to
cognitive-style segments and buying stage. Identify the best
“morphs” for each cognitive-style segment. All banners are targeted
by body type.
Phase 3 (experiment, four and one-half weeks after Phase 1)Consumers explore “Consumer Research Power” website.Consumers exposed to banners in natural search.Test: Banners assigned by morph-to-segment rules.Control: Current in vivo Chevrolet banners.Post-measures for consideration and purchase likelihood.20 minutes
Phase 2 (Two weeks later)Consumers complete 29 cognitive-style scales.Pre-measures for consideration and purchase likelihood.10 minutes
Phase 1Develop potential banners based on pre-studies.Screen consumers for target marketConsumers indicate body-type preference.Consumers indicate stage of buying process.Consumers rate potential banners on meaningfulness, relevance, information content, and believability.5 minutes
Morphing Banner Advertising
Figure 3
Simulated Website for Automotive Experiment Matching Morphs to Segments (Landing page on the left. One of many subsequent pages on the right.)
Morphing Banner Advertising
Figure 4 Example Test and Control Banner Advertisements for the Automotive Experiment
(The left-most banners are controls. The other columns are five banners for each buying-stage seg-ment. In the experiment there were 10 potential control banners: body type x two banners. There
were 75 potential test banners: body type x buying-stage x cognitive-style.)
Control CommitmentComparisonCollection
Morphing Banner Advertising, Appendices
A1
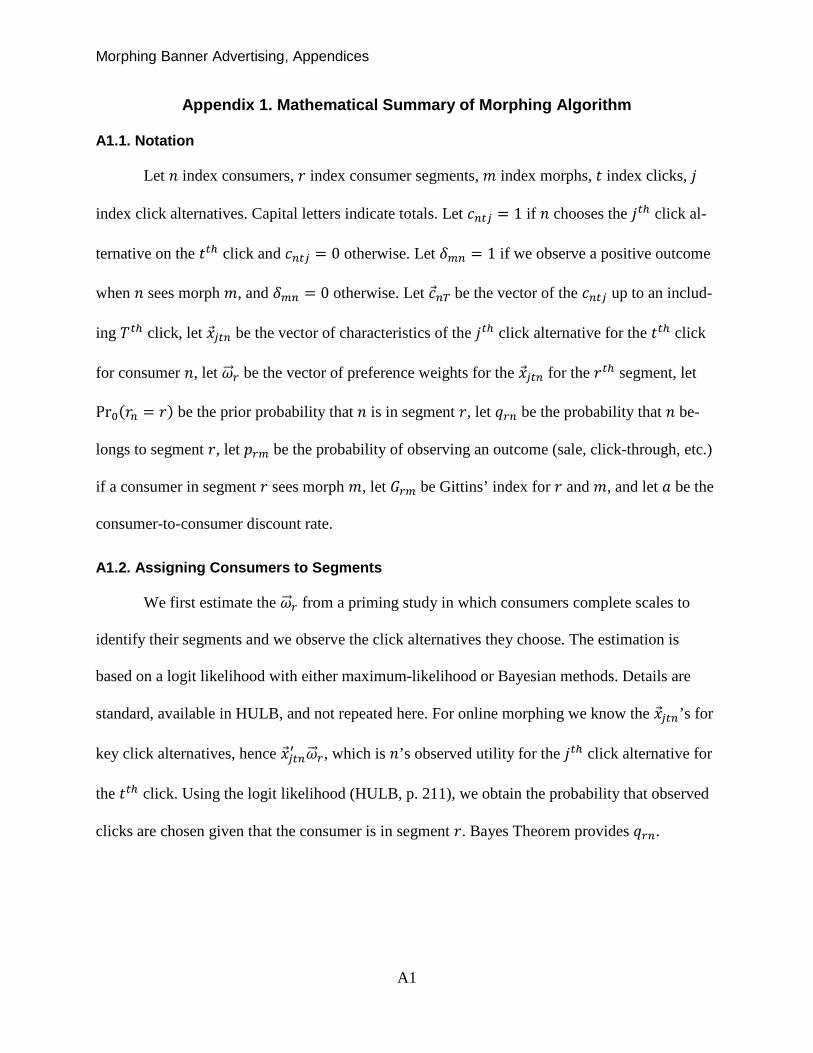
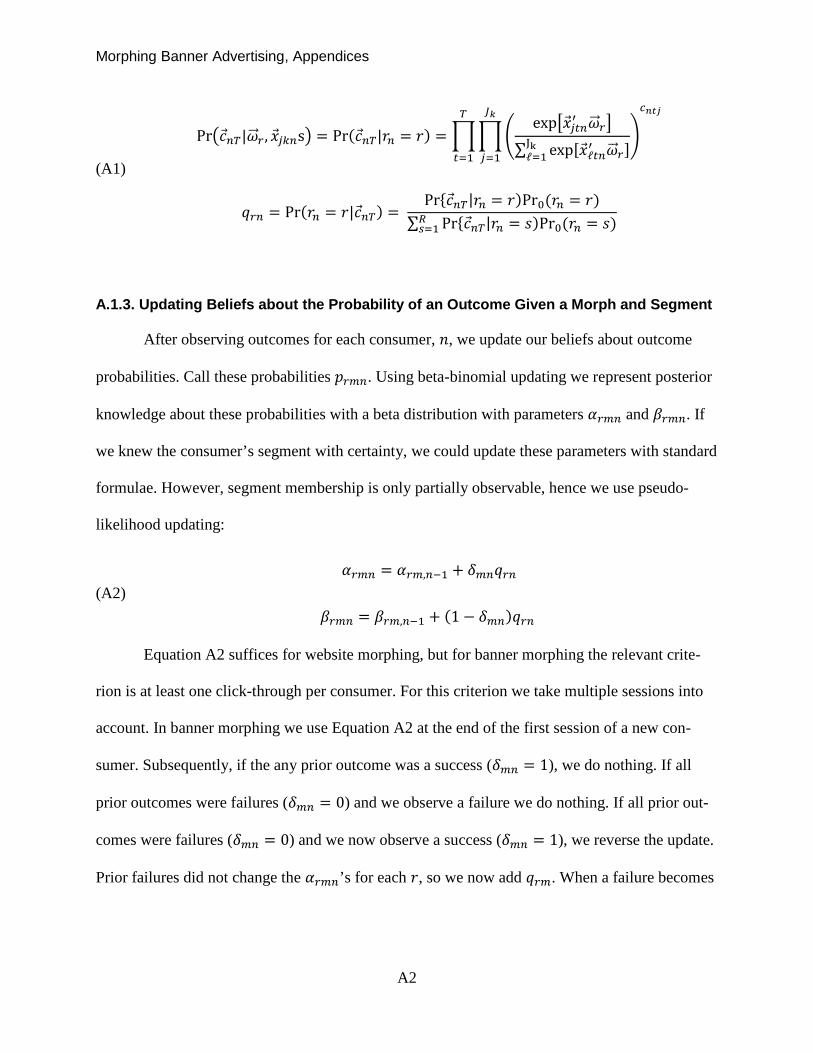
Appendix 1. Mathematical Summary of Morphing Algorithm
A1.1. Notation
Let 𝑛 index consumers, 𝑟 index consumer segments, 𝑚 index morphs, 𝑡 index clicks, 𝑗
index click alternatives. Capital letters indicate totals. Let 𝑐𝑛𝑡𝑗 = 1 if 𝑛 chooses the 𝑗𝑡ℎ click al-
ternative on the 𝑡𝑡ℎ click and 𝑐𝑛𝑡𝑗 = 0 otherwise. Let 𝛿𝑚𝑛 = 1 if we observe a positive outcome
when 𝑛 sees morph 𝑚, and 𝛿𝑚𝑛 = 0 otherwise. Let 𝑐𝑛𝑇 be the vector of the 𝑐𝑛𝑡𝑗 up to an includ-
ing 𝑇𝑡ℎ click, let �⃗�𝑗𝑡𝑛 be the vector of characteristics of the 𝑗𝑡ℎ click alternative for the 𝑡𝑡ℎ click
for consumer 𝑛, let 𝜔��⃗ 𝑟 be the vector of preference weights for the �⃗�𝑗𝑡𝑛 for the 𝑟𝑡ℎ segment, let
Pr0(𝑟𝑛 = 𝑟) be the prior probability that 𝑛 is in segment 𝑟, let 𝑞𝑟𝑛 be the probability that 𝑛 be-
longs to segment 𝑟, let 𝑝𝑟𝑚 be the probability of observing an outcome (sale, click-through, etc.)
if a consumer in segment 𝑟 sees morph 𝑚, let 𝐺𝑟𝑚 be Gittins’ index for 𝑟 and 𝑚, and let 𝑎 be the
consumer-to-consumer discount rate.
A1.2. Assigning Consumers to Segments
We first estimate the 𝜔��⃗ 𝑟 from a priming study in which consumers complete scales to
identify their segments and we observe the click alternatives they choose. The estimation is
based on a logit likelihood with either maximum-likelihood or Bayesian methods. Details are
standard, available in HULB, and not repeated here. For online morphing we know the �⃗�𝑗𝑡𝑛’s for
key click alternatives, hence �⃗�𝑗𝑡𝑛′ 𝜔��⃗ 𝑟, which is 𝑛’s observed utility for the 𝑗𝑡ℎ click alternative for
the 𝑡𝑡ℎ click. Using the logit likelihood (HULB, p. 211), we obtain the probability that observed
clicks are chosen given that the consumer is in segment 𝑟. Bayes Theorem provides 𝑞𝑟𝑛.
Morphing Banner Advertising, Appendices
A2
(A1)
Pr�𝑐𝑛𝑇|𝜔��⃗ 𝑟 , �⃗�𝑗𝑘𝑛s� = Pr(𝑐𝑛𝑇|𝑟𝑛 = 𝑟) = ���exp��⃗�𝑗𝑡𝑛′ 𝜔��⃗ 𝑟�
∑ exp[�⃗�ℓ𝑡𝑛′ 𝜔��⃗ 𝑟]Jkℓ=1
�𝐽𝑘
𝑗=1
𝑇
𝑡=1
𝑐𝑛𝑡𝑗
𝑞𝑟𝑛 = Pr(𝑟𝑛 = 𝑟|𝑐𝑛𝑇) = Pr{𝑐𝑛𝑇|𝑟𝑛 = 𝑟)Pr0(𝑟𝑛 = 𝑟) �
∑ Pr{𝑐𝑛𝑇|𝑟𝑛 = 𝑠)Pr0(𝑟𝑛 = 𝑠) �𝑅𝑠=1
A.1.3. Updating Beliefs about the Probability of an Outcome Given a Morph and Segment
After observing outcomes for each consumer, 𝑛, we update our beliefs about outcome
probabilities. Call these probabilities 𝑝𝑟𝑚𝑛. Using beta-binomial updating we represent posterior
knowledge about these probabilities with a beta distribution with parameters 𝛼𝑟𝑚𝑛 and 𝛽𝑟𝑚𝑛. If
we knew the consumer’s segment with certainty, we could update these parameters with standard
formulae. However, segment membership is only partially observable, hence we use pseudo-
likelihood updating:
(A2) 𝛼𝑟𝑚𝑛 = 𝛼𝑟𝑚,𝑛−1 + 𝛿𝑚𝑛𝑞𝑟𝑛
𝛽𝑟𝑚𝑛 = 𝛽𝑟𝑚,𝑛−1 + (1 − 𝛿𝑚𝑛)𝑞𝑟𝑛
Equation A2 suffices for website morphing, but for banner morphing the relevant crite-
rion is at least one click-through per consumer. For this criterion we take multiple sessions into
account. In banner morphing we use Equation A2 at the end of the first session of a new con-
sumer. Subsequently, if the any prior outcome was a success (𝛿𝑚𝑛 = 1), we do nothing. If all
prior outcomes were failures (𝛿𝑚𝑛 = 0) and we observe a failure we do nothing. If all prior out-
comes were failures (𝛿𝑚𝑛 = 0) and we now observe a success (𝛿𝑚𝑛 = 1), we reverse the update.
Prior failures did not change the 𝛼𝑟𝑚𝑛’s for each 𝑟, so we now add 𝑞𝑟𝑚. When a failure becomes
Morphing Banner Advertising, Appendices
A3
a success, we undo the update that was added to the 𝛽𝑟𝑚𝑛’s for each 𝑟. Earlier failures caused us
to add 𝑞𝑟𝑛 for each 𝑟 to the 𝛽𝑟𝑚𝑛’s, hence we now subtract 𝑞𝑟𝑛 for each 𝑟 from the 𝛽𝑟𝑚𝑛’s.
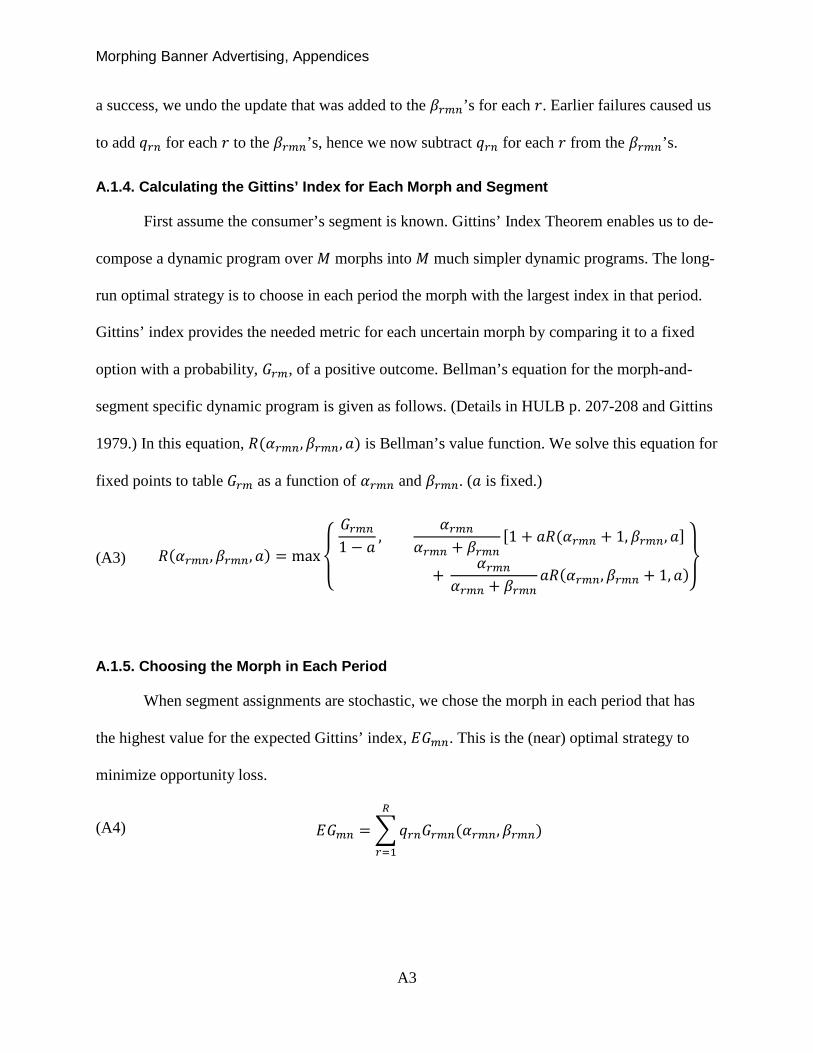
A.1.4. Calculating the Gittins’ Index for Each Morph and Segment
First assume the consumer’s segment is known. Gittins’ Index Theorem enables us to de-
compose a dynamic program over 𝑀 morphs into 𝑀 much simpler dynamic programs. The long-
run optimal strategy is to choose in each period the morph with the largest index in that period.
Gittins’ index provides the needed metric for each uncertain morph by comparing it to a fixed
option with a probability, 𝐺𝑟𝑚, of a positive outcome. Bellman’s equation for the morph-and-
segment specific dynamic program is given as follows. (Details in HULB p. 207-208 and Gittins
1979.) In this equation, 𝑅(𝛼𝑟𝑚𝑛,𝛽𝑟𝑚𝑛,𝑎) is Bellman’s value function. We solve this equation for
fixed points to table 𝐺𝑟𝑚 as a function of 𝛼𝑟𝑚𝑛 and 𝛽𝑟𝑚𝑛. (𝑎 is fixed.)
(A3) 𝑅(𝛼𝑟𝑚𝑛,𝛽𝑟𝑚𝑛,𝑎) = max
⎩⎨
⎧𝐺𝑟𝑚𝑛1 − 𝑎
,𝛼𝑟𝑚𝑛
𝛼𝑟𝑚𝑛 + 𝛽𝑟𝑚𝑛[1 + 𝑎𝑅(𝛼𝑟𝑚𝑛 + 1,𝛽𝑟𝑚𝑛,𝑎]
+ 𝛼𝑟𝑚𝑛
𝛼𝑟𝑚𝑛 + 𝛽𝑟𝑚𝑛𝑎𝑅(𝛼𝑟𝑚𝑛,𝛽𝑟𝑚𝑛 + 1,𝑎)
⎭⎬
⎫
A.1.5. Choosing the Morph in Each Period
When segment assignments are stochastic, we chose the morph in each period that has
the highest value for the expected Gittins’ index, 𝐸𝐺𝑚𝑛. This is the (near) optimal strategy to
minimize opportunity loss.
(A4) 𝐸𝐺𝑚𝑛 = �𝑞𝑟𝑛𝐺𝑟𝑚𝑛(𝛼𝑟𝑚𝑛,𝛽𝑟𝑚𝑛)𝑅
𝑟=1
Morphing Banner Advertising, Appendices
A4
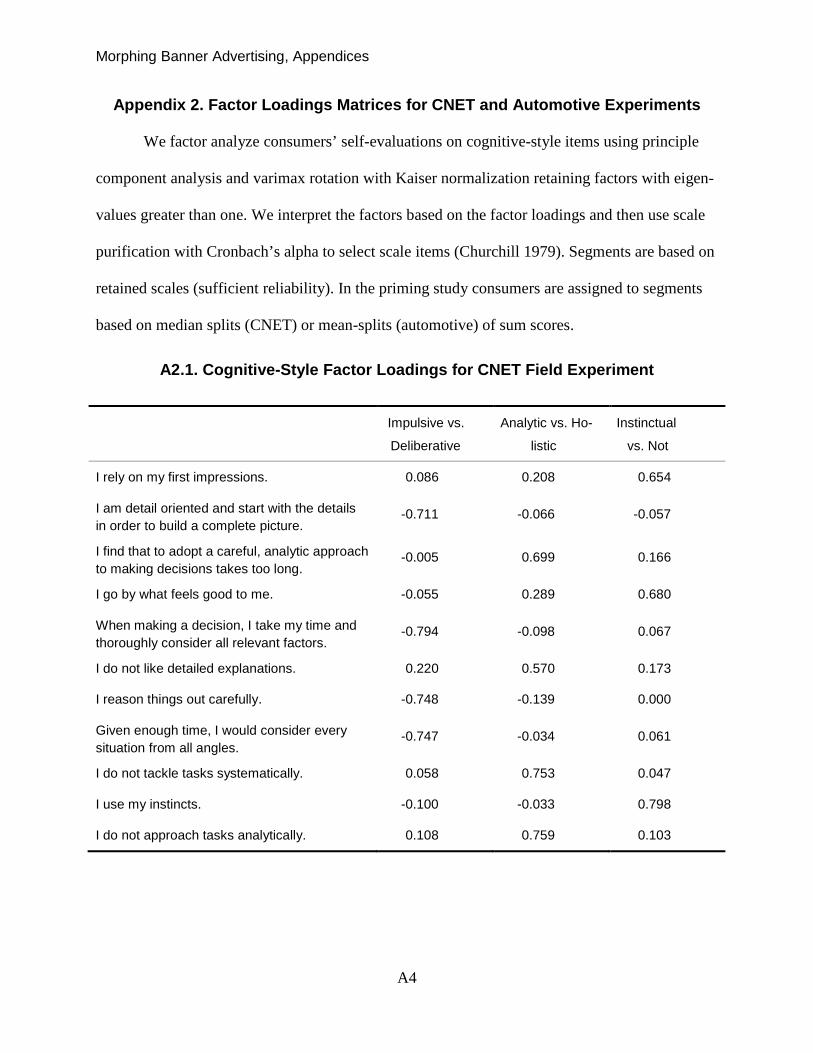
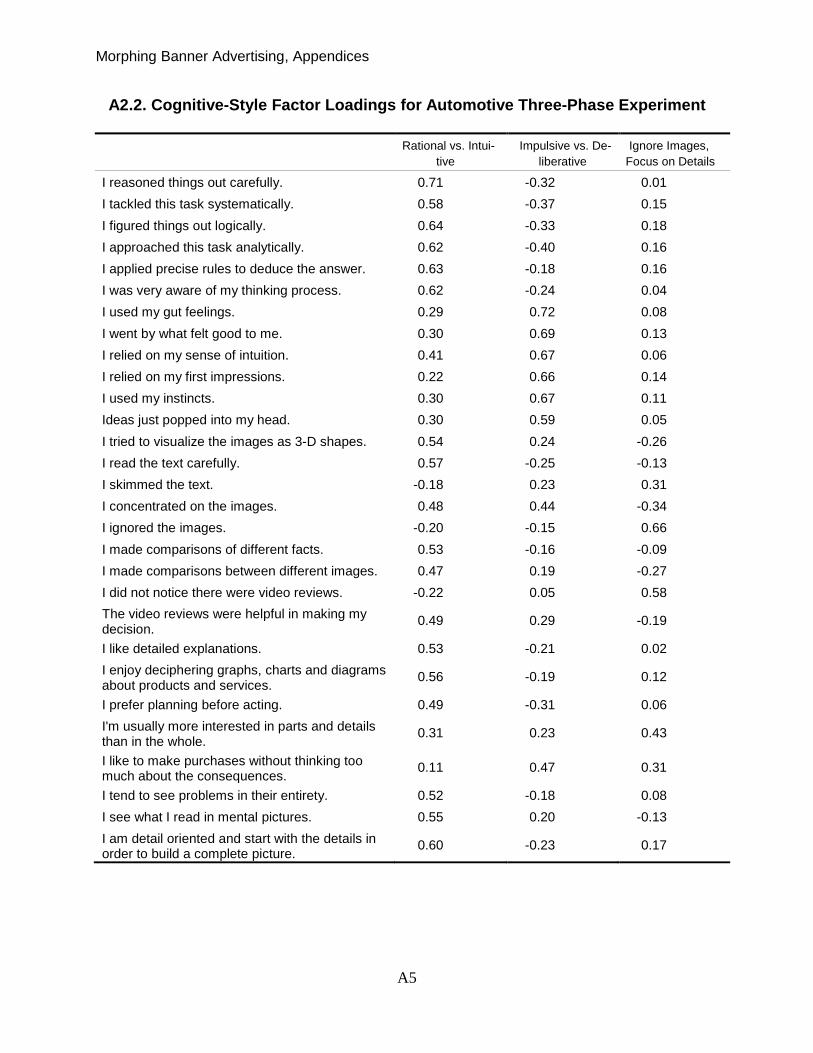
Appendix 2. Factor Loadings Matrices for CNET and Automotive Experiments
We factor analyze consumers’ self-evaluations on cognitive-style items using principle
component analysis and varimax rotation with Kaiser normalization retaining factors with eigen-
values greater than one. We interpret the factors based on the factor loadings and then use scale
purification with Cronbach’s alpha to select scale items (Churchill 1979). Segments are based on
retained scales (sufficient reliability). In the priming study consumers are assigned to segments
based on median splits (CNET) or mean-splits (automotive) of sum scores.
A2.1. Cognitive-Style Factor Loadings for CNET Field Experiment
Impulsive vs.
Deliberative
Analytic vs. Ho-
listic
Instinctual
vs. Not
I rely on my first impressions. 0.086 0.208 0.654
I am detail oriented and start with the details in order to build a complete picture.
-0.711 -0.066 -0.057
I find that to adopt a careful, analytic approach to making decisions takes too long.
-0.005 0.699 0.166
I go by what feels good to me. -0.055 0.289 0.680
When making a decision, I take my time and thoroughly consider all relevant factors.
-0.794 -0.098 0.067
I do not like detailed explanations. 0.220 0.570 0.173
I reason things out carefully. -0.748 -0.139 0.000
Given enough time, I would consider every situation from all angles.
-0.747 -0.034 0.061
I do not tackle tasks systematically. 0.058 0.753 0.047
I use my instincts. -0.100 -0.033 0.798
I do not approach tasks analytically. 0.108 0.759 0.103
Morphing Banner Advertising, Appendices
A5
A2.2. Cognitive-Style Factor Loadings for Automotive Three-Phase Experiment
Rational vs. Intui-tive
Impulsive vs. De-liberative
Ignore Images, Focus on Details
I reasoned things out carefully. 0.71 -0.32 0.01 I tackled this task systematically. 0.58 -0.37 0.15 I figured things out logically. 0.64 -0.33 0.18 I approached this task analytically. 0.62 -0.40 0.16 I applied precise rules to deduce the answer. 0.63 -0.18 0.16 I was very aware of my thinking process. 0.62 -0.24 0.04 I used my gut feelings. 0.29 0.72 0.08 I went by what felt good to me. 0.30 0.69 0.13 I relied on my sense of intuition. 0.41 0.67 0.06 I relied on my first impressions. 0.22 0.66 0.14 I used my instincts. 0.30 0.67 0.11 Ideas just popped into my head. 0.30 0.59 0.05 I tried to visualize the images as 3-D shapes. 0.54 0.24 -0.26 I read the text carefully. 0.57 -0.25 -0.13 I skimmed the text. -0.18 0.23 0.31 I concentrated on the images. 0.48 0.44 -0.34 I ignored the images. -0.20 -0.15 0.66 I made comparisons of different facts. 0.53 -0.16 -0.09 I made comparisons between different images. 0.47 0.19 -0.27 I did not notice there were video reviews. -0.22 0.05 0.58 The video reviews were helpful in making my decision. 0.49 0.29 -0.19
I like detailed explanations. 0.53 -0.21 0.02 I enjoy deciphering graphs, charts and diagrams about products and services. 0.56 -0.19 0.12
I prefer planning before acting. 0.49 -0.31 0.06 I'm usually more interested in parts and details than in the whole. 0.31 0.23 0.43
I like to make purchases without thinking too much about the consequences. 0.11 0.47 0.31
I tend to see problems in their entirety. 0.52 -0.18 0.08 I see what I read in mental pictures. 0.55 0.20 -0.13 I am detail oriented and start with the details in order to build a complete picture. 0.60 -0.23 0.17
Morphing Banner Advertising, Appendices
A6
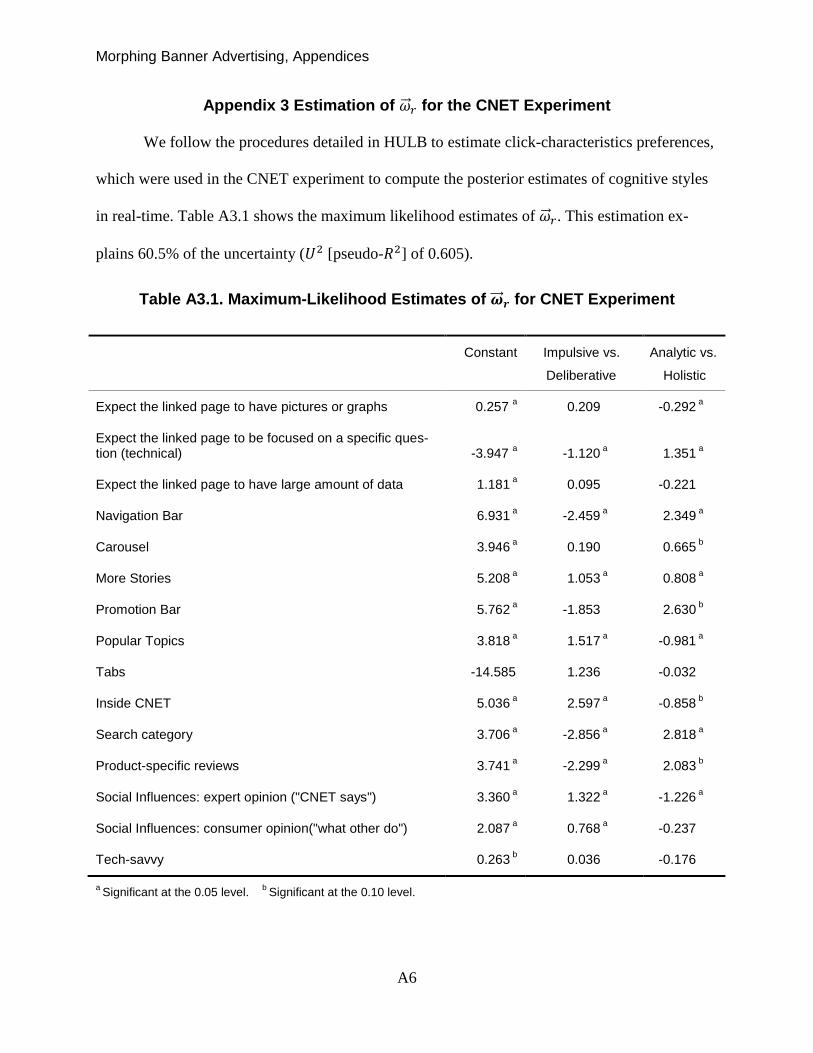
Appendix 3 Estimation of 𝜔��⃗ 𝑟 for the CNET Experiment
We follow the procedures detailed in HULB to estimate click-characteristics preferences,
which were used in the CNET experiment to compute the posterior estimates of cognitive styles
in real-time. Table A3.1 shows the maximum likelihood estimates of 𝜔��⃗ 𝑟. This estimation ex-
plains 60.5% of the uncertainty (𝑈2 [pseudo-𝑅2] of 0.605).
Table A3.1. Maximum-Likelihood Estimates of 𝝎���⃗ 𝒓 for CNET Experiment
Constant Impulsive vs.
Deliberative
Analytic vs.
Holistic
Expect the linked page to have pictures or graphs 0.257 a 0.209 -0.292 a
Expect the linked page to be focused on a specific ques-tion (technical) -3.947 a -1.120 a 1.351 a
Expect the linked page to have large amount of data 1.181 a 0.095 -0.221
Navigation Bar 6.931 a -2.459 a 2.349 a
Carousel 3.946 a 0.190 0.665 b
More Stories 5.208 a 1.053 a 0.808 a
Promotion Bar 5.762 a -1.853 2.630 b
Popular Topics 3.818 a 1.517 a -0.981 a
Tabs -14.585 1.236 -0.032
Inside CNET 5.036 a 2.597 a -0.858 b
Search category 3.706 a -2.856 a 2.818 a
Product-specific reviews 3.741 a -2.299 a 2.083 b
Social Influences: expert opinion ("CNET says") 3.360 a 1.322 a -1.226 a
Social Influences: consumer opinion("what other do") 2.087 a 0.768 a -0.237
Tech-savvy 0.263 b 0.036 -0.176
a Significant at the 0.05 level. b Significant at the 0.10 level.
Top Related