


Languages
Pages
Legal

Select Harvests Limited (“SHV”) Morgan Stanley Australian Emerging Companies Conference
Paul Thompson, Managing Director
18 June 2015
Strong & Healthy
For
per
sona
l use
onl
y

2 2
This presentation is provided for information purposes only and has been prepared using information provided by the company. The information contained in this presentation is not intended to be relied upon as advice to investors and does not take into account the investment objectives, financial situation or needs of any particular investor. Investors should consider their own individual investment and financial circumstances in relation to any investment decision.
Certain statements contained in this presentation may constitute forward-looking statements or statements about future matters that are based upon information known and assumptions made as of the date of this presentation. These statements are subject to risks and uncertainties. Actual results may differ materially from any future results or performance expressed, predicted or implied by the statements contained in this presentation.
Disclaimer & Basis of Preparation
For
per
sona
l use
onl
y

3 3
Agenda - Healthy Growth
• SHV- Key Drivers & Assets
• SHV - Strategy & Activities Update
• SHV- Review
• SHV - 2015 Crop Update
• Almond Market Global Trends
• SHV – Business FocusFor
per
sona
l use
onl
y

4 4
SHV - Overview
Select Harvests is listed on the Australian Securities Exchange (ASX:SHV)
SHV market capitalisation is A$714 million
71,435,801 shares @ A$10.00/share as at 12 June 2015
SHV is headquartered at Thomastown in Melbourne’s Northern suburbs
SHV employs approx. 350 FTE’s
SHV has 2 Divisions
Almond Division
13,311 acres almond orchards (planted)
5,000 acres greenfield (unplanted)
Carina West Processing Facility - Hulling & Shelling
Food Division
Packaged Foods (Proprietary Brands and Retail Brands)
Industrial & Trading Division
Thomastown Processing Facility –Value Added Processing
Select Harvests is an integrated growing agribusiness
For
per
sona
l use
onl
y

5 5
SHV Key Assets - Orchards - Geographic Diversity & Scale
Australia’s 2nd largest and most geographically diverse almond producer
Geographic diversity limits exposure to:
− Weather− Disease spread− Insect infestation
Mendook to RobinvaleDistance: 40kmDrive Time: 0.5 hours
Amaroo to RobinvaleDistance: 225 kmDrive Time: 2.5 hours
Grewal to RobinvaleDistance: 140 kmDrive Time: 1.8 hours
For
per
sona
l use
onl
y

6 6
Note: * Anticipated PlantingsSource: Company Data
0.0%
5.0%
10.0%
15.0%
20.0%
25.0%
30.0%
35.0%
40.0%
45.0%
50.0%
Un
pla
nte
d…
Pla
nti
ng…
Pla
nti
ng…
Pla
nti
ng…
Pla
nti
ng… 1 2 3 4 5 6 7 8 9
10
11
12
13
14
15
16
17
18
19
20
21
22
23
24
25
26
27
28
29
30
31
Tree Age (Years)
Planted acreage age profile
25%Planted orchards are
67%Planted orchards in economic sweet spot -
low capex & high cash generation
8%Planted orchards post
economic maturity
ReplantsNew Plants
Land bank (% of total
land holding)
SHV Key Assets - Orchard Profile - Young Orchards PLUS Longevity
Select Harvests almond orchards have an average age of 10.9 years. Currently Exploring Greenfield Funding Options.
For
per
sona
l use
onl
y
7 7
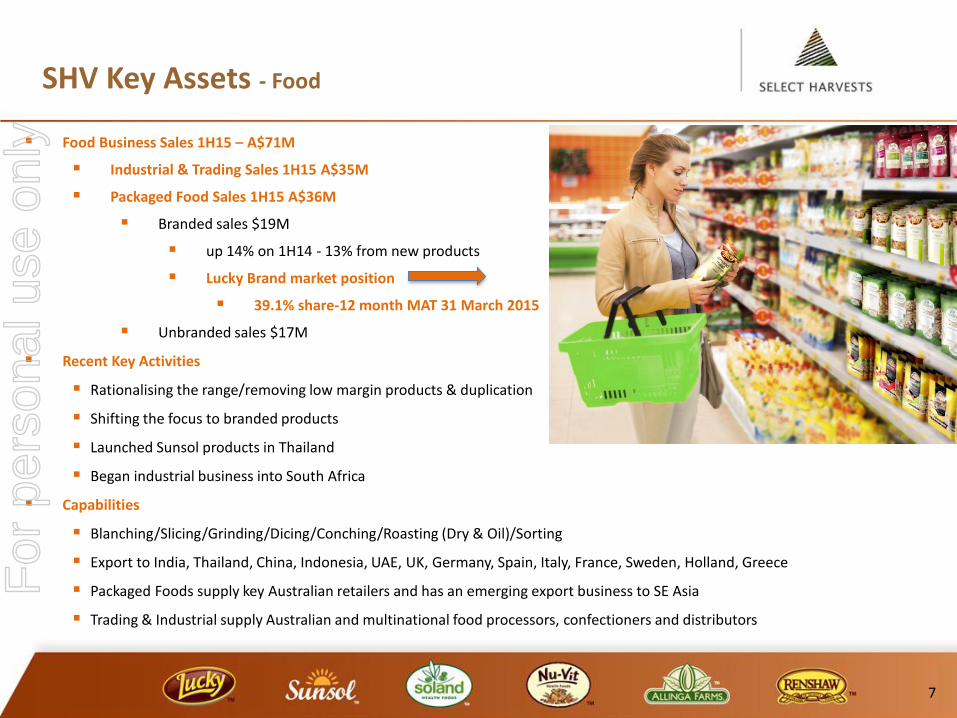
SHV Key Assets - Food
Food Business Sales 1H15 – A$71M
Industrial & Trading Sales 1H15 A$35M
Packaged Food Sales 1H15 A$36M
Branded sales $19M
up 14% on 1H14 - 13% from new products
Lucky Brand market position
39.1% share-12 month MAT 31 March 2015
Unbranded sales $17M
Recent Key Activities
Rationalising the range/removing low margin products & duplication
Shifting the focus to branded products
Launched Sunsol products in Thailand
Began industrial business into South Africa
Capabilities
Blanching/Slicing/Grinding/Dicing/Conching/Roasting (Dry & Oil)/Sorting
Export to India, Thailand, China, Indonesia, UAE, UK, Germany, Spain, Italy, France, Sweden, Holland, Greece
Packaged Foods supply key Australian retailers and has an emerging export business to SE Asia
Trading & Industrial supply Australian and multinational food processors, confectioners and distributors
For
per
sona
l use
onl
y

8 8
SHV Key Assets - Food - Brands
• Market leader in the cooking nut category. • Cooking Nut product range: almonds, walnuts, cashews, hazelnuts, brazil nuts, pine nuts, pistachios, macadamias, sunflower
seeds and pepitas (Value share 36.8% as at 20/7/14. Source Aztec National Chains Scan data)• Snacking product range: portion control packs, Lucky Smart Snax and Lucky Snack Tubs.• Distribution: major supermarkets and export markets including the Middle East, Indonesia and Papua New Guinea.
• Product range: nuts, dried fruit, legumes and pulses, cereals, grains, seeds, flour, muesli and organic foods.• Bulk and convenient packs.• Distribution: health food stores and pharmacies nationally.
• Product range: muesli, dried fruit, nuts and snacks.• Distribution: major supermarkets (muesli) and export markets including Hong Kong, Singapore, Malaysia , Indonesia and the
Pacific Rim.
• Product range: muesli, dried fruit, wholefoods, nuts and snacks.• Distribution: Health aisle of major supermarkets and export markets including Hong Kong, Singapore, Malaysia, Indonesia and
the Pacific Rim.
• Product range: almonds and other nuts, dried fruit, seeds, nut pastes and pralines.• Bulk pack.• Products sold to local and overseas food manufacturers, wholesalers, distributors and re-packers.
Source: Company Data and Aztec National Chains Scan data
For
per
sona
l use
onl
y

9 9
SHV - Review
Select Harvests has undergone significant transformation in last 5 years
Undertook a deliberate move to more directly expose shareholders to the compelling fundamentals of almonds & healthy eating
Select Harvests has transition from predominantly a manager of 3rd Party orchards to integrated agribusiness by:
Prioritising Risk Mitigation & Productivity
Increasing scale & leverage growth
Building Brands in Business to Business and Consumer segments
Exiting lower profit segments
Growing customer base
Select Harvests is an integrated growing agribusiness
For
per
sona
l use
onl
y

10 10
SHV Strategy - Objectives & Activities
.
10%EBIT pa
15%ROCE
EPS 7-10% pa
FY13 INITIATIVES FY14 INITIATIVES FY15 INITIATIVES
1. CONTROL CRITICAL MASS OF ALMONDS
Secure the critical mass of nuts needed to maximize profitability and leverage the global almond opportunity.
• Acquired 1,286 acres almond orchard• Ceased WA investment
• Acquired 680 acres planted orchard• Acquired 1,000 acres unplanted • Replanted 512 acres @ higher densities
• Acquired 2,481 acres planted orchard• Acquired 4,465 acres unplanted• Acquired 6,215 ML high security water• Planting 948 acres Allinga
2. IMPROVE YIELD & CROPVALUE
Improve yield and overall crop value by perfecting on-farm and farm to factory practices.
• Restructured Horticulture Division• Investments in Benchmarking/Tech.• Improve efficiency/protect yield• $500K frost fans
• Total review of Horticultural assets• Further $500K frost fans• Additional harvest equipment
• Additional harvest equipment • Bio stimulants trial• Trial catch & shake harvest technology
3. BE BEST IN CLASS SUPPLYCHAIN
Continuously improve our supply chain, achieving high quality, low cost and optimum capital utilisation.
• Restructured Operations Division • Evaluate operational improvements &refine proposals
• New Optical Sorter at Thomastown
• Biomass Electricity Cogen. Plant• Carina West Dryer
4. INVEST IN INDUSTRIAL & TRADING DIVISION
Allocate resources to leverage our trading skills and grow sales in the industrial channel
• Grew Industrial Division 40% • Grew Industrial Division 24% through local and SE Asia customer base
• Innovations assisted growth
• Expanding business with food processors in local and SE Asian markets
5. TURN AROUND PACKAGED FOOD BUSINESS
Develop a new model for the packaged food category that will deliver sustainable returns above the cost of capital.
• Exited unprofitable Retail Brand business
• Product Research/Collect Insights
• Product Development -Innovation/Renovation/Reformulation/Repackaging
• Brand relaunch - Sunsol & Lucky Smart Snax
• Multiple relaunches & new products• Range rationalisation• New distributors - Thailand & Malaysia
6. FIX OUR SYSTEMS & PROCESSES
Develop the business systems and processes required to be a global industry leader.
• OHS improvement - LTI’s dropped 60% • OHS improvement - LTI’s dropped 73%• New risk management framework• New OHS policies/procedures
• IT upgrade
7. ENGAGE WITH OUR PEOPLE & OUR STAKEHOLDERS
Engage with investors and our industry while developing the team required to be a global industry leader.
• Investor engagement – conferences, site tours and road shows
• Hort 3 training for Farm Management• Refreshed company website• Introduction of employee
newsletters/intranet
• Further development of Performance Review process
• Diversity Committee
Significant progress on implementation of company’s 7 strategic platforms & transition to a fully integrated agribusiness
For
per
sona
l use
onl
y

11 11
SHV- Business Focus
1. Acquire mature cash generating almond orchards
2. Develop green field almond orchards
3. Invest in orchard productivity
4. Invest in energy savings and sustainability: Cogen
5. Invest in new products (Food business)
6. Invest in manufacturing and supply chain footprint
7. Invest in business systems: One Select program
Business has a solid base and several controllable productivity opportunities
For
per
sona
l use
onl
y

12 12
SHV Productivity - Controllable Improvements
People/OHS/Safety – Right people, right training, right systems, right resources
Intangible impact – difficult to measure entire specific impact – collectively reveals itself in improved productivity & results
Orchard Productivity – investing incrementally more in crop production & yield initiatives to capture significantly more crop value
Every 0.1 MT/acre productivity gain delivers additional yield of 1,800 tonnes p.a. - EBIT $13 million p.a. (A$7.50/kg almond price)
Harvest Productivity – ensure harvest is safe, quick, efficient & value enhancing
Increase equipment matrix/night harvest operations – reduces time required for harvest
Installation of Dryer increases proportion of crop available to the lucrative in-shell market
Cogeneration/Processing Productivity – produce sustainable power from waste stream & permanently lower energy cost base
Will save circa $2m p.a. in energy costs and deliver lowest quartile costs/kg
Quality Productivity – produce a greater proportion of higher quality & higher value nuts
15-18% price differential between grades (Supreme grade vs manufacturing grade)
Food Productivity
Greater proportion of branded product sales.
Supply Chain Productivity – ensure we have the optimal supply chain to service our customers & efficiently market our products
Supply chain is under review
Finance Productivity – ensure that we have the optimal funding model to support & grow the business
Funding model is under review
Investments are generally capital light – productivity is now more about execution
For
per
sona
l use
onl
y

13 13
Demand has been Nuts growing for the last 5 years and continues to grow:
Almonds offer a unique matrix of nutrients and have been clearly linked with improved
heart health.
http://www.almonds.com/sites/default/files/content/State%20of%20the%20Science_Almond%20Nutrition%20Research%202013.pdf
Significant promotion by Industry
Programs focused on promoting the nutritional benefits of nuts and
almonds have helped to drive this increased awareness, eg. Almond Board
of California, Almond Board of Australia and Australia’s Nuts for Life
campaign.
Supply until recently has been keeping pace with demand
Better horticultural practices
Higher yields.
Top 5 US marketable crops have been in the last 6 years. ( 2013/4 Equal 2nd)
Global Trends
Consumers are seeking more protein in their diets in the developed and developing world
For
per
sona
l use
onl
y

14 14
Almonds are one of the most affordable protein sources across all food types
Source: Protein Data - Australian Institute of Sport (AIS) . Pricing based on company survey (on-line Australian retail pricing, April 2015).
Demand – Protein Affordability - 2015
For
per
sona
l use
onl
y
15 15
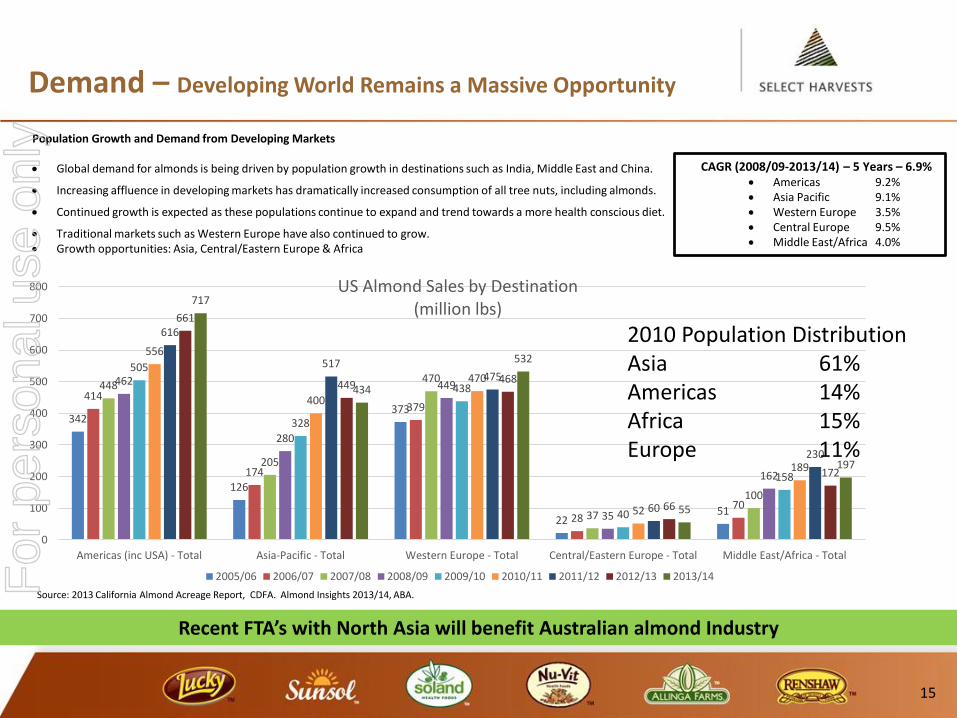
Population Growth and Demand from Developing Markets
Global demand for almonds is being driven by population growth in destinations such as India, Middle East and China.
Increasing affluence in developing markets has dramatically increased consumption of all tree nuts, including almonds.
Continued growth is expected as these populations continue to expand and trend towards a more health conscious diet.
Traditional markets such as Western Europe have also continued to grow. Growth opportunities: Asia, Central/Eastern Europe & Africa
Demand – Developing World Remains a Massive Opportunity
CAGR (2008/09-2013/14) – 5 Years – 6.9% Americas 9.2% Asia Pacific 9.1% Western Europe 3.5% Central Europe 9.5% Middle East/Africa 4.0%
342
126
373
2251
414
174
379
2870
448
205
470
37
100
462
280
449
35
162
505
328
438
40
158
556
400
470
52
189
616
517475
60
230
661
449468
66
172
717
434
532
55
197
0
100
200
300
400
500
600
700
800
Americas (inc USA) - Total Asia-Pacific - Total Western Europe - Total Central/Eastern Europe - Total Middle East/Africa - Total
US Almond Sales by Destination(million lbs)
2005/06 2006/07 2007/08 2008/09 2009/10 2010/11 2011/12 2012/13 2013/14
Source: 2013 California Almond Acreage Report, CDFA. Almond Insights 2013/14, ABA.
2010 Population DistributionAsia 61%Americas 14%Africa 15%Europe 11%
Recent FTA’s with North Asia will benefit Australian almond Industry
For
per
sona
l use
onl
y

16 16
Supply – US Crop 80%+ of global supply
4th largest almond crop in history, following 2nd largest, 3rd largest and the largest - all since 2011/12
912
1,117
1,383
1,614
1,406
1,628
2,020 1,884
2,010 1,870
-
500
1,000
1,500
2,000
2,500
2005/06 2006/07 2007/08 2008/09 2009/10 2010/11 2011/12 2012/13 2013/14 2014/15
US Crop - Volume & Price History
Crop Size (LHS Axis) - '000 000 lbsFor
per
sona
l use
onl
y

17 17
Worldwide demand for almonds has doubled over the past ten years
Global almond production has increased from 900 million pounds in 2000 to 2.4 million pounds in 2015
The increase in global supply represents an averaged increase of 100 million lbs per year over 15 years.
International almond consumption has grown at an average of 11% per annum over the past five years, and 8% over the past decade.
Global Supply & Demand
Country Consumption (gm per capita)
Australia 1,013
Germany 854
USA 700
Middle East 272
China 91
India 53
For
per
sona
l use
onl
y

18 18
US Crop History Analysis
US Domestic Almond Consumption has grown 9 years straight – including the throughout the GFC
Crop Year 2005/06 2006/07 2007/08 2008/09 2009/10 2010/11 2011/12 2012/13 2013/14 2014/15Actual Actual Actual Actual Actual Actual Actual Actual Actual Forecast
Bearing Acres 510,000 610,000 640,000 710,000 750,000 770,000 800,000 820,000 850,000 870,000YOY Growth 20% 5% 11% 6% 3% 4% 2% 4% 2%Non Bearing Acres 100,000 145,000 125,000 115,000 90,000 85,000 75,000 110,000 120,000 150,000Total Acres 610,000 755,000 765,000 825,000 840,000 855,000 875,000 930,000 970,000 1,020,000Bearing to Non Bearing Ratio 19% 16% 14% 11% 10% 9% 12% 12% 15%
Yield (Metric tonnes per acre) 0.7 0.8 1.0 1.0 0.9 1.0 1.2 1.0 1.1 1.0
Crop Size (LHS Axis) - '000 000 lbs 912 1,117 1,383 1,614 1,406 1,628 2,020 1,884 2,010 1,870 YOY Growth 22% 24% 17% (13%) 16% 24% (7%) 7% (7%)Vs Base Growth 22% 52% 77% 54% 79% 122% 107% 120% 105%
Shipments - Total - '000 000 lbs 914 1,066 1,261 1,389 1,472 1,668 1,899 1,867 1,937 2,134 YOY Growth 17% 18% 10% 6% 13% 14% (2%) 4% 10%Vs Base Growth 17% 38% 52% 61% 82% 108% 104% 112% 133%
Shipments - Domestic - '000 000 lbs 304 368 395 411 450 490 547 588 642 693 Shipments - Export - '000 000 lbs 610 698 866 978 1,022 1,178 1,352 1,278 1,296 1,407
Carry Out Stock - '000 000 lbs 231 413 321 254 336 317 350 287 Percentage of Crop 17% 26% 23% 16% 17% 17% 17% 15%Percentage Previous Yr Crop 21% 30% 20% 18% 21% 16% 19% 14%
US Farm Price - US$/lb (RHS Axis) $2.81 $2.06 $1.75 $1.45 $1.65 $1.79 $1.99 $2.58 $2.90 $3.50YOY Growth (27%) (15%) (17%) 14% 8% 11% 30% 12% 21%
Source USDA Position Report
For
per
sona
l use
onl
y

19 19
US Crop History Analysis
Crop Year 2005/06 2006/07 2007/08 2008/09 2009/10 2010/11 2011/12 2012/13 2013/14 2014/15Actual Actual Actual Actual Actual Actual Actual Actual Actual Forecast
Bearing Acres 510,000 610,000 640,000 710,000 750,000 770,000 800,000 820,000 850,000 870,000YOY Growth 20% 5% 11% 6% 3% 4% 2% 4% 2%Non Bearing Acres 100,000 145,000 125,000 115,000 90,000 85,000 75,000 110,000 120,000 150,000Total Acres 610,000 755,000 765,000 825,000 840,000 855,000 875,000 930,000 970,000 1,020,000Bearing to Non Bearing Ratio 19% 16% 14% 11% 10% 9% 12% 12% 15%
Yield (Metric tonnes per acre) 0.7 0.8 1.0 1.0 0.9 1.0 1.2 1.0 1.1 1.0
Crop Size (LHS Axis) - '000 000 lbs 912 1,117 1,383 1,614 1,406 1,628 2,020 1,884 2,010 1,870 YOY Growth 22% 24% 17% (13%) 16% 24% (7%) 7% (7%)Vs Base Growth 22% 52% 77% 54% 79% 122% 107% 120% 105%
Shipments - Total - '000 000 lbs 914 1,066 1,261 1,389 1,472 1,668 1,899 1,867 1,937 2,134 YOY Growth 17% 18% 10% 6% 13% 14% (2%) 4% 10%Vs Base Growth 17% 38% 52% 61% 82% 108% 104% 112% 133%
Shipments - Domestic - '000 000 lbs 304 368 395 411 450 490 547 588 642 693 Shipments - Export - '000 000 lbs 610 698 866 978 1,022 1,178 1,352 1,278 1,296 1,407
Carry Out Stock - '000 000 lbs 231 413 321 254 336 317 350 287 Percentage of Crop 17% 26% 23% 16% 17% 17% 17% 15%Percentage Previous Yr Crop 21% 30% 20% 18% 21% 16% 19% 14%
US Farm Price - US$/lb (RHS Axis) $2.81 $2.06 $1.75 $1.45 $1.65 $1.79 $1.99 $2.58 $2.90 $3.50YOY Growth (27%) (15%) (17%) 14% 8% 11% 30% 12% 21%
10 Year Review Of US Almond Industry
Acreage: Mix between bearing and non bearing consistent, the later years will be impacted by aging orchards retiring
Yields: Australian US yield very similar
Crop Size: Aside from climatic impacts there will be no dramatic to crop, drought impact not clear in 2014/15
Shipments: It would appear crop size has been limiting consumption growth, as all markets steadily growing
Carry Out Stock: 2014/15 will be at the lowest in recent history
Pricing : Pricing behaviour has been rationale like all commodities
80% of supply is produced in California
For
per
sona
l use
onl
y

20 20
SHV- 2015 Crop Update
Harvest Progress Update
100% of crop harvested
Volume Update
13,400 tonnes (In line with previous guidance)
Processing Update
48% of est. crop has been processed
Quality is good as expected
Higher in-shell yields than 2014
Cash receipts have commenced
Price Update
A$11.00/kg
65% of crop committed
Price negotiations with local retailers ongoing
For
per
sona
l use
onl
y

21 21
US Update
ABC May 2015 Position Report – 12 June 2015 - http://www.almonds.com/sites/default/files/content/newsletters/attachments/2015.05posrpt.pdf
2014 US Crop Supply – down 5% - 3rd largest crop ever produced
2014 US Shipments – down 7% (US Domestic shipments – flat, US Export shipments – down 10%)
Forward Commitments – 332 million lbs – up 17% (US domestic – up 27%, US Export – up 11%)
Inventory Impact - Carry-in 1 Aug 2014 - 351 million lbs. Carry-out est. 30 July 2015 – 288 million lbs
Blue Diamond Almonds Market Report - 12 June 2015 - http://www.bdingredients.com/blue-diamond-almonds-market-report-2/
Shipments - “California almond industry shipments in May continue at a pace that exceeds 2014 crop supplies”
Demand Intact - “Strong demand, in the face of rising prices, illustrates the versatility of almond usage and global reach of almond demand”
Pricing - “Pricing will firm in the short-term. Longer term, prices will remain at or above current levels unless the 2015 crop exceeds expectations and late fall / winter precipitation begins to break the drought”
2015 US Crop Forecasts
This crop will be affected by drought
NASS Subjective Forecast - 6 May 2015 – 2015 crop forecast 1.85 Bn pounds
NASS Objective Forecast - 1 July 2015
Early indicators are next year will be similar to last year at best, new plantings impact unknown
No decline in consumption despite historically high prices.
ABC: Almond Board CaliforniaFor
per
sona
l use
onl
y

22 22
Global Supply - US Almond Production & Drought
Too early to understand long term impact – 47% of California in Exceptional Drought @ 9 June 2015
Orange States = Severe DroughtRed States = Extreme DroughtDark Brown States – Exceptional Drought
86% - South Counties % of US Almond Prod’n
14% - North Counties % of US Almond Prod’n
CALIFORNIA’S 3 MAIN WATER SOURCES
Snowpack Groundwater Surface Water (Dams)
Nil - 0% of 1 April Avge (See next slide) State Water Project - 20% Allocation (2/3/15)Central Valley Project - 0% Allocation (27/2/15)
~ 30% of water supply generally held in snowpack ~ 30-60% of water use from groundwater ~ 30% held in dams
For
per
sona
l use
onl
y

23 23
US Ground Water
California Central Valley Groundwater losses are significant, long term and escalating
For
per
sona
l use
onl
y
24 24
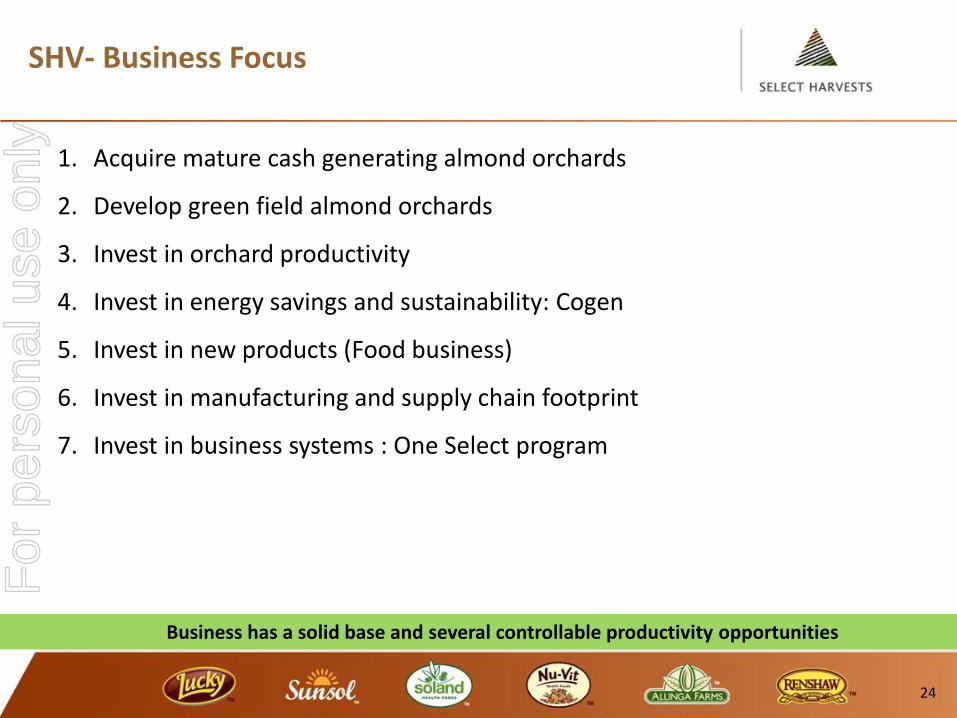
SHV- Business Focus
1. Acquire mature cash generating almond orchards
2. Develop green field almond orchards
3. Invest in orchard productivity
4. Invest in energy savings and sustainability: Cogen
5. Invest in new products (Food business)
6. Invest in manufacturing and supply chain footprint
7. Invest in business systems : One Select program
Business has a solid base and several controllable productivity opportunities
For
per
sona
l use
onl
y

25 25
Thank youPlease direct any queries to:
Paul Thompson Paul Chambers Andrew Angus
Managing Director Chief Financial Officer Investor Relations
+61 3 9474 3544 +61 3 9474 3544 +61 402 823 757
Please note that background material/data regarding the global almond industry can be found on the Select Harvests website - www.selectharvests.com.au
For
per
sona
l use
onl
y

26 26
The business is set to deliver sustainable cash flows
Existing portfolio – 18,000 acres
Circa 13,000 acres almond trees
60% owned, 40% leased
Average age 11 years old
Unplanted land bank of 5,000 acres
Geographically diversified – orchards spread across NSW/VIC/SA
Orchard
Investment in risk mitigation and capex relate productivity is near complete
15,600 MT p.a. crop potential from existing portfolio at maturity: (current maturity profile base: 10-12,000 tonnes)
6,000 MT p.a. crop potential from land bank at maturity
Processing
25,000 MT processing capacity at Carina West plant - hulling & shelling facility
Capex largely sunk to support future capacity
SHV Key Assets - Almond
For
per
sona
l use
onl
y

27 27
Demand – Naturally Good – Popular – Healthy – Sustainable - Synergy
Healthy – Protein, Fibre, Healthy Fats, Essential Nutrients (Vit.E, Magnesium, Calcium, Potassium, Riboflavin, Niacin, Phosphorous, Iron)
http://www.almonds.com/sites/default/files/misc/HP/Documents/unleash_the_crunch_power_of_almonds_final.pdf
Favourite Nut – Rated favourite nut by food professionals due to Taste, Texture & Versatility
http://www.almonds.com/food-professionals/food-service#taste-and-texture
http://www.almonds.com/food-professionals/food-service#versatility
Health Claims – there are significant bodies of work that indicate almonds have legitimate health claims
http://www.almonds.com/sites/default/files/misc/HP/Documents/new_research_provides_more_reasons_to_eat_almonds_fy14.pdf
http://www.almonds.com/pdfs/mediterranean-diet.pdf
http://www.almonds.com/sites/default/files/misc/HP/Documents/almonds-diabetes-your-diet.pdf
http://www.almonds.com/health-professionals/nutrition-and-research#references
Sustainable – There are plenty of reasons to eat more plant-based meals
http://www.almonds.com/sites/default/files/misc/HP/Documents/powerofplantbasedmeals.pdf
Almonds are unique product – desirable, sustainable and healthy for you
For
per
sona
l use
onl
y

28 28
Demand – Synergy
Synergy – Almonds help boost sales of other significant global products (Chocolate, Cereals etc.)
e.g. Chocolate is a large, growth industry (US$107 Billion p.a., 25% growth 2007-12, 27% forecast 2012-17)
65% of chocolate consumers prefer nuts in their chocolate – and their preferred nut is almond
http://www.almonds.com/sites/default/files/content/pages/attachments/almg120208chocolatecollateral.pdf
http://www.almonds.com/almondsandchocolate
Almonds are both a driver & beneficiary of global growth – due to natural attributes & health claims
For
per
sona
l use
onl
y

29 29
Demand - Asia has only Just Started
Source: 2013 California Almond Acreage Report, CDFA. Almond Insights 2013/14, ABA.
USA Export
Shipments
Million lbs % of Total
Shipments
Million lbs % of Total
Shipments
Million lbs % of Total
Shipments
Million lbs % Million lbs %
China 17 2% 133 9% 145 7% 116 696% 128 768%
India 40 4% 84 6% 102 5% 44 110% 62 155%
Middle East/Africa 43 5% 137 9% 178 9% 94 219% 135 314%
Combined Total 99 11% 354 24% 425 21% 255 258% 326 329%
TOTAL SHIPMENTS 914 100% 1,471 1,937 557 61% 1,023 112%
Increase 2005/06 -
20013/14
2005/06 2009/10 2013/14 Increase 2005/06 - 2009/10
For
per
sona
l use
onl
y

30 30
Almonds are the most versatile and highest volume nut, substitution is difficult
Source: Global Statistical Review 2007-2012, International Nut & Dried Fruit Council Foundation (INC), 2013
-
200,000
400,000
600,000
800,000
1,000,000
1,200,000
Almonds Cashews Pistachios (In Shell)
Walnuts Hazelnuts Pecans Pine Nuts Macadamias Brazil Nuts
Ton
ne
sGlobal Tree Nut Production 2006-2012
2006 2007 2008 2009 2010 2011 2012
Almond Share of Global Tree Nut Production2006 2012 Increase
Volume - Tree Nuts 2.77MT 3.41MT 0.64MTVolume - Almonds 0.67MT 1.06MT 0.39MT% of Global Tree Nut Production - Almonds 24% 31%
Supply – Difficult to substitute
For
per
sona
l use
onl
y

31 31
California.
Nearly half of California’s almond orchard is 15 years old or older – (45.2% - 24.5% are 15-19 years old, 20.7% are 20 years or older)
“In spite of ongoing water concerns and high land costs, Rabobank expects California almond growers will continue to increase plantings and total production leading to a rise of about 2% and 3.5% per annum, respectively, over the next decade” – Rabobank April 2015.
55,712
38,300
20,887
0
10,000
20,000
30,000
40,000
50,000
60,000
70,000
80,000
1985 1986 1987 1988 1989 1990 1991 1992 1993 1994 1995 1996 1997 1998 1999 2000 2001 2002 2003 2004 2005 2006 2007 2008 2009 2010 2011 2012 2013
An
nu
al P
lan
tin
g A
rea
(acr
es)
Annual Almond Planting (USA & Australia) - acres
US Australia 5 Year Average (2004-08) 10 Year Average (2004-13) 5 Year Average (2009-13)
Source: 2013 California Almond Acreage Report, CDFA. Almond Insights 2013/14, ABA.
Supply Future
For
per
sona
l use
onl
y

32 32
US Surface Water – June 2015 vs April 2015
US Domestic Shipments
Surface Water Availability is reducing – snow pack is nil and Summer has arrived - water use increasing
For
per
sona
l use
onl
y

33 33
SHV - Almond Division - Risk Mitigation
Area Action
Farming Practices • Empowered farm management• Introduced Harvest guidelines to reduce weather exposure
Management Tools • Great on-farm KPI’s & reporting• Introduction of Leaf Bomb Pressure Test technology
Processing Standards • Re-introduction of LEAN manufacturing processes• Higher quality standards & testing across the business• Pasteuriser commissioned and operational
Labour Skill & Management • Improved training of harvest contractors• Quality & productivity based remuneration for labour
Capex • Investment in pasteuriser & freefall metal detectors • Investment in frost mitigation technology
Orchard Development • Total review of existing orchard potential• Long term development plan inc. plant density & variety
Water • Water purchase for NSW orchards• New water policy - exposure over 3 years (1/3 long term lease, 1/3 annual, 1/3 spot)
Frost mitigation • Installed frost fans on more highly exposed orchards in NSW and VIC
Bees • Long term Bee Supply Agreement - 3 years (Victorian orchards)
Maximise: Yield, Price and Quality
For
per
sona
l use
onl
y
34 34
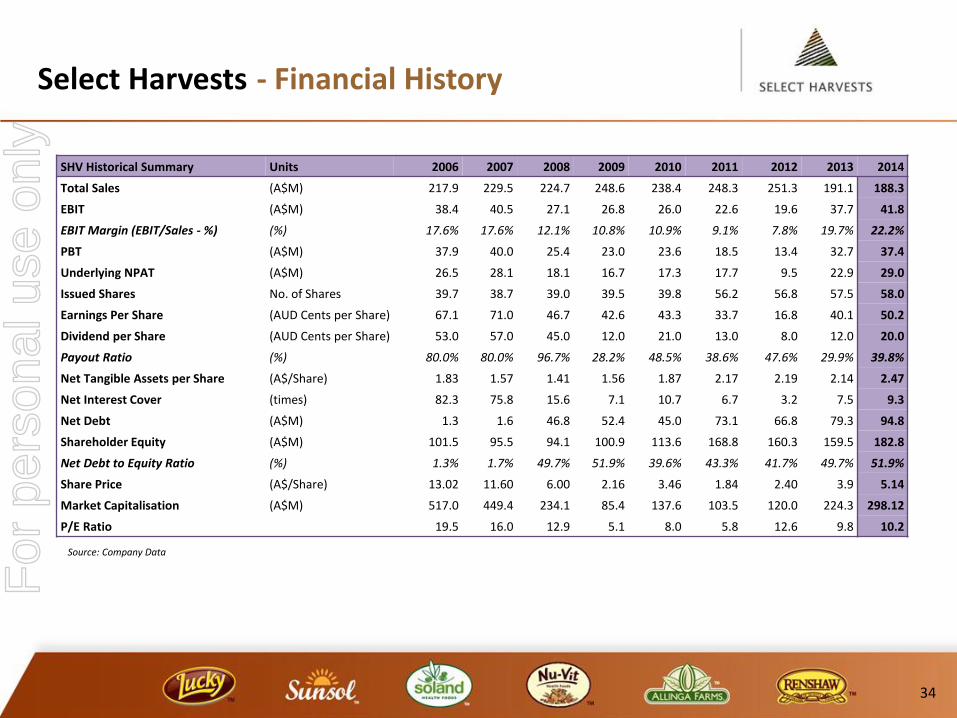
Select Harvests - Financial History
Source: Company Data
SHV Historical Summary Units 2006 2007 2008 2009 2010 2011 2012 2013 2014
Total Sales (A$M) 217.9 229.5 224.7 248.6 238.4 248.3 251.3 191.1 188.3
EBIT (A$M) 38.4 40.5 27.1 26.8 26.0 22.6 19.6 37.7 41.8
EBIT Margin (EBIT/Sales - %) (%) 17.6% 17.6% 12.1% 10.8% 10.9% 9.1% 7.8% 19.7% 22.2%
PBT (A$M) 37.9 40.0 25.4 23.0 23.6 18.5 13.4 32.7 37.4
Underlying NPAT (A$M) 26.5 28.1 18.1 16.7 17.3 17.7 9.5 22.9 29.0
Issued Shares No. of Shares 39.7 38.7 39.0 39.5 39.8 56.2 56.8 57.5 58.0
Earnings Per Share (AUD Cents per Share) 67.1 71.0 46.7 42.6 43.3 33.7 16.8 40.1 50.2
Dividend per Share (AUD Cents per Share) 53.0 57.0 45.0 12.0 21.0 13.0 8.0 12.0 20.0
Payout Ratio (%) 80.0% 80.0% 96.7% 28.2% 48.5% 38.6% 47.6% 29.9% 39.8%
Net Tangible Assets per Share (A$/Share) 1.83 1.57 1.41 1.56 1.87 2.17 2.19 2.14 2.47
Net Interest Cover (times) 82.3 75.8 15.6 7.1 10.7 6.7 3.2 7.5 9.3
Net Debt (A$M) 1.3 1.6 46.8 52.4 45.0 73.1 66.8 79.3 94.8
Shareholder Equity (A$M) 101.5 95.5 94.1 100.9 113.6 168.8 160.3 159.5 182.8
Net Debt to Equity Ratio (%) 1.3% 1.7% 49.7% 51.9% 39.6% 43.3% 41.7% 49.7% 51.9%
Share Price (A$/Share) 13.02 11.60 6.00 2.16 3.46 1.84 2.40 3.9 5.14
Market Capitalisation (A$M) 517.0 449.4 234.1 85.4 137.6 103.5 120.0 224.3 298.12
P/E Ratio 19.5 16.0 12.9 5.1 8.0 5.8 12.6 9.8 10.2
For
per
sona
l use
onl
y

35 35
Almond Pre-Cleaner & Crop Dryer
Alvin Blanch Grain Dryer
Re-located Pre-Cleaner
Background In 2014, Carina West Processing Plant received 56% of field product with a
hull moisture level higher than the desired 15% moisture This impacted quality, efficiency and cost
Solution Install Almond Pre-Cleaner and Crop Dryer Reduces moisture by 5% each pass Installation Cost: $770k Payback years: 0.9 Drying Capacity: 20MT/h Field Weight 1st dryer of its kind used to dry almonds Commissioned January 2015
Specifications Dryer Model: Alvan Blanch DF26500 Dryer Type: ‘Double Flow’ inclined bed continuous flow Fuel: Diesel or steam with heat exchangers Furnace: 2 x 800kw 2 stage Riello RS70 diesel pressure jet burners Heat Exchangers: 2 x 2t/hr steam at 8.5 bar
For
per
sona
l use
onl
y

36 36
Project H2E – Hull to Energy
Operational Highlights Fuel source: almond hull & shell and field prunings Fuel consumed: 3.66T/hr - 30,000T/YR Power delivered direct to CW Processing Plant + Carina Dams Excess power delivered into local grid Operational Hours : 24hr x 7days x 48 weeks Operators Employed : 8
Specifications Vyncke 17MW thermal biomass boiler Siemens 2.8MWe SST-110 turbine Fuel feed system - moving floor type Emission control - multi cyclone Flue gas stack - 30m carbon steel Capital investment - AUD$9.2m
“Abates 23,645 tonnes of greenhouse gas emissions equivalent to
removing 8,210 cars off the road”
“Provides enough energy to power 2984 homes”
Stage 1
Bundle Carina West Processing + Carina Dam 1 + Carina Dam 2 by laying connecting cable into one meter point thereby lowering the maximum demand charge between the 3
Convert all Victorian low voltage transformers greater than 1MWe to high voltage, thereby realising significant supply costs reduction
Capital Investment – AUD$1.93
Complete March 2015
Stage 2
Install a biomass boiler/turbine power plant to directly supply electricity and steam to Carina West Processing Plant + Carina Dam 1 + Carina Dam 2 and indirectly off-set costs across SHV (other farms and TT) with remaining generated power.
Capital investment - AUD$9.67m
Complete Q1 2016
Project H2E will reduce Carina West total running costs by 20%
For
per
sona
l use
onl
y
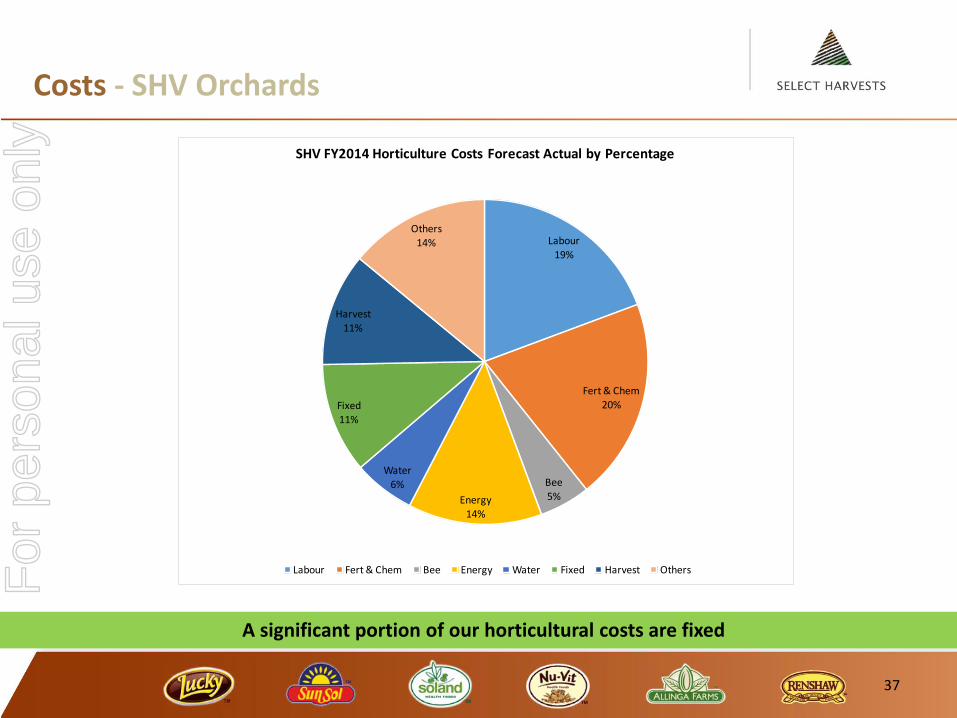
Costs - SHV Orchards
A significant portion of our horticultural costs are fixed
37
Labour
19%
Fert & Chem
20%
Bee5%Energy
14%
Water6%
Fixed
11%
Harvest11%
Others14%
SHV FY2014 Horticulture Costs Forecast Actual by Percentage
Labour Fert & Chem Bee Energy Water Fixed Harvest OthersFor
per
sona
l use
onl
y

38 38
Recent New Product Development - Packaged Food
For
per
sona
l use
onl
y

39 39
Recent New Product Development - Trading & Industrial
For
per
sona
l use
onl
y

40 40
Global Demand – Diverse. High Growth
Almonds have held the No.1 position in global tree nut innovations since 2006 (35% market share 2013).
Long term US per capita consumption of almond outpaces all other tree nuts (376% growth since 1980)
For
per
sona
l use
onl
y
41 41
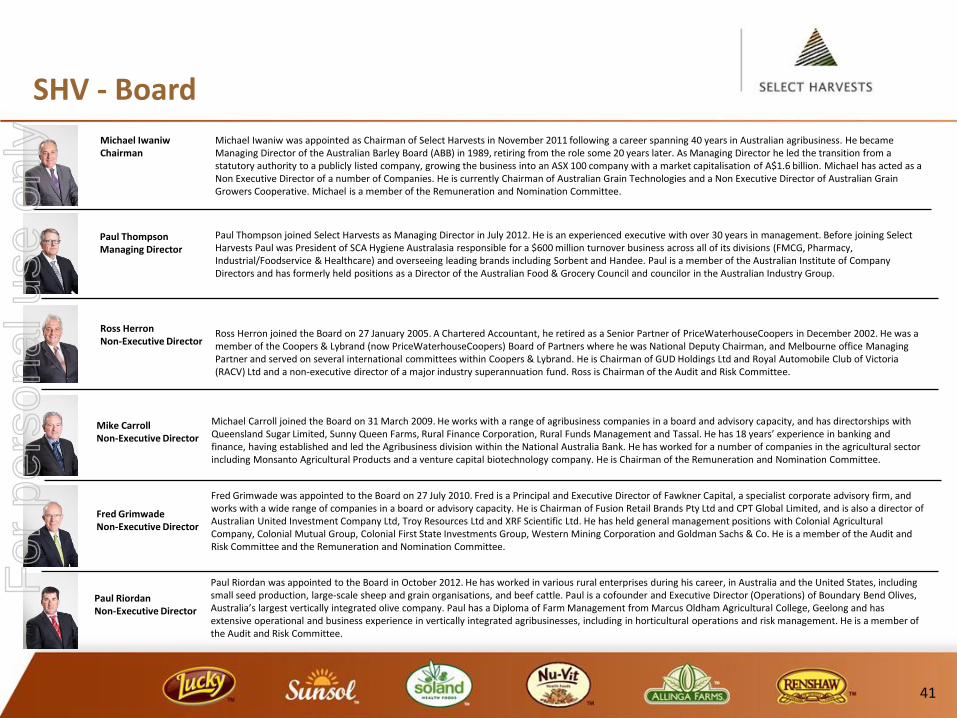
SHV - Board
Michael Iwaniw was appointed as Chairman of Select Harvests in November 2011 following a career spanning 40 years in Australian agribusiness. He became Managing Director of the Australian Barley Board (ABB) in 1989, retiring from the role some 20 years later. As Managing Director he led the transition from a statutory authority to a publicly listed company, growing the business into an ASX 100 company with a market capitalisation of A$1.6 billion. Michael has acted as a Non Executive Director of a number of Companies. He is currently Chairman of Australian Grain Technologies and a Non Executive Director of Australian Grain Growers Cooperative. Michael is a member of the Remuneration and Nomination Committee.
Michael IwaniwChairman
Paul Thompson joined Select Harvests as Managing Director in July 2012. He is an experienced executive with over 30 years in management. Before joining Select Harvests Paul was President of SCA Hygiene Australasia responsible for a $600 million turnover business across all of its divisions (FMCG, Pharmacy, Industrial/Foodservice & Healthcare) and overseeing leading brands including Sorbent and Handee. Paul is a member of the Australian Institute of Company Directors and has formerly held positions as a Director of the Australian Food & Grocery Council and councilor in the Australian Industry Group.
Ross Herron joined the Board on 27 January 2005. A Chartered Accountant, he retired as a Senior Partner of PriceWaterhouseCoopers in December 2002. He was a member of the Coopers & Lybrand (now PriceWaterhouseCoopers) Board of Partners where he was National Deputy Chairman, and Melbourne office Managing Partner and served on several international committees within Coopers & Lybrand. He is Chairman of GUD Holdings Ltd and Royal Automobile Club of Victoria (RACV) Ltd and a non-executive director of a major industry superannuation fund. Ross is Chairman of the Audit and Risk Committee.
Paul ThompsonManaging Director
Michael Carroll joined the Board on 31 March 2009. He works with a range of agribusiness companies in a board and advisory capacity, and has directorships with Queensland Sugar Limited, Sunny Queen Farms, Rural Finance Corporation, Rural Funds Management and Tassal. He has 18 years’ experience in banking and finance, having established and led the Agribusiness division within the National Australia Bank. He has worked for a number of companies in the agricultural sector including Monsanto Agricultural Products and a venture capital biotechnology company. He is Chairman of the Remuneration and Nomination Committee.
Fred Grimwade was appointed to the Board on 27 July 2010. Fred is a Principal and Executive Director of Fawkner Capital, a specialist corporate advisory firm, and works with a wide range of companies in a board or advisory capacity. He is Chairman of Fusion Retail Brands Pty Ltd and CPT Global Limited, and is also a director of Australian United Investment Company Ltd, Troy Resources Ltd and XRF Scientific Ltd. He has held general management positions with Colonial Agricultural Company, Colonial Mutual Group, Colonial First State Investments Group, Western Mining Corporation and Goldman Sachs & Co. He is a member of the Audit and Risk Committee and the Remuneration and Nomination Committee.
Paul Riordan was appointed to the Board in October 2012. He has worked in various rural enterprises during his career, in Australia and the United States, including small seed production, large-scale sheep and grain organisations, and beef cattle. Paul is a cofounder and Executive Director (Operations) of Boundary Bend Olives, Australia’s largest vertically integrated olive company. Paul has a Diploma of Farm Management from Marcus Oldham Agricultural College, Geelong and has extensive operational and business experience in vertically integrated agribusinesses, including in horticultural operations and risk management. He is a member of the Audit and Risk Committee.
Ross HerronNon-Executive Director
Mike CarrollNon-Executive Director
Fred GrimwadeNon-Executive Director
Paul RiordanNon-Executive Director
For
per
sona
l use
onl
y

42 42
SHV – Executive Team
Joined Select Harvests as Chief Financial Officer and Company Secretary in September 2007. He is a Chartered Accountant and has over 25 years experience in senior financial management roles in Australian and European organisations, including corporate positions with the Fosters Group, and Henkel Australia and New Zealand.
Paul ChambersCFO & Company Secretary
Laurence joined Select Harvests in 2000. Laurence has over 20 years’ experience in trading edible nuts and dried fruits. He has a comprehensive knowledge of international trade and deep insights into the trading cultures of the various countries in which these commodities are sold. He has held senior purchasing and sales management positions with internationally recognised companies.
Peter joined Select Harvests in 1999. Peter held the position of Plant and then Project Manager for the processing area of the Almond Division, before being appointed to the role of General Manager Processing in July 2012. Prior to joining Select Harvests, Peter ran his own maintenance and fabrication business servicing agriculture, mining and heavy industry.
Laurence Van DrielGM Trading & Industrial
Carolyn joined Select Harvests in November 2014. She has acquired comprehensive Human Resource experience with past roles in the following organisations: CSL Ltd, Colonial Mutual and more recently The Nuance Group. She is a dedicated HR professional with strong leadership, strategic insight and operational skills.
Bruce joined Select Harvests in 2012. With a deep working knowledge of complex ‘end to end’ supply chains, Bruce has been a highly successful contributor within the executive management teams of large-scale corporates across food production, apparel, industry consumables and suppliers to automotive industries. Prior to joining Select Harvests he was Operations Director at Kraft Foods, CEO of Bizwear & Alert Safety and Director Supply, ANZ at SCA Hygiene Australasia.
Mark joined Select Harvests in 2012. Mark has strong FMCG experience across branded, private label and commodity products with track record of driving profitable sales growth. He joins Select Harvests from SCA Hygiene where he was the Director of Sales and Marketing, Consumer. He was previously General Manager –Marketing, Sales and Innovation at Bulla Dairy Foods.
Peter RossGM Horticulture
Carolyn BarbutoGM Human Resources
Bruce van TwestGM Operations
Mark EvaGM Sales & Marketing - Consumer Products
For
per
sona
l use
onl
y
Top Related