


Languages
Pages
Legal


Monitoring of Platform31," EnergySprong" projects
Wouter Borsboom, TNO
"Monitoring results nearly and net energy dwellings".
Thanks to Platform31 team: Ivo Opstelten, Niels Sijpheer Jeffrey Mennen and TNO: Marcel van Vliet, Piet Jacobs, Peter de Jong, RIGO: Kees Leidelmeijer, Esther Cozijnsen and Van Beek: Erik de Liege, and Impromet.
Wouter Borsboom, Monitoring results NZEB
2
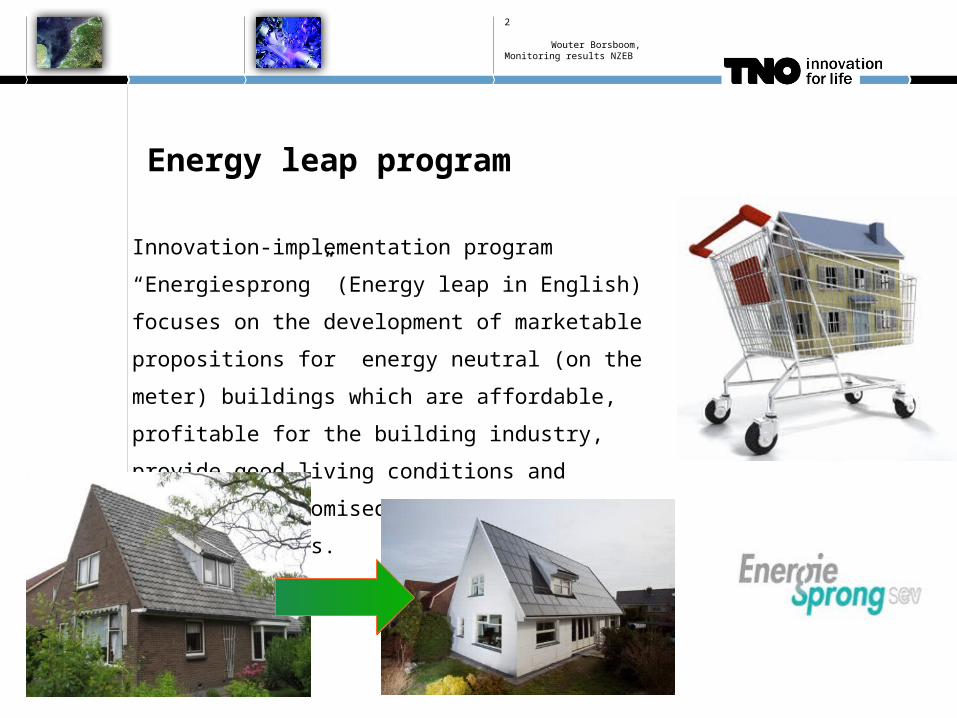
Energy leap program
Innovation-implementation program “Energiesprong”
(Energy leap in English) focuses on the development
of marketable propositions for energy neutral (on the
meter) buildings which are affordable, profitable for the
building industry, provide good living conditions and
realize the promised performance characteristics.

Wouter Borsboom, Monitoring results NZEB
3
Monitoring program Energy leap
Integral monitoring of demonstration projects is an important part of this
program. 200 dwellings including Net Zero Energy will be monitored by:
Smart meters gas
Smart meters electricity
Temperatures living room, sleeping room
Outdoor climate (through weather stations)
Questionnaires
Blowerdoor, infrared, inspections
.

Wouter Borsboom, Monitoring results NZEB
4
Can we built comfortable Net Zero Energy dwellings at a reasonable price, and of good quality which perform as promised?

Wouter Borsboom, Monitoring results NZEB
5
Comfort: Simulation shows possible overheating in many concepts
Air tight + heat recovery Air tight and heat recovery
Kerkrade Passive house renovation + night ventilation + overhang
Rc value Facade
Pri
mar
y E
ne
rgy
de
man
d M
J/y
ear

Wouter Borsboom, Monitoring results NZEB
6
Example 1: no passive cooling measures
Montferland
Floor, Roof, Façade insulation of Rc=6
Heating: Combination of gas boiler and air/water heat pump
No passive cooling, some houses have active cooling (heat pump)
Survey: 58 % satisfying temperatures in the bed rooms during the
summer, 8% too hot, 17 % sometimes to hot and 17% fluctuating
temperatures.
Wouter Borsboom, Monitoring results NZEB
7
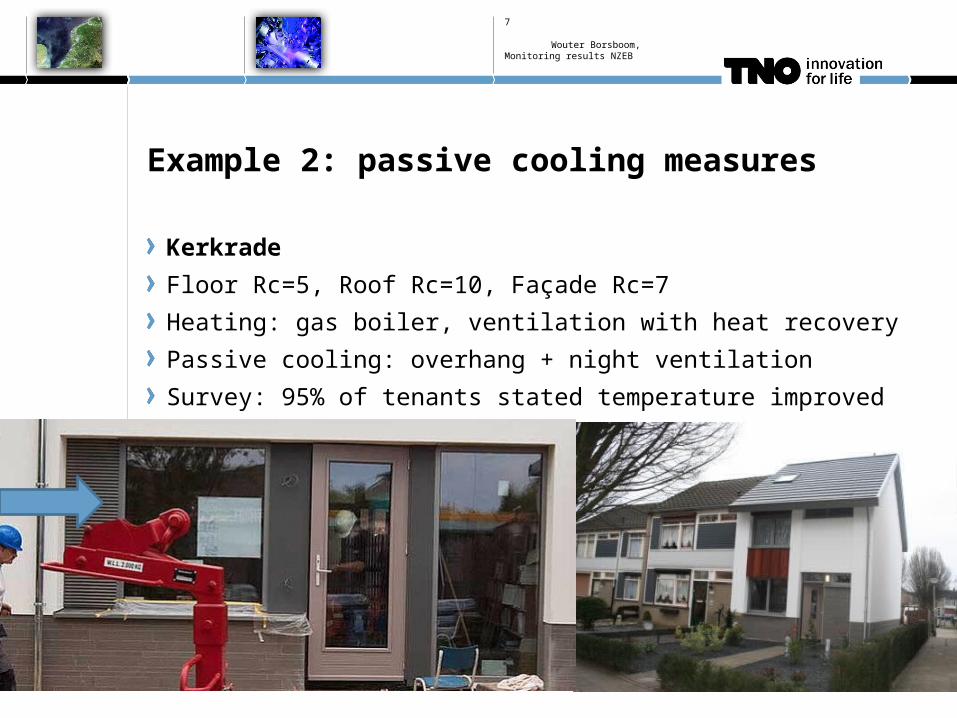
Example 2: passive cooling measures
Kerkrade
Floor Rc=5, Roof Rc=10, Façade Rc=7
Heating: gas boiler, ventilation with heat recovery
Passive cooling: overhang + night ventilation
Survey: 95% of tenants stated temperature improved after renovation
Wouter Borsboom, Monitoring results NZEB
8
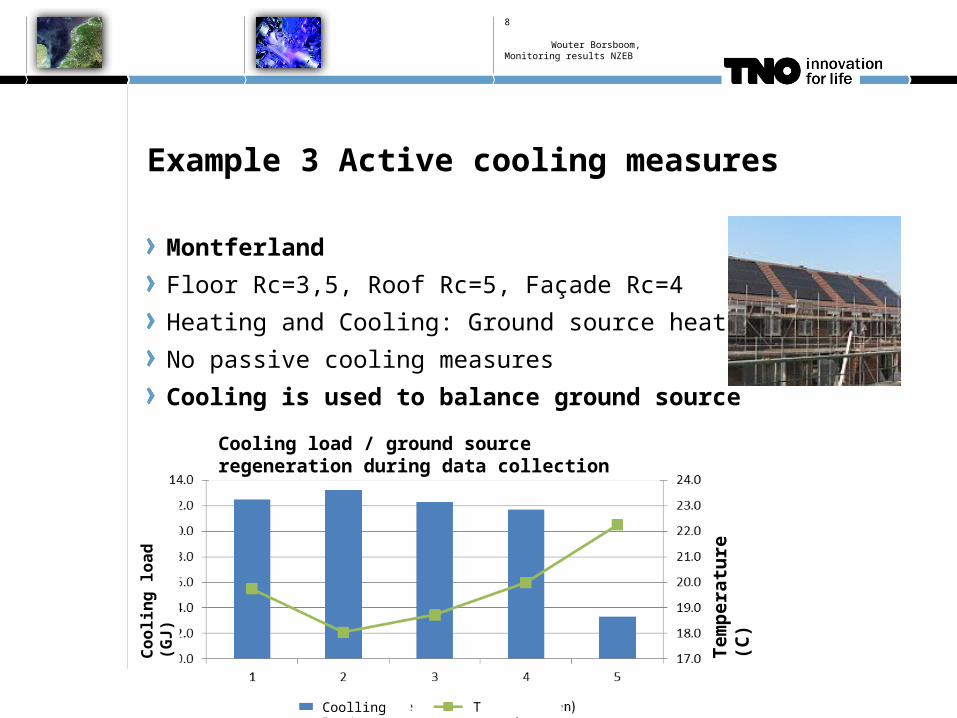
Example 3 Active cooling measures
Montferland
Floor Rc=3,5, Roof Rc=5, Façade Rc=4
Heating and Cooling: Ground source heat pump
No passive cooling measures
Cooling is used to balance ground source
Coolling load T setpoint
Cooling load / ground source regeneration during data collection
Co
oli
ng
lo
ad
(G
J)
Tem
per
atu
re (
C)
Wouter Borsboom, Monitoring results NZEB
9
Summer comfort is possible in NZEB dwellings
A good strategy has to be chosen:• Passive measures to prevent cooling load or• In case of ground source heat pump cooling can be used to
balance the ground source.
Wouter Borsboom, Monitoring results NZEB
10
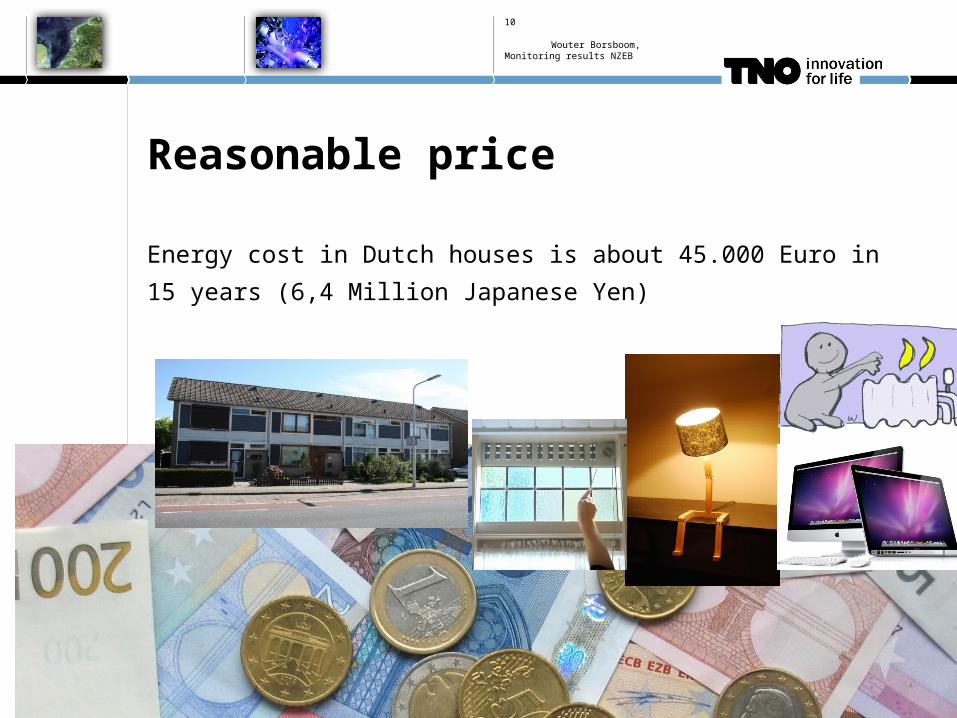
Reasonable price
Energy cost in Dutch houses is about 45.000 Euro in 15 years (6,4
Million Japanese Yen)

Wouter Borsboom, Monitoring results NZEB
11
Development in retrofitting
Time
130.000
100.000
80.000
Zero on the meter
Inte
gral
ren
ovat
ion
cost
s in
cl. V
AT
Roosendaal 2010
60.000
Kerkrade 2011
Apeldoorn 2012

Wouter Borsboom, Monitoring results NZEB
12
Energy related costs renovation Energy leap projects
Primairy Energy use (GJ/m2)
En
erg
y re
late
d c
ost
s

13
First Results Rijswijk Buiten (NOM)
Wouter Borsboom, Monitoring results NZEB
Dwelling Use (meter)
Supply (meter) Difference
Yield PV Actual use
A 2342 -3122 -780 3200 2420
B 2328 -3079 -751 3600 2849
C 1639 -3333 -1694 3500 1806
D 2087 -3141 -1054 3400 2346
E 3135 -3011 +124 3400 3524
PV + Ground source heat pump + energy efficient appliancesEnergy use and supply in kWh after about 11 months:
Dwelling E: High set point temperature of 23,5 °C
Net zero energy seems possible in the current year.Homeowner pays Klimaatgarant about 100 Euro/month for 25 years of proper functioning of the installations.
14
Wouter Borsboom, Monitoring results NZEB
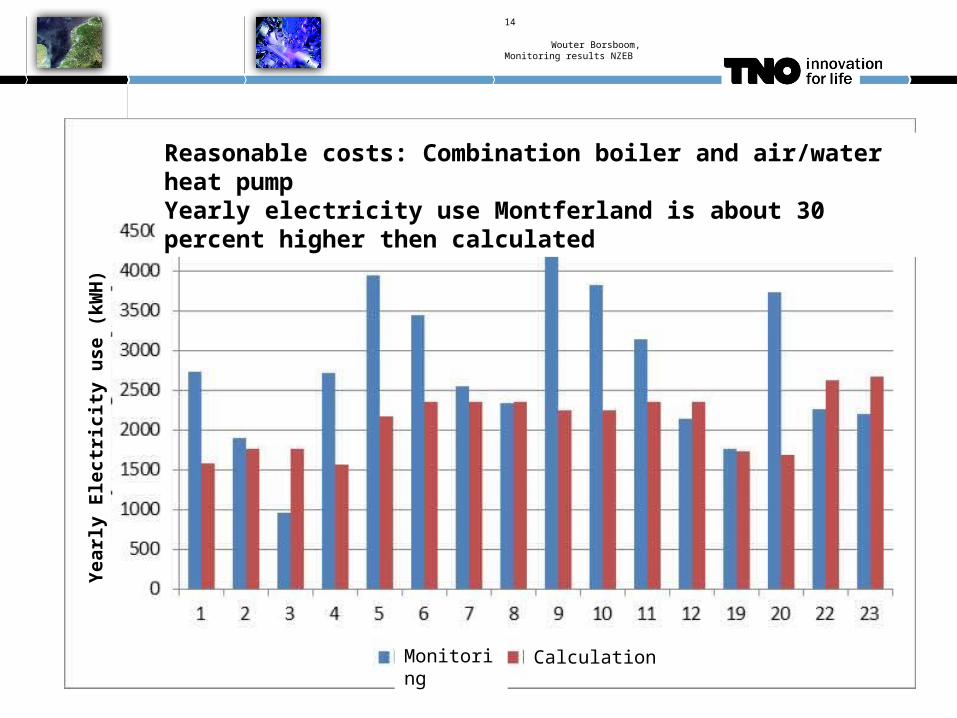
Reasonable costs: Combination boiler and air/water heat pumpYearly electricity use Montferland is about 30 percent higher then calculated
CalculationMonitoring
Yea
rly
Ele
ctri
city
use
(kW
H)

Wouter Borsboom, Monitoring results NZEB
15
Electricity costs for some houses are much higher
Differences in electricity use design versus monitoring is on average
30%, in individual cases up to 90%.
This leads to some cases of a higher use of 2000 kWh more and 37
Euro/month extra. (5300 Yen/month)
Interesting to evaluate the performance of the air/water heat pump
and user influence (opening of windows etc).
16
Wouter Borsboom, Monitoring results NZEB
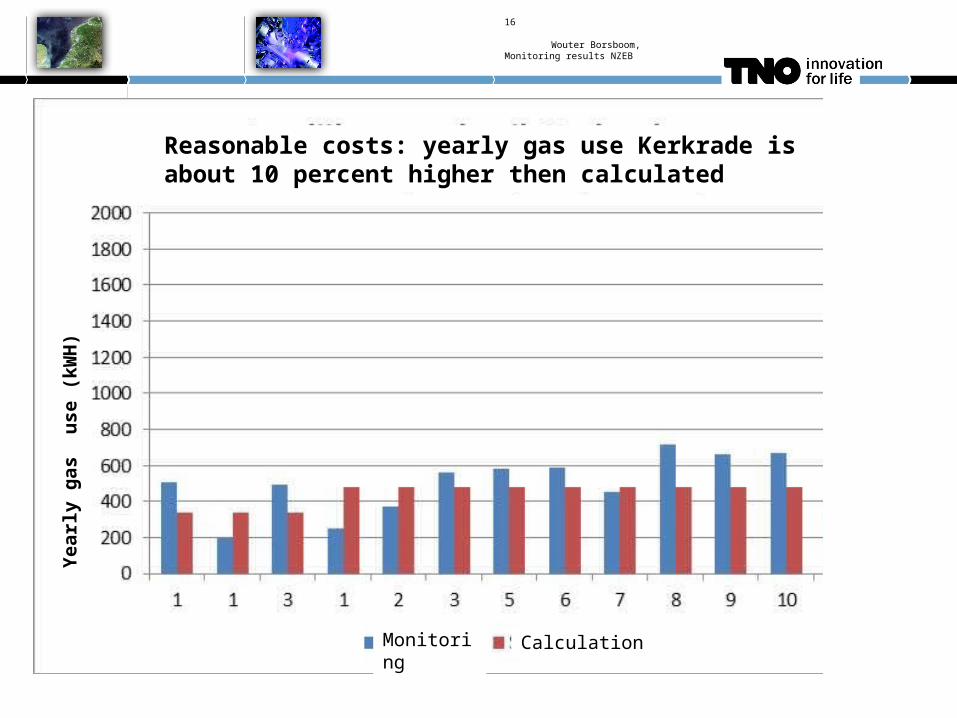
Reasonable costs: yearly gas use Kerkrade is about 10 percent higher then calculated
CalculationMonitoring
Yea
rly
gas
u
se (
kW
H)
Wouter Borsboom, Monitoring results NZEB
17
Gas costs for some houses are higher in Kerkrade
Average difference between calculation and monitoring is about 10
percent.
Individual cases of 230 m³/year and 12 Euro/month (1712 yen/month
Possible explanation is window use

Wouter Borsboom, Monitoring results NZEB
18
Analyse window use Kerkrade
Windows are observed during winter for a month at 10:00, 13:00 and 17:00
Average open windows per dwelling during observation
Gas
use
dur
ing
win
ter
time
(m3 )

Wouter Borsboom, Monitoring results NZEB
19
New wireless sensor sets will be used in other projects
Server

Wouter Borsboom, Monitoring results NZEB
20
Possible explanation window use
Temperature can be maintained by gas boiler
Complaints ventilation system leads to low ventilation rates (1/3
dissatisfied tenants)
Recirculation cooker hoods can explain use of doors during cooking
This can lead to higher energy bills (up to 150 Euro (21000 Yen) a
year, for low income tenants.
Wouter Borsboom, Monitoring results NZEB
21
Reasonable costs seems possible in the near future
First results of NOM project “Rijswijk Buiten” looks positive.
Be careful towards low income tenants. Rents are raised in some
projects beyond the saving of energy costs after renovation because
of the improved quality. Net income is already low, and energy costs
can fluctuate on an individual base. In Kerkrade 63 percent is satisfied
with the rent, 35 percent states that it is too much.

Wouter Borsboom, Monitoring results NZEB
22
How to control quality: Built Transparantly (Bouwtransparant) (NL)
Check of the Energy performance calculationNear Infrared picturesBlower door and smoke testsVentilation FlowIndicative noise measurementTools for assessment of construction mistakes Estimation Energy losses
Wouter Borsboom, Monitoring results NZEB
23
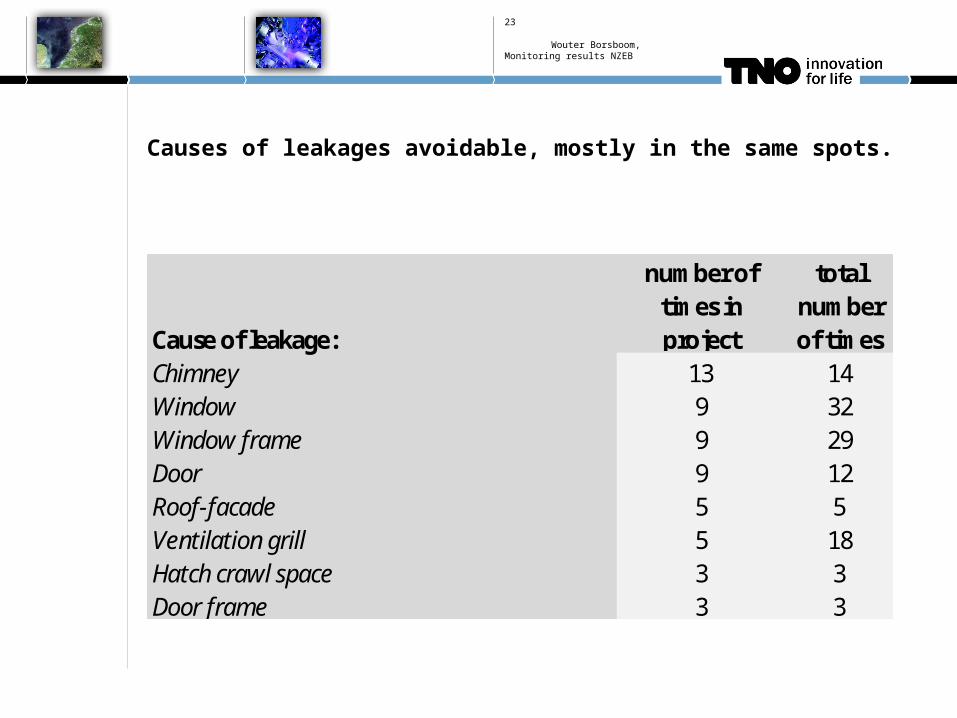
Causes of leakages avoidable, mostly in the same spots.
Cause of leakage:
number of times in project
total number of times
Chimney 13 14Window 9 32Window frame 9 29Door 9 12Roof-facade 5 5Ventilation grill 5 18Hatch crawl space 3 3Door frame 3 3
Results in 13 nearly zero energy projects
Wouter Borsboom, Monitoring results NZEB
24
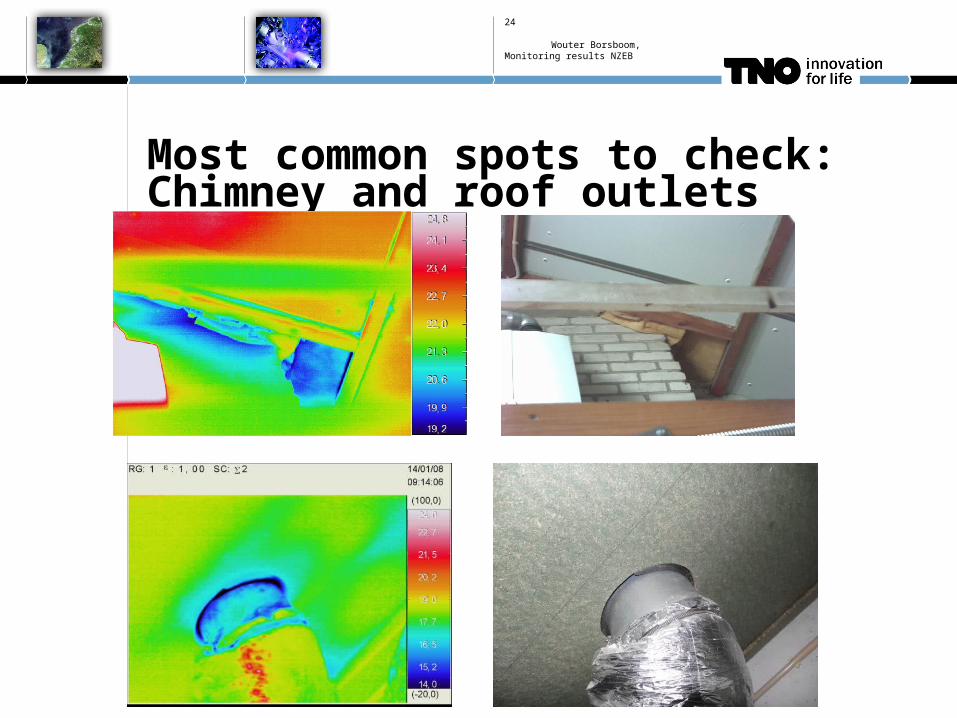
Most common spots to check: Chimney and roof outlets
Wouter Borsboom, Monitoring results NZEB
25
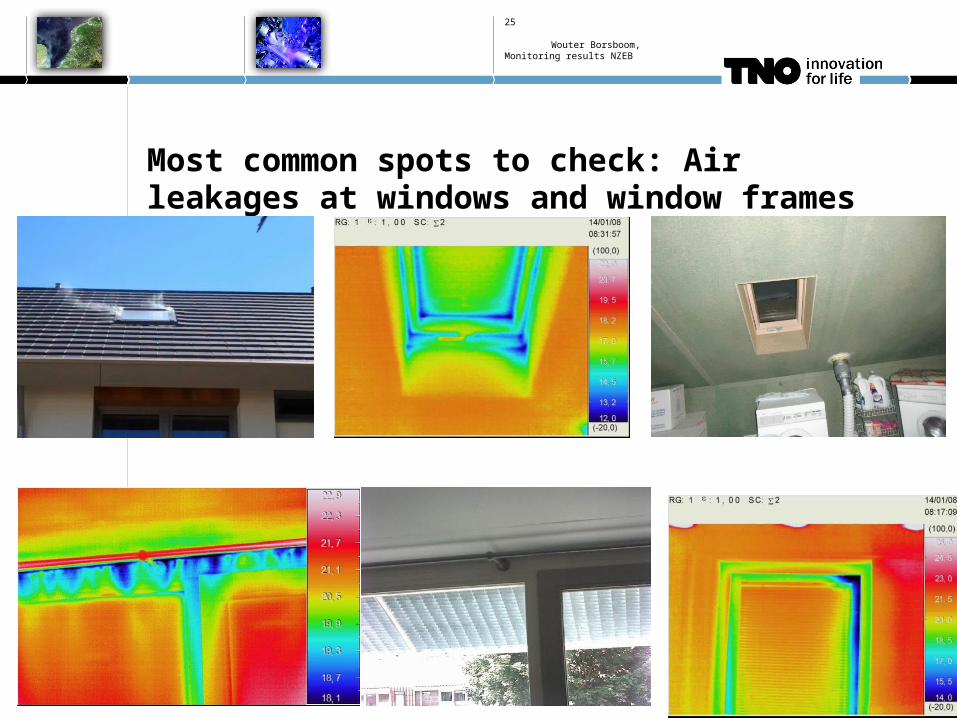
Most common spots to check: Air leakages at windows and window frames

Wouter Borsboom, Monitoring results NZEB
26
Typical distribution of leakages

Wouter Borsboom, Monitoring results NZEB
27
No obvious relations between number of leakages, types of leakages or building mistakes
Dwelling# types of leakage
total # leakages
measured ACH 50
Specification ACH
Renovation/ new
types of BIOM #
1 7 7 14,6 renovation 152 7 30 12 renovation 53 2 3 8 renovation4 5 5 7,9 renovation5 7 9 6 renovation6 3 4 5,6 renovation7 4 5 2,6 0,6 new 88 5 17 2,5 1,7 new 49 6 15 2,2 1,7 new 810 2 4 2 0,6 new 1211 3 7 1,8 0,6 new 1212 4 8 1,8 new 513 6 8 1,45 new 7
Wouter Borsboom, Monitoring results NZEB
28
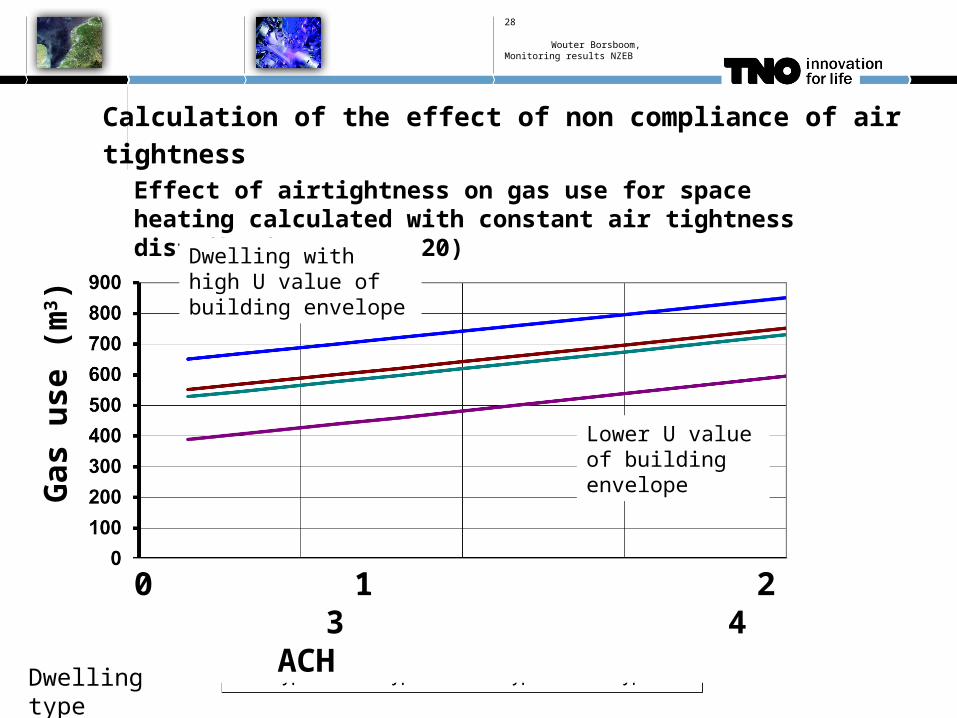
Effect of airtightness on gas use for space heating calculated with constant air tightness distribution (NEN 7120)
Gas
use
(m
3)
0 1 2 3 4ACH
Dwelling with high U value of building envelope
Lower U value of building envelope
Dwelling type
Calculation of the effect of non compliance of air tightness

Wouter Borsboom, Monitoring results NZEB
29
There is a clear need for quality control
Higher infiltration can not only lead to more energy use but also a
need for more installed power for heating or cooling.
There are also other reasons for quality control: proper functioning
of the building and installation and prevention of cold spots
which can lead to moisture and mould (mold) grow.
Wouter Borsboom, Monitoring results NZEB
30
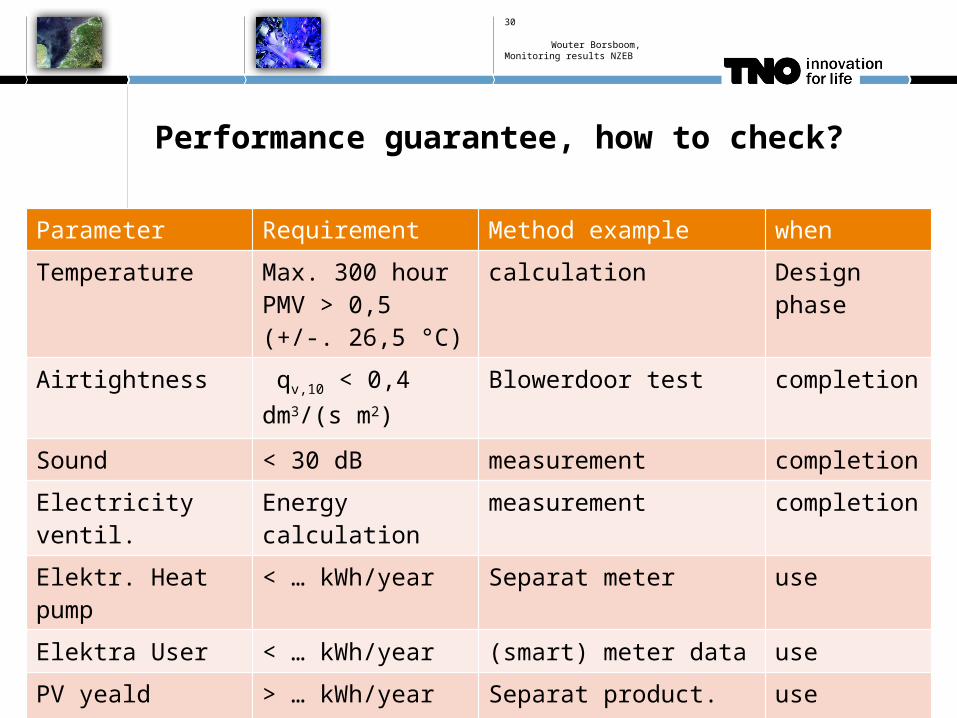
Performance guarantee, how to check?
Parameter Requirement Method example when
Temperature Max. 300 hour PMV > 0,5 (+/-. 26,5 °C)
calculation Design phase
Airtightness qv,10 < 0,4 dm3/(s m2)
Blowerdoor test completion
Sound < 30 dB measurement completion
Electricity ventil. Energy calculation measurement completion
Elektr. Heat pump < … kWh/year Separat meter use
Elektra User < … kWh/year (smart) meter data use
PV yeald > … kWh/year Separat product. meter use
Heat loss coef. < … W/K Smart meter data use
Dom. Hot water < … GJ/year Smart meter data use
Wouter Borsboom, Monitoring results NZEB
31
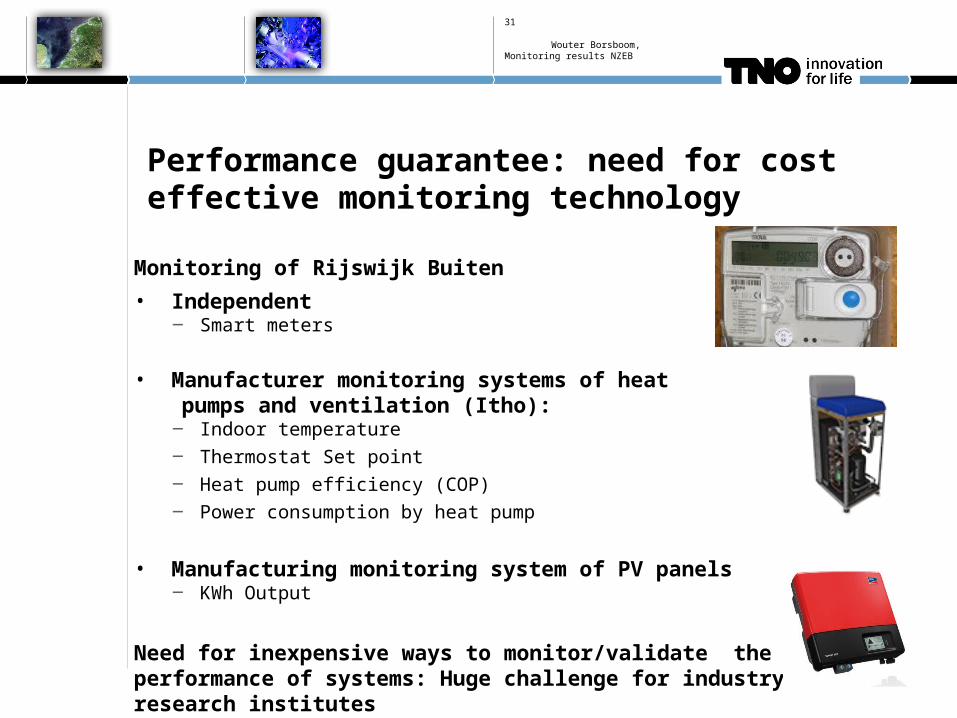
Performance guarantee: need for cost effective monitoring technology
Monitoring of Rijswijk Buiten
• Independent‒ Smart meters
• Manufacturer monitoring systems of heat pumps and ventilation (Itho):
‒ Indoor temperature
‒ Thermostat Set point
‒ Heat pump efficiency (COP)
‒ Power consumption by heat pump
• Manufacturing monitoring system of PV panels‒ KWh Output
Need for inexpensive ways to monitor/validate the performance of systems: Huge challenge for industry and research institutes

Wouter Borsboom, Monitoring results NZEB
32
Heating demand and COP based on manufacturer performance monitoring “Rijswijk Buiten”
Outside temperature above 0 °C
Heat supply (year)
He
at s
up
ply
(GJ
)
COP during data collection
COP DHWCOP SH
Wouter Borsboom, Monitoring results NZEB
33
We can built satisfying NZEB dwellings at a reasonable price, with comfort and of good quality which are reliable in the near future. But we have to learn by doing
Thanks for your attention
Top Related