


Languages
Pages
Legal


UPPSALA DISSERTATIONS IN MATHEMATICS
96
Department of MathematicsUppsala University
UPPSALA 2016
Modelling collective movement andtransport network formation in living systems
Arianna Bottinelli

Dissertation presented at Uppsala University to be publicly examined in Häggsalen,Ångströmslaboratoriet, Lägerhyddsvägen 1, Uppsala, Friday, 25 November 2016 at 09:15 forthe degree of Doctor of Philosophy. The examination will be conducted in English. Facultyexaminer: Professor Renaud Lambiotte (University of Namur).
AbstractBottinelli, A. 2016. Modelling collective movement and transport network formation inliving systems. Uppsala Dissertations in Mathematics 96. 56 pp. Uppsala: Department ofMathematics. ISBN 978-91-506-2599-8.
The emergence of collective patterns from repeated local interactions between individuals isa common feature to most living systems, spanning a variety of scales from cells to animalsand humans. Subjects of this thesis are two aspects of emergent complexity in living systems:collective movement and transport network formation. For collective movement, this thesisstudies the role of movement-mediated information transfer in fish decision-making. Thesecond project on collective movement takes inspiration from granular media and soft modeanalysis and develops a new approach to describe the emergence of collective phenomenafrom physical interactions in extremely dense crowds. As regards transport networks, thisthesis proposes a model of network growth to extract simple, biologically plausible rules thatreproduce topological properties of empirical ant trail networks. In the second project ontransport networks, this thesis starts from the simple rule of “connecting each new node tothe closest one”, that describes ants building behavior, to study how balancing local buildingcosts and global maintenance costs influences the growth and topological properties of transportnetworks. These projects are addressed through a modeling approach and with the aim ofidentifying minimal sets of basic mechanisms that are most likely responsible of large-scalecomplex patterns. Mathematical models are always based on empirical observations and are,when possible, compared to experimental data.
Keywords: animal collective behaviour, transport networks, crowd dynamics, complexsystems, ants, fish
Arianna Bottinelli, Applied Mathematics and Statistics, Box 480, Uppsala University,SE-75106 Uppsala, Sweden.
© Arianna Bottinelli 2016
ISSN 1401-2049ISBN 978-91-506-2599-8urn:nbn:se:uu:diva-303943 (http://urn.kb.se/resolve?urn=urn:nbn:se:uu:diva-303943)

Essentially, all models are wrong,but some are useful.
George E. P. Box


List of papers
This thesis is based on the following papers, which are referred to in the text
by their Roman numerals.
I A. Bottinelli, A. Perna, A Ward, D.J.T. Sumpter. How do fish use the
movement of other fish to make decisions? Proceedings of theEuropean Conference on Complex Systems 2012. Springer
International Publishing (2013)
II A. Bottinelli, E. van Wilgenburg, D.J.T. Sumpter, T. Latty. Local cost
minimization in ant transport networks: from small-scale data to
large-scale tradeoffs. J. R. Soc. Interface, 12 20150780 (2015)
III A. Bottinelli, R. Louf, M. Gherardi. Optimal tradeoffs between
building and maintenance costs in growing transport networks.
arXiv:1609.06470 [physics.soc-ph], in review, (2016).
IV A. Bottinelli, D.J.T. Sumpter, J.L. Silverberg. Emergent Structural
Mechanisms for High-Density Collective Motion Inspired by Human
Crowds. arXiv:1606.08835 [physics.soc-ph], in review, (2016).
Reprints were made with permission from the publishers.


Contents
1 Introduction . . . . . . . . . . . . . . . . . . . . . . . . . . . . . . . . . . . . . . . . . . . . . . . . . . . . . . . . . . . . . . . . . . . . . . . . . . . . . . . . . . . . . . . . . . . . . . . . . . 9
2 Background: a brief excursion in the field of complexity and collective
behaviour . . . . . . . . . . . . . . . . . . . . . . . . . . . . . . . . . . . . . . . . . . . . . . . . . . . . . . . . . . . . . . . . . . . . . . . . . . . . . . . . . . . . . . . . . . . . . . . . . . . . 11
3 Modelling Living Systems . . . . . . . . . . . . . . . . . . . . . . . . . . . . . . . . . . . . . . . . . . . . . . . . . . . . . . . . . . . . . . . . . . . . . . . . 14
3.1 Modelling Collective Motion . . . . . . . . . . . . . . . . . . . . . . . . . . . . . . . . . . . . . . . . . . . . . . . . . . . . . . . . 16
3.1.1 The Vicsek Model . . . . . . . . . . . . . . . . . . . . . . . . . . . . . . . . . . . . . . . . . . . . . . . . . . . . . . . . . . 17
3.1.2 Modelling Animal Collective Motion . . . . . . . . . . . . . . . . . . . . . . . . . . . . 19
3.1.3 Modelling Human Collective Motion . . . . . . . . . . . . . . . . . . . . . . . . . . . . 20
3.1.4 Criticism . . . . . . . . . . . . . . . . . . . . . . . . . . . . . . . . . . . . . . . . . . . . . . . . . . . . . . . . . . . . . . . . . . . . . . . . . . . 22
3.2 Modelling Transportation Systems . . . . . . . . . . . . . . . . . . . . . . . . . . . . . . . . . . . . . . . . . . . . . . 23
3.2.1 Spatial Network Approach . . . . . . . . . . . . . . . . . . . . . . . . . . . . . . . . . . . . . . . . . . . . . . 24
3.2.2 Human Transport Networks . . . . . . . . . . . . . . . . . . . . . . . . . . . . . . . . . . . . . . . . . . . . 30
3.2.3 Ant Transport Networks . . . . . . . . . . . . . . . . . . . . . . . . . . . . . . . . . . . . . . . . . . . . . . . . . . 33
4 Paper Summary . . . . . . . . . . . . . . . . . . . . . . . . . . . . . . . . . . . . . . . . . . . . . . . . . . . . . . . . . . . . . . . . . . . . . . . . . . . . . . . . . . . . . . . . . . 36
4.1 Paper I . . . . . . . . . . . . . . . . . . . . . . . . . . . . . . . . . . . . . . . . . . . . . . . . . . . . . . . . . . . . . . . . . . . . . . . . . . . . . . . . . . . . . . . . . . . . . 36
4.2 Paper II . . . . . . . . . . . . . . . . . . . . . . . . . . . . . . . . . . . . . . . . . . . . . . . . . . . . . . . . . . . . . . . . . . . . . . . . . . . . . . . . . . . . . . . . . . . . 37
4.3 Paper III . . . . . . . . . . . . . . . . . . . . . . . . . . . . . . . . . . . . . . . . . . . . . . . . . . . . . . . . . . . . . . . . . . . . . . . . . . . . . . . . . . . . . . . . . . 38
4.4 Paper IV . . . . . . . . . . . . . . . . . . . . . . . . . . . . . . . . . . . . . . . . . . . . . . . . . . . . . . . . . . . . . . . . . . . . . . . . . . . . . . . . . . . . . . . . . . 40
5 Sammanfattning på Svenska . . . . . . . . . . . . . . . . . . . . . . . . . . . . . . . . . . . . . . . . . . . . . . . . . . . . . . . . . . . . . . . . . . . . 42
6 Riassunto in Italiano . . . . . . . . . . . . . . . . . . . . . . . . . . . . . . . . . . . . . . . . . . . . . . . . . . . . . . . . . . . . . . . . . . . . . . . . . . . . . . . . . . 44
7 Acknowledgements . . . . . . . . . . . . . . . . . . . . . . . . . . . . . . . . . . . . . . . . . . . . . . . . . . . . . . . . . . . . . . . . . . . . . . . . . . . . . . . . . . . 46
References . . . . . . . . . . . . . . . . . . . . . . . . . . . . . . . . . . . . . . . . . . . . . . . . . . . . . . . . . . . . . . . . . . . . . . . . . . . . . . . . . . . . . . . . . . . . . . . . . . . . . . . . 49


1. Introduction
The emergence of collective patterns from local interactions is a common fea-
ture to most living systems, spanning a variety of scales from cells to animals
and humans [1, 2]. Bird flocks, fish schools, ant colonies, human crowds:
across species we observe the emergence of similar collective phenomena in
absence of centralised control [Fig. 1.1]. What is the physics of emergencein living systems? Is it possible to identify few simple principles to explain
the emergence of complexity across scales and systems? At the level of a
single entity, the physical, cognitive, and behavioural variables can often be
measured through experiments, and individual interactions described in math-
ematical terms. At the level of the group, the empirical observations of col-
lective patterns can be quantified statistically. However, what are the general
mechanisms connecting these two separate levels is still an open, fundamental
question.
(a)
(c) (d)
(b)
Figure 1.1. Examples of collective behaviour in living systems. (a) Starlings murmu-
ration. (b) Fish “mill”. (c) Crowd at Heavy metal concert. Credit: Ulrike Biets. (d)
Floating trail made by Fire ants. (a),(b),(d) publicly available on the internet.
9

This thesis focuses on identifying the basic mechanisms that are most likely
responsible for group-level patterns in living systems. The first unifying theme
in this thesis is the idea of adapting tools from physics and mathematics to de-
scribe and understand biological and human complexity. For example, statisti-
cal mechanics provides a formal connection between the large-scale behaviour
of a system and the small-scale behaviour of its constituents. Although the mi-
croscopic laws of mechanics governing the interactions between two particles
are known, the lack of knowledge about each particle’s state makes it impossi-
ble to extract the macroscopic dynamics of a gas by using classic mechanical
laws. Similarly, knowing the details of one single bird’s, or fish’s, behaviour
and shape, is not enough to understand how a thousand birds can flock cohe-
sively, or how a thousand fish can produce a mill [Fig. 1.1(a) and (b)].
Group behaviour of both living and non-living systems is “more than the
sum of its parts”, and the result of repeated interactions between a large num-
ber of individuals. It is thus very natural to attempt to approach biological
collective behaviour by adapting tools that have proven successful in describ-
ing and understanding collective behaviour in physical systems.
The second unifying theme in this thesis is the aim of making parallels
between the mechanisms that underly decentralised organisation in different
biological systems, and explore their potential application in human centric
infrastructures. Sometimes, apparently unrelated systems turn out to be more
alike than what we would have guessed at first sight. It may be about some
specific feature, some hidden underlying dynamics, or just about looking at
them in the right perspective, or at the right scale. As fish groups decide to
turn together, ants collectively decide where to build their trails. The way
they exchange information is different, as well as the way they move, and
the environment they live in. In both cases, collective decisions are taken
without any central control: there is no leader-fish, no engineer-ant. Although
no one would mistake a man with an ant, both men and ants build transport
networks, allowing one to compare the way ant trail networks and human-
made infrastructures form.
Therefore, apparently very different systems—from fish, to ants trails, to
transport networks and human crowds—are studied here through the same
process: models founded on empirical observations give insights into specific
systems, while also allowing us to abstract away from these systems, to under-
stand general mechanisms, and to draw parallels. In this thesis, mathematical
models are always based on real-world observations and are, when possible,
compared to empirical data. Such approach is grounded on the belief that the
model-experiment iteration is a virtuous cycle generating consistent theories
about the mechanisms of emergence of collective patterns from individuals’
interactions.
10

2. Background: a brief excursion in the fieldof complexity and collective behaviour
The idea that everything is made of parts, and that parts themselves are made
of parts, has deeply influenced the development of philosophy and science
since the 5th century BC. Since then, a lot of effort has been devoted to un-
derstand and describe these parts, splitting them further into sub-parts, down
to the indivisible fundamental constituents of nature. By the 19th century,
technological advances allowed different research areas to focus on different
scales and systems, from atoms and stars in physics, to molecules in chem-
istry, to cells and human beings in biology and medicine. Nowadays, science
has gained the awareness that everything is composed of the same fundamental
building blocks — currently quarks, or maybe strings — and the knowledge of
how these blocks work. In the meantime, it has become more and more clear
that the world is not just made of parts, but of systems of parts, and that what
characterises a specific system are the interactions between these parts [3].
Complex systems research is the cross-disciplinary branch of science that
studies how interactions between parts on some scale result in a collective out-
come on a larger scale, which properties could not be predicted by knowing the
properties of one part alone [4]. For example, atoms interact to give molecules,
molecules aggregate in genes, genes’ interactions determine the whole set of
biochemical processes that are necessary to an individual’s life. In the mean-
time, the interaction between billions of neurones allow individuals to make
everyday life decisions, such as when and how to interact with others. Insects
aggregate in colonies, mammals aggregate in groups, humans build cities and
form societies, and the interaction between such different systems impacts on
global climate, having deep consequences on these same systems.
As many disciplines, from physics to psychology, have addressed how in-
teractions lead to ubiquitous collective outcomes in living and non-living sys-
tems, it is difficult to find a broad, formal definition of what a complex system
is [3]. A general and evocative definition of complex system is that of a whole
which is “more than the sum of its parts” [Gell-Mann citing Arisototele], sug-
gesting some contrast with mathematics, where a whole is always exactly the
sum of its parts. However, in the last 40 years the study of complex phenom-
ena has seen a close collaboration between physics, mathematics, chemistry
and biology, which has quickly expanded to medicine, economics, psychol-
ogy, and sociology. Indeed, most techniques and concepts that are applied
to describe and investigate such phenomena are adapted and evolved from
11

mathematics, statistical physics, information theory and dynamical systems
theory [1, 5].
In a mathematical framework, a complex system can be defined as a sys-
tem composed by a large number of similar parts that interact in a disordered
way to form an aggregate featuring robust organisation [3]. This definition
encloses a number of concepts that recur when talking about complexity in di-
verse fields: emergence, self-organisation, interdependence, nonlinearity, and
feedback loops.
Emergence refers to the formation of collective behaviours, and to the causal
relationship between the properties of an aggregate and the properties of, and
interactions among, the parts composing it. In particular, ordered collec-
tive patterns emerge spontaneously from disordered interactions, meaning that
group-level order is not encoded in how single parts behave, nor is it the result
of external control: the system self-organises [6, 2]. For example, crystalli-
sation occurs when many disorderly-interacting molecules self-organise their
position in a regular lattice: while the status of the system changes from liquid
to solid, the nature of the interactions between molecules does not. A school
of fish is able to turn at unison not because of the presence of a leading fish,
but because of the way how fish respond to their neighbours’ behaviour [1].
As a result of the strong interdependence between the parts composing the
system, the large-scale effect of small-scale perturbations can be strongly am-
plified or dampened by feedback loops. In this sense, complex systems are
said to display non-linear behaviour, making it hard to predict what will be the
large-scale effect of perturbations at the small-scale level. Finally, complex
patterns are said to be robust, meaning that introducing or subtracting a few
individuals to the system does not change the collective outcome.
The separation between different levels of description, or scales, is another
fundamental idea that cuts across all the above concepts, and that is strictly
linked to measuring the degree of complexity of a system. One possible mea-
sure of complexity is defined as the amount of information needed to describe
a system [7]. The smaller is the scale at which a system is observed, the larger
is the precision of the description, but also the amount of details needed for
such a description [4]. For example, describing a solid crystal at the large-scale
requires a few macroscopical notions such as shape, weigh, temperature. De-
scribing it at a small-scale requires knowing the position of billions of atoms
or molecules. Similarly, a fish school can be described through the speed of its
mass centre, its spatial extension and density, or through each single fish posi-
tion and speed. In turn, each fish may be described as a synergistic ensemble
of organs, each organ as the collective outcome of an ensemble of cells, down
to atoms.
Often, complex systems display nested levels of complexity, and, as a gen-
eral rule, the amount of information needed to describe the same object in-
creases as the scale at which it is described shrinks [Fig. 2.1, red line]. This is
very different compared with random (e.g. a gas of atoms at equilibrium) and
12

Complexity
Scalesmall-scale large-scale
Figure 2.1. Complexity and scale of description of a system. The amount of informa-
tion needed to describe complex systems increases as the scale at which it is described
is diminished (red line). For random (blue line) and coherent (green line) systems the
amount of information is almost independent of the scale of description. [4]
coherent systems (e.g. a gas of atoms forced to move all in the same direction),
where the level of complexity is almost scale-independent [Fig. 2.1, blue and
green lines respectively]. Choosing the right scale of analysis is thus funda-
mental to be able to observe and explain emergent group properties, and has
to be taken into account when studying and modelling complex systems [1].
13

3. Modelling Living Systems
The expanding interest in complex systems and collective behaviour from di-
verse disciplines has been matched with the development of theoretical tools,
often inspired by physics, aimed at formalising and unifying domain-specific
empirical knowledge [1]. Describing two-body interactions through functions
called potentials is a well established process in physics, whether it is about
two planets or two charged particles. However, modelling the emergent prop-
erties of many-body systems requires a different set of tools, such as mean
field theory, dynamical systems theory, Monte Carlo approaches, and more in
general statistical physics [5, 8].
The idea that mathematical models constitute a rigorous way to compute
consequences from assumptions [9] can as well be applied to complex systems
to understand what are the most likely characteristics and interactions at the
level of parts that give rise to collective behaviours at the level of the whole [1,
10]. However, a model is a simplified mathematical representation of a system,
and a big deal of work is to connect the assumptions about its composing
parts to the real world. First, a complex system might feature several nested
levels of complexity, requiring to choose a priori what level of description
is most convenient to model the emergence of a certain pattern. Second, the
basic working hypothesis in complex systems research is that interacting parts
should be identical, requiring to abstract the relevant features that characterise
all parts’ behaviour. Finally, extracting basic mechanisms requires to reduce
the number of assumptions to the minimum set that is necessary to reproduce
a certain pattern.
Such process of simplification is even more critical when searching for the
general principles of collective behaviour in living systems [11]. Unlike phys-
ical systems, biological complexity is indeed the result of evolution through
natural selection. Therefore, the diversity of behavioural interactions in liv-
ing systems is by far larger than the diversity of the interactions in physical
systems [2]. Here, identifying and retaining only the few features that are con-
sidered to be essential to understand a certain phenomena becomes less and
less straightforward as biological complexity increases. As a consequence,
models strongly depend on the analysed system and on the research questions.
Group decision making, collective dynamics, and infrastructures construc-
tion are examples of complex phenomena displayed by the same system: hu-
man society. Therefore, understanding human society passes through the de-
scription and modelling of these aspects, requiring to identify the different
characteristics of human beings that are most relevant to each phenomena.
14

While psychological aspects may be of primary importance in decision mak-
ing, collective dynamics has mainly a physical nature, and infrastructures are
driven by socio-economical considerations. Modelling requires to simplify a
person’s psychological and physical complexity by choosing the right level of
description and by identifying common behavioural rules, discarding the de-
tails that would characterise a single individual. Intuitively, if our final aim is
to describe large crowds’ collective motion it is not convenient to model how
muscles work together to make a person walk, nor it is generally necessary
to distinguish pedestrians’ sex. Similarly, modelling cells motility would be
convenient in order to understand the formation of internal organs, but not to
understand how a fish or a school of fish move, as this would cross too many
levels of organisation [Fig. 2.1]
Integrating theory and experiments is fundamental for abstracting the indi-
vidual relevant features that are needed to investigate the principles underlying
collective behaviour across levels of biological organisation [1]. One usually
starts by choosing a model to represent some collective pattern observed in
nature. Different systems, or different patterns within the same system, lend
themselves to be better represented through different models. For example,
decision making is often modelled using differential equations, collective dy-
namics through agent-based models, and infrastructure planning through net-
work theory [1]. By observing how individuals within a group behave, one
has then to make assumptions about the basic rules that describe how each in-
dividual responds to other individual’s behaviour, formalising qualitative ob-
servations into a mathematical framework. Comparing the model’s prediction
against experimental data allows one to have an insight on the initial assump-
tions and to better understand a specific system. It might happen that one has
to change some assumptions to better fit the model to empirical data, com-
pute new predictions, and iterate the comparison with experimental evidence
in order to match data better and better.
Sometimes, the same pattern can be explained by more than one model or
more than one set of assumptions about the system producing it. When this is
the case, Occam’s razor can help identifying the simplest theory that explains
the largest amount of data. Also, testing a theory’s predictivity through new
experiments allows us to increase our knowledge about a system while nailing
down the basic set of behavioural rules that explains a certain pattern. Ideally,
iterating the model-experiment process provides consistent theories about the
most plausible mechanisms underlying the emergence of collective patterns
from individuals’ interactions.
Interestingly, this process often reveals that the same model can explain pat-
terns observed in very different systems, suggesting that there are few under-
lying mechanisms behind a variety of phenomena observed in different fields
and at different scales. Reducing systems to their fundamental, biologically
plausible, ingredients makes it possible to draw parallels between them, and
to make predictions about a system by applying the knowledge about another
15

system. For example, in Paper II I implement a model to find the basic rules
of trail construction in ants, and find that their behaviour can be abstracted and
described through a simple mechanism of local optimisation. In Paper III, I
explore the large-scale properties of this mechanism and its relevance in the
construction of human infrastructures.
On the one hand, mathematical models provide simple explanations of com-
plex biological phenomena, allowing us to link together different levels of
complexity and to qualitatively compare different systems. On the other hand,
integrating models with specific data provides a quantitative, detailed descrip-
tion of systems, unifying the knowledge about different aspects of the same
system and allowing us to make predictions. Typical models used in this con-
text are ordinary, partial, and stochastic differential equations, Markov chain
models, network models, agent-based models, and spatially explicit mod-
els [1]. The choice of a model depends on the studied system. Usually, basic
algorithms describing how a system works are implemented in computer simu-
lations, allowing us to visualise the predictions of different sets of assumptions
and to compare them with empirical data.
In what follows, I present the models used in this thesis to investigate col-
lective motion in fish and crowds (Papers I and IV), and the formation of ant
and man-made transportation systems (Papers II and III).
3.1 Modelling Collective Motion
Collective motion is displayed by a wide variety of living and non-living sys-
tems, from vibrated granular materials, to cells, to mammals, where moving
and interacting units give rise to spatially ordered patterns [12, 13].
A convenient way to model this kind of phenomena is to take a Newtonian
approach and describe each unit as a Self-Propelled Particle (SPP), that is, a
particle that moves in a 1, 2 or 3 dimensional space due to an internal propul-
sion, and that interacts locally with other particles [12, 1]. Such a model em-
bodies most ideas within the definition of complex systems: every individual
is simplified to be described as a particle, responds only to the presence and
behaviour of close-by neighbours (also called “interacting neighbours”), and
all individuals follow the same rules of motion and interaction. The shape of
these interactions varies with the system that one intends to model. Typical
ingredients are repulsion from, attraction towards, and alignment with, inter-
acting neighbours. Further ingredients may be body collision forces, in which
case body size is relevant to the modelled system, and interactions with the
environment. These interactions are complemented with rules of motion such
as the tendency to move at a certain preferred speed or towards some direc-
tion, and random noise that represents the effect of stochastic and unknown
deterministic factors affecting the motion of the considered organisms. All
these ingredients, described as forces acting on each particle i, are computed
16

at discrete times and summed up to update the equations of motion for speed
(�vi) and position (�ri) of a usually large number of particles N.
Self-Propelled Particle models thus implement local interaction rules through
a set of coupled differential equations, and are suited to investigate how the
emergent properties of a system as a whole depend on the behaviour of single
individuals [12, 1]. Usually, the evolution of a large system of such parti-
cles is analytically intractable, due to the complicated nature of interactions
and to the large number of particles, and is typically studied through com-
puter simulations. Numerical simulations also allow one to easily visualise
the collective outcomes originating from different interaction rules, and lend
themselves very well to test hypothesis about the relevant interactions under-
lying collective behaviour in living systems. As a result, some SPP models
are extremely elaborated and specialised to represent the details of certain
biological systems [14, 15]. However, this requires us to introduce many
parameters at the expense of understanding basic mechanisms. An opposite
trend is instead to search for minimal models, that is, to identify the set of
interactions and rules of motion necessary and sufficient to reproduce natural
patterns [16, 17, 18, 19, 20].
This minimal approach was initiated by physicists, who start from the as-
sumption that collective motion is an ordered phase of a many-body system,
and use tools developed in statistical mechanics, such as order parameters,
scaling laws, and correlation functions, to identify universal classes of collec-
tive patterns [12]. When taking such an approach, one must be aware that SPP
systems are fundamentally out-of-equilibrium due to the ability of active units
to self-propel, and thus to transform free energy in persistent motion [21].
This feature has two main consequences distinguishing active systems from
equilibrium ones: the total momentum of an active system is not conserved1,
and the Mermin-Wagner theorem2 is violated, i.e. these systems show true
long-range order even in two dimensions.
3.1.1 The Vicsek Model
The first step towards modelling collective motion by using active particles
was made by Vicsek in 1995, who developed a model of flocking self-propelled
units inspired by ferromagnetic continuous spins [16]. The parallel exploits
the similarity between a flock’s velocity field and oriented spins during the
ordered phase of a ferromagnet, and the analogy between random noise and
temperature. As such, the model implements three of the ingredients men-
tioned above: the tendency to move at a certain preferred speed, to align with
1One has to consider the system and the fluid where it moves, then the total momentum is
conserved [22].2The Mermin-Wagner theorem states that in a thermal equilibrium model at nonzero tempera-
ture with short-ranged interactions, it is impossible to spontaneously break a continuous sym-
metry [23].
17

neighbours, and random directional noise. In particular, the i-th individual
(of N) is described as a point particle situated at a position �ri(t) and having
speed �vi(t) = v0 eiθi(t), where v0 is a constant. At each time step, each indi-
vidual updates its direction of movement θi by averaging on the directions of
all the neighbours within an interacting range R, to which is added a random
angle ηi(t) extracted from a uniform distribution of zero mean and standard
deviation Δ:
θi(t +1) = 〈θ j(t)〉R +ηi(t), (3.1)
�ri(t +1) =�ri(t)+ v0(cosθi(t +1),sinθi(t +1)). (3.2)
Where 〈〉R represents the average over the neighbours j such that |�ri(t)−�r j(t)| < R. Since the flock moves, interacting neighbours may change dur-
ing the evolution of the dynamics.
Similar to the classical Heisenberg model, this simple model shows a phase
transition driven by noise, or equivalently by density, between disorder (for
Δ > Δc) and order (for Δ < Δc), corresponding to the birds moving in random
directions and to a polarised flock where all birds move in the same direction
respectively. The order of the transition has been longly debated and appears to
be a consequence of how noise is introduced into the model [24]. Independent
of its order, the transition can be observed by using the average velocity of
the flock 〈�v〉 = ∑Ni=1�vi/(v0N) as order parameter, and the variance of noise Δ
as temperature. However, unlike ferromagnets, the transition between order
and disorder occurs at a critical noise level which is larger than zero Δc > 0,
breaking continuous rotational invariance. While this would never be possible
in an equilibrium system, where continuous invariances can be broken only at
zero temperature, self-propulsion leads the system towards non-equilibrium,
thus allowing it to get around the Mermin-Wagner theorem [22].
This feature has profound consequences on the expected properties of flocks,
which have been examined analytically by Toner and Tu [25] by taking a hy-
drodynamic approach that coarse grains the bird’s density and velocity field.
Such an approach makes it possible to explain the emergence of true long-
range order in d = 2 due to the suppression of orientational fluctuations at
large scale. Furthermore, the Goldstone theorem3 implies the existence of
sound-like waves due to the breaking of rotational symmetry. This phenom-
ena is known as the “Goldstone mode of the flock”, which corresponds to long
wavelength fluctuations perpendicular to the direction of motion that are eas-
ily excited and slow to decay, and implies giant fluctuations in the individual’s
density [21].
The Vicsek model is thus a minimal model that sheds light on the gen-
eral principles underlying the physics of flocking, and on the emergence and
3The Goldstone theorem states that the spontaneous breaking of a continuous symmetry gener-
ates Goldstone bosons, i.e. massless long-wavelength fluctuations in the corresponding order
parameter [26, 27]
18

(a) (c) (d) (b)
Figure 3.1. 3D model for fish collective motion by Couzin et al., figure adapted with
permission from [34]. (a) Each fish is represented as a point particle that is repelled
by the individuals within the repulsion zone (zor), tends to align with the individuals
in the orientation zone (zoo), and is attracted by the individuals in the attraction zone
(zoa). The fish does not interact with individuals in the “blind volume” at the rear (α).
Collective motions exhibited by the model at increasing zoo and fixed zor and zoa: (b)
swarm, (c) torus or “mill”, (d) dynamic polarised group.
properties of an ordered state in active systems. It also provides an example
of how collective phenomena can be interpreted using concepts from hydro-
dynamics, statistical mechanics, and condensed matter physics. Recently, a
similar approach has been successfully applied to datasets of starling flocks in
d = 3 taken in the field, allowing to better understand how birds choose their
interacting neighbours [28], to detect Goldstone modes [29], and scale-free
correlations [30].
In Paper IV, I adapt and use the vibrational theory of soft condensed materi-
als to analyse the emergence of collective phenomena in a SPP model inspired
to dense crowds.
3.1.2 Modelling Animal Collective Motion
The Vicsek model produces only two phases, random and polarised, and does
not reproduce most complex patterns observed in nature, such as swarming,
milling, and internal dynamics [31]. While the first known individual-based
model was developed by Reynolds in 1986 to reproduce realistic flocks in
computer vision [32], variations of the Vicsek model have been proposed to
reproduce a wider variety of natural patterns [33]. These variations included
for example purely attractive or repulsive interactions [18], or body exclu-
sion [19], or restricted the individuals’ field of vision [34], or tried to ob-
tain polarised flocks by not explicitly encoding alignment in the rules of mo-
tion [17, 35].
For example, Couzin [34] proposed a model of fish in d = 3 where the in-
dividuals’ circular interaction area is divided in three zones, repulsion zone
at short range (zor), orientation zone (zoo), and attraction zone (zoa), plus
a blind zone at the rear [Fig. 3.1(a)]. As a consequence, modelled fish try
to avoid other fish which are too close, tend to orient in the same direction
19

as nearby fish (i.e. to align), and to join conspecifics which are far away,
but do not respond to fish behind them as they cannot see them. By keeping
the radii of repulsion and attraction constant, the model obtains a wide range
of collective patterns by tuning the radius of orientation [Fig. 3.1(b)(c)(d)].
In particular, when the radius of orientation increases, the school undergoes
a transition from a stationary disordered swarm, to a torus (or mill), to a po-
larised group moving in a common direction. This model is an example of how
self-organised patterns that are found in real fish schools can be reproduced by
using a relatively simple SPP model featuring a low number of parameters.
In Paper I, I use a SPP model in a 2D set-up to investigate which are the rel-
evant movement-mediated interactions between fish that allow for a successful
collective decision making process that involves escaping a predator.
3.1.3 Modelling Human Collective Motion
In human crowds, as in many biological systems, a variety of collective be-
haviours emerge from repeated local interactions of both psychological and
physical nature. Examples of the resulting patterns of motion are alternating
flows at bottlenecks [36], the formation of trails [37] and traffic lanes [38], as
well as more dramatic collective phenomena as stop-and-go waves and crowd
turbolence [39]. In all these cases, individuals behave according to their own
motivations, but local interactions generate organization at the scale of the
crowd without centralized planning or external control. The physics commu-
nity has therefore devoted a lot of theoretical effort to the quantitative study
and qualitative modelling of pedestrian crowds dynamics. Models of pedes-
trian crowds have important fields of application in evacuation simulations,
and understanding the emergence of dramatic phenomena such as turbolence
is fundamental to enhance crowd management strategies and public space de-
sign [40].
In parallel with the work by Vicsek, in 1995 Helbing initiated a class of
individual-based models, known as “social force models”, aimed at specifi-
cally reproducing the dynamics of human crowds [41, 20]. Helbing described
pedestrians as Newtonian particles subject to “social forces” measuring the in-
ternal motivations of individuals to perform certain movements. In particular,
he included a driving force, that reflects pedestrian’s desire to move in a given
direction at a certain speed, repulsive forces, describing the desire of keeping
a certain personal distance from other pedestrians and from walls or obstacles,
and attractive forces towards other individuals or objects. He assumed that
the total motivation of each pedestrian i could be represented by the sum of
these forces �Fi, so that its motion is modelled through two nonlinearly coupled
Langevin equations:
d�wi
dt= �Fi +fluctuations, (3.3)
20

d�ri
dt= �wi g(
�vmaxi|�wi| ). (3.4)
Here, �ri is the position of individual i, �wi is its speed, and �vmaxi is its max-
imum possible speed. The function g is equal to 1 if its argument is larger
than 1 and equal to its argument otherwise, so that �wi cannot exceed �vmaxi .
Finally, fluctuations represent random behavioural changes. By means of nu-
merical simulations, Helbing was able to show that spatio-temporal patterns,
such as lane formation and oscillatory flows at bottlenecks [Fig. 3.2(a) and
(b)], emerge due to non-linear interactions between pedestrians, even without
assuming strategical considerations, communication, or imitative behaviour.
This result suggests that, even in human crowds, complex coordinated be-
haviour may arise from simple automatic responses rather than as the result of
intelligent human actions.
(a)
(b)
(c)
Figure 3.2. Simulation results of the social forces model for human collective motion
from Helbing et al. [41], and of the variant taking into account body contact forces
by Moussaid et al. [42] (adapted with permission). The original social force model
by Helbing et al. reproduces (a) lane formation in pedestrian conterflows and (b)
alternating flows at bottlenecks. Pedestrians are represented by circles which size is
proportional to individual speed, white move towards the left and black towards the
right. (c) Characterisation of turbulent flows in front of a bottleneck by mean of local
body compression, which reveals two critical areas of strong compression in front of
the bottleneck (dark red), from Moussaid et al. [42].
Empirical observations showed that, at increasing crowd density, people be-
come more and more constrained and the crowd undergoes a transition from
laminar flow, to stop and go waves, to turbolence [39]. In this particularly
dangerous situation, crowd motion is characterised by random unintended dis-
placements which push people around causing falling and trampling, and lo-
cal body compression can reach deadly levels. In such high-density situations,
conventional social norms completely break down and the dynamics is domi-
nated by physical interaction between contacting bodies. To capture this kind
of extreme behaviour, models typically introduce a body repulsion force and a
sliding friction force in analogy with the physics of granular media [43].
21

Adding body contact forces results in a contribution to the equations of
motion of pedestrian i of the form
fi, j(t) = k Θ(ρi +ρ j−di, j)n̂i, j +hΘ(ρi +ρ j−di, j)Δvti, jt̂i, j, (3.5)
for each pedestrian j in contact with it. In particular, h and k are constants, ρiis the radius of i, di, j is the distance between i and j, n̂i, j and t̂i, j indicate the
normal and tangential directions to the vector pointing from i to j, and Δvti, j is
the velocity difference between i and j in the tangential direction. Analysing
the local body compression (or the crowd pressure, defined as local density
times the local velocity variance) produced by simulating this model, made it
possible to identify areas at high risk of crowd turbolence, as for example the
areas in front of bottlenecks [Fig. 3.2(c)].
Along these lines, further models based on Newtonian dynamics [44, 45,
46, 47], have been successful in reproducing most self-organised phenomena
observed in real crowds [40], also exploiting the similarity with granular me-
dia [36, 48, 49]. Since these models are relatively hard to calibrate, alternative
approaches have also been developed, for example by implementing a cog-
nitive heuristics based on visual cues that drives individual behaviour [42].
Other models in this field have attempted to describe crowds as a fluid [50],
by means of cellular automata [51], or by taking a continuum approach where
a global potential field specifies the movement of all pedestrians present within
the field without agent-based dynamics [52, 53].
In Paper IV, I define a force model featuring only body contact forces, noise,
and self propulsion to represent dense crowds, and use it to investigate the
emergence of collective phenomena by applying tools inspired to the physics
of granular materials.
3.1.4 Criticism
While the presented models demonstrate that few simple rules may produce di-
verse biologically plausible collective patterns, some criticism has been made
against this kind of individual-based models. For example, different combi-
nations of rules may provide very similar patterns [54], thus reducing their
predictive power [55]. Arbitrary modelling choices, such as how to introduce
noise (as exemplified in Section 3.1.1), the choice of a metric or topological
interaction scheme, the assumption of a certain equilibrium distribution for a
stochastic model, may also have profound impact on the large-scale outcome
of simulations [10]. Beyond modelling, implementing computer simulations
requires to make further arbitrary decisions about, for example, boundary con-
ditions, the updating scheme, how to integrate the equations of motion, etc.
that may affect the final outcome in unpredictable ways, creating artefacts
which might be mistaken for original properties of the system [56].
As a consequence, different approaches to modelling collective motion have
been developed. In contrast with the “microscopic” or individual-based ap-
22

proach described so far, researchers have also tried to model collective mo-
tion through a “macroscopic” approach that evolves field variables such as the
group’s density and speed [25, 57, 58, 52]. Such an approach sacrifices the
knowledge of each individual’s position and behaviour, but it is more analyt-
ically tractable and significantly reduces the computational effort, therefore it
is often used to model human crowds in evacuation scenarios [53] or to study
the statistical mechanics of active systems [25, 57].
3.2 Modelling Transportation SystemsTransportation systems are ubiquitous in nature. They are vital to the exis-
tence of most organisms and support functions that are fundamental to both
human society and animal groups [59, 60, 61, 62, 63, 64, 65, 66, 67]. They
allow for efficient travelling and for the exchange of resources, nutrients, or
information between physically separated locations. Examples are railways
and roads, power grids and sewing systems, the internet, ant trails and biolog-
ical foraging networks, but also blood vessels, leaf veins, and neural networks
[Fig. 3.3].
(a)
(c) (d)
(b)
Figure 3.3. Examples of man-made and natural transport networks. (a) Leaf veins
(publicly available on the internet). (b) Top view of the road network in Madrid. From
Google Earth. (c) The slime mould builds a foraging network reproducing the main
features of the great Tokyo railway network. Adapted from [60] with permissions. (d)
Map of the great Tokyo railway system (publicly available on the internet).
Research in this area, from quantitative geography to medicine, aims at
characterising the shape and the formation processes of transportation struc-
tures in order to understand the features of the organisms that build and rely on
them [68]. For example, the growth of blood vessels is an important aspect in
developing cancer treatments [69], the brain’s cognitive functions are deeply
connected with the structures arising from billions of physical connections be-
tween neurons [70], and the evolution of man-made infrastructures is tightly
entangled with social, economical and political aspects [71, 72].
Despite transportation structures feature large-scale complex patterns, most
often they are the result of an iterative local process involving repeated interac-
23

tions between agents and their environment, rather then the product of central
planning [68]. While this is intuitive for natural networks such as blood ves-
sels and neural networks, it might be considered surprising in the case of ant
trails and human infrastructures.
The formation of well a defined trail running for several meters between
the garden and a food source, for example in our kitchen, looks like a struc-
ture that would require a big deal of coordination, and possibly some kind
of central control. However, it is explained by a local mechanism of posi-
tive reinforcement of chemical trails [1, 73]. In particular, each ant is able to
recognise and lay a chemical substance, the pheromone. As long as one ant
finds a food source, it starts going back and forth on the same route, carrying
food to the nest and laying pheromone behind. Each ant that comes across the
pheromone trace is able to follow the chemical gradient to the food, and starts
going back and forth as well. This simple behaviour has the effect of mak-
ing the trail stronger and stronger, while other traces of pheromone disappear
due to evaporation, until all foraging ants follow the same trail (and find our
kitchen).
This simple mechanism based on positive reinforcement is responsible for
trail formation in several ant species [67], but also in other living systems such
as mammals and even humans [37]. It does not require any external coor-
dination, nor a global knowledge of the environment on the ant’s side, and
has been observed in laboratory conditions as well as in the field. The for-
mation of one or few trails is often studied by taking an individual-based ap-
proach (SPP models, cellular automata, Monte Carlo simulations), which ad-
dressed the behavioural rules followed by individuals to build transport struc-
tures [37, 74, 75, 76, 66]. Similar to collective motion research, this approach
aims at finding the simple mechanisms of behaviour that are essential to re-
produce the geometrical properties observed in empirical trails. Remarkable
examples are the ability of ant colonies to choose the shortest path between
two points [77] or to build the shortest-length network between several food
sources [78].
3.2.1 Spatial Network Approach
A convenient way to model large transportation systems is to take a coarse-
grained approach and to represent them as networks, where nodes are stations
of arrival and departure of resources, individuals, or information, and links
are physical connections between these nodes [68, 79]. For this reason, trans-
portation systems are often referred to as “transport networks”. This approach
discards the individual’s behavioural details, and assumes that links are built
according to macroscopical rules that are the result of an underlying micro-
scopic process (foraging ants, car traffic, human activity and mobility). The
advantage of such a representation is that it allows us to exploit most con-
24

cepts and tools developed in graph and complex networks theory to analyse
and describe transportation systems [68, 80]. In particular, linking traditional
topological measures to real-world quantities allows us to classify transport
networks through their structure [81], and to connect such structure to the re-
sulting properties of the network. Moreover, it provides a formal framework
to understand the basic environmental and evolutionary constraints that shape
transport systems during their growth, and how they relate to the specific func-
tions the network is meant to perform [82].
An aspect common to both natural and man-made transportation systems
is that space poses a fundamental constraint on the growth and structure of
these networks [68]. For example, recent research has shown that closer brain
regions are more likely to be connected to each other due to the biological cost
of axons [70]. Building physical connections has a immediate cost in terms of
material, and then what is built needs to be maintained until it is destroyed or
abandoned, resulting in further costs that have to be sustained for the whole life
of the network [83, 84, 72]. Since these costs are extensive, that is, the longer
the connection the higher the cost for building and maintaining it, one would
expect that long and expensive links should bear some advantage, for exam-
ple by providing a connection to a node with high centrality or connectivity.
The topology of transport networks is thus strictly related to spatial aspects,
which can be taken into account by embedding these networks into a metric
space, often the euclidean 2-dimensional space (but, for example, neural net-
works are embedded in 3 dimensions). This allows us to define measures that
mix topology and space and that complement “classical” topological measures
(such as degree distribution, clustering coefficient, assortativity etc), enabling
a thorough description of spatial networks [68].
Measures on Transport NetworksBy embedding a network into euclidean space, the costs associated to building
and maintaining a connection are naturally represented by the length of the
connection itself, and the total length of a network is usually used as a proxy
for its total cost [68]. In particular, the total length of a network G built on Nnodes can be written as:
lT (G) = ∑e∈E (G)
le, (3.6)
where e is a link belonging to E (G), the set of links of G, and le is the euclidean
length of the link. Real costs will be proportional to the total length through
some constant (e.g. the cost per meter), and building and maintenance costs
may have different proportionality constants. In the literature, however, the
quantity defined in Eqn. 3.6 is often directly referred to as the “cost” of the
network [85, 86, 87, 88, 89, 90]. Furthermore, such a definition does not
take into account the fact (which is very likely for a transport system) that the
current network’s structure may be the result of an iterative process involving
25

building and destroying more links than the ones displayed in the network.
Paper III starts from this observation to argue that Eqn. 3.6 is a good indicator
of maintenance costs but not of building costs, and further discusses how these
two costs affect the evolution and the structure of transport systems through a
model of network growth.
Other typical measures that describe relevant properties of transportation
networks by mixing space and topology are efficiency and robustness [91, 60,
64]. Efficiency represents how fast it is to travel between any two nodes of the
network [92, 93], and can be computed by comparing the length of the path
separating two nodes with their euclidean distance [92]:
E(G) =1
N(N−1) ∑i�= j∈G
dei, j
di, j. (3.7)
i and j are nodes in G, dei, j is their euclidean distance and di, j is the length of
the shortest path connecting them on the network G, i.e. the sum of the length
of links constituting the shortest path. With such a definition, E takes values
between 0 (minimum) and 1 (maximum efficiency). The quantity q(i, j) =di, j/de
i, j is also known as route factor or detour index, and sometimes used as
an alternative measure of transport efficiency [59].
Another desirable property of transport systems is robustness, i.e. that no
part of the network remains isolated in case of failure of one connection due
to a targeted or random disruption [94, 95], which is usually quantified as the
probability that the network remains connected under the removal of a ran-
dom link [60]. Robustness is achieved through the presence of loops4, which
allow for multiple paths between different nodes. Further quantities involving
space are defined to measure the density of links and to detect communities
and recurring structures (motifs), and are relevant when studying traffic on
networks [68].
Optimal StructuresThe measures defined above can be applied to transport networks to describe
their large-scale structure and to assess their performances. For example, the
Euclidean minimum spanning tree (MST) is the network of shortest length
that connects a set of N nodes [88] [Fig. 3.4(a)]. The MST is the most eco-
nomical transport network, however, it is not very efficient as it features a
large average shortest path, and it completely lacks robustness as the fail-
ure of one connection is enough to disconnect the network. Since it opti-
mises cost, it is often used as a term of comparison to assess the trade-off
between cost and efficiency, or cost and other design goals, in real transport
networks [78, 91, 61, 65, 59]. Another notable network is the maximal planargraph [Fig. 3.4(b)], the graph with the maximum number of non-intersecting
4 Loops, or cycles, are sequences of adjacent links starting and ending at the same node, such
that there are at least two non-overlapping paths between any two nodes of the same cycle.
26

links5. This graph optimises robustness and efficiency by casting the maxi-
mum number of connections, but as a result it has a high cost [68]. Finally,
the star graph is a complete bipartite graph6 where several peripheral leaves
are connected with one link to a unique internal node [Fig. 3.4(c)]. It pro-
vides the lowest route factor between the leaves and the internal node but it is
suboptimal in terms of total length. It is a useful reference graph to compare
transport networks constituted by a central source and many sinks, as in elec-
tric, water, or distribution networks (or the way around as in the case of ant
colonies [65]), or by one main node and several secondary nodes, as in railway
or metro networks [59].
(a) (c) (d) (b)
Figure 3.4. Examples of optimal networks generated on the same set of 100 randomly
placed nodes. (a) Minimum spanning tree. (b) Maximal planar graph. (c) Star graph.
(d) Small-world graph.
As a general observation, increasing efficiency and robustness of a net-
work requires adding further links, which in turn increases building and main-
tenance costs. Therefore, another feature common of artificial and natural
transport networks is that there is a trade-off between cost, efficiency, and ro-
bustness. These design goals cannot be optimised together, and natural and
man-made transport systems often feature a balance between them rather than
prioritising one over the others [94, 96, 59]. While such a balance may be
carefully planned in artificial networks, in the case of natural network it is the
consequence of a decentralised process [65, 64, 67].
A lot modelling effort has therefore focused on how competing optimisation
principles affect the topology and the metric properties of transport networks.
Given a set of nodes, a typical approach is to find the network configuration
that minimises a convex combination of competing quantities of the form [97,
86, 87, 88]
C = λQ1 +(1−λ )Q2. (3.8)
5A spatial graph is said to be planar if its links intersect only at a node. A maximal planar graph
would loose its planarity if any link is added to the existing set.6A bipartite graph is a graph where nodes can be divided into two disjoint sets and links connect
only nodes belonging to different sets. Such a graph is complete if every node in one set is
connected to every node in the other set.
27

At changing λ ∈ [0,1], the obtained networks can be classified in terms of
some topological measure, for example the degree distribution [97], allowing
one to link emerging network properties and optimisation principles.
Overall, the optimisation approach sheds light on how different topological
structures can arise as optimal solutions of the interplay between competing
design goals. Conversely, given a real network, such an approach can help
us understand what optimisation principles are likely to have shaped the ob-
served structure. One has to be aware that optimisation studies typically con-
sider a static set of nodes and are based on the underlying assumption that
networks can be centrally planned in order to satisfy global optimisation con-
straints, which is a useful viewpoint for engineering and abstract problems,
and may also reproduce the actual building process in the case of some artifi-
cial networks [98, 89, 99]. In the case of self-organised networks, for example
natural networks, such an approach can be justified by the more subtle as-
sumption that the observed system is the result of an evolutionary process that
maximised some fitness [100], but is unlikely to provide a description of the
actual process of network formation. However, optimal networks have been
useful in the study of circulatory systems and river networks [101], and to as-
sess the structures created by slime moulds or ants when compared with the
MST [78, 91, 65, 60, 102].
Transport Network GrowthMost natural and artificial transport systems evolve in time, increasing or de-
creasing their service area as a result of a decentralised process [68]. For
example, the internet grows by adding new routers and physical cables [103],
railways by building new stations [59], and polydomous ants by building new
nests when existing ones are overcrowded7 [104]. Modelling transport sys-
tems as networks allows us to represent growth and regression through the
insertion and deletion of nodes and links. The general aim of network growth
studies is to identify the local rules that govern such insertions and deletions,
and how they give rise to global patterns.
The seminal work by Price [105], and Barabasi and Albert [106] showed
that a simple model where nodes are added iteratively and connected prefer-
entially to the more highly connected nodes8 leads to networks characterised
by the presence of few highly connected nodes (hubs) and many nodes with a
few connections, and asymptotically to power-law degree distributions. Such
“scale-free” networks are very common in nature, from the WWW, to social
networks, to the network of world airports [107], and feature remarkable prop-
erties in terms of fault tolerance, resilience and traffic efficiency. Further stud-
ies have shown that this mechanism of preferential attachment (and its varia-
7The colonies of polydomous ants consist of several nests (and possibly food sources, such as
trees) connected by physical trails used by ants to travel and transfer food, eggs and larvae.8The probability of a node i to connect to another node j is proportional to the degree of j, k j,
i.e. to the number of its connections.
28

tions) can produce a wide subclass of scale-free networks, while more general
research has also focused on the properties emerging from different wiring
mechanisms [108].
In the case of transport systems, the position of nodes and their distance
have to be taken into account due to connection costs. Spatial aspects pose a
constraint on wiring mechanisms, affecting the final properties and topology
of transport networks [68]. A way to take this into account is to generalise
the preferential attachment mechanism so that the probability of connecting a
new node to another depends also on the distance to it [109, 110]. Usually, this
probability decreases with distance in order to represent the idea that longer
links are more expensive and can be created only if they provide a connection
to a node with very high degree (hub). As a result, short distance connections
are favoured, leading to the formation of local hubs that are tightly connected
to spatially close nodes, and that are connected to each other through few long
links.
Particularly relevant to understand the growth of transport networks are lo-
cal optimisation models, which account for the costs of adding each single link
to existing networks. Similar to the global optimisation model, this is imple-
mented by defining a local cost function Ci, j that has to be minimised every
time a node is added by choosing the most convenient link. Such cost func-
tion is typically a combination of euclidean distance and another topological
or geometrical quantity [68]
Ci, j = λdE(i, j)+Q j. (3.9)
When adding a node i, the model computes the cost function for all possible
links between i and each other node j, and creates the connection that min-
imises it.
Such an approach has been used to explain the emergence of the power-law
degree distribution of the Internet by setting Q j to be a measure of the cen-
trality of j [103]. The main focus of this article was to show that power-law
degree distributions emerge for intermediate values of λ . However it is inter-
esting to note that when only euclidean distance is minimised (i.e. at large λ ),
each new node gets connected to the closest one, iterating a paradigm of local
cost minimisation that can be seen as a dynamical version of the minimum
spanning tree (dMST).
Most local optimisation models have been developed to represent the growth
of human transport networks and are not generally used to address the forma-
tion of biological transport networks. However, distance related costs are rel-
evant also in biological networks, and a similar approach could be applied to
understand the growth of animal transport networks by relating costs and ben-
efits to quantities that may be relevant for animal groups, such as the presence
of food, obstacle avoidance, or shelter availability [67]. In Paper II I inves-
tigate the rules of formation of meat ant trail networks by testing different
biologically plausible wiring mechanisms against field data.
29

3.2.2 Human Transport Networks
Since the 70’s, research in the field of quantitative geography aims at develop-
ing tools to characterise human transportation systems, at understanding the
influence of space, and more in general of the geography of a territory, on
the growth and shape of such infrastructures, and how this relates to local hu-
man activity and mobility [79, 68]. Along with the numerous contributions
made by geographers, economists, urbanists, and sociologists, important ad-
vances in this field have been achieved by representing transportation systems
as spatial networks, so that complex networks theory could be exploited to cor-
relate topological and spatial aspects. Also, new extensive datasets have been
gathered thanks to recent technological developments, for example from mo-
bile phone data, satellite pictures, Geographic Information Systems, opening
the way to quantitative studies of real-world transport networks and allowing
researchers to validate and integrate theoretical models with empirical knowl-
edge.
From a complex systems standpoint, it is interesting to notice that both cen-
tral optimisation and self-organisation are likely to be relevant aspects in the
formation of human transport networks [68]. Often, global rational planning
has to compromise with local economical and political interests, resulting in
solutions that may seem suboptimal from a large-scale point of view [79].
Moreover, even when centralised planning is possible, the evolutionary time
scale of most infrastructures largely exceeds the time-horizon of planners. For
example, railways and roads have been evolving for centuries, and in this time
attempts of central planning alternated with several local uncontrolled rear-
rangements. Therefore, the structures we observe today can be thought of,
at least on the large scale, as the result of a local optimisation process [111].
Furthermore, despite most man-made transport networks have been shaped by
geographical, historical, and socio-economical mechanisms, empirical stud-
ies have shown that there are quantitative similarities between, for example,
road networks patterns of very different cities [112, 61]. Such an observa-
tion suggests that the local processes at play may be based on similar detail-
independent mechanisms. For these reasons, different models have taken a
coarse-grained approach to study the optimisation of human transport net-
works, and to investigate their growth from local mechanisms.
Examples of coarse-grained modelsBrede et al. [86] explore the interplay of cost and efficiency in communication
infrastructures constituted by a fixed set of nodes on a one-dimensional lat-
tice. They pose Q1 = lT and Q2 = 〈l〉 in Equation (3.8), representing the cost
of the network through its total length and taking the average shortest path 〈l〉as a measure of transport efficiency. At λ = 1 the model minimises the aver-
age shortest path, and the resulting network is a complete graph, where every
couple of nodes is connected by a link. At λ = 0 the model minimises the
30

total length by building the minimum spanning tree. At intermediate values
of λ , the model interpolates between these two extremes, and optimal net-
works range from wheels, to star graphs, to hierarchical trees. In particular,
the phase diagram of several measures (for example the average degree, the
clustering coefficient, the average length of a link) as a function of λ allows
the authors to find transition points and to analyse how network properties de-
pend on the optimisation constraints. Similarly, Mathias et al. [100] show that
small-world networks9 may arise from the same optimisation process in two
dimensions [Fig. 3.4(d)].
An example that considers both network structure and local growth is the
work by Gastner and Newman, who assessed the global optimisation of the
Boston commuter rail network and of other distribution networks, and then
proposed a growth mechanism to explain their large-scale structure [59]. First,
the authors made a quantitative analysis of the empirical networks’ structure
by computing their total length and route factor, which is inversely propor-
tional to transport efficiency [for measures definition see Section 3.2.1]. By
comparing these measures with the MST and the star graph built on the same
set of nodes, they showed that the analysed networks constitute a good com-
promise between these two extremes, i.e. they simultaneously have low route
factor and low total length, possessing the benefits of both but not the draw-
backs [Fig. 3.5].
(a)(c)(d)(b)
Figure 3.5. Example of how man-made transport networks can be analysed by com-
parison with optimised networks. Adapted with permission from [59]. (a) The Boston
commuter rail network. Nodes are train stations and links are connecting railways, the
arrow indicates the root of the network, i.e. the central station. (b) Star graph and (c)
Minimum spanning tree built on the same set of nodes. (d) Result of the optimisation
model proposed in [59] applied to the same set of nodes.
They then suggest a growth model based on local optimisation which ex-
plains the emergence of a balance between global design criteria. In the model,
they randomly place a set of N nodes and one central root node (which has
9A network is said to be small-world if it has a large clustering coefficient but a small char-
acteristic path length (increasing as logN), thus laying in between regular lattices and random
graphs. Many real-world networks feature this characteristic, from neuronal networks, to social
and computer networks [113, 107].
31

label 0) in the two-dimensional plane, and iteratively grow the network by
adding the link that minimises the weight wi, j = dei, j +βd j,0, where de
i, j is the
euclidean distance between two nodes i and j, and d j,0 is the sum of the length
of the links between j and the route. At changing β , the model interpolates
between a MST (β = 0) and a star graph (at large β ), and at intermediate val-
ues of β the networks self-organise to have simultaneously low route factor
and low total length, similar with empirical networks. Figures 3.5 (b) to (d)
illustrate this same procedure on the set of nodes of the Boston rail network.
It is worth noticing that the weight function is similar to the one adopted by
Fabrikant et al. in [103] for modelling the internet growth [see Section 3.2.1],
however the resulting network at β = 0 is not a dMST but the actual MST, as
they assume that the position of all nodes is initially known.
Louf et al. [85] take an analogous approach to explore the growth of a trans-
portation network between several centres of human activity (cities for exam-
ple). They randomly place a set of nodes in the two-dimensional plane and add
one link at a time so that the cost-benefit function Ri, j = Bi, j−Ci, j is always
maximised. Benefits Bi, j are related to human activity as they are proportional
to the expected traffic between two cities i and j, while costs Ci, j are assumed
proportional to the length of links. Interestingly, this model also interpolates
between the MST and a star graph, but in an intermediate regime it reproduces
a structure where various local hubs control geographically separated areas,
explaining how large-scale spatial hierarchy (which is observed in many real-
world networks) may emerge from local cost-benefit considerations.
CriticismSimilar to the examples above, most models of network growth do not ad-
equately take into account the separation between the time scales of self-
organisation and of global planning characterising most man-made transport
networks. Indeed, when considering self-organisation mechanisms, they as-
sume that the position of all the nodes composing the network is known ahead
of time, which is a rare condition for networks which have evolved for a long
time, such as railway or road networks, but also electric grids and sewing sys-
tems of old cities. More generally, most existing models that aim at explaining
the structure of real-world transportation systems either take a global optimi-
sation approach, or assume that such networks are the result of a decentralised
process. They therefore address only one of these two aspects, while they are
both likely to be relevant for understanding the current structure and properties
of transport networks.
In Paper III I explore the interplay of global planning and local optimisation
in minimising the costs of building and maintaining a transport network that
grows by adding nodes which position is not known ahead.
32
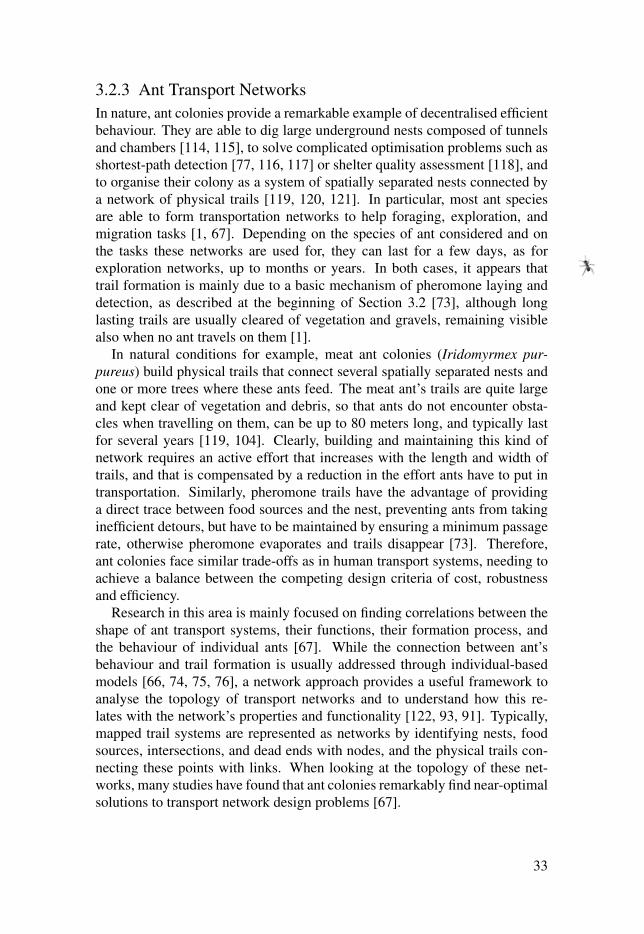
3.2.3 Ant Transport Networks
In nature, ant colonies provide a remarkable example of decentralised efficient
behaviour. They are able to dig large underground nests composed of tunnels
and chambers [114, 115], to solve complicated optimisation problems such as
shortest-path detection [77, 116, 117] or shelter quality assessment [118], and
to organise their colony as a system of spatially separated nests connected by
a network of physical trails [119, 120, 121]. In particular, most ant species
are able to form transportation networks to help foraging, exploration, and
migration tasks [1, 67]. Depending on the species of ant considered and on
the tasks these networks are used for, they can last for a few days, as for
exploration networks, up to months or years. In both cases, it appears that
trail formation is mainly due to a basic mechanism of pheromone laying and
detection, as described at the beginning of Section 3.2 [73], although long
lasting trails are usually cleared of vegetation and gravels, remaining visible
also when no ant travels on them [1].
In natural conditions for example, meat ant colonies (Iridomyrmex pur-pureus) build physical trails that connect several spatially separated nests and
one or more trees where these ants feed. The meat ant’s trails are quite large
and kept clear of vegetation and debris, so that ants do not encounter obsta-
cles when travelling on them, can be up to 80 meters long, and typically last
for several years [119, 104]. Clearly, building and maintaining this kind of
network requires an active effort that increases with the length and width of
trails, and that is compensated by a reduction in the effort ants have to put in
transportation. Similarly, pheromone trails have the advantage of providing
a direct trace between food sources and the nest, preventing ants from taking
inefficient detours, but have to be maintained by ensuring a minimum passage
rate, otherwise pheromone evaporates and trails disappear [73]. Therefore,
ant colonies face similar trade-offs as in human transport systems, needing to
achieve a balance between the competing design criteria of cost, robustness
and efficiency.
Research in this area is mainly focused on finding correlations between the
shape of ant transport systems, their functions, their formation process, and
the behaviour of individual ants [67]. While the connection between ant’s
behaviour and trail formation is usually addressed through individual-based
models [66, 74, 75, 76], a network approach provides a useful framework to
analyse the topology of transport networks and to understand how this re-
lates with the network’s properties and functionality [122, 93, 91]. Typically,
mapped trail systems are represented as networks by identifying nests, food
sources, intersections, and dead ends with nodes, and the physical trails con-
necting these points with links. When looking at the topology of these net-
works, many studies have found that ant colonies remarkably find near-optimal
solutions to transport network design problems [67].
33

(d)
(c)(b)(a)
(f)(e)
10m
Figure 3.6. Two examples of wood ant’s trail networks compared to optimised net-
works built on the same set of nodes. Adapted with permission from [65]. (a) and
(d) are the original networks, the central node is the nest, resources are represented by
peripheral nodes, and trails by links. (b) and (e) are the corresponding star graphs that
connect each resource by a direct link to the central nest. (c) and (f) are the approx-
imate Steiner trees connecting all resources (small plain circles) to the central nest
(larger black circle) by minimising the total length of trails.
For example, Buhl et al. [65] address the problem of optimal network de-
sign for the colonies of the wood ant (Formica aquilonia). These colonies
are constituted of one central nest from which several branched trails depart
towards the trees where the ants feed. The authors represented each colony
as a network where the central nest is a sink node, trees are source nodes,
and branching points are marked and considered a separate set of nodes. Fol-
lowing the same approach taken by Gastner and Newman [59], Buhl et al.
quantify cost and efficiency of these networks by computing the total length
and the average route factor of the trails connecting source nodes to the central
nest. They compare empirical values with the ones obtained for the star graph
(which minimises the route factor) and for the Steiner tree10 (which minimises
the total length accounting for branching in the trails) built on the same set of
nodes, showing that wood ants find a remarkably good balance between cost
and efficiency [Fig. 3.6]. In particular, their networks appear to be an interme-
diate solution which obtains a low route factor and a low total length, similar
with what observed by Gastner and Newman for man-made networks, but in
the complete absence of centralised control. Interestingly, ants obtain such a
result by introducing branching points, which is not the case for the artificial
networks studied in [59].
10The Steiner tree is the network of shortest length that connects a set of nodes by introducing a
set branching points.
34

Although Buhl et al. do not analyse the mechanisms underlying network
formation, a possible explanation of the remarkable topology of wood ant net-
works is given by the individual-based “active walker” model [123]. In this
model, each ant can orient itself towards the food source, and can lay and de-
tect pheromone. When a large number of ants compromise between following
an existing pheromone trace and going straight to the food source, branched Y-
shaped trails emerge, with similar properties as wood ants foraging networks.
Other species of ants build transport networks that balance between the cost
of building and maintaining the infrastructure and travel efficiency. A recent
study has shown, for example, that meat ants build networks that balance be-
tween cost, efficiency, but also robustness, by introducing loops to achieve a
higher resilience against disruptions [91]. Similarly, the analysis of several ant
transport networks by Cook et al suggested that, in the field, most polydomous
ant species tend to balance between these three design criteria [93].
Interestingly, this does not seem to be the case in laboratory experiments,
where colonies of Argentine ant (Linepithema humile) have been observed to
form minimum spanning trees or stainer trees between the nest and available
food sources, minimising the cost of trails rather then balancing it against
efficiency [78]. This might be due to a different mechanism of trail formation:
in this specie of ants, foragers explore the territory creating a large number of
trails, then once one or more food sources are detected, most of these trails
get pruned so that only the shortest connections are kept between the nest
and food sources [66]. However, Heller et al. show that Argentine ants in
natural conditions build more robust transport networks that feature redundant
links [124].
Such a difference within the same ant specie seems to support the hypoth-
esis that the environment, and how resources are distributed in space, plays
an important role in determining the large-scale patterns of ant transport net-
works [125]. On the other hand, the fact that several species of ant, and in very
different conditions, tend to balance between design criteria, suggests that
the formation of trail networks may be described by few, simple and detail-
independent wiring rules [1]. Both these observations should be taken into
account when modelling the morphogenesis of ant transport networks. So far,
research in this field has addressed the individual-based mechanisms of trail
formation mainly through individual-based models, using network theory only
to describe the static structure of ant transport systems and their properties in
terms of cost and efficiency.
In Paper II, I define a model of network growth to investigate the process
of growth and expansion observed in the colonies of meat ant, and find two
simple wiring rules that allow to reproduce the topology of empirical networks
through a dynamical process.
35

4. Paper Summary
Papers are presented in chronological order.
4.1 Paper I
A. Bottinelli, A. Perna, A. Ward, D.J.T. Sumpter. How do fish use the move-
ment of other fish to make decisions? Proceedings of the European Confer-ence on Complex Systems 2012. Springer International Publishing (2013).
Animals living in groups are required to make collective decisions about where
to collect food, the timing and direction of group travel, the choice of a new
shelter, the detection and avoidance of predators etc. Typically, larger groups
are predicted to be more accurate in making decisions than smaller groups or
single group members, as they benefit of pooling information from several in-
dividuals. However, this may come at a cost in terms of the speed of decision,
as sharing information and reaching a consensus is expected to become slower
as the size of the group increases. The trade-off between accuracy and speed
in decision-making characterises many biological systems [126, 127], and is
supported by our every-day experience as members of human society.
However, an experiment by Ward et al. [128], showed that moving fish
groups detect hidden predators and collectively decide about a new direction
of motion both faster and in a more accurate fashion than isolated individu-
als. The research team hypothesised that this remarkable ability was a conse-
quence of the fact that fish communicate through movement. Therefore, the
information about the predator’s position could be transferred quickly because
of how fish responded to the movement of their neighbours.
In this paper I tested Ward et al.’s hypothesis through mathematical mod-
elling, investigating the link between movement and information transfer un-
derlying the emergence of a collective decisions in fish. This work constitutes
a first attempt to relate two areas that are typically studied separately: physi-
cal rules of motion and group decision-making. The goals of this work were
to describe how fish react to the movement of other fish through simple rules
of motion, and to identify the minimal set of such rules that allowed fast and
accurate decision-making in groups of increasing size. I used a self-propelled
particle approach combined with numerical simulations. Fish were modelled
as moving particles subject to social forces in order to capture the connection
36

between fish’s social interactions and spatial movement. By mean of numer-
ical simulations I reproduced the experiment by Ward at al. and fit it to the
empirical data.
The analysis suggested that two biologically plausible social forces were
necessary and sufficient to reproduce collective predator avoidance: the ten-
dency to aggregate (attraction) and to swim in the same direction (alignment).
Alignment in particular, was the leading interaction allowing the information
about the predator’s position to travel rapidly through fish schools. A possible
interpretation of this result is that keeping cohesion through attraction is fun-
damental for visual-based communication, however relevant information are
enclosed in the individual’s direction of movement and in the deviations from
such a direction.
Once the model was fitted to experimental data, I tested its robustness by
simulating it in a different environment than the one used by Ward et al. Here,
I found that the interactions found in the previous environment allowed larger
groups of fish to better escape a predator chasing them. This result suggests
that keeping a strong alignment with other group members is fundamental
for information to spread quickly and for the group to avoid predation. An
interesting outlook of this work would be to fit the same model to different
species of fish performing the same decision-making task, and to test wether
the relevant interactions change or remain the same.
4.2 Paper II
A. Bottinelli, E. van Wilgenburg, D.J.T. Sumpter, T. Latty. Local cost minimi-
sation in ant transport networks: from small-scale data to large-scale tradeoffs.
J. R. Soc. Interface, 12 20150780 (2015).
Transport networks, such as railway lines and ant trails, are a fundamental
mean for distributing resources and exchange information in many human and
biological systems. Most networks trade-off between efficiency (travel time
between two points), cost (total network length) and robustness (against the
loss of connections). Since the simultaneous optimisation of these design cri-
teria is not possible, human transportation systems are often planned to bal-
ance between them. In nature, some ant species build transport networks of
trails that connect multiple nests and food sources within the same colony, al-
lowing for the exchange of eggs, larvae and food between physically separated
nests. These networks are constrained by the same trade-offs found in human
systems, however, they are built without any centralised planning.
Recently, a large dataset reporting the spatial structure of 140 transport net-
works built by the Australian meat ant (Iridomyrmex purpureus) became avail-
able [129], and statistical analysis on the structure of these networks showed
that these ants balance efficiency and cost without giving up robustness [91].
37

In collaboration with Dr. Latty, a biologist from The University of Sydney and
co-author in the above study, I led a project that aimed at identifying simple,
decentralised and biologically plausible building rules to explain the balance
observed in meat ant’s networks. The challenge in this project was that the
dataset provided only static information about the structure of networks of
different size, which can be thought of as representative for different stages
of growth of the same colony, but did not provide information about growth
processes. Furthermore, meat ant networks can take up to 80 years to fully
develop, making it unlikely to observe the process of construction of nests and
trails in the field.
To overcome this issue I took a coarse grained approach and formulated a
model of network growth based on empirical observations about the meat ant’s
building habits. Using this model, I found that the simple rule of “linking to
the closest neighbour” together with a greedy heuristics based on distance for
linking to food sources were the key to reproduce the balance observed in meat
ant networks. Therefore, taking a coarse grained approach may suggest bio-
logically plausible building mechanisms for the process of network formation
when observing it directly is difficult or expensive.
Finally, I explored whether the rules suggested by ants could be relevant
for other spatial self-organised networks, for example to inspire decentralised
design principles for human transport networks. Similar with ants, many man-
made distribution networks are constituted by sources (e.g. water stations,
power plants) and sinks (e.g. our homes), grow in time, and need to be dy-
namically connected so to obtain efficient distribution but low infrastructure
cost. Scaling the model up to a size relevant for man-made transport networks
(i.e. from 15-20 nodes up to 2000 nodes) showed that local length minimisa-
tion builds transport networks that balance between efficiency and cost also on
the large scale. However, in order to recover a balance with robustness, it was
necessary to introduce a new parameter that represents the catchment area of
sources.
4.3 Paper III
A. Bottinelli, R. Louf, M. Gherardi. Optimal tradeoffs between building and
maintenance costs in growing transport networks. arXiv:1609.06470[physics.soc-ph], in review, (2016).
This project originates from the observation that the simple rule of “linking to
the closest node”, described in Paper II, is a local mechanism minimising the
length, and therefore the cost, needed to connect a new node to the existing
network. This growth mechanism was also considered by Fabrikant et al. [103]
in the framework of a model for the growth of the Internet, and named “dy-
namical minimum spanning tree” (dMST). However, the focus of the authors
38

was on the intermediate regimes where local cost minimisation was balanced
with centrality, and little attention was given to the dMST alone.
When considering the dMST in the context of growing spatial networks,
linking each new node to the closest one minimises local building costs, but it
results sub-optimal for the long term maintenance costs. In fact, maintenance
costs are minimised by minimising the total length of a transport network, i.e.
if the transport network is a minimum spanning tree. However, minimising
the total length every time a node is added may require to destroy existing
links and rebuild new ones, which would in turn increase building costs. The
trade-off between building and maintenance costs is a feature common to all
transport networks that evolve in time, however no model so far has taken
this into account, assuming that building and maintenance costs pose the same
constraint on network growth.
Interestingly, this aspect is strictly related to other issues that are relevant
for understanding the structure and the formation of transportation systems,
and that are not adequately taken into account by many models in this field.
First, transport networks grow and evolve in time, and their structure is likely
tied to their history. Second, most models that consider the growth of trans-
port networks do so on a set of nodes which position is known ahead, despite
in most real-world scenarios future developments are beyond the horizon of
network planners. Third, most man-made transport networks have evolved for
decades, and attempts of central planning necessarily alternated with locally
optimised expansions. However, existing models that aim at explaining the
structure of real-world transportation systems address only one of these two
aspects, either taking a global optimisation approach, or assuming that such
networks are the result of a completely decentralised process.
Therefore, I defined a model that grows spatial networks without the knowl-
edge of future developments, and that implements the trade-off between build-
ing and maintenance costs by optimising a convex combination of competing
quantities. Since minimising building cost can be achieved by mean of lo-
cal decentralised optimisation, while minimising maintenance cost requires a
central organisation that minimises total network’s length, in this work I also
addressed the interplay of central planning and local growth characterising the
evolution of many man-made transport networks.
Combining mean field analysis and numerical simulations, I showed that
balancing infrastructure costs is a minimal sufficient ingredient giving rise to
emergent properties, such as the balance between the network’s total length
and efficiency, usually explained by more system-specific organising princi-
ples. By changing the balance between building and maintenance cost, the
parameter space divides into three “phases”, with a phase boundary charac-
terized by power-law temporal correlations. Remarkably, the growth strate-
gies that alternate local length minimisation with global reorganisations of the
network are optimal in that they minimise the long-term total costs of con-
struction, constituted by the sum of building and maintenance costs. Finally,
39

I discuss the relevance of this model in the context of understanding the opti-
misation principles underlying the growth of biological transport networks by
comparing it to the transport networks built by different species of ants.
4.4 Paper IV
A. Bottinelli, D.J.T. Sumpter, J.L. Silverberg. Emergent Structural Mecha-
nisms for High-Density Collective Motion Inspired by Human Crowds.
arXiv:1606.08835 [physics.soc-ph], in review, (2016).
In human crowds, as in many living systems, a rich variety of collective
patterns emerge from repeated local interactions of both psychological and
physical nature. Examples range from the formation of pedestrian lanes to the
more dramatic phenomena of “crowd turbolence”. During these hazardous
situations, people loose control of their movement, they can be involuntary
displaced meters away or fall, density waves can propagate through the crowd
and body compression can reach deadly levels. In high-density situations, con-
ventional social norms no longer apply and dynamics is dominated by physical
interaction between contacting bodies. Understanding the emergence of these
dramatic phenomena is fundamental to enhance crowd management strategies
and public space design.
In recent years, the physics community has devoted a lot of effort to the
quantitative study and qualitative modelling of pedestrian crowds. Modelling
pedestrians as self-propelled particles subject to social forces allows to qualita-
tively reproduce most crowd self-organising phenomena and is used to advise
space design and evacuation strategies. However, these models are hard to
calibrate and require quantitative experimental validation.
This paper proposes a new approach to crowd dynamics based on the re-
semblance between high-density crowds and disordered granular packings. In
the context of jammed granular materials, vibrational analysis allows to con-
nect local structural properties of the system to its dynamics by computing the
correlation matrix of the displacements of each grain around its equilibrium
position. The eigenvectors (also called modes) corresponding to the largest
eigenvalues of the correlation matrix convey information about the system’s
structural stability, the response to perturbations, and coherent and localised
motion. In this work, I adapted and applied these tools to analyse the struc-
tural mechanisms underlying collective motions in simulations of large high-
density crowds and to identify the causes of dangerous scenarios.
As a case study, I simulated a large number of people pushing towards a
common point of interest located at one edge of a simulation box. Each per-
son is modelled as a disk that self-propelles towards the point of interest, and
subject to soft-body collision forces, random fluctuations, and a wall colli-
sion force. The model is intentionally as simple as possible, as the study aims
40

at identifying minimal mechanisms of emergence of collective phenomena.
However, it is inspired to real-world examples, such as attendees at heavy
metal concerts trying to get as close as possible to the stage, customers con-
gregating at the entrance of a store during Black Friday sales, participants to a
pilgrimage.
Traditionally, vibrational analysis studies inert materials under external stresses.
Here I adapted it to study an active system vibrating under self-produced
stress. In parallel with granular media, the modes corresponding to the low-
est eigenvalues are vector fields predicting how the crowd would collectively
move in response to perturbations. Analysing the structure and the coherence
of these modes, I identified three candidate mechanisms to underly crowd col-
lective movement:
1. The first mode is the Nambu-Goldstone mode arising from broken trans-
lational symmetry. This mode carries a system-spanning displacement
modulation that couples with the propagation of density waves. When
excited in a real crowd, a large number of people would be suddenly dis-
placed resulting in dangerously high pressures, a phenomenon known as
“crowd crush”.
2. The individuals undergoing the largest displacements in each mode clus-
ter in the same region near the core of the crowd, revealing the existence
of a “soft spot”. In jammed granular media, soft spots correlate with
structural rearrangements and dynamical instability. In crowds, these
areas indicate the individuals who would displace the most during col-
lective movements, thus undergoing the greatest risk of falling and tram-
pling.
3. When introducing a fraction of individuals agitating more to account for
behavioural heterogeneity, vibrational analysis predicted the emergence
of multiple distinct long-range highly correlated modes reminding of the
stochastic resonance phenomena. The activation of such modes would
enhance the propagation of shock waves, explaining why injurious out-
comes are more likely in extreme social situations such as riots, protests,
and escape panic.
If found in real crowds, these three self-organised mechanisms would provide
a simple explanation of how tragic crowd incidents could arise from purely
physical and structural considerations.
41

5. Sammanfattning på Svenska
Modellering av kollektiv rörelse och transportnätverksformation ilevande system
Uppkomsten av kollektiva mönster från upprepade lokala interaktioner är
ett vanligt kännetecken för de flesta levande system på alla nivåer; från celler
till djur och människor. Levande system, såsom fågelflockar, fiskstim, myrkolonier
och människor i grupp: oavsett vilken art som observeras uppstår liknande
komplexa fenomen i frånvaro av central styrning. Hur ser fysiken bakom up-
pkomsten av dessa levande system ut? Är det möjligt att identifiera ett fåtal
enkla principer som kan beskriva denna komplexitet tvärs över skalor och sys-
tem? För enskilda enheter kan man ofta observera och kvantifiera fysiska och
kognitiva variabler och beteendevariabler genom experiment och individuell
interaktion går att beskriva med matematik. På gruppnivå går det att kvanti-
fiera kollektiva mönster med hjälp av statistik. Det som återstår är att under-
söka och formulera kopplingen mellan nivåer. Målet med denna avhandling är
att besvara denna öppna fråga.
Denna avhandling belyser två aspekter av uppkomsten av komplexa levande
system: kollektiv rörelse och formation av transportnätverk.
Inom ämnet kollektiv rörelse så studerades rollen av rörelseinitierad infor-
mationsutbyte för fiskars beslutsfattande. Analysen visade att den primära
egenskapen som avgjorde fiskars möjlighet att undvika predatorer var ten-
densen hos dem att simma åt samma håll (alignment). Ett annat resultat bel-
yser uppkomsten av kollektiva fenomen relaterade till den fysiska dynamiken
i extremt täta grupperingar.
Inom ämnet transportnätverk så utvecklades en modell för att kunna re-
producera utbyggnaden av nätverksspår som kopplar samman ett flertal bon
hos Iridomyrmex purpureus, en myrart vanligt förekommande i Australien.
Den enklaste förklaringsmodellen för att koppla ihop varje ny nod till dess
närmaste grannar visade sig är huvudingrediensen bakom att kunna reproduc-
era den karaktäristiska balansen mellan de relevanta designkriterierna som ob-
serverats empiriskt.
I ett annat projekt studerades hur byggnations- och underhållskostnader
påverkar utbyggnaden av transportnätverk. Det visade sig att den tillväxtstrategi
som alternerar lokal optimering, vilket minimerar byggnadskostnader, och har
centralt planerad omorganisation för att minimera underhållskostnader är det
som mest troligt minimerar den sammanlagda kostnaden för nätverket.
42

Målet med dessa projekt är att identifiera den grundläggande mekanismen
som är den mest sannolika för att beskriva mönster i levande system och de
strukturer de konstruerar.
Det första förenande temat i denna avhandling är tanken att adaptera verk-
tyg från fysiken och matematiken för att beskriva och förstå biologisk och
mänsklig komplexitet. Gruppbeteende för både levande och icke-levande sys-
tem är mer än summan av dess delar, och resultatet av upprepad interaktion av
ett stort antal av individer. Det är därmed mycket naturligt att försöka att närma
sig biologiskt kollektivt beteende genom att ta till sig verktyg som har visat sig
framgångsrika i att beskriva och förstå kollektivt beteende i fysikaliska system.
Det andra förenande temat beskrivet i denna avhandling är målet att hitta
paralleller mellan mekanismerna som ligger bakom decentraliserad organisa-
tion i olika system och utforska dess potentiella tillämpning i infrastrukturer
rörande människor. Det händer att till synes oberoende system är mer lika
varandra än vad som man hade kunnat tro vid en första anblick. Det kan handla
om någon specifik egenskap, någon gömd underliggande dynamik, eller så
gäller det att bara studera systemet utifrån rätt perspektiv, eller på rätt skala.
Därmed kan till synes väldigt olika system, från fiskar och myrstigar till
transportnätverk och mänskliga folkmassor studeras genom samma process:
matematiska modeller som bygger på empiriska observationer som ger insikt
in i speciella system, men också möjliggör för oss att på ett abstrakt sätt att
förstå generella mekanismer, och att kunna dra paralleller. I denna avhandling
bygger matematiska modeller på observationer från verkligheten och är, när
det är möjligt, jämförda med empirisk data. Ett sådant närmande är grundat i
tron att modell-experiment-uppreprningen är en bra cykel för att generera kon-
sekventa teorier om mekanismerna bakom kollektiva mönster från individuell
växelverkan.
43

6. Riassunto in Italiano
Modelli di movimento collettivo e di formazione delle reti di trasportonei sistemi viventi
L’emergenza di fenomeni collettivi da semplici interazioni locali è una carat-
teristica che accomuna la stragrande maggioranza dei sistemi viventi, e che si
presenta su una moltitudine di scale, dalle cellule, agli animali, agli esseri
umani. Stormi di uccelli, banchi di pesci, colonie di formiche, folle umane:
spesso, comportamenti collettivi similari emergono in sistemi molto differ-
enti tra loro e senza il bisogno di coordinazione esterna. Qual’è la fisica che
descrive l’emergenza di fenomeni collettivi nei sistemi viventi? È possibile
identificare pochi semplici meccanismi che spieghino l’ emergere della com-
plessità su diverse scale e in diversi sistemi? A livello delle singole entità,
gli esperimenti permettono di misurare quantità fisiche, cognitive, e compor-
tamentali, di osservare le interazioni tra gli individui, e queste osservazioni
possono essere formalizzate in termini matematici. A livello del gruppo è
possibile osservare i comportamenti collettivi e quantificarli tramite strumenti
statistici. Tuttavia, quali siano i meccanismi generali che connettono questi
due livelli rimane ancora una questione aperta.
L’oggetto di studio di questa tesi è l’ emergenza di fenomeni complessi nei
sistemi viventi in due manifestazioni principali: il movimento collettivo e la
formazione delle reti di trasporto.
Nell’ambito del movimento collettivo, questa tesi si occupa di come il
movimento dei singoli individui permetta di trasferire informazioni all’interno
di un gruppo di pesci così da ottenere decisioni collettive accurate. L’analisi
qui descritta suggerisce che la tendenza dei pesci a nuotare allineati con i pro-
pri vicini sia il meccanismo che permette a gruppi numerosi di sfuggire a un
predatore con più probabilità rispetto a gruppi più piccoli o a singoli individui.
Il secondo progetto sul comportamento collettivo si ispira all’analisi spettrale
nell’ambito della fisica della materia granulare per sviluppare un nuovo con-
testo in cui studiare la dinamica delle folle umane. Questo lavoro propone
un nuovo approccio per descrivere l’emergenza di fenomeni collettivi in situ-
azioni di alta densità, in cui le persone interagiscono principalmente tramite
contatto fisico.
Per quel che riguarda le reti di trasporto, in questa tesi ho sviluppato un
modello per rappresentare il processo tramite cui le formiche australiane della
44

carne (Iridomyrmex purpureus) costruiscono delle reti di trasporto fatte di sen-
tieri che collegano diversi nidi appartenenti alla stessa colonia. Confrontando
il modello con i dati sperimentali, ho dimostrato che la semplice regola di con-
nettere ogni nuovo nido al nido più vicino riesce a riprodurre le reti osservate
in natura, ed in particolare l’equilibrio tra la robustezza della rete, l’efficienza
nel trasporto, e il costo di costruzione dei sentieri. Il secondo progetto sulle
reti di trasporto contenuto in questa tesi, studia come lo sviluppo di queste reti
sia influenzato dai costi di mantenimento e costruzione delle connessioni tra
nodi tramite un modello di crescita dinamica. In particolare, ho dimostrato
che i costi totali di una rete di trasporto possono essere minimizzati alternando
l’ottimizzazione del costo di costruzione a livello locale e la minimizzazione
dei costi di mantenimento tramite azioni di controllo centralizzato.
L’obbiettivo comune di questi progetti è stato di identificare i meccanismi
che più probabilmente sono alla base dei comportamenti collettivi nei sistemi
viventi, o delle proprietà su larga scala delle strutture costruite da questi ultimi.
Un altro tema che unifica i progetti in questa tesi è l’idea di adattare stru-
menti tipicamente usati in fisica e matematica per descrivere e comprendere la
complessità dei sistemi biologici. Sia nei sistemi fisici sia in quelli viventi, i
comportamenti collettivi sono “più della somma delle singole parti”, nel senso
che derivano dalla ripetuta interazione di un grande numero di individui. Sem-
bra quindi molto naturale l’idea di studiare il comportamento collettivo di sis-
temi biologici tramite strumenti che si sono rivelati appropriati nel descrivere
il comportamento collettivo di sistemi fisici.
L’ultimo tema che unifica questa tesi è l’intenzione di tracciare paralleli tra
i meccanismi che guidano l’emergenza di comportamenti collettivi in sistemi
differenti, ed esplorare come questi meccanismi potrebbero potenzialmente es-
sere applicati in un contesto umano. Talvolta infatti, sistemi apparentemente
molto diversi possono risultare più affini di quanto si possa immaginare da
una prima analisi. Questa similitudine potrebbe essere legata a qualche par-
ticolare caratteristica dei sistemi osservati, alle proprietà che ne governano il
funzionamento, o semplicemente alla scala e alla prospettiva in cui li si studia.
Per questo motivo, questa tesi analizza sistemi apparentemente molto di-
versi tra loro—pesci, formiche, reti di trasporto, folle umane—tramite lo stesso
procedimento. Partendo dalle osservazioni empiriche, i modelli matematici
vengono applicati per studiare le caratteristiche dei singoli sistemi e, nel con-
tempo, per individuare gli aspetti più universali, astraendo i meccanismi gen-
erali che rendono possibile trovare le similitudini tra sistemi diversi. I mod-
elli matematici in questa tesi sono sempre basati su osservazioni empiriche e,
quando possibile, le predizioni ottenute tramite i modelli sono comparate ai
dati sperimentali. Questo approccio è fondato sulla convinzione che integrare
modellizzazione e sperimentazione, teoria e osservazione, sia fondamentale
per generare teorie coerenti sulla realtà che ci circonda.
45

7. Acknowledgements
Getting to the end of this long PhD-journey has been possible thanks mainly
to my supervisor David Sumpter. David has been there to support, encourage,
explain, teach, listen, prod, reproach (etc) exactly when I needed it, becoming
a firm point of reference in my academic development as well as a person I
trust. The biggest thank you is for letting me follow my scientific interests,
making me a more independent researcher and a happier person.
The diverse projects that are part of this thesis follow from as many col-
laborations. In these years I’ve had the privilege to work with amazing sci-
entists who co-supervised me, showing me different aspects of working in an
interdisciplinary environment and contributing to getting me closer to a real
researcher.
First, thanks to Andrea Perna, my first officemate, who welcomed me in
Uppsala, accompanied my first steps in the field of collective behaviour, taught
me how to use Matlab, and shared my suffering when drinking Swedish coffee.
Thank you to Tanya Latty who, over a cappuccino in Sydney, told me about
her ongoing projects, offered me a collaboration, and gave me the inspiration
to come back from my gap year and to keep doing research.
Thank you to Marco Gherardi, who has provided priceless input and support
for our network project, hosting me in his already overcrowded office in Milan
and patiently listening to and skimming through all my more or less eccentric
ideas.
Finally, thank you to Jesse Silverberg, whose enthusiasm for science (and
heavy metal and cats) has been a great source of inspiration and a strong mo-
tivation during the last year.
Next to the purely academic considerations, thanks to all of you for not only
being collaborators, but also friends.
Not only have I been supervised, but I also had the chance of co-supervising
Andreas Gådin and John Svensson, whom I thank for their patience and feed-
back. I hope that this experience has been useful for them as much as it was
for me.
I enjoied being part of the Collective Behaviour group, which I have seen
evolving for quite a while now, and has always been a lively and fun envi-
ronment. I am grateful to Daniel, Qi, Richard, and Boris, who welcomed me
when I arrived in 2011, for all the nights spent at the pub or in a Nation. To
Shyam, Natasha, Stam, and Viktoria for shared lunch-breaks and chats. Max,
Teddy, Hongli, Alex, Ernest, Emil, Björn, Linnéa, Line: thank you for never
giving up on calling me for coffee breaks, games and pub nights. As you can
46

see, it eventually worked out. A special mention goes to Björn and Linnéa for
helping me translating the summary in Swedish, and to Alex for proofreading
part of this thesis.
During these years of PhD studies I had the chance to meet excellent sci-
entists whose research contributed to expand my interests and to whom I owe
inspiring conversations: Irene Giardina, Andrea Cavagna, Mehdi Moussaid,
Andrea Baronchelli, Vito Latora, Manlio De Domenico, Guy Theraulaz, Jean-
Louis Deneubourg, Simon Garnier, Roberto di Leonardo, Hugues Chaté, and
Audrey Dussutour.
I also met friends who are definitely on their way to become excellent scien-
tists, but were not of less inspiration: Sarah, Remi, whom I also collaborated
with, Domenico, and Elisa.
I would like to thank Renaud Lambiotte for hosting me in Namur, for spend-
ing some time discussing my research work (some ideas that came up during
that conversation actually made it into my future research projects), and finally
for accepting to be my opponent.
I am grateful to the Centre for Interdisciplinary Mathematics for funding
my PhD and for supporting my participation in workshops and conferences,
allowing me to meet most of the people mentioned above and below.
I’d like to thank the researchers and the staff at the Mathematics department,
in particular Warwick Tucker, Elisabeth Bill, Inga-Lena Assarsson, Susanne
Gauffin, and Fredrik Lannergård who have always been very patient and help-
ful with all my administrative issues. And of course the other PhDs, Felipe,
Dan, Kostas, Jakob, Marta, Katia, with whom I shared some wasting hardcore-
math course at some point, and Hannah, for being such a kind officemate.
A thank you goes to Valeria, Johan, Marianna, Saman, José, Juan, Anke,
and Nattakarn at the department of Wave Energy for hosting me during many
lunches in their kitchen, and for the nice and entertaining chats.
During these years I have spent quite some time wandering between Mi-
lan and Uppsala. The time I have spent in Uppsala has been brightened by the
presence of many friends, and I am sure I wouldn’t have made it through many
of these winters without them and without the serious amount of Italian food,
wine, and chats we had together! Valeria, Johan, Pasticcino, Diego, Francesca,
Niccoló, Tony, Alberto, Paola, Chiara, Beppe, Luca, Matteo, Valentina, Ric-
cardo, Andrea, Sara, Alessandro, Carlotta (and possibly other people who will
hopefully forgive my forgetfulness): thank you.
I want to thank the friends at my old department of Theoretical Physics in
Milan; Marco, Bruno Bassetti, Pietro, and Sandro, for hosting me every now
and then and for their availability in discussing what I was working on at the
moment, providing advices and new viewpoints.
Another thank you goes to the department of Nuclear Engineering at Po-
litecnico di Milano, for hosting me in their offices or in their small kitchen, for
the tv series and fun conversations over lunch, and for always making me feel
part of their group.
47

One of the most rewarding feelings every time I’m back in Milan is to meet
with few but incredibly long-lasting friends, who make me feel like I’ve never
left: Mary, Filo, Luca, Roby (who’s not exactly in Milan but will forgive me
for the approximation), Simona, Marchino. Not to mention Sara, Eleonora,
Simona, Giovanni, Davide, with whom we manage to keep in touch despite
they are scattered across Europe.
I’d like to thank my family, cats included, for supporting me in all my de-
cisions and for the warmth, love, and understanding they give me both from
distance and every time we manage to get together.
Last but not least, Ale, thank you for being my fixed point in the chaotic
life of these last years.
So Long, and Thanks for All the Fish.— The Dolphins
48

References
[1] David JT Sumpter. Collective animal behavior. Princeton University Press,
2010.
[2] Scott Camazine. Self-organization in biological systems. Princeton University
Press, 2003.
[3] James Ladyman, James Lambert, and Karoline Wiesner. What is a complex
system? European Journal for Philosophy of Science, 3(1):33–67, 2013.
[4] Yaneer Bar-Yam. General features of complex systems. Encyclopedia of LifeSupport Systems (EOLSS), UNESCO, EOLSS Publishers, Oxford, UK, 2002.
[5] Stuart A Kauffman. The origins of order: Self organization and selection inevolution. Oxford University Press, USA, 1993.
[6] Murray Gell-Mann. Simplicity and complexity in the description of nature.
Engineering and Science, 51(3):2–9, 1988.
[7] Murray Gell-Mann. What is complexity? In Complexity and industrialclusters, pages 13–24. Springer, 2002.
[8] Gregoire Nicolis, Ilya Prigogine, et al. Self-organization in nonequilibriumsystems, volume 191977. Wiley, New York, 1977.
[9] Richard Phillips Feynman. The character of physical law, volume 66. MIT
press, 1967.
[10] Robert M May. Uses and abuses of mathematics in biology. Science,
303(5659):790–793, 2004.
[11] Nino Boccara. Modeling complex systems. Springer Science & Business
Media, 2010.
[12] Tamás Vicsek and Anna Zafeiris. Collective motion. Physics Reports,
517(3):71–140, 2012.
[13] Jean-Louis Deneubourg and Simon Goss. Collective patterns and
decision-making. Ethology Ecology & Evolution, 1(4):295–311, 1989.
[14] Andreas Huth and Christian Wissel. The simulation of the movement of fish
schools. Journal of theoretical biology, 156(3):365–385, 1992.
[15] Hanspeter Kunz and Charlotte K Hemelrijk. Artificial fish schools: collective
effects of school size, body size, and body form. Artificial life, 9(3):237–253,
2003.
[16] Tamás Vicsek, András Czirók, Eshel Ben-Jacob, Inon Cohen, and Ofer
Shochet. Novel type of phase transition in a system of self-driven particles.
Physical review letters, 75(6):1226, 1995.
[17] D Grossman, IS Aranson, and E Ben Jacob. Emergence of agent swarm
migration and vortex formation through inelastic collisions. New Journal ofPhysics, 10(2):023036, 2008.
[18] Hugues Chaté, Francesco Ginelli, Guillaume Grégoire, Fernando Peruani, and
Franck Raynaud. Modeling collective motion: variations on the vicsek model.
The European Physical Journal B, 64(3-4):451–456, 2008.
49

[19] Fernando Peruani, Andreas Deutsch, and Markus Bär. Nonequilibrium
clustering of self-propelled rods. Physical Review E, 74(3):030904, 2006.
[20] Dirk Helbing. A mathematical model for the behavior of pedestrians.
Behavioral science, 36(4):298–310, 1991.
[21] Sriram Ramaswamy. The mechanics and statistics of active matter. arXivpreprint arXiv:1004.1933, 2010.
[22] John Toner, Yuhai Tu, and Sriram Ramaswamy. Hydrodynamics and phases of
flocks. Annals of Physics, 318(1):170–244, 2005.
[23] N David Mermin and Herbert Wagner. Absence of ferromagnetism or
antiferromagnetism in one-or two-dimensional isotropic heisenberg models.
Physical Review Letters, 17(22):1133, 1966.
[24] M Aldana, H Larralde, and B Vázquez. On the emergence of collective order
in swarming systems: a recent debate. International Journal of ModernPhysics B, 23(18):3661–3685, 2009.
[25] John Toner and Yuhai Tu. Long-range order in a two-dimensional dynamical
xy model: how birds fly together. Physical Review Letters, 75(23):4326, 1995.
[26] Yoichiro Nambu. Quasi-particles and gauge invariance in the theory of
superconductivity. Physical Review, 117(3):648, 1960.
[27] Jeffrey Goldstone. Field theories with «superconductor» solutions. Il NuovoCimento (1955-1965), 19(1):154–164, 1961.
[28] Michele Ballerini, Nicola Cabibbo, Raphael Candelier, Andrea Cavagna,
Evaristo Cisbani, Irene Giardina, Vivien Lecomte, Alberto Orlandi, Giorgio
Parisi, Andrea Procaccini, et al. Interaction ruling animal collective behavior
depends on topological rather than metric distance: Evidence from a field
study. Proceedings of the national academy of sciences, 105(4):1232–1237,
2008.
[29] William Bialek, Andrea Cavagna, Irene Giardina, Thierry Mora, Oliver Pohl,
Edmondo Silvestri, Massimiliano Viale, and Aleksandra M Walczak. Social
interactions dominate speed control in poising natural flocks near criticality.
Proceedings of the National Academy of Sciences, 111(20):7212–7217, 2014.
[30] Andrea Cavagna, Alessio Cimarelli, Irene Giardina, Giorgio Parisi, Raffaele
Santagati, Fabio Stefanini, and Massimiliano Viale. Scale-free correlations in
starling flocks. Proceedings of the National Academy of Sciences,
107(26):11865–11870, 2010.
[31] Julia K Parrish and William M Hamner. Animal groups in three dimensions:how species aggregate. Cambridge University Press, 1997.
[32] Craig W Reynolds. Flocks, herds and schools: A distributed behavioral model.
ACM SIGGRAPH computer graphics, 21(4):25–34, 1987.
[33] Charlotte K Hemelrijk and Hanno Hildenbrandt. Self-organized shape and
frontal density of fish schools. Ethology, 114(3):245–254, 2008.
[34] Iain D Couzin, Jens Krause, Richard James, Graeme D Ruxton, and Nigel R
Franks. Collective memory and spatial sorting in animal groups. Journal oftheoretical biology, 218(1):1–11, 2002.
[35] Daniel Strömbom. Collective motion from local attraction. Journal oftheoretical biology, 283(1):145–151, 2011.
[36] Dirk Helbing, Anders Johansson, Joachim Mathiesen, Mogens H Jensen, and
Alex Hansen. Analytical approach to continuous and intermittent bottleneck
50

flows. Phys. Rev. Lett., 97(16):168001, 2006.
[37] Dirk Helbing, Joachim Keltsch, and Peter Molnar. Modelling the evolution of
human trail systems. Nature, 388(6637):47–50, 1997.
[38] Serge P Hoogendoorn and Piet HL Bovy. Pedestrian route-choice and activity
scheduling theory and models. Transport. Res. B - Meth., 38(2):169–190,
2004.
[39] Dirk Helbing, Anders Johansson, and Habib Zein Al-Abideen. Dynamics of
crowd disasters: An empirical study. Phys. Rev. E, 75(4):046109, 2007.
[40] Dorine C Duives, Winnie Daamen, and Serge P Hoogendoorn. State-of-the-art
crowd motion simulation models. Transport. Res. C - Emer., 37:193–209,
2013.
[41] Dirk Helbing and Peter Molnar. Social force model for pedestrian dynamics.
Phys. Rev. E, 51(5):4282, 1995.
[42] Mehdi Moussaïd, Dirk Helbing, and Guy Theraulaz. How simple rules
determine pedestrian behavior and crowd disasters. Proc. Natl. Acad. Sci.U.S.A., 108(17):6884–6888, 2011.
[43] Dirk Helbing and Anders Johansson. Pedestrian, crowd and evacuationdynamics. Springer, 2011.
[44] Rainald Löhner. On the modeling of pedestrian motion. Appl. Math. Model.,34(2):366–382, 2010.
[45] Hui Xi, Seungho Lee, and Young-Jun Son. An integrated pedestrian behavior
model based on extended decision field theory and social force model. In
Human-in-the-Loop Simulations, pages 69–95. Springer, 2011.
[46] Dirk Helbing, Illés Farkas, and Tamas Vicsek. Simulating dynamical features
of escape panic. Nature, 407(6803):487–490, 2000.
[47] Wenjian Yu and Anders Johansson. Modeling crowd turbulence by
many-particle simulations. Physical review E, 76(4):046105, 2007.
[48] Emiliano Cristiani, Benedetto Piccoli, and Andrea Tosin. Multiscale modeling
of granular flows with application to crowd dynamics. Multiscale Model. Sim.,9(1):155–182, 2011.
[49] Sylvain Faure and Bertrand Maury. Crowd motion from the granular
standpoint. Math. Mod. Meth. Appl. S., 25(03):463–493, 2015.
[50] LF Henderson. The statistics of crowd fluids. Nature, 229:381–383, 1971.
[51] Victor J Blue and Jeffrey L Adler. Cellular automata microsimulation for
modeling bi-directional pedestrian walkways. Transportation Research PartB: Methodological, 35(3):293–312, 2001.
[52] RL Hughes. The flow of large crowds of pedestrians.
[53] Nicola Bellomo, Benedetto Piccoli, and Andrea Tosin. Modeling crowd
dynamics from a complex system viewpoint. Mathematical models andmethods in applied sciences, 22(supp02):1230004, 2012.
[54] Anders Eriksson, Martin Nilsson Jacobi, Johan Nyström, and Kolbjørn
Tunstrøm. Determining interaction rules in animal swarms. BehavioralEcology, 21(5):1106–1111, 2010.
[55] Christian A Yates, Radek Erban, Carlos Escudero, Iain D Couzin, Jerome
Buhl, Ioannis G Kevrekidis, Philip K Maini, and David JT Sumpter. Inherent
noise can facilitate coherence in collective swarm motion. Proceedings of theNational Academy of Sciences, 106(14):5464–5469, 2009.
51

[56] José Manuel Galán, Luis R Izquierdo, Segismundo S Izquierdo, José Ignacio
Santos, Ricardo Del Olmo, Adolfo López-Paredes, and Bruce Edmonds.
Errors and artefacts in agent-based modelling. Journal of Artificial Societiesand Social Simulation, 12(1):1, 2009.
[57] András Czirók, Albert-László Barabási, and Tamás Vicsek. Collective motion
of self-propelled particles: Kinetic phase transition in one dimension. PhysicalReview Letters, 82(1):209, 1999.
[58] Alexander Mogilner and Leah Edelstein-Keshet. A non-local model for a
swarm. Journal of Mathematical Biology, 38(6):534–570, 1999.
[59] Michael T Gastner and Mark EJ Newman. Shape and efficiency in spatial
distribution networks. Journal of Statistical Mechanics: Theory andExperiment, 2006(01):P01015, 2006.
[60] Atsushi Tero, Seiji Takagi, Tetsu Saigusa, Kentaro Ito, Dan P Bebber, Mark D
Fricker, Kenji Yumiki, Ryo Kobayashi, and Toshiyuki Nakagaki. Rules for
biologically inspired adaptive network design. Science, 327(5964):439–442,
2010.
[61] J Buhl, J Gautrais, N Reeves, RV Solé, S Valverde, P Kuntz, and G Theraulaz.
Topological patterns in street networks of self-organized urban settlements.
The European Physical Journal B-Condensed Matter and Complex Systems,
49(4):513–522, 2006.
[62] S P Gorman and R Kulkarni. Spatial small worlds: new geographic patterns
for an information economy. Environment and Planning B: Planning andDesign, 31(2):273–296, 2004.
[63] Guido Serini, Davide Ambrosi, Enrico Giraudo, Andrea Gamba, Luigi
Preziosi, and Federico Bussolino. Modeling the early stages of vascular
network assembly. The EMBO Journal, 22(8):1771–1779, 04 2003.
[64] Daniel P Bebber, Juliet Hynes, Peter R Darrah, Lynne Boddy, and Mark D
Fricker. Biological solutions to transport network design. Proceedings of theRoyal Society B: Biological Sciences, 274(1623):2307–2315, 2007.
[65] Jerome Buhl, Kerri Hicks, Esther R Miller, Sophie Persey, Ola Alinvi, and
David JT Sumpter. Shape and efficiency of wood ant foraging networks.
Behavioral Ecology and Sociobiology, 63(3):451–460, 2009.
[66] A. Perna, B. Granovskiy, S. Garnier, S. C. Nicolis, M. Labédan, G. Theraulaz,
V. Fourcassié, and D. J. T. Sumpter. Individual Rules for Trail Pattern
Formation in Argentine Ants (Linepithema humile). PLoS ComputationalBiology, 8:2592, July 2012.
[67] Andrea Perna and Tanya Latty. Animal transportation networks. Journal ofThe Royal Society Interface, 11(100), 2014.
[68] M. Barthélemy. Spatial networks. Physics Reports, 499(1–3):1 – 101, 2011.
[69] Alexander RA Anderson and MAJ Chaplain. Continuous and discrete
mathematical models of tumor-induced angiogenesis. Bulletin of mathematicalbiology, 60(5):857–899, 1998.
[70] Ed Bullmore and Olaf Sporns. Complex brain networks: graph theoretical
analysis of structural and functional systems. Nature Reviews Neuroscience,
10(3):186–198, 2009.
[71] William L Garrison and David M Levinson. The transportation experience:policy, planning, and deployment. Oxford university press, 2014.
52

[72] David Levinson. Paying for the fixed costs of roads. Journal of TransportEconomics and Policy (JTEP), 39(3):279–294, 2005.
[73] Bert Hölldobler and Edward O Wilson. The ants. Harvard University Press,
1990.
[74] James Watmough and Leah Edelstein-Keshet. Modelling the formation of trail
networks by foraging ants. Journal of Theoretical Biology, 176(3):357–371,
1995.
[75] Jean-Louis Deneubourg, Simon Goss, Nigel Franks, and JM Pasteels. The
blind leading the blind: modeling chemically mediated army ant raid patterns.
Journal of insect behavior, 2(5):719–725, 1989.
[76] Leah Edelstein-Keshet, James Watmough, and G Bard Ermentrout. Trail
following in ants: individual properties determine population behaviour.
Behavioral Ecology and Sociobiology, 36(2):119–133, 1995.
[77] Ralph Beckers, Jean-Louis Deneubourg, and Simon Goss. Trail laying
behaviour during food recruitment in the ant lasius niger. Insectes Sociaux,
39(1):59–72, 1992.
[78] Tanya Latty, Kai Ramsch, Kentaro Ito, Toshiyuki Nakagaki, David JT
Sumpter, Martin Middendorf, and Madeleine Beekman. Structure and
formation of ant transportation networks. Journal of The Royal SocietyInterface, 8(62):1298–1306, 2011.
[79] Feng Xie and David Levinson. Modeling the growth of transportation
networks: a comprehensive review. Networks and Spatial Economics,
9(3):291–307, 2009.
[80] Peter Haggett and Richard J Chorley. Network analysis in geography. 2015.
[81] Feng Xie and David Levinson. Measuring the structure of road networks.
Geographical Analysis, 39(3):336–356, 2007.
[82] Bhanu M Yerra and David M Levinson. The emergence of hierarchy in
transportation networks. The Annals of Regional Science, 39(3):541–553,
2005.
[83] Patrick Edmund O’Sullivan. Transport policy: geographic, economic, andplanning aspects. Rowman and Littlefield, 1980.
[84] John HE Taplin, Min Qui, Vivian K Salim, and Renlong Han. Cost-benefitanalysis and evolutionary computing: optimal scheduling of interactive roadprojects. Edward Elgar Publishing, 2005.
[85] Rémi Louf, Pablo Jensen, and Marc Barthelemy. Emergence of hierarchy in
cost-driven growth of spatial networks. Proceedings of the National Academyof Sciences, 110(22):8824–8829, 2013.
[86] M. Brede. Coordinated and uncoordinated optimization of networks. Phys.Rev. E, 81:066104, 2010.
[87] M. Brede. Optimal synchronization in space. Phys. Rev. E, 81:025202(R),
2010.
[88] M. Barthélemy and A. Flammini. Optimal traffic networks. J. Stat. Mech.,(07):L07002, 2006.
[89] M.T. Gastner and M.E.J. Newman. Optimal design of spatial distribution
networks. Phys. Rev. E, 74:016117, 2006.
[90] Michael T Gastner and Mark EJ Newman. The spatial structure of networks.
The European Physical Journal B-Condensed Matter and Complex Systems,
53

49(2):247–252, 2006.
[91] Guénaël Cabanes, Ellen van Wilgenburg, Madeleine Beekman, and Tanya
Latty. Ants build transportation networks that optimize cost and efficiency at
the expense of robustness. Behavioral Ecology, page aru175, 2014.
[92] Vito Latora. Efficient behavior of small-world networks. Physical ReviewLetters, 87(19), 2001.
[93] Zoe Cook, Daniel W Franks, and Elva JH Robinson. Efficiency and robustness
of ant colony transportation networks. Behavioral Ecology and Sociobiology,
68(3):509–517, 2014.
[94] Vitor HP Louzada, Fabio Daolio, Hans J Herrmann, and Marco Tomassini.
Generating robust and efficient networks under targeted attacks. arXiv preprintarXiv:1207.1291, 2012.
[95] Ellen Van Wilgenburg and Mark A Elgar. Colony characteristics influence the
risk of nest predation of a polydomous ant by a monotreme. BiologicalJournal of the Linnean Society, 92(1):1–8, 2007.
[96] Reka Albert, Hawoong Jeong, and Albert-Laszlo Barabasi. Error and attack
tolerance of complex networks. Nature, 406(6794):378–382, 07 2000.
[97] R. Ferrer i Cancho and R.V. Solé. Optimization in complex networks. In
Statistical Mechanics of Complex Networks, volume 625 of Lecture Notes inPhysics, pages 114–125. Springer, 2003.
[98] J.R. Banavar, A. Maritan, and A. Rinaldo. Size and form in efficient
transportation networks. Nature, 399:130, 1999.
[99] John Glen Wardrop. Road paper. some theoretical aspects of road traffic
research. Proceedings of the institution of civil engineers, 1(3):325–362, 1952.
[100] Nisha Mathias and Venkatesh Gopal. Small worlds: How and why. Phys. Rev.E, 63:021117, Jan 2001.
[101] A. Maritan, F. Colaiori, A. Flammini, M. Cieplak, and J.R. Banavar.
Universality classes of optimal networks. Science, 272:984–986, 1996.
[102] Andrew Adamatzky. Bioevaluation of World Transport Networks. WORLD
SCIENTIFIC, 2013.
[103] Alex Fabrikant, Elias Koutsoupias, and Christos H Papadimitriou.
Heuristically optimized trade-offs: A new paradigm for power laws in the
internet. In Automata, languages and programming, volume 2380 of LectureNotes in Computer Science, pages 110–122. Springer, 2002.
[104] T. Greaves and R. D. Hughes. The population biology of the meat ant.
Australian Journal of Entomology, 13(4):329–351, 1974.
[105] Derek J de Solla Price. Networks of scientific papers. Science,
149(3683):510–515, 1965.
[106] Albert-László Barabási and Réka Albert. Emergence of scaling in random
networks. science, 286(5439):509–512, 1999.
[107] Luıs A Nunes Amaral, Antonio Scala, Marc Barthelemy, and H Eugene
Stanley. Classes of small-world networks. Proceedings of the nationalacademy of sciences, 97(21):11149–11152, 2000.
[108] Sergei N Dorogovtsev and José FF Mendes. Evolution of networks: Frombiological nets to the Internet and WWW. OUP Oxford, 2013.
[109] Alain Barrat, Marc Barthélemy, and Alessandro Vespignani. Weighted
evolving networks: coupling topology and weight dynamics. Physical review
54

letters, 92(22):228701, 2004.
[110] Subhrangshu S Manna and Parongama Sen. Modulated scale-free network in
euclidean space. Physical Review E, 66(6):066114, 2002.
[111] David Levinson and Bhanu Yerra. Self-organization of surface transportation
networks. Transportation Science, 40(2):179–188, 2006.
[112] Alessio Cardillo, Salvatore Scellato, Vito Latora, and Sergio Porta. Structural
properties of planar graphs of urban street patterns. Physical Review E,
73(6):066107, 2006.
[113] Duncan J Watts and Steven H Strogatz. Collective dynamics of small-world
networks. nature, 393(6684):440–442, 1998.
[114] Andrea Perna, Sergi Valverde, Jacques Gautrais, Christian Jost, Ricard Solé,
Pascale Kuntz, and Guy Theraulaz. Topological efficiency in
three-dimensional gallery networks of termite nests. Physica A: StatisticalMechanics and its Applications, 387(24):6235–6244, 2008.
[115] Walter R Tschinkel. The nest architecture of the florida harvester ant,
pogonomyrmex badius. Journal of Insect Science, 4(1):21, 2004.
[116] J-L Deneubourg, Serge Aron, Simon Goss, and Jacques M Pasteels. The
self-organizing exploratory pattern of the argentine ant. Journal of insectbehavior, 3(2):159–168, 1990.
[117] Ralph Beckers, Jean-Louis Deneubourg, and Simon Goss. Modulation of trail
laying in the antlasius niger (hymenoptera: Formicidae) and its role in the
collective selection of a food source. Journal of Insect Behavior,
6(6):751–759, 1993.
[118] Nigel R Franks, Katherine A Hardcastle, Sophie Collins, Faith D Smith,
Kathryn ME Sullivan, Elva JH Robinson, and Ana B Sendova-Franks. Can ant
colonies choose a far-and-away better nest over an in-the-way poor one?
Animal Behaviour, 76(2):323–334, 2008.
[119] JD McIver. Dispersed central place foraging in australian meat ants. InsectesSociaux, 38(2):129–137, 1991.
[120] NE Heller, KK Ingram, and DM Gordon. Nest connectivity and colony
structure in unicolonial argentine ants. Insectes Sociaux, 55(4):397–403, 2008.
[121] David A. Holway and Ted J. Case. Mechanisms of dispersed central-place
foraging in polydomous colonies of the argentine ant. Animal Behaviour,
59(2):433 – 441, 2000.
[122] S. Ellis, D. W. Franks, and E. J.H. Robinson. Resource redistribution in
polydomous ant nest networks: local or global? Behavioral Ecology, 25(5),
2014.
[123] Dirk Helbing, Frank Schweitzer, Joachim Keltsch, and Péter Molnár. Active
walker model for the formation of human and animal trail systems. Physicalreview E, 56(3):2527, 1997.
[124] N.E. Heller, K.K. Ingram, and D.M. Gordon. Nest connectivity and colony
structure in unicolonial argentine ants. Insectes Sociaux, 55(4):397–403, 2008.
[125] Nigel R Franks, N Gomez, Simon Goss, and Jean-Louis Deneubourg. The
blind leading the blind in army ant raid patterns: testing a model of
self-organization (hymenoptera: Formicidae). Journal of Insect Behavior,
4(5):583–607, 1991.
[126] Nigel R Franks, Anna Dornhaus, Jon P Fitzsimmons, and Martin Stevens.
55

Speed versus accuracy in collective decision making. Proceedings of the RoyalSociety of London B: Biological Sciences, 270(1532):2457–2463, 2003.
[127] Jerome R Busemeyer and James T Townsend. Decision field theory: a
dynamic-cognitive approach to decision making in an uncertain environment.
Psychological review, 100(3):432, 1993.
[128] Ashley JW Ward, James E Herbert-Read, David JT Sumpter, and Jens Krause.
Fast and accurate decisions through collective vigilance in fish shoals.
Proceedings of the National Academy of Sciences, 108(6):2312–2315, 2011.
[129] E Van Wilgenburg and MA Elgar. Colony structure and spatial distribution of
food resources in the polydomous meat ant iridomyrmex purpureus. Insectessociaux, 54(1):5–10, 2007.
56
Top Related