


Languages
Pages
Legal


September 29, 2021 1September 29, 2021 1
Modeling Tool Integration for Comprehensive Electricity Planning
Lawrence Berkeley National Laboratory
Innovations in Electricity Modeling Training for National Council on Electricity PolicyOctober 1, 2021
Juan Pablo Carvallo
This presentation was funded by the U.S. Department of Energy’sOffice of Electricity and Building Technologies Office.

September 29, 2021 2September 29, 2021 2
ContentDistributed energy resource (DER) penetration
Regulatory and modeling needs
• Traditional models and processes• Sequential Integrative Modeling (SIM)• Comprehensive Integrative Modeling (CIM)
Power system planning
Beyond the power system
Questions
Contact information

September 29, 2021 3September 29, 2021 3
Distributed resources impact the whole power system
► DER deployment increased substantially over the past decade across many states.
► DER offers a host of benefits to the generation, transmission, and distribution systems, but these benefits are rarely captured simultaneously.
► Similarly, DER can impose technical and economic constraints and costs on the system, but these are also not captured simultaneously.
► The lack of integration in the analysis may miss capturing the full value of DER or proper assessments for NWA implementations.

September 29, 2021 4September 29, 2021 4
Regulatory and planning needs
► Capture the full stack of benefits and costs from DER
► Understand tradeoffs between, and cost-effective combinations of, distributed and utility scale resources, including required distribution and transmission grid investments for integration
► Know how targeted policies can drive resource deployment in desired directions
Image credit: https://www.energytoolbase.com/newsroom/blog/new-yorks-reforming-the-energy-vision-rev-a-high-level-overview-of-solar-storage-market-drivers

September 29, 2021 5September 29, 2021 5
Modeling requirements to address these needs
► Spatial resolution◼ DER deployed deep into the distribution system◼ Variable renewable resources diversity◼ Transmission and distribution expansion
► Temporal resolution◼ Years for investment◼ Daily or hourly for operation◼ Enough detail to assess resource adequacy
► Objective function◼ What is the simulation horizon? Long-term vs. short-term◼ What is being optimized?◼ Who is it being optimized for?

September 29, 2021 6September 29, 2021 6
The fragmented power system planning process
► Power systems planners have historically drawn a hard line between bulk power system (BPS) and distribution planning
► Integration between resource, distribution and transmission planning varies by jurisdiction
► Some recent integration between demand-side management and distribution planning (e.g., non-wires alternatives and hosting capacity analysis)
► Language from here on: integrated vs. integrative vs. comprehensive

September 29, 2021 7September 29, 2021 7
Two main decisions: investment and operation
► Planning is concerned about investmentor system expansion.
► The solution to a planning problem needs to be operationally realistic.
► The investment and operational problems operate in different time-scales and require different characterization of resources.
► These problems can be linked in different ways, with various tradeoffs.
Helistö, N., Kiviluoma, J., Holttinen, H., Lara, J.D., Hodge, B.-M., 2019. Including operational aspects in the planning of power systems with large amounts of variable generation: A review of modeling approaches. Wiley Interdisciplinary Reviews: Energy and Environment 0, e341. https://doi.org/10.1002/wene.341

September 29, 2021 8September 29, 2021 8
Domain-level modeling: generation-transmission
► Generation-transmission modeling◼ Capacity expansion (CEM, investment)
• Investment problem: What is the least-cost set of resources to meet prescribed load?
• Examples: Plexos/Aurora RPM (NREL), ReEDS (NREL), System Optimizer, Strategist, SWITCH (UC Berkeley)
◼ Production cost (PCM, dispatch)• Operation problem: What is the least-cost dispatch of generation and
transmission resources to meet prescribed load and a host of operational constraints?
• Examples: Plexos, PROMOD, GE-Maps, GridView
◼ Reliability (Power flow)• Physical problem: What are the flows, angles, and voltage levels on a
power system given dispatch decisions, grid configuration, and load (active and reactive) levels and what actions should I take to keep them within standards?
• Example: DigSilent, PowerWorld, PSS-E
BPS

September 29, 2021 9September 29, 2021 9
Domain-level modeling: distribution
► Distribution◼ Capacity expansion
• Investment problem: What are the least-cost distribution system investments to meet reliability and quality of service levels for customers?
• Examples: Reference Network Model
◼ Production cost• Nothing!
◼ Power flow• Physical problem: What are the flows, voltage levels, losses, and
loading levels of a distribution system?• Examples: CYME, Synergi, OpenDSS, GridLab-D

September 29, 2021 10September 29, 2021 10
Domain-level modeling: demand-side management
► Demand-side management and DER
◼ Customer benefits or valuation models determine the optimal sizing of distributed resources to maximize the value for the customer, including increasing reliability and resilience from the customer’s perspective.
◼ Example: DER-CAM, ReOpt, StorageVET ® and DER-VET ® (EPRI)
September 29, 2021 11September 29, 2021 11
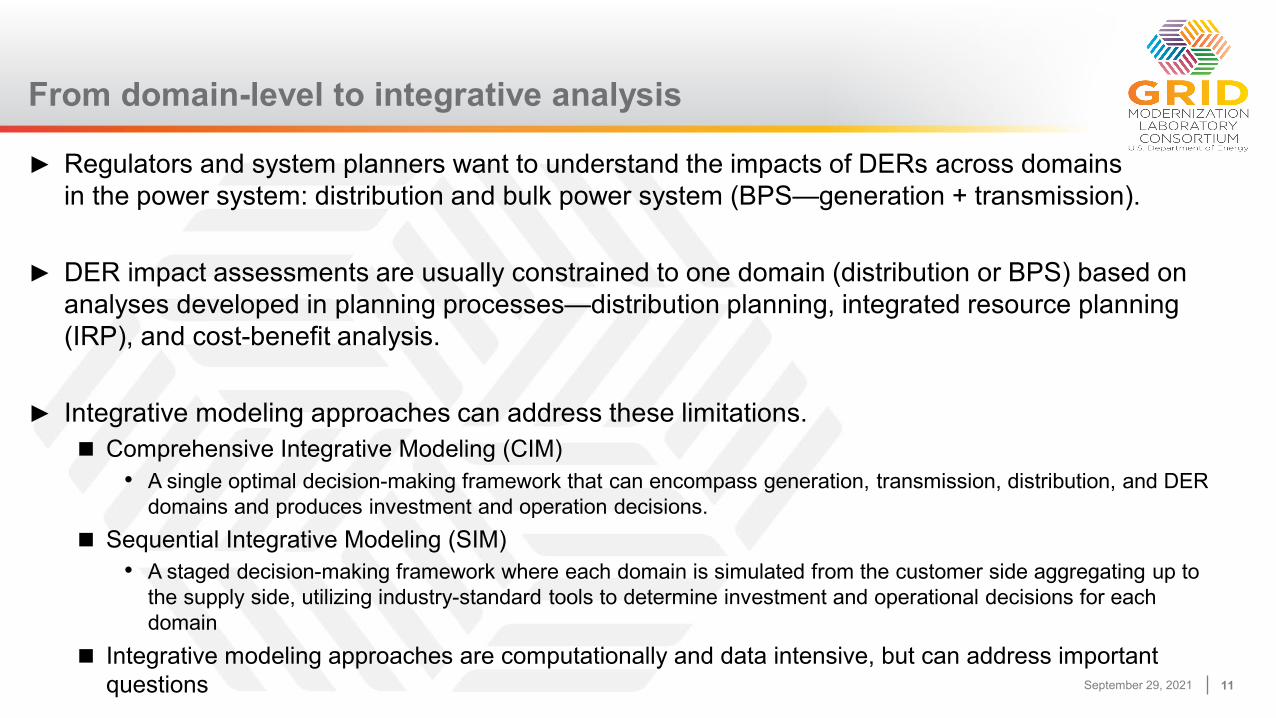
From domain-level to integrative analysis
► Regulators and system planners want to understand the impacts of DERs across domainsin the power system: distribution and bulk power system (BPS—generation + transmission).
► DER impact assessments are usually constrained to one domain (distribution or BPS) based on analyses developed in planning processes—distribution planning, integrated resource planning (IRP), and cost-benefit analysis.
► Integrative modeling approaches can address these limitations.◼ Comprehensive Integrative Modeling (CIM)
• A single optimal decision-making framework that can encompass generation, transmission, distribution, and DER domains and produces investment and operation decisions.
◼ Sequential Integrative Modeling (SIM)• A staged decision-making framework where each domain is simulated from the customer side aggregating up to
the supply side, utilizing industry-standard tools to determine investment and operational decisions for each domain
◼ Integrative modeling approaches are computationally and data intensive, but can address important questions

September 29, 2021 12September 29, 2021 12
SIM framework overview
DER adoption and operational profile scenarios
Native load forecast
Distribution system characterization
BPS characterization
Power flow simulations
and manual
upgrades
Capacity expansion
and production
cost modeling
Net
load Technical
and economic impacts
Rateimpacts
Distribution
BPS

September 29, 2021 13September 29, 2021 13
SIM example #1: Indiana 21st Century Energy Policy
► Define DER adoption levels► Collect these adoption levels in
different scenarios► Produce hourly profiles for each DER,
in addition to net load► Distribution
◼ Locate DER in each representative distribution feeder load node
◼ Cymdist power flow simulations and upgrades
► BPS◼ Aggregate and scale distribution level
load, add industrial load◼ Capacity expansion with Plexos
► Translate cost impacts into rates

September 29, 2021 14September 29, 2021 14
SIM-Indiana: Distribution power flow simulation
► Use API-enabled CYMDIST platform, which allows users to “batch” run simulations
► Simulate maximum and minimum load days, for each cluster/scenario/year combination◼ About 3,500 power flows simulated

September 29, 2021 15September 29, 2021 15
SIM-Indiana: Domain-level cost impacts
► SIM allows capturing cost impacts across all domains for internally-consistent scenarios
► In this example◼ Scenarios with high PV
penetration have lower costs, mostly from generation capacity
◼ However, high EV penetration drives BPS costs up
◼ Distribution impacts are moderate compared to transmission and generation
September 29, 2021 16September 29, 2021 16
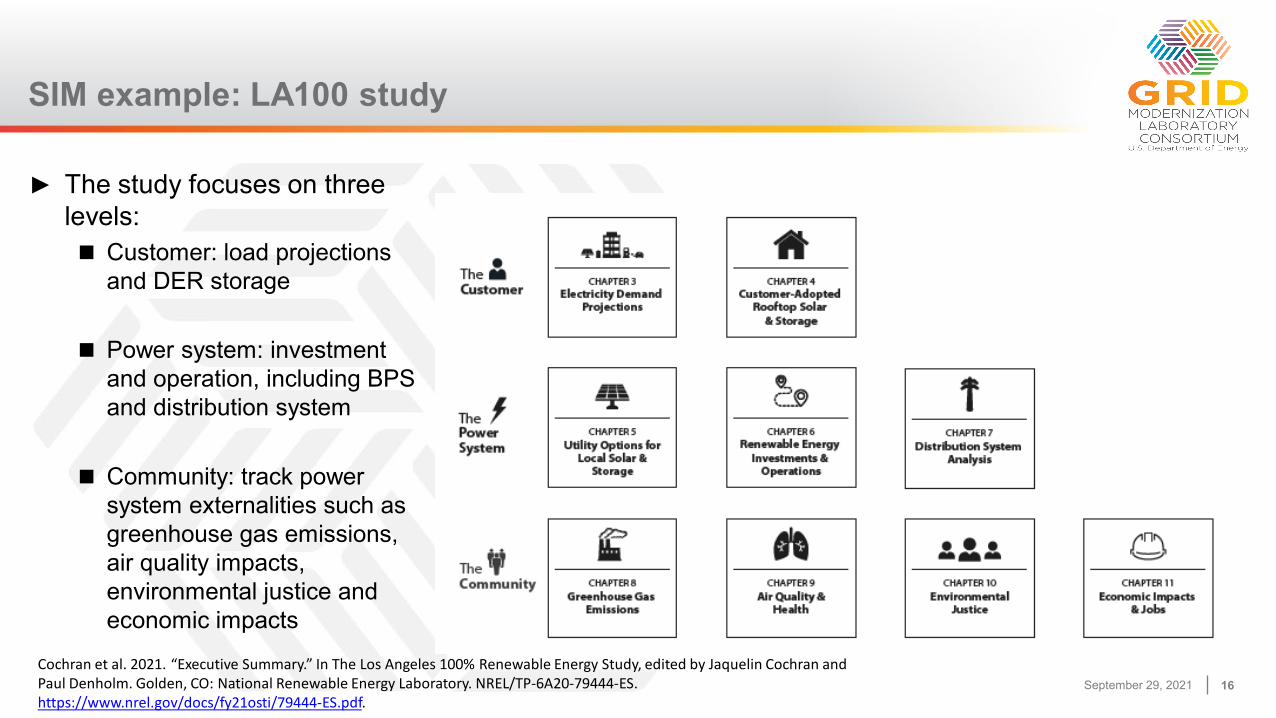
SIM example: LA100 study
► The study focuses on three levels:◼ Customer: load projections
and DER storage
◼ Power system: investment and operation, including BPS and distribution system
◼ Community: track power system externalities such as greenhouse gas emissions, air quality impacts, environmental justice and economic impacts
Cochran et al. 2021. “Executive Summary.” In The Los Angeles 100% Renewable Energy Study, edited by Jaquelin Cochran and Paul Denholm. Golden, CO: National Renewable Energy Laboratory. NREL/TP-6A20-79444-ES. https://www.nrel.gov/docs/fy21osti/79444-ES.pdf.

September 29, 2021 17September 29, 2021 17
SIM example #2: LA100 study
► A much more detailed SIM study conducted by NREL and LADWP
► Sophisticated models to predict DER adoption, building loads, and transportation electrification
► Distribution◼ Analysis performed over ~80% of
LADWP feeders◼ Automatized using EPRI’s OpenDSS
and NREL’s PyDSS, and DISCO tools ► BPS
◼ RPM used for capacity expansion◼ PRAS used to verify resource
adequacy◼ Plexos used for production cost
modeling
Cochran et al. 2021. “Executive Summary.” In The Los Angeles 100% Renewable Energy Study, edited by Jaquelin Cochran and Paul Denholm. Golden, CO: National Renewable Energy Laboratory. NREL/TP-6A20-79444-ES. https://www.nrel.gov/docs/fy21osti/79444-ES.pdf.

September 29, 2021 18September 29, 2021 18
SIM-LA100: Annual generation mix
► Results show the wide range of generation technology options, especially storage.
► Three scenarios produce 100% GHG-free power systems in 25 years.
► Customer (or distributed) PV supplies between 10%-15% of needs. The same substitution pattern with utility scale PV is apparent from these results.
► Hydrogen (TLR?) appears to be a preferred standalone storage technology.
Cochran et al. 2021. “Executive Summary.” In The Los Angeles 100% Renewable Energy Study, edited by Jaquelin Cochran and Paul Denholm. Golden, CO: National Renewable Energy Laboratory. NREL/TP-6A20-79444-ES. https://www.nrel.gov/docs/fy21osti/79444-ES.pdf.

September 29, 2021 19September 29, 2021 19
The need to go from SIM to CIM
► SIM approaches treat DER investment and operation decisions as external (or exogenous) to the model, regardless of whether these are customer- or utility-owned resources.
► This assumption holds in the short- and medium-term, but not so much in the long-term.◼ DER adoption depends on retail rate levels and designs, which in turn depend on the utility’s investment
decisions and cost-recovery mechanisms.
◼ DER adoption will trigger distribution system hosting capacity constraints, which would drive upstream utility investments that will affect rates.
► The full costs and benefits of DER are only captured when optimal decisions across domains are made simultaneously.◼ The model can truly assess the trade-offs of DER and utility-scale resources to supply load and other
system needs.◼ High temporal and spatial granularity can capture locational and time-sensitive value of all resources.

September 29, 2021 20September 29, 2021 20
CIM framework overview
Native load forecast
Distribution system characterization
BPS characterization
Capacity expansion
and production
cost modeling
Generation mix
Transmission expansion
Distribution expansion
DER deployment and operation
Existing DER Stock
Technical and
economic impacts
September 29, 2021 21September 29, 2021 21
CIM example #1: Grid Access and Planning (GAP) model
► The GAP model uses the same idea as the SIM-Indiana model to represent the distribution system by a representative sample of feeders whose results are scaled to the BPS level for integration analysis.
► In contrast to the SIM-Indiana model, the GAP model is a single capacity expansion and production cost model that jointly optimizes:◼ Investment in supply side resources (many options include (V)RE, fossil fuels, and storage)◼ Variable costs of supply side resources◼ Investment in transmission lines and substations◼ Investment in primary distribution lines and transformers (not secondary distribution systems)◼ Investment in distributed resources (PV, storage, and diesel)
► The GAP model can be operated in a decentralized decision making mode to separate:◼ Customer decisions in DER investment and operation to minimize bills and reduce environmental impacts of
energy use◼ Utility decisions to minimize costs and investments to operate the system in response to customer decisions

September 29, 2021 22September 29, 2021 22
CIM: GAP model example results on capacity expansion
Carvallo, J.P., Zhang, N., Murphy, S.P., Leibowicz, B.D., Larsen, P.H., 2020. The economic value of a centralized approach todistributed resource investment and operation. Applied Energy 269, 115071. https://doi.org/10.1016/j.apenergy.2020.115071

September 29, 2021 23September 29, 2021 23
CIM: GAP model identification of distribution modes► Electricity access analysis in Africa that
shows optimal supply mode (grid-only power, DER-only power, or hybrid) for feeders in dense, medium dense, and sparsely populated locations with no previous electricity access
► Charts show that hybrid modes that combine grid and DER power are the most cost effective.
► This model can help answer the question, what is the optimal portfolio to supply customers, and then focus on how to design policies to achieve specific DER technologies, locations, and timing of DER adoption.
Carvallo, J.P., Taneja, J., Callaway, D., Kammen, D.M., 2019. Distributed Resources Shift Paradigms on Power System Design, Planning, and Operation: An Application of the GAP Model. Proceedings of the IEEE 1–17. https://doi.org/10.1109/JPROC.2019.2925759

September 29, 2021 24September 29, 2021 24
CIM: GAP model grid expansion
► Similarly for electricity access in Africa, this analysis shows the capability of the GAP model to physically expand distribution systems to meet minimum end use requirements.
► In mature systems, this is equivalent to deciding whether to continue upgrading and repowering a distribution system compared to deploying distributed resources.
Carvallo, J.P., Taneja, J., Callaway, D., Kammen, D.M., 2019. Distributed Resources Shift Paradigms on Power System Design, Planning, and Operation: An Application of the GAP Model. Proceedings of the IEEE 1–17. https://doi.org/10.1109/JPROC.2019.2925759

September 29, 2021 25September 29, 2021 25
CIM example #2: the WIS:dom® model
► Developed by Vibrant Clean Energy (VCE)◼ Fully integrative CIM used by non-profits (solar, environmental, citizens utility board) and consultants
(GridLab)◼ CEM and PCM versions used by utilities (Holy Cross Energy, Intermountain Rural Electric Association)
► Characterized by:◼ High temporal (5 minute) and spatial (3 km grid) resolution weather data◼ Co-optimization of BPS expansion and dispatch, and an option to co-optimize utility scale and distributed
scale resources without modeling flows in the distribution system but aggregating its impacts◼ Capability of U.S.-wide implementation; the model is able to represent from local grids to entire continents◼ Representation of natural gas infrastructure, with some level of co-optimization of natural gas and
electricity infrastructure◼ Novel technology representation: small modular reactors, hydrogen, ammonia, synthetic fuel production

September 29, 2021 26September 29, 2021 26
CIM: WIS:dom® analysis for California by VCE
► Compared a “traditional” model against a coordinated model that co-optimizes distributed PV and storage to improve distribution system utilization.
► Results are opposite to those from GAP. The coordinated model selects higher levels of distributed solar than the “traditional” model.
https://www.vibrantcleanenergy.com/wp-content/uploads/2021/07/CA_LS4A_Roadmap.pdf

September 29, 2021 27September 29, 2021 27
Shared challenges of SIM and CIM
► Both modeling approaches are very data intensive.◼ Characterize existing generation stock◼ Characterize existing and future transmission lines ◼ Obtain enough information to model the distribution system, either using representative feeders (SIM-
Indiana, GAP) or most/all feeders (LA100)• This typically requires full cooperation of one or more utilities in the area to be analyzed.
◼ Obtain customer-level or at least transformer-level information to allocate DER deployment in suitable ways, recognizing realistic hotspots
◼ Need weather information for thousands of locations to produce wind and solar operational profiles
► In addition, CIM (and SIM, depending on scale) can have onerous computational requirements◼ The Indiana study conducted about ~4,000 simulations.◼ The LA100 study conducted over 25 million simulations.◼ The GAP model takes 12-16 hours to run (up to 2 days in some cases depending on the implementation).
September 29, 2021 28September 29, 2021 28
Beyond the power system: energy models
► Power system models need to make exogenous assumptions about several loads that can operate with other energy carriers because these models cannot represent the fuel tradeoffs:◼ Space heating (heat pumps vs. natural gas/propane/oil)◼ Cooking (electricity vs. natural gas)◼ Transportation (electricity vs. hydrogen vs. fossil fuels)◼ Industrial processes (electricity vs. fossil fuels)
► Energy models go beyond the power system for a regional or national representation of energy needs across different carriers and systems. In some cases they’re able to assess optimal substitutions across fuels and carriers.◼ NEMS: EIA’s long-term fuel price projection model, based on balancing supply and demand for each fuel
with explicit substitution linkages across sectors◼ TIMES: a European energy model that combines technical and economic representation across sectors,
time, and space◼ NAERM: a DOE energy reliability and resilience model that represents the power system, natural gas
system, and their dependencies at a national scale

September 29, 2021 29September 29, 2021 29
Questions states can ask about integrative planning
► What are the impacts of state DER policies on distribution, transmission, and generation investment decisions? How do these decisions change if DER policies are modified or removed?
► What is the impact of distributed storage and PV on utility scale resource decisions? Since a utility cannot control distributed resource deployment, how do you account for or hedge against this uncertainty?
► How do you capture the system-wide benefits of DER when conducting non-wires alternatives analysis?
► How much consistency do you ensure between DER and load forecasts for distribution and BPS planning processes?
► What are typical feeders in your distribution territory and how would their use enable regional-scale distribution system analysis?
► What temporal and spatial resolution should be used to appropriately represent investment and operational decisions in domain-level and integrative planning models?
► How do you ensure resource adequacy in capacity expansion modeling without “forcing” outcomes?► How do I represent customer- vs. utility-owned DER in integrative planning?

September 29, 2021 30September 29, 2021 30
Resources for more information
► Overview of Power Sector modeling (DOE): https://www.energy.gov/sites/prod/files/2016/02/f29/EPSA_Power_Sector_Modeling_020416.pdf
► SIM-LA100: https://maps.nrel.gov/la100/report
► SIM-Indiana: https://emp.lbl.gov/publications/indiana-21st-century-energy-policy
► CIM-GAP model: https://emp.lbl.gov/publications/economic-value-centralized-approach
► CIM-WIS:dom model: https://bit.ly/3CzKm4W
► NEMS: https://www.eia.gov/outlooks/aeo/assumptions/
► NAERM: https://bit.ly/3Cy6I6W

September 29, 2021 31September 29, 2021 31
Resources on non-integrated models
► BPS◼ RPM (NREL): https://www.nrel.gov/analysis/models-rpm.html◼ ReEDS (NREL): https://www.nrel.gov/analysis/reeds/◼ Plexos: https://www.energyexemplar.com/products/plexos◼ GE-Maps (GE): https://www.geenergyconsulting.com/practice-area/software-products/maps◼ GridView (Hitachi-ABB): https://www.hitachiabb-powergrids.com/offering/product-and-system/energy-planning-trading/market-analysis/gridview◼ PROMOD (Hitachi-ABB): https://www.hitachiabb-powergrids.com/offering/product-and-system/energy-planning-trading/market-analysis/promod◼ Power System Optimizer (Enelytix): http://www.enelytix.com/home/pso◼ SWITCH (UC Berkeley): https://rael.berkeley.edu/project/switch/◼ PowerFactory (DigSilent): https://www.digsilent.de/en/◼ PowerWorld (PWC): https://www.powerworld.com/◼ PSS-E (Siemens): https://new.siemens.com/global/en/products/energy/energy-automation-and-smart-grid/pss-software/pss-e.html
► Distribution◼ CYME (Eaton): https://www.cyme.com/software/cymdist/◼ OpenDSS (EPRI): https://www.epri.com/pages/sa/opendss◼ GridLab-D (PNNL): https://www.gridlabd.org/◼ Synergi (DNV): https://www.dnv.com/services/power-distribution-system-and-electrical-simulation-software-synergi-electric-5005◼ Reference Network Model (Univ. Comillas): https://energy.mit.edu/eps/tools/rnm/
► DER◼ DER-CAM (LBNL): https://gridintegration.lbl.gov/der-cam◼ DER-VET (EPRI): https://www.der-vet.com/◼ StorageVET (EPRI): https://www.storagevet.com/◼ ReOpt (NREL): https://reopt.nrel.gov/

September 29, 2021 33
Extra slides

September 29, 2021 34September 29, 2021 34
Power system model types for operation and planning
Physical operation:
• Real time models with high fidelity of the physics of electricity
• Analysis in the range of microseconds to a few seconds
Production cost models (PCM):
• How to optimally operate the system from an economic perspective while respecting many technical constraints
• Relatively detailed simulation of generation technology parameters and transmission power flows
• Analysis in the range of days to months, sometimes a few years
Capacity expansion models (CEM):
• How to optimally expand a power system given forecasts for load, fuel prices, and other resources
• Less detailed simulation but still technically sound, given the need to jointly optimize dispatch and investment decisions
• Analysis in the range of years to decades

September 29, 2021 35September 29, 2021 35
SIM-Indiana: Clusters – Feeder selection
ClusterGeneral description of feeders in cluster
Average customer number
Average total
length (miles)
Average CAIDI (min)
Share of installed capacity
(residential)
Share of installed capacity
(commercial)
Share of installed capacity
(industrial)
Share of circuit length
that is underground
1Short and high commercial, about 1/3 underground 445 9.5 145.1 25% 58% 6% 30%
2 Short, urban residential 567 11.5 142.4 77% 17% 2% 19%
3Suburban mostly overhead, residential, relatively dense 1,472 21.7 135.4 70% 21% 7% 20%
4 Very long residential mostly rural 1,133 59.3 148.5 78% 15% 3% 19%
5Suburban underground residential relatively dense 1,535 26.2 121.4 77% 17% 5% 67%
6Short, heavy industrial, substantial underground 463 10.0 120.8 15% 31% 51% 39%
Top Related