


Languages
Pages
Legal


Modeling and Observational Studies of the Juan de Fuca Eddy
Mike Foreman1, Wendy Wiggins1 , Angelica Peña1, Emanuele Di Lorenzo2,
Barbara Hickey3, Amy MacFadyen3, Vera Trainer4, 1 Institute of Ocean Sciences, Sidney, Canada
2 Georgia Institute of Technology, Atlanta, USA3 University of Washington, Seattle, USA
4Northwest Fisheries Science Center, Seattle, USA

Project Background & Objectives
Juan de Fuca Eddy is a summer upwelling feature off the entrance of Juan de Fuca Strait
may be the initiation site for toxic Pseudo-nitzschia that cause harmful algal blooms impacting clams & crabs along the Washington coastTully (1942), Freeland & Denman (1982), Denman & Freeland (1985), Weaver & Hsieh (1987), Freeland & McIntosh (1989) Freeland & Denman (1982) showed eddy was comprised of upwelled California Undercurrent water
Speculated on eddy force balance but not generation mechanism

Project Background & Objectives
ECOHAB PNW: multi-disciplinary project to study ecology & oceanography of these HABsFive cruises since June 2003 Biological & chemical studiesPhysical & biological modeling
Today’s focus: Physical observationsModel process studies on the eddy generation
MERIS satellite images courtesy of Jim Gower & Steph King
Regional Summer Circulation Features
Schematics courtesy of Rick Thomson

June 2003 Fluorescence (chlorophyll) from MERIS ship winds June 3
June 6 June 15 June 28
Satellite images courtesy of Jim Gower & Steph King

September 2003 Along-Canyon Surveystations temperature
salinity oxygen
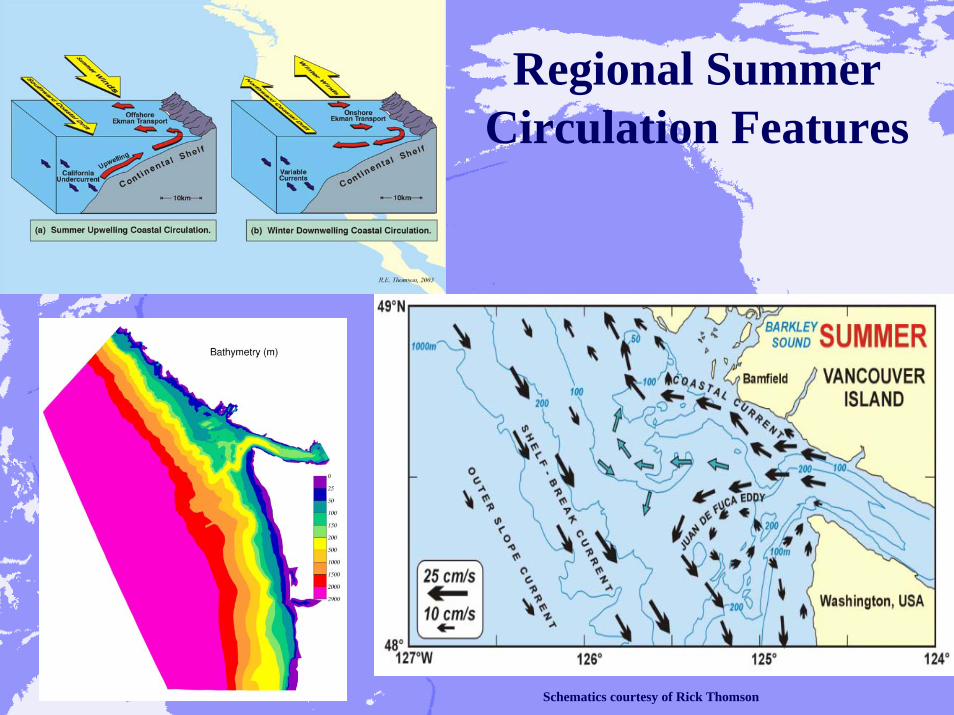
Regional Ocean Modeling System
(ROMS)
Two grids:1. only to eastern JdF2. first grid + Puget, southern Georgia, Fraser & Skagit River discharges
3km resolution30 S-surfaces in vertical3rd order upwind advectionMarchesiello et al. (2001) radiation/nudging boundary conditionsKPP mixingMPI & OpenMP versions

Eddy Generation Process Studies
Average summer circulation1st gridNo tidesAverage summer winds Initial TS from climatology Estuarine flow thru boundary conditions in Juan de FucaRun for 30 days

Steady Summer Wind & Estuarine Flow30 days, 6 hour frames initial TS from climatology
salinity temperature
10m
50m
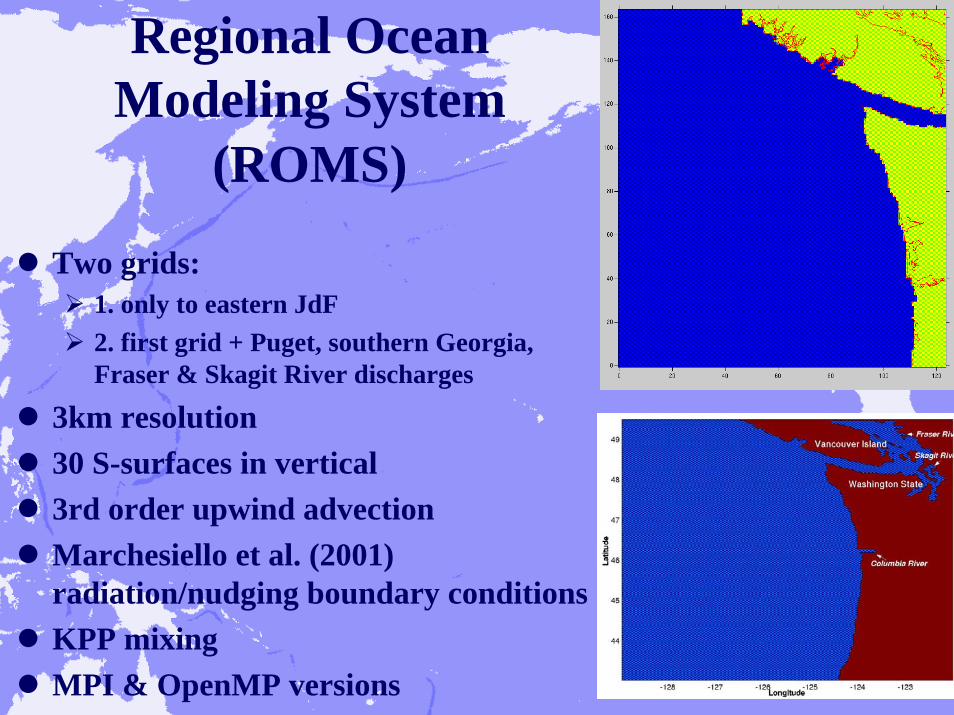
Eddy Generation Process Studies
Average summer circulation conclusionEddy generated from enhanced upwelling off Cape Flattery (?) But we may have prejudiced results by starting with climatology
River discharges2nd grid, no tides or windFraser & Skagit dischargesInitial TS = same profiles everywhereRun for 120 days
River discharges & tides2nd grid, no wind Fraser & Skagit dischargesInitial TS = same profiles everywhereM2, S2, K1, O1 tidal forcing on all boundaries Run for 90 days
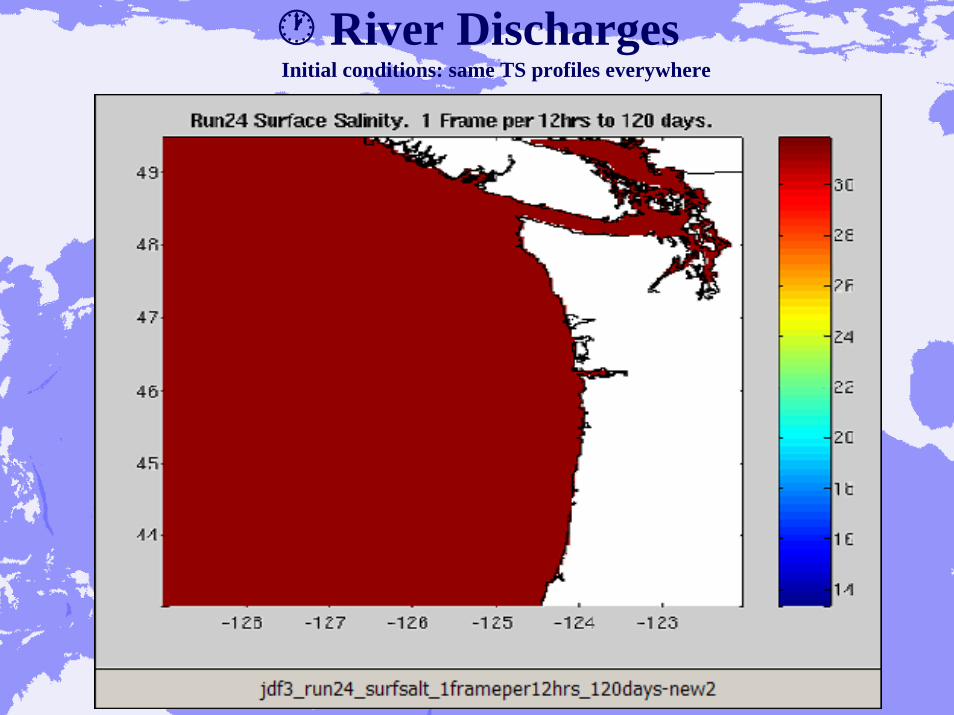
River Discharges Initial conditions: same TS profiles everywhere
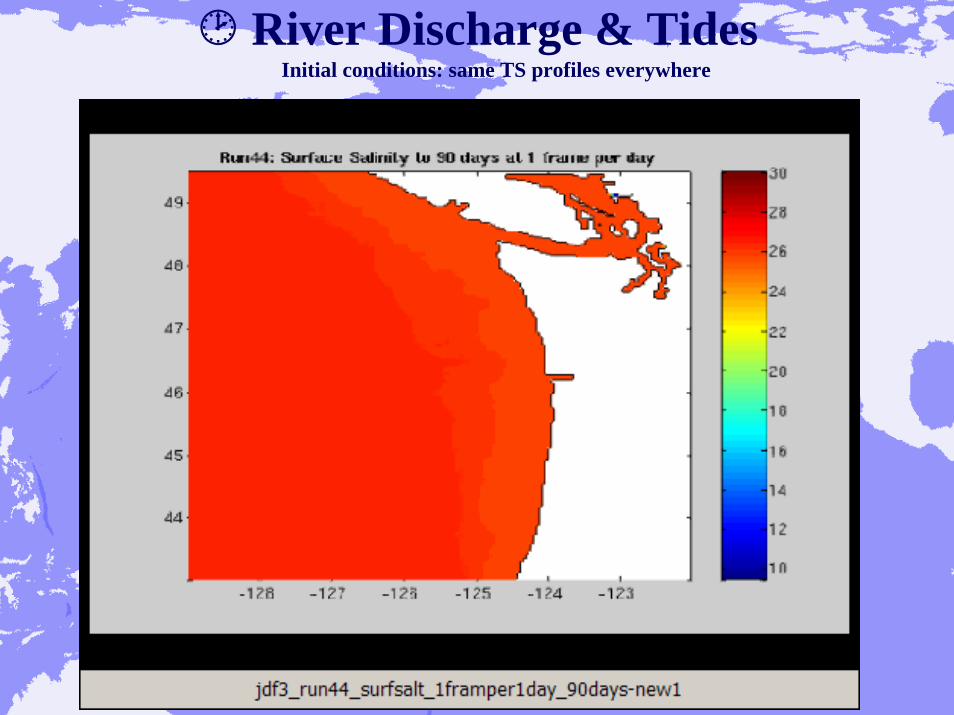
River Discharge & TidesInitial conditions: same TS profiles everywhere

River Discharge Summary
River discharge sets up estuarine flow & coastal current
But too shallow → needs mixingIncluding tides (with 3km resolution)
too much mixing in Gulf & San Juan IslandsPrevents estuarine flow in Juan de Fuca StraitBut intriguing upwelling in JdF
More analyses & simulations required Finer resolution through islandsDifferent mixing ?

ConclusionsObservations:
satellite images show that eddy collapses (surface only?) with northward windsalong-canyon CTD survey shows max upwelling underneath eddy
ROMS process studies:winds & JdF estuarine flow sufficient for eddy formation if start with climatologyWork still needed to generate eddy from winds & river discharge into initial TS profiles
Top Related