


Languages
Pages
Legal


This document is downloaded from DR‑NTU (https://dr.ntu.edu.sg)Nanyang Technological University, Singapore.
Modeling and dynamics analysis ofelectro‑mechanical power‑trains
Zhang, Jidong
2014
Zhang, J. (2014). Modeling and dynamics analysis of electro‑mechanical power‑trains.Doctoral thesis, Nanyang Technological University, Singapore.
https://hdl.handle.net/10356/62504
https://doi.org/10.32657/10356/62504
Downloaded on 29 Dec 2021 13:09:32 SGT

MODELING AND DYNAMICS ANALYSIS OF
ELECTRO-MECHANICAL POWER-TRAINS
ZHANG JIDONG
SCHOOL OF MECHANICAL AND AEROSPACE ENGINEERING
2014
MO
DE
LING
AN
D D
YN
AM
ICS
AN
ALY
SIS
OF
EM
PT
S Z
HA
NG
JIDO
NG
20
14

MODELING AND DYNAMICS ANALYSIS OF
ELECTRO-MECHANICAL POWER-TRAINS
ZHANG JIDONG
School of Mechanical and Aerospace Engineering
A thesis submitted to the Nanyang Technological University
in partial fulfillment of the requirement for the degree of
Doctor of Philosophy
2014

I
ABSTRACT
In the past few decades, the electro-mechanical power-trains (EMPTs) are being
used to replace the conventional power-trains in a few transportations, such as
“More Electric Aircraft” and “Hybrid Electric Vehicle”, to improve the energy
efficiency and reduce greenhouse emissions. In the EMPTs, the electrical
components such as electric machines, power electronics, controllers, and
batteries are introduced. To accommodate these new components, the new
power-train configurations are also involved.
Due to the new components and new configurations, the application of the
EMPTs gets a few challenges, including: (1) the nonlinear dynamics in the
power-trains have not been sufficiently investigated, resulting in a limitation of
the design optimization formulations that can reduce the vibration and noise
levels in the power-trains; (2) the electro-mechanical interactions in an EMPT
are not fully understood, especially the reflection of the vibration signature onto
the stator current of electric machines. Therefore, the stator current has so far
not been effectively utilized to analyze the dynamics and monitor the health of
the EMPTs; and (3) modeling of the EMPTs is challenging and time consuming
due to a large variation in the modeling strategies with respect to an EMPT’s
configuration and the intended research application. In other words, there is a
lack of a modeling strategy that could be applicable to various types of the
EMPTs and be implemented with relative ease.

II
To deal with the before mentioned challenges of the EMPTs, this doctoral
research presents a study of the nonlinear dynamics involving gear rattle and
electro-mechanical interactions in the power-trains, whose dynamic models
were built based on a systematic co-simulation strategy developed for the
EMPTs in the study. The key contributions of this doctoral research are as
follows,
1. A systematic co-simulation modeling strategy, which utilizes the extensive
model libraries of block diagrams (such as MATLAB/SIMULINK), multi-body
system (such as SIMPACK), bond graph (such as 20-SIM), and finite element
analysis (such as ANSYS and ANSOFT), is proposed to model the EMPTs of
various configurations for different research applications. Compared with the
existing modeling methods, the proposed co-simulation strategy is applicable to
various types of EMPTs and at the same time allows for accurate models to be
described with relative ease.
2. The nonlinear dynamics of the power-train having a gearbox during the
occurrence of gear rattle was studied by developing a new analytical
formulation. The formulation evaluated the level of vibrations and noise emitted
during gear rattle by a gearbox with given parameters and therefore can serve as
a guideline for gearbox design to reduce the rattle noise concern. This design
guideline can help in reducing the time and capital in redesigning and
remanufacturing a gearbox, which often result in selection of gearboxes for
automotive transmissions due to the excessive vibration and gear rattle.

III
3. The electro-mechanical interactions were investigated by evaluating the
transfer function from the gearbox vibration to the stator current of the electric
machines. Using this investigation’s result, a novel condition health monitoring
method based on the resonance residual technique is proposed for the EMPTs
through the measured stator current. Compared with the existing condition
health monitoring methods, this new method is shown to be more sensitive to
the incipient faults in the EMPTs.
Keywords: Electro-mechanical power-train; Co-simulation; Nonlinear dynamics
analysis; Electro-mechanical interaction; Gear rattle; Condition health
monitoring; Resonance residual method

IV
ACKNOWLEDGEMENTS
Foremost I would like to express my warmest and sincerest thanks to my
supervisor, Prof. Jaspreet Singh Dhupia, for his kind and patient guidance, keen
insights, encouragements and friendship. He was always around whenever I
needed him, and helped me focus in the right direction. His motivation and
persistence helped me professionally.
I would like to express my gratitude to Nanyang Technological University for
the opportunity to study here with a research scholarship.
Special gratitude goes to Rolls-Royce Singapore Pte. Ltd. for their provided
research funding, and to Dr. Chandana J. Gajanayake and Mr. Nadarajan
Sivakumar from Advanced Technology Center, Rolls-Royce Singapore Pte.
Ltd. for their timely help and advice during my research.
I am also grateful to all the technicians in the Mechatronics Laboratory, and all
the PhD students and staffs in our research group for their support over the past
four year.
Most of all, I owe the greatest debt of gratitude to my family. I would like to
thank my parents for a lifetime of support, encourage, and education. Lastly, I
would like to thank my wife He Li whose love and support has helped to make
everything I have accomplished possible

Table of Contents
V
Table of Contents
Table of Contents .............................................................................................. V
List of Figures ................................................................................................... IX
List of Tables ................................................................................................... XV
List of Symbols .............................................................................................. XVI
Chapter 1 Introduction .................................................................................. 1
1.1 Motivation ............................................................................................. 1
1.2 Problem Statement ................................................................................ 2
1.3 Research Objectives .............................................................................. 3
1.4 Key Contributions ................................................................................. 5
1.5 Organization of the Report .................................................................... 7
Chapter 2 Literature Review....................................................................... 10
2.1 Power Transmission Systems .............................................................. 10
2.1.1 Conventional power-trains ........................................................... 11
2.1.2 Electro-mechanical power-trains ................................................. 21
2.2 Dynamic Modeling of Electro-Mechanical Power-Trains .................. 34

Table of Contents
VI
2.2.1 Existing models of electro-mechanical power-trains ................... 34
2.2.2 Model development methodologies ............................................. 37
2.3 Condition Health Monitoring of Electro-Mechanical Power-Trains .. 47
2.3.1 Mechanical faults ......................................................................... 49
2.3.2 Electrical faults............................................................................. 51
2.3.3 Magnetic faults ............................................................................. 51
Chapter 3 Modeling of Electro-Mechanical Power-Trains ...................... 53
3.1 Co-Simulation Strategy for Power-Trains ........................................... 53
3.2 Model 1: Co-Simulation of Multi-Body System and Block Diagram . 55
3.2.1 Multi-body system modeling approach ........................................ 55
3.2.2 A nonlinear model for a gearbox-based power-train ................... 56
3.3 Model 2: Co-Simulation between Finite Element Method and Block
Diagram .......................................................................................................... 57
3.3.1 Introduction of ANSOFT ............................................................. 57
3.3.2 Modeling of electric machines connected to resistive load ......... 59
3.4 Model 3: Model Development using Block Diagram ......................... 61
3.4.1 Existing blocks in SIMULINK .................................................... 61

Table of Contents
VII
3.4.2 Modeling of faulty planetary gearbox in SIMULINK ................. 62
Chapter 4 An Analytical Method to Evaluate Gear Parameters Effect on
Rattling Noise ................................................................................................... 73
4.1 Introduction ......................................................................................... 73
4.2 Modeling of a Simplified Transmission .............................................. 76
4.2.1 Gearbox parameters ..................................................................... 76
4.2.2 Transmission model under idling conditions ............................... 78
4.3 Analytical Evaluation of the Gear Tooth Impact ................................ 80
4.3.1 Modeling of the gear tooth impact ............................................... 80
4.3.2 Analytical solution ....................................................................... 85
4.4 Results and Discussion ........................................................................ 88
4.4.1 Modeling in SIMPACK ............................................................... 89
4.4.2 Result analysis .............................................................................. 90
4.5 Conclusion ........................................................................................... 95
Chapter 5 Detecting Planetary Gearbox Fault by Motor Current
Signature Analysis ............................................................................................ 97
5.1 An Electro-Mechanical Power-Train Testbed ..................................... 97
5.1.1 Overall configuration ................................................................... 97

Table of Contents
VIII
5.1.2 Control panel ................................................................................ 98
5.1.3 Sensor integration....................................................................... 100
5.1.4 Parameters of the PMSMs .......................................................... 102
5.1.5 Load bank ................................................................................... 102
5.1.6 Planetary gearbox and gear tooth fault creation ......................... 103
5.2 Resonance Residual Technique ......................................................... 104
5.2.1 Motor current signature analysis ................................................ 104
5.2.2 Dynamic model of an electro-mechanical power-train .............. 108
5.2.3 Resonance residual based fault detection technique .................. 112
5.2.4 Simulation results ....................................................................... 119
5.2.5 Experimental validation ............................................................. 125
5.2.6 Conclusion ................................................................................. 133
Chapter 6 Concluding and Remarks ........................................................ 135
6.1 Contributions of this Thesis .............................................................. 136
6.2 Future Work ...................................................................................... 137
Bibliography ................................................................................................... 138
List of Publications ......................................................................................... 152

List of Figures
IX
List of Figures
Figure 1.1 More electric aircraft [1] ..................................................................... 1
Figure 1.2 Hybrid electric vehicle (Toyota, Prius II) [2] ..................................... 1
Figure 2.1 Schematic of the conventional power-train of a typical vehicle [5] . 12
Figure 2.2 Diagram of a four-cylinder four-stroke engine ................................. 12
Figure 2.3 Classification of the gear drives [17] ................................................ 16
Figure 2.4 A pair of meshing gear ..................................................................... 19
Figure 2.5 Time-varying gear meshing stiffness of a gear pair ......................... 19
Figure 2.6 Schematic for a rolling element bearing ........................................... 20
Figure 2.7 Three DOF bearing model [26] ........................................................ 21
Figure 2.8 Schematic diagram of a series-parallel type of HEV [30] ................ 22
Figure 2.9 Hybrid shaft generator propulsion system (Rolls-Royce) [31]......... 23
Figure 2.10 Classification of electric machines [33] ......................................... 24
Figure 2.11 Magnetic axes of a PMSM ............................................................. 26
Figure 2.12 Diagram of a typical electrical drive [46] ....................................... 28
Figure 2.13 Phasor diagram of the PMSM ........................................................ 30

List of Figures
X
Figure 2.14 Block diagram of torque control scheme for PMSM using vector
control [48] ......................................................................................................... 31
Figure 2.15 Empirical model of battery ............................................................. 33
Figure 2.16 Electric equivalent circuit model of battery [7] .............................. 33
Figure 2.17 Electric equivalent circuit model of supercapacitor [7] .................. 34
Figure 2.18 A parallel hybrid power-train [52] .................................................. 35
Figure 2.19 The power-train model for the first gear [62] ................................. 38
Figure 2.20 Schematic diagram of co-simulation in wind turbine [72] ............. 41
Figure 2.21 R-element representation ................................................................ 43
Figure 2.22 Simplified model for the wind turbine using the bond graph [79] . 44
Figure 2.23 Two-axes model of a PM BLDC motor in terms of bond graphs
[80] ..................................................................................................................... 46
Figure 2.24 Fault types in the EMPTs ............................................................... 48
Figure 2.25 Mechanical faults (a) gear tooth crack, (b) bearing inner race defect,
(c) static rotor eccentricity, and (d) shaft crack.................................................. 49
Figure 2.26 Stator winding fault types [106] ..................................................... 50
Figure 2.27 Localized demagnetization [97] ..................................................... 52
Figure 3.1 A co-simulation strategy for EMPTs ................................................ 54

List of Figures
XI
Figure 3.2 Model of a spur gearbox model (a) Co-simulation diagram in
SIMULINK, (b) 3D visual in SIMPACK, and (c) 2D topology diagram in
SIMPACK .......................................................................................................... 58
Figure 3.3 PMSM drives model (a) Stator winding diagram, (b) Cross section,
(c) 2D MAXWELL model, and (d) Model in SIMPLORER coupled with
SIMULINK ........................................................................................................ 60
Figure 3.4 Basic blocks in SIMULINK ............................................................. 62
Figure 3.5 A planetary gear set with four planets and fixed annulus gear ......... 63
Figure 3.6 Block diagram of planetary gearbox in SIMULINK-Section 1 (a)
overall picture, (b) torque vector T, (c) stiffness kap1 between the annulus and
planet 1 ............................................................................................................... 67
Figure 3.7 Block diagram of planetary gearbox in SIMULINK – Section 2 (a)
stiffness vector between the annulus and planets Kap, (b) stiffness matrix K, (c)
row vector k1 ...................................................................................................... 68
Figure 3.8 Block diagram of planetary gearbox in SIMULINK – Section 3 (a)
multiplication of K and Q, (b) multiplication between k1*Q, (c) integrator
operation, and (d) multiplication with M-1 ......................................................... 69
Figure 3.9 Von Mises stress of the gear pair (a) faulty location, and (b) healthy
location ............................................................................................................... 71
Figure 3.10 Displacement of the gear pair ......................................................... 72

List of Figures
XII
Figure 3.11 Gear meshing stiffness of the annulus-planet gear pair .................. 72
Figure 4.1 Gear teeth meshing for a gear pair .................................................... 76
Figure 4.2 A typical five-speed manual transmission ........................................ 79
Figure 4.3 A two-DOF model for the transmission ........................................... 80
Figure 4.4 Gears crossing across backlash (a) gears’ speed profiles, and (b) key
configurations [116] ........................................................................................... 82
Figure 4.5 Single-DOF model for the gear impact ............................................ 84
Figure 4.6 Dynamic model of the transmission ................................................. 90
Figure 4.7 Dynamic transmission error under rattle .......................................... 91
Figure 4.8 (a) Frictional torques and (b) gear teeth contact force at the wheel
gear ..................................................................................................................... 93
Figure 4.9 Normalized RMS of the wheel gear acceleration versus variation in
gear parameters (a) backlash, (b) meshing stiffness, (c) inertia of the wheel gear,
and (d) damping factor ....................................................................................... 94
Figure 4.10 Effect of backlash on the rattling noise level at an angular
acceleration amplitude of 600 rad/s2, based on results for the second gear idler
gear [12] ............................................................................................................. 94
Figure 4.11 Influence of the unloaded gear inertia for an excitation at 45 Hz
[116] ................................................................................................................... 95

List of Figures
XIII
Figure 5.1 Electro-mechanical power-train testbed ........................................... 99
Figure 5.2 Four configurations of the power-train testbed ................................ 99
Figure 5.3 Control panel for the EMPT testbed ............................................... 100
Figure 5.4 Wiring diagram of the current and voltage sensors for three phase
measurement .................................................................................................... 101
Figure 5.5 Speed and torque sensors ................................................................ 101
Figure 5.6 Wiring diagram of the load bank .................................................... 103
Figure 5.7 The simulated tooth crack on the annulus gear .............................. 104
Figure 5.8 Schematic of the investigated electro-mechanical power-train ...... 108
Figure 5.9 Gear meshing stiffness under healthy and faulty conditions .......... 110
Figure 5.10 Diagram of the EMPT model in SIMULINK ............................... 111
Figure 5.11 Two-mass system representation for load generator with equivalent
inertia................................................................................................................ 113
Figure 5.12 Frequency response functions (a) gearbox torque fluctuation to
electrical machine rotor vibration G1(δ), and (b) electrical machine rotor
vibration to stator current signal G2(δ). ............................................................ 115
Figure 5.13 Fault detection algorithm based on resonance residual approach 117

List of Figures
XIV
Figure 5.14 Time waveform of the stator current id (a) healthy condition, and (b)
gear tooth crack ................................................................................................ 121
Figure 5.15 Sidebands excited in the spectra of the stator current (a) healthy
condition, and (b) gear tooth crack. ................................................................. 123
Figure 5.16 Evaluated residual signals obtained from the stator current. ........ 124
Figure 5.17 Stator current spectra under faulty gear tooth based on model in
ANSOFT .......................................................................................................... 125
Figure 5.18 Identification of PMSM’s dominant structural frequencies (a)
speed and acceleration plots for load generator, and (b) spectrum of measured
speed. ................................................................................................................ 126
Figure 5.19 Identification of the overall power-train structural frequencies (a)
speed and acceleration plots of load generator, and (b) spectrum of measured
speed. ................................................................................................................ 127
Figure 5.20 The stator current spectra of load generator (a) overall frequency
band, (b) around structural frequency, and (c) in low frequency range. .......... 130
Figure 5.21 Residual signal of the stator current (a) operating condition I, (b)
operating condition II, and (c) operating condition III .................................... 132

List of Tables
XV
List of Tables
Table 2.1 R, C, and I variables in different physical domains ........................... 43
Table 2.2 Effort and Flow variables in different physical domains ................... 43
Table 2.3 Physical meaning of the variables in the simplified WT model [79] . 44
Table 3.1 SIMPACK library elements used to model components ................... 57
Table 3.2 Parameters of the annulus and planet gear ......................................... 70
Table 4.1 Parameters of the transmission .......................................................... 89
Table 4.2 Model components represented in SIMPACK................................... 89
Table 5.1 Parameters of the PMSM ................................................................. 102
Table 5.2 Parameters of the planetary gear set ................................................ 104
Table 5.3 Parameters of the shaft couplings .................................................... 111
Table 5.4 Parameters for experimental operating conditions........................... 124
Table 5.5 Fault indicators from existing and proposed methods ..................... 133

List of Symbols
XVI
List of Symbols
J inertia of the gear/carrier/rotor
θ angular displacement of the gear/carrier/rotor
rb base radius of the gear/carrier
c gear damping coefficient
k gear meshing stiffness
Na number of teeth on the annulus gear
ϕap1 relative phase for a gear pair consisting of the annulus gear and planet 1
∆k stiffness reduction due to the annulus gear tooth fault
vq and vd terminal voltages in q and d axes
iq and id line currents in q and d axes
λq and λd magnetic flux linkages
ωr electrical rotor speed
rs resistance of stator winding
Tem electromagnetic torque developed by the PMSM
TL load torque
p number of the poles
ωm mechanical rotor speed
ωr electrical rotor speed
Dω viscous damping coefficient
Tch churning torque function is given as
ρlub density of the lubricant oil
Sm immersion area of the gear in the lubricant

List of Symbols
XVII
Tm dimensionless drag torque
h immersed depth of the gear in the lubricant
dc pitch diameter
V0 volume of the lubricant oil
fN contact force acting on the gear teeth surface
ξ dynamic transmission error (DTE)
v0 initial tangential speed of the pinion gear
bls half of backlash
Subscript:
pi represents the planet where i=1 to 4
s, a, and c represents the sun gear, annulus gear, and carrier

Chapter 1 Introduction
1
Chapter 1 Introduction
1.1 Motivation
The electro-mechanical power-trains (EMPTs), also referred to as hybrid
power-trains, are now utilized to replace the conventional power-trains in many
transportation applications such as more electric aircrafts, hybrid electric
vehicles and hybrid electric ships [1-3], as shown in Figure 1.1 and Figure 1.2.
Figure 1.1 More electric aircraft [1]
Figure 1.2 Hybrid electric vehicle (Toyota, Prius II) [2]

Chapter 1 Introduction
2
In the conventional power-trains, there are purely mechanical components.
However, the EMPTs include additional electrical components such as electric
machines, power electronics, controllers, and batteries [1, 4]. These electrical
components can decouple the power generation stage from the power
consuming stage in the power-trains, enabling the engine to always run at an
optimized speed with high energy efficiency [5-7]. As a result, high fuel
efficiency can be achieved in EMPTs during the whole operating period,
reducing the air pollutant emissions.
The new components and new configurations in the power-trains will change
the original dynamics and performance, raising a few concerns: (1) comfort
should be delivered to the users, for example the vibration and noise level
should be reduced as much as possible; (2) safety of the power-train should be
guaranteed and always monitored properly; and (3) the power-train should be
modeled properly to do dynamics investigation.
1.2 Problem Statement
To deal with the concerns on the application of the EMPTs, there still face a few
challenges, i.e., (1) modeling of the EMPTs is time consuming and requires
significant effort due to the variation in the modeling strategy with respect to
the EMPTs’ configuration and the intended investigation applications. There is
a lack of model development methods which allows for overall electro-
mechanical modeling capability and offer a high modeling efficiency in terms
of required effort and accuracy; (2) the nonlinear dynamics in the power-trains
have not been sufficiently investigated, resulting in a lack of the design

Chapter 1 Introduction
3
optimization knowledge, for example, sizing of gearboxes that may reduce the
vibration and noise in the power-trains; and (3) the electro-mechanical
interactions have not been fully investigated, especially the reflection of the
torsional vibration signatures onto the stator current of electric machines. As a
result, the stator current has not been effectively utilized to analyze the
dynamics and carry out health monitoring of the EMPTs.
1.3 Research Objectives
The proposed doctoral research described in this document focuses on
investigating the nonlinear dynamics of the EMPTs and the electro-mechanical
interactions inside EMPTs, which can be used to optimize the system
performance as well as to monitor their health conditions. A systematic co-
simulation strategy will be proposed as well to help people to develop an EMPT
model quickly with easy effort. To achieve these goals, the following specific
tasks have been met:
1. Development of a systematic co-simulation strategy for the EMPTs, which
allows for modeling overall EMPTs with high accuracy that can be applied to
different types of configuration
To ease the efforts of modeling the EMPTs with various configurations and for
different research purposes, a systematic co-simulation strategy is presented
where a graphical user interface to develop block diagram models (such as
MATLAB/ SIMULINK) is used as the platform along with other modeling
techniques integrated to build highly accurate models for the EMPTs. The

Chapter 1 Introduction
4
integrated modeling techniques include multi-body system (such as
SIMPACK), bond graph (such as 20-SIM), and finite element analysis (such as
ANSOFT and ANSYS). This modeling strategy has high efficiency in terms of
required effort and achieved accuracy that is applicable to any EMPTs.
2. Exploration of the nonlinear dynamics of the power-trains to optimize their
dynamic performance
The nonlinear dynamics inside the power-trains can cause a few concerns, for
example, excessive vibration and noise. A typical nonlinear phenomenon for the
gearbox-based power-trains is the gear rattle occurrence. Therefore, the
nonlinear dynamics during the gear rattle is explored. To reduce the gear rattle
excited vibration and noise, the important gear parameters’ effect on the gear
rattle noise level is analytically evaluated, which can provide a guideline for the
gearbox design optimization. This evaluation method has been verified by the
simulation result from a dynamic model built in SIMPACK and by the previous
published experimental results.
3. Investigation of the electro-mechanical interactions, based on which to
propose a novel condition health monitoring technique for the EMPTs
The electro-mechanical interactions in the EMPTs enable to reveal the
mechanical dynamics via electrical signature, and vice versa. An important
application of this feature is to monitor the health condition of the power-trains
based on motor current signature analysis (MCSA). Therefore, a transfer
function between the vibration signature and the stator current of the electric

Chapter 1 Introduction
5
machine is built to investigate the interaction problem. With the analyzed result,
a novel condition health monitoring (CHM) method is developed for the
gearbox based on the resonance residual technique through MCSA. Compared
with the conventional CHM methods, the proposed method is more sensitive to
the incipient gearbox faults.
4. Design of an EMPT experimental testbed and verify the proposed novel
CHM technique
To verify the developed model for the EMPTs as well as the proposed CHM
method based on the resonance residual technique, a reconfigurable testbed has
been designed and built at Mechatronics Laboratory in Nanyang Technological
University. Four different power-train configurations can be achieved in this
testbed. Several types of sensors are integrated into the testbed to acquire
enough dynamics of the EMPTs, including current, voltage, speed, vibration,
and torque. Finally, the developed model and the proposed CHM method are
verified based on the experimental results under various operating conditions.
1.4 Key Contributions
Three key contributions have been made in this project, which are as follows:
1. A systematic co-simulation strategy, which utilizes the extensive model
libraries available for block diagram development in MATLAB/SIMULINK,
multi-body dynamics SIMPACK, bond graph development 20-SIM, and finite
element analysis ANSYS and ANSOFT has been proposed to model the EMPTs
of various configurations for different research applications. Compared with the

Chapter 1 Introduction
6
existing modeling methods, the proposed co-simulation strategy is applicable to
different EMPTs configurations and at the same time provides high modeling
accuracy.
2. The nonlinear dynamics of a gear-based power-train during the gear rattle
occurrence was investigated by developing a new analytical formulation. This
analytical formulation is based on simplifying the gearbox model to a single
DOF model, solving its motion equations, and deriving the RMS of the
unloaded gear acceleration, which is proportional to the gear rattle noise level.
With this technique, the effect of the important gear parameters on the gear
rattle vibration and noise level can be evaluated and a design guideline is
provided to reduce the rattle noise in a gearbox. Compared with the
conventional evaluation methods, the new method needs less time and less
capital cost will be spent in manufacturing and installing the gearbox as well. A
journal manuscript based on this work will soon be submitted to International
Journal of Automotive Technology. A conference paper focusing on effect of
different frictional factors on the gear rattle has been published in ISCIE/ASME
2014 International Symposium on Flexible Automation (ISFA 2014).
3. The electro-mechanical interactions were investigated through analytical
evaluation of transfer function between the gearbox torsional vibration and the
stator current of the electric machines. With this investigation, a novel condition
health monitoring method based on the resonance residual technique is
proposed for the EMPTs through the measured stator current. Compared with
the existing condition health monitoring methods, this new method is more

Chapter 1 Introduction
7
sensitive to incipient faults in an EMPT. A preliminary investigation of electro-
mechanical interactions through simulations were reported in 2012 ASME
Dynamic Systems and Control Conference (DSCC 2012). The analytical basis
of resonance residual technique for stator current analysis was presented in the
2014 IEEE/ASME International Conference on Advanced Intelligent
Mechatronics (AIM 2014). Based on the simulation and experimental
investigation, the novel resonance residual technique was developed and
accepted for publication in IEEE Transactions on Industrial Electronics.
1.5 Organization of the Report
In this chapter, the motivation, problem statement, research objectives and key
original contribution of the proposed research to develop models for the EMPTs,
to explore their nonlinear dynamics, as well as to investigate the electro-
mechanical interaction are described.
Chapter two provides the literature review in the area of the modeling,
dynamics analysis, and CHM of the power-trains. The characteristics of the
mechanical and electrical components as well as the overall configurations of
the power transmissions are explored. Then, three typical modeling strategies
for EMPTs are reviewed and compared. Finally, the typical faults of the EMPTs
as well as the corresponding fault detection approaches are reviewed.
Chapter three proposes a systematic co-simulation strategy to model the EMPTs
with various configurations and for varied investigation applications. A general
description of this modeling strategy is provided to give the readers an overall

Chapter 1 Introduction
8
broad scope of investigation. Several different co-simulation case studies are
presented to illustrate the implementation of this strategy clearly.
Chapter four develops an analytical evaluation method for the gear tooth rattle
impact to investigate the contribution of the gear parameters on the impact.
First, a dynamic model is developed for a typical transmission to describe the
gear rattle dynamics. Then based on the built model, an analytical solution to
obtain RMS of gear acceleration during the rattle impact is derived. Since, this
RMS acceleration value is proportional to the rattling noise, the proposed
analytical evaluation method is capable of investigating the gear parameters’
effect on the rattle noise level, including backlash, meshing stiffness, inertia and
meshing damping factor of the gearbox. To verify the proposed analytical
evaluation method, a MBS dynamic model is developed for a typical
transmission in SIMPACK. Comparing the analytical and dynamic simulation
analysis, it can be found that the proposed analytical method can effectively
predict the influence of gear parameters on the rattle noise. Moreover the
predicted result is also in agreement with previously conducted experimental
results from other researchers. Thus, the proposed evaluation method provides a
simple guideline that can be used to optimize the gearbox parameters to reduce
the gear rattle noise level. A journal manuscript based on this work is currently
under review for publication in International Journal of Automotive
Technology. A conference paper focusing on effect of different frictional
factors on the gear rattle has been published in ISCIE/ASME 2014 International
Symposium on Flexible Automation (ISFA 2014).

Chapter 1 Introduction
9
Chapter five first introduces the configurations and the components of a
configurable EMPT experimental testbed. A dynamic model for a typical EMPT
is built to explore the dynamic response under both the healthy and faulty
gearbox conditions. Then, the transfer functions between the PMSM stator
current response and planetary gearbox vibration are investigated, based on
which a CHM method relied on the resonance residual technique is developed.
Finally, the proposed CHM method is shown to be more sensitive and effective
compared to the existing conventional methods through both simulation and
experiments. A preliminary investigation of electro-mechanical interactions
through simulations were reported in 2012 ASME Dynamic Systems and
Control Conference (DSCC 2012) DSCC. The analytical basis of resonance
residual technique for stator current analysis was presented in the 2014
IEEE/ASME International Conference on Advanced Intelligent Mechatronics
(AIM 2014). Based on the simulation and experimental investigation, the novel
resonance residual technique was written as a journal paper which has been
accepted for publication in IEEE Transactions on Industrial Electronics.
Finally, chapter six provides the concluding remarks and future work of the
research.

Chapter 2 Literature Review
10
Chapter 2 Literature Review
A typical power-train comprises of the power generation, power transmission,
and power consumption. According to the configuration, power-trains can be
divided into conventional or electro-mechanical power-trains (EMPTs).
Compared to the conventional power-trains, the EMPTs can offer significant
benefits in terms of higher energy efficiency and easier control performance.
However, the dynamic features of the electrical components are different from
the mechanical components making it challenging to build a reliable accurate
dynamic response model for the analysis of EMPT. A high fidelity model for
the EMPT can assist in nonlinear dynamics analysis and exploration of electro-
mechanical interactions. Therefore, the overall configurations and the individual
components of the power transmissions are reviewed in Section 2.1. Three
typical modeling strategies for the EMPTs are reviewed in Section 2.2. Finally,
the typical fault types in the EMPTs and the existing condition health
monitoring (CHM) approaches are reviewed in Section 2.3.
2.1 Power Transmission Systems
In this section, the configurations of the conventional power-trains and the
EMPTs are presented and compared. The features of the typical mechanical and
electrical components in the power-trains are reviewed as well.

Chapter 2 Literature Review
11
2.1.1 Conventional power-trains
The conventional power-trains have been around for a while and used in several
applications, where the mechanical power from the prime mover is transmitted
to the load through an assembly of mechanical components. The typical
mechanical components include internal combustion engine (ICE), transmission
shaft, gearbox and bearing.
2.1.1.1 Overall configuration
The conventional power-train in a typical vehicle is used as an example to
illustrate its configuration, where it is made up of the ICE, clutch, transmission,
propeller shaft, final drive and wheels [5] (Figure 2.1). The ICE provides
mechanical power to drive the overall power-train. Speed reduction and torque
increase are implemented inside the transmission through different types of
gears and gear-sets. However, the conventional power-trains can provide a low
energy efficiency due to the facts [6] such as: 1) The ICE has an optimal speed
where the highest efficiency can be achieved. However, the practical vehicle
driving condition is time-varying, 2) To meet certain driving conditions such as
acceleration and climbing, an ICE with a much larger size has to be used in the
vehicle, which can reduce the power-trains’ efficiency and vehicle’s dynamics,
3) Due to frictional losses, significant energy is wasted as heat when the vehicle
is under braking.
2.1.1.2 Internal combustion engine
The ICE converts the chemical energy into mechanical energy. According to the
ICE configuration, it can be divided into the reciprocating engine, rotary engine,

Chapter 2 Literature Review
12
and continuous engine [8, 9]. The reciprocating engine consists of two-stroke
engine, four-stroke engine, six-stroke engine, and so forth. The continuous
combustion engine comprises of the gas turbine.
Figure 2.1 Schematic of the conventional power-train of a typical vehicle [5]
Figure 2.2 Diagram of a four-cylinder four-stroke engine

Chapter 2 Literature Review
13
Reciprocating engines (e.g. Figure 2.2) have a high power-to-weight ratio with
excellent fuel energy density and they are widely used in the vehicles and
marine vessels. The gas turbines can provide a very large power as well and can
be found in airplanes and huge marine vessels. Among reciprocating engines,
the diesel engine has the highest thermal efficiency due to a high compression
ratio. Some diesel engines can have a thermal efficiency over 50 percent.
Dynamics of an internal combustion engine
In a diesel engine, the generated torque can be controlled through calibration
with fuel index to drive the shaft. A dynamic model for the diesel engine is
introduced in [10], where its dynamic is divided into two parts: energy
conversion and crankshaft dynamics. The dynamics of energy conversion
relates the generated torque and the fuel index by the transfer function
( )( )
( )sYs
ekksT
e
s
YY
eng⋅+
∆+=
⋅−
τ
τ
1
1
(2.1)
where Teng is the generated torque, τ is the manifold to power time delay, Y is
the fuel index, kY is the gain constant, and τe is the time constant. Afterwards,
the crankshaft dynamics is obtained from Newton’s second law as
fLeng
cs
cs TTTdt
dJ −−=
ω
(2.2)
where Jcs is inertia of crankshaft, TL is load torque, and Tf is friction torque. To
achieve the expected output rotational speed, a speed control technique of the
diesel engine is introduced in [11], where the fuel injection index is controlled
by a speed controller using the crankshaft speed feedback and reference speed.

Chapter 2 Literature Review
14
Torsional vibration of the ICE
Due to the firing sequence of the ICE, the pulsating components can be
introduced into the driving torque, which can excite torsional vibration in the
power-trains. This torsional vibration can be boosted by some potential factors
such as 1) downsizing of the engine and flywheel to increase the dynamic
response and fuel efficiency, 2) application of the direct-ignition, 3) removal of
the clutch, and 4) unbalance of the engine mass. For example, in a N-cylinder
four-stroke ICE, its speed fluctuates at three times of the mean speed ωm [12],
where N should be an even.
( ) cos2cs m m
Nt tω ω ω ω
= + ∆ ⋅
(2.3)
This torsional vibration may excite the gear rattle phenomenon inside the
backlash that is a significant source of resulting noise and primary cause of
passengers discomfort from power-train dynamics.
2.1.1.3 Transmission shaft
The transmission shafts or propeller shafts can transmit torque and rotational
motion among different rotational components. However, large torsional and
shear stress, for example, under resonance conditions can reduce their expected
life span. The dynamics of a flexible shaft consist of lateral and torsional
vibrations. The shaft bending increases with bearing-to-rotor stiffness ratio and
rotor spin speed [13]. In a power-train with proper bearing support, low
misalignment, low rotor eccentricity, and low rotational speed, the shaft
dynamics is mainly dominated by the torsional vibrations. A flexible shaft can

Chapter 2 Literature Review
15
be described by either a lumped parameter or a distributed parameter model. A
brief description about the two modeling approaches is as follows:
Lumped model
If a shaft’s inertia is much smaller than other rotational components such as the
gearboxes and motor rotor, the shaft can be represented by an equivalent
torsional spring damper system, where the torsional stiffness and damping
coefficient can be obtained as [14, 15]
LGDk 324π=
(2.4)
21
212JJ
JkJc
+= ξ
(2.5)
where G is the shear modulus of shaft, L is the length of shaft, D is the shaft
diameter, J1 and J2 are the inertia of the two rotors connected to the shaft
terminals, ξ is the shaft damping ratio shown to be within 0.005 and 0.075 by
experiments [14, 15]. Dynamic response at low frequency can be provided by a
single degree of freedom (DOF) model which is suitable for preliminary study
of power-trains [16]. Better accuracy can be achieved for higher frequencies by
introducing a multi-DOF lumped model, where the shaft can be divided into
multiple elements along the axial direction with each element being described
as a mass-spring-damper system [13]. Generally, five to ten elements are
sufficient as only the first five to ten natural frequencies have dominant
influence on the shaft dynamics.

Chapter 2 Literature Review
16
Figure 2.3 Classification of the gear drives [17]
Distributed model
Distributed modeling approaches can provide more accurate dynamic response
as they treat the shaft as a continuous system with infinite DOFs. Although the
theoretical knowledge to develop a continuous model for the shaft is available
in the textbooks (e.g. [18]), a significant effort is required to integrate such

Chapter 2 Literature Review
17
models with other power-train components to obtain the mode shapes and
natural frequencies of the overall power-train configurations.
2.1.1.4 Gear drive
A gearbox provides speed, torque and direction conversions from a rotating
component to another one, whose classification [17] is shown in Figure 2.3. In
the practical applications, different types of gear can be combined together to
build a gearbox with a particular configuration. To fit various research
purposes, the static and dynamic models for the gearbox have been developed
[5, 19, 20].
Static gearbox model
By ignoring the power loss and inertia of the gears and assuming the gears to be
rigid, the output speed and torque of a spur gear pair can be described as
( )pbpbwL TrrT −=
(2.6)
( )pbwbpw rr ωω =
(2.7)
where the input gear is referred to as the pinion, the output gear is referred to
the wheel, and rbp and rbw are the base radii of the pinion and wheel. More
accurate results can be achieved by taking the inertia and viscous damping into
consideration [5].
Gearbox dynamic model
To better understand the gearbox transient dynamics, the dynamic models have
been developed by including the gear meshing stiffness, damping coefficient,
and gear profile imperfections in [19, 20]. The number of the gear tooth in

Chapter 2 Literature Review
18
contact is a function of the rotational angle (Figure 2.4), which is usually
designed to be 1 or 2 in a typical spur gear pair. If there are less teeth in contact,
the gear meshing stiffness kg(t) equals to its minimum value kmin. Otherwise, it
equals to its maximum value kmax. Thus, the gear meshing teeth kg(t), varying
with the rotational angle, can be represented as a rectangular waveform as in
Figure 2.5, where TGM is the gear meshing period and ε is the gear contact ratio.
Due to the manufacturing imperfections, such as gear eccentricities, non-
uniform tooth spacing and tooth profile error, transmission error e(t) exists even
in a healthy gearbox. Therefore, it was taken into consideration in the model
developed by [19]. If the variation of the gear meshing stiffness is not a
concern, it can be assumed to be an equivalent constant [21]. The vibration
signal measured on the gearbox housing requires the investigation of the
dynamic response including the translational DOFs, wherein the flexibility of
the supporting bearing should be taken in consideration as well [22-24].
Backlash and gear rattle
The backlash is the amount of clearance between the mated gear teeth, which is
necessary to prevent jamming of the teeth due to manufacturing errors and
thermal expansion [17]. Torsional vibration is inevitable in the power-trains due
to a few potential factors, such as (1) pulsating torque from the ICE, (2)
unbalanced mass of the power-train, and (3) occurrence of the mechanical
resonance and variation of the operation speed. Excited by the torsional
vibration, the gear teeth may vibrate inside the backlash producing the gear
rattle noise. The rattle noise is an important cause of passenger discomfort in
automotive applications.

Chapter 2 Literature Review
19
Figure 2.4 A pair of meshing gear
maxk
mink
GMT
( ) GMT1−ε
Figure 2.5 Time-varying gear meshing stiffness of a gear pair
2.1.1.5 Rolling element bearing
Rolling element bearings (REBs) can support a shaft or housing while
permitting their free motion about a rotation axis [25]. The REBs are usually
composed of four components: outer race, inner race, cage, and rolling elements
(Figure 2.6), where the rolling elements could be balls, straight and tapered
cylinders, as well as spherical rollers. There are many types of REBs available
for various applications, such as deep-groove ball bearing, angular contact ball

Chapter 2 Literature Review
20
bearing, cylindrical bearing, needle bearing, tapered bearings, and spherical
bearing.
Figure 2.6 Schematic for a rolling element bearing
Dynamic model for bearings
A lumped model for the rolling ball bearing was introduced in [25], where it is
modeled as a linear spring and damper connected to ground. A more accurate
dynamic model for the rolling ball bearing was introduced in [26, 27]. In this
model, the ball bearing is assumed as a solid multi-body system. Each
component is connected with others via spring-damper elements (Figure 2.7).
When the load applied to the bearing is moderate, the bearing vibrates linearly.
The bearing motion can be described by a linear second order differential
equation
+ + =Mu Cu Ku Fɺɺ ɺ
(2.8)

Chapter 2 Literature Review
21
where M, C, and K are mass, damping and stiffness matrices respectively. The
force vector F consists of forces in translational directions and momentum
around the rotational axis for each element. Although this model is quite
accurate, it is very difficult to acquire the model parameters in practice.
Figure 2.7 Three DOF bearing model [26]
2.1.2 Electro-mechanical power-trains
The electro-mechanical power-trains (EMPTs) provide a dramatic improvement
in terms of higher energy efficiency and reliability. In an EMPT, in addition to
the mechanical components, the electrical components can also be found such
as electric machine, power electronics, controller and battery.
2.1.2.1 Overall configuration
The configurations of the EMPTs can be divided into the series, parallel, and
series-parallel types [28, 29]. A few manufacturers have launched the products
driven by the EMPTs, such as the vehicles and marine vessels. For example,

Chapter 2 Literature Review
22
Toyota had launched its first hybrid electric vehicle (HEV) “Toyota Prius
(XW10)” in 1997. Currently, its models Prius and Lexus RX400h are driven by
the series-parallel hybrid power-trains. A typical series-parallel EMPT can be
found in [30] (Figure 2.8), where there are two permanent magnet synchronous
machines (PMSMs) MG1 and MG2. These two PMSMs are connected to the
battery through the inverter. Both PMSMs can be controlled to work either as a
motor or as a generator.
Figure 2.8 Schematic diagram of a series-parallel type of HEV [30]
At low driving speed, the vehicle can be driven by MG1 alone without
switching on the ICE. At high speed, the ICE is switched on to drive the vehicle
itself while maintaining high fuel efficiency. During the acceleration or
climbing, MG1 can be used to boost the torque to help the ICE to drive the

Chapter 2 Literature Review
23
HEV. Therefore, the power redundancy required from ICE in conventional
power trains can be removed, which means that the size of the ICE only needs
to meet the normal driving condition. As the speed of MG1 and MG2 is
controlled and the ICE only runs at its optimal speed, the size of the
transmission can be reduced as well. Regeneration is also implemented during
braking, where the PMSMs operates as a generator to provide a braking torque
and the battery is charged by the generated electricity [7]. This feature can
significantly increase the energy efficiency especially under run-stop-run
conditions encountered in city driving.
Figure 2.9 Hybrid shaft generator propulsion system (Rolls-Royce) [31]
Figure 2.9 presents a hybrid shaft generator propulsion system built by Rolls-
Royce for the marine vessels [31, 32]. The shaft motor/generator (MG) can
work as either a motor or generator. Power electronics and controllers regulate
the power flow among the shaft MG, the two diesel generators, and the battery.
There are five working modes for the EMPTs in the marine vessels, i.e., Boost,
Diesel electric, Combinatory, Transit, and Shore connection. According to the

Chapter 2 Literature Review
24
cruise speed and load of the marine vessels, the EMPTs can be automatically or
manually controlled to operate under one mode which can provide the highest
fuel efficiency. With this hybrid configuration, the fuel consumption of the
marine vessels can be reduced by 5-30% [32]. Therefore, an EMPT can provide
better fuel efficiency and reduced emission in this application area as well.
2.1.2.2 Electric machines
An electric machine is an electro-mechanical device used for conversion
between the electrical and mechanical energy. In an EMPT, it can work as a
generator by converting the mechanical energy to electricity using the power
generation from the ICE or during regenerative braking. Also, EPMTs employ
electric machines to work as a motor to drive the power-trains. According to
their configuration, they can be divided into AC and DC types [33] as in Figure
2.10.
Figure 2.10 Classification of electric machines [33]

Chapter 2 Literature Review
25
Due to the size and maintenance limitations, the DC machines are rarely used in
EMPTs. Currently most of EMPTs are employing AC machines such as the
induction machine (IM), switched reluctance machine (SRM), field-excited
synchronous machine (FESM), and the permanent magnet (PM) machine. The
IM, FESM and SRM are more robust and less expensive than the PM machines,
however they do have some limitations [33]: (1) the IM and the FESM have
lower efficiency as some of the energy is required to create the rotor magnetic
field, (2) the SRM has a higher torque ripple and acoustic noise as it is driven
only by the reluctance torque. The PM machines have a higher energy
efficiency and power density as the rare-earth magnets on the rotor can produce
a strong magnetic field without any need for electric power. According to the
power source (sinusoidal type or trapezoidal type), the PM machines can be
divided into PMSM and PM Brushless DC machine (PM BLDC) [34]. The
selection of the electric machine types depends on the capital cost, space
limitation, and performance requirement. The AC machine dynamics have been
studied by using both the linear and nonlinear models.
Linear model
As a classical linear model for the AC machines, Park’s model [33] has been
proven to be effective enough in designing the control strategies for the AC
machines. In this model, the variables (voltage, current, and magnetic flux
linkage) associated with the stator winding are referred to a new reference
frame. By this transformation, the time-varying inductances become constant in
the new reference frame, reducing the complexity of the analysis.

Chapter 2 Literature Review
26
The PMSMs can be described by Park’s model [35] as Eqn. (2.9-2.12). Inside a
PMSM, there are three-phase stator windings on the stator and PM poles on the
rotor as in Figure 2.11.
Figure 2.11 Magnetic axes of a PMSM
dtdirv qdrqsq λλω ++=
(2.9a)
dtdirv dqrdsd λλω +−=
(2.9b)
qqq iL=λ
(2.9c)
fddd iL λλ ′+=
(2.9d)
where vq and vd are the terminal voltages in q and d axes, iq and id are the line
currents in q and d axes, ωr is the electrical rotor speed, rs is the resistance of
stator winding, λq and λd are the magnetic flux linkages. The electromagnetic
torque developed by the PMSM is

Chapter 2 Literature Review
27
( )[ ]dqqdqfe iiLLip
T −+′= λ22
3
(2.10)
where p is the number of the poles. The motion equation of the PMSM is
Lme
m TDTdt
dJ −−= ω
ωω
(2.11)
where ωm is the mechanical rotor speed, J is the rotor inertia, Dω is the viscous
damping coefficient, and TL is the load torque. The relationship between ωr and
ωm is
rmp
ωω ⋅=2
(2.12)
To linearize the machine parameters, Park’s model makes a few assumptions
[33, 36-39], such as (1) no magnetic saturation and core losses, (2) the number
of the stator winding coils is distributed sinusoidally around the stator, (3) the
influence of the stator slot on the magnetic permeance is negligible, and (4) the
ideally balanced three-phase winding. Therefore, Park’s model cannot be used
to analyze the higher order dynamics of the electric machines.
Nonlinear models
Design optimization of the electric machines requires consideration of factors
such as the winding configuration, magnetic saturation, vibration, temperature,
and torque ripple, which can introduce nonlinear dynamics into the models. The
electro-mechanical interactions are affected by the higher order harmonics in
the stator current as well, which requires developing a nonlinear analytical
model such as those built through Finite Element Analysis (FEA). A general
purpose FEA software ANSYS has been proposed to build nonlinear models of

Chapter 2 Literature Review
28
the electric machines to optimize the performance in [40, 41]. There are several
FEA modeling tools available which are specially designed for the nonlinear
modeling of the electric machines, such as ANSOFT, Flux 2D/3D, and Opera-
2D [42-45], where special modules of the electric machine components have
been prepared to reduce the modeling effort.
2.1.2.3 Power electronics converter
The power electronics converter converts the power input at certain alternative
voltage level and frequency to the other voltage level and frequency. A
converter mainly relies on an electronic switch to manage the power conversion
where the switches are controlled by the gating signal from the control circuit.
According to the input and load type, the converter can be divided into four
basic types [46]: AC to DC rectifier, AC to AC cycloconverter, DC to AC
inverter, and DC to DC converter. A typical commercial variable frequency
inverter that is connected to a power grid to drive an electric machine consists
of a DC/AC converter, an AC/DC inverter, a low pass filter circuit, and a gating
signal control unit as shown in Figure 2.12.
Figure 2.12 Diagram of a typical electrical drive [46]

Chapter 2 Literature Review
29
2.1.2.4 Control strategy of electric machines
The control of a DC machine is simple and straightforward as there is no
coupling between the armature current ia and the field flux ϕ excited by either
the field winding current or the permanent magnet in the electromagnetic torque
Te as
ae ikT φ=
(2.13)
where k is a constant determined by the configuration of the DC machine.
However, the electromagnetic torque of an AC machines is determined by the
amplitude, phase, and frequency of the stator current [34, 47], which are
coupled together. Therefore, the AC machine control is much more complex
than that of the DC machine. The control methods of the AC machines can be
mainly divided into scalar control and vector control.
Scalar control
The speed of AC machines is (roughly) proportional to the power supply
frequency f, while the induced voltage V in the AC machines is proportional to
the rotational speed. With scalar control, the voltage of the power supply is set
to be proportional to its frequency such that V/f = constant [47]. Therefore, the
speed of the synchronous machine can be controlled by the variation of the
voltage and frequency. Scalar control is easy to implement and it provides good
steady-state performance. However, its response time to speed/torque variation
is much larger than the vector control.

Chapter 2 Literature Review
30
Vector control
The vector control provides a better dynamic response by controlling not only
the amplitude and frequency of the stator current but also the phase. As in the
phasor diagram of the PMSM in Figure 2.13, the stator current phasor is can be
decoupled into iq and id on the rotor reference frame. A few control strategies
have been proposed through controlling iq and id separately [34], such as the
constant torque-angle control, unity power-factor control, optimum-torque-per-
ampere control, and flux-weakening control.
Figure 2.13 Phasor diagram of the PMSM

Chapter 2 Literature Review
31
Figure 2.14 Block diagram of torque control scheme for PMSM using vector control [48]
In the constant torque-angle control, by setting id to be always zero (δ = π/2) in
Eqn. 2.10, the electromagnetic torque Te will be directly proportional to iq as
qfe ip
T λ ′=22
3
(2.14)
Therefore, the desired torque can be achieved by controlling the stator current iq
alone. A block diagram of the torque control of the PMSM based on the vector
control was presented in Figure 2.14 [48], where the stator current is measured
by Hall Effect sensors and the rotational speed is measured by a resolver /
encoder. The measured variables are used as the feedback signals to the PI
controllers to drive the inverter to output the expected current. The detailed
tuning methods of the PI controllers can be found in several literatures, e.g.
[49].
2.1.2.5 Energy storage system
The most challenging part of the commercialization of the EMPTs is the
portability of the energy storage devices that allow high power output, high

Chapter 2 Literature Review
32
power density, and low cost [7]. The energy storage devices include
rechargeable batteries, supercapacitors, flywheels, fuel cell, and so forth.
Rechargeable battery
Among the energy store systems, the rechargeable batteries play the most
important role. The lead-acid type battery has been used for several decades
with low cost, low power output and low power density. The Lithium-ion (Li-
ion) provides higher power output and power density. However, its application
is limited by the factors: (1) initial cost is much higher than the lead-acid, and
(2) more safety attention is needed.
In an empirical model proposed in [50], the battery was modeled as an ideal
voltage source E0 connected in series with an internal resistance Rb as shown in
Figure 2.15. This model gives a simple relationship between the output current
and voltage. However, it does not consider the time varying internal resistance
of the battery, allowing the drawn energy to be unlimited. Therefore, it is only
suitable for the static evaluation of the capacity and energy density of the
battery.
An electric circuit model for the battery that considers internal chemical
phenomena such as SoC and the diffusion process was introduced in [7] (Figure
2.16), where both the diffusion process and effect of SoC are represented as a
resistance-capacitor parallel circuit. Therefore, this model can provide more
detailed information of the battery dynamics. However, the model parameters
are not always available to the end users, challenging its practical application
[7].

Chapter 2 Literature Review
33
Figure 2.15 Empirical model of battery
Figure 2.16 Electric equivalent circuit model of battery [7]
Supercapacitor
The power density of the supercapacitors is lower compared to the batteries,
however they have a much higher energy efficiency, a higher power output
capability, and a much longer life cycle than the batteries [30]. Therefore, a
hybrid energy storage device consisting of the supercapacitors and batteries is
recommended for the EMPTs to provide a better and more robust dynamic
performance. A simple equivalent electric circuit model for the supercapacitor
was proposed in [7] (Figure 2.17), where C is the capacitance in farads, Rp is the
parallel resistance which accounts for the self-discharging losses, and ESR is the
internal resistance during charging and discharging.

Chapter 2 Literature Review
34
Figure 2.17 Electric equivalent circuit model of supercapacitor [7]
2.2 Dynamic Modeling of Electro-Mechanical Power-Trains
A reliable dynamic model for the EMPT can assist in the nonlinear dynamics
analysis and the electro-mechanical interaction investigation. Therefore,
significant efforts have been put in the development of EMPT models.
2.2.1 Existing models of electro-mechanical power-trains
Compared to the static models of the EMPTs, the dynamic models can provide
transient information through modal analysis, vibration evaluation, dynamics
analysis, and so forth [15, 19, 51].
To evaluate the dynamic performance of the hybrid electric vehicles, the
dynamic models for the hybrid power-trains were built in [52-54], where each
rotor was modeled as inertia and the stiffness was neglected as shown in Figure
2.18. In [53, 54], the Bond Graph method was utilized to model the power-
trains. With this model, the vehicle’s acceleration/braking response to different
driving torque and load conditions can be obtained and optimized. In [55, 56],
dynamic models were built for the wind turbine and vehicles, where the
torsional stiffness of both the transmission shafts and the rotor inertia were

Chapter 2 Literature Review
35
taken into consideration. In [55], a model library was built by the author to
build the overall power-trains. With these models, the modal analysis can be
implemented. Based on this information, the resonance frequency can be
removed from the operating range.
Figure 2.18 A parallel hybrid power-train [52]

Chapter 2 Literature Review
36
The angle-varying gear meshing stiffness accompanied with the rotation of the
gear-based EMPTs results in a lot of vibration and noise [22]. To reduce the
vibration excited by gear meshing stiffness, the stiffness variation was taken
into consideration in the dynamic models developed for the wind turbines [15,
57]. The gearbox models with four different levels of complexity had been built
to compare their dynamic response considering the gear inertia, damping and
stiffness, and shaft stiffness [58]. Not only the gear meshing stiffness but also
the bearings supporting the gears can affect the dynamic transmission error of
the power-trains. Therefore, to obtain a more accurate dynamic transmission
error, the bearing stiffness was included in the models built for the power
transmissions in [59, 60]. Furthermore, the bearing stiffness can affect the
vibration transmission path in the vehicles, and thus it was included in a model
built for the gear rotor bearing system in [24].
The gearbox backlash can cause excessive noise and vibration under rattling
condition, to study the nonlinear dynamics of the gearbox-based power-trains,
the backlash was incorporated in the models for the automotive transmissions in
[61-63] as shown in Figure 2.19. This model can be used to study the nonlinear
vibration and noise excited during the gear rattle occurrence, whose amplitude
is determined by several important gearbox parameters, such as backlash,
stiffness, damping, as well as inertia. However, the effect of these parameters on
the rattle vibration and noise has not been effectively evaluated. The static
transmission error, resulting from the gear profile error and installation error,
was included in a power-train model to explore its effect on nonlinear dynamics
[64]. To explore the dynamics of the power-trains containing the faulty gear

Chapter 2 Literature Review
37
tooth and detect the failure, the effect of the faulty tooth was modeled as a
reduction of the gear meshing stiffness function where the reduction occurs
whenever other gears pass through the faulty teeth [65, 66].
From the reviewed models, it can be concluded that, (1) several models have
been built for different configurations of EMPTs; (2) the focuses of these
models vary according to needs of investigation as well; (3) for higher accuracy,
the model requires more complex modeling approaches.
2.2.2 Model development methodologies
The modeling approaches of these reviewed models of the EMPTs in Section
2.2.1 can be divided into three types: model library [55], bond graph [53, 54,
58], and general mathematical description [65-67].
2.2.2.1 Model library method
With the model libraries consisting of the models for the basic EMPT
components, models for an overall EMPT can be built by searching the suitable
basic models from the model libraries and combining them together. The
modeling tools, such as graphical programming (available in
MATLAB\SIMULINK), multi-body system (SIMPACK), and finite element
analysis (ANSOFT), provide several basic models required in the modeling of
an EMPT where each modeling tool has its own benefits and limitations.
SIMULINK
Integrated with MATLAB, SIMULINK provides a graphical user interface to
model the EMPTs [68]. On one hand, SIMSCAPE, which is incorporated into

Chapter 2 Literature Review
38
Figure 2.19 The power-train model for the first gear [62]
SIMULINK, includes a few models for the EMPT components, such as the
electric machines, power electronics, mechanical shafts and gears. On the other
hand, SIMULINK provides several basic mathematical operation blocks
Fly
Wheel
1st
First G
ear
Input Shaft
Clutch
2nd
3rd
4th
5th
Rev
Output
Shaft
Rev
Pow
er Transm
ission path
Rattling G
ear Pair

Chapter 2 Literature Review
39
(addition / subtraction, multiplication / division, integrator / derivation, and so
forth) and the user-defined functions to help the users to build their own
models. For example, a dynamic model of the vehicle power-train was built
using SIMULINK mathematical blocks and its control strategy was
implemented through these blocks [52]. Although the models in SIMSCAPE
provide useful dynamic information, some nonlinearity is still missed or
difficult to be incorporated, such as the nonlinearity of the electric machines and
the gear meshing stiffness. Therefore to build reliable models for the EMPTs,
the professional electromagnetic and mechanical modeling tools such as
ANSOFT and SIMPACK are utilized.
SIMPACK
The multi-body system (MBS) software SIMPACK provides a model library for
the mechanical components of the power-trains [69]. Compared to SIMULINK
/SIMSCAPE, the models in SIMPACK include more detailed nonlinear
dynamics. For instance, an existing force element representing the angle-
varying gear meshing stiffness can be found in SIMPACK, while a similar
element is not available in SIMULINK. Besides of the provided lumped
models, the distributed models can be integrated into SIMPACK as well
through the model reduction technique (FE-MBS coupling) where the finite
element models of the flexible bodies created in ANSYS can be simplified and
incorporated into SIMPACK.

Chapter 2 Literature Review
40
ANSOFT
ANSOFT consists of several different modeling modules such as MAXWELL
and SIMPLORER which can be used to study the electromagnetics problems
[70]. For example, MAXWELL is capable of modeling the electric machines
with finite element method, enabling to investigate their nonlinear dynamics.
SIMPLORER on the other hand provides basic models of the electrical and
electronics components which can be used to simulate the power electronic
driving circuits of the electric machines at the physical level.
Co-simulation
To take advantage of the various model libraries at the same time, SIMULINK
provides interfaces to integrate SIMPACK, and ANSOFT with SIMULINK. For
example, a co-simulation is implemented between SIMULINK and SIMPACK
to study the driving performance of a semi-active suspension vehicle, where a
detailed multi-body model was established for the vehicle in SIMPACK while
the corresponding hybrid control strategy was implemented in SIMULINK [71].
A wind turbine with doubly fed induction generator was modeled through a co-
simulation between SIMPLORER and SIMULINK, where the generator was
described with a finite element model in SIMPLORER while the drive circuit,
controller implementation, and the power-train are modeled in SIMULINK
[72], as shown in Figure 2.20. A synchronous servo drive under speed control
mode, comprised of a PMSM and a sinusoidal type voltage source inverter, was
investigated by a co-simulation as well where the PMSM and the inverter were
modeled in SIMPLORERE while the control strategy was implemented in
SIMULINK [73]. Compared with the models based on a single model library,

Chapter 2 Literature Review
41
the co-simulation provides more flexibility and reliability in modeling the
EMPTs.
Figure 2.20 Schematic diagram of co-simulation in wind turbine [72]

Chapter 2 Literature Review
42
2.2.2.2 Bond graphs
Bond graphs are domain-independent graphical tools to capture the dynamic
behaviors of physical systems from different domains including the electrical,
mechanical, hydraulic, thermal, fluid, and so forth. The concept of bond graphs
was introduced by H.M.Paynter in 1959 and published in 1961 [74]. The idea
was further developed by Karnopp and Rosenberg [75-77], which enabled the
technique to be put into practice [78].
Modeling principles
In a bond graph, there are four groups of basic standard elements, i.e., three
basic one port passive elements (R, C, I), two basic active elements (SE, SF),
two basic two port elements (TF, GY) and two basic junctions (0, 1). In the
elements or subsystems, places where they can be interconnected are called
(energy) ports. According to the system topology, a model can be built by
connecting the energy ports of the elements to the junction structures through
the bonds, where the junction is the manifestations of the constraints. The
energy exchange among different elements is achieved through the energy ports
which involve two power factors i.e., Effort e and Flow f.
To model a system involving different physical domains, bond graphs propose
the concept of the “analogies”, which means that the components in different
domains that are analogical to each other can be described by the same
elements. For example, in the R-element, the Effort e and the Flow f variables at
the single port are related by a static function e = R×f as in Figure 2.21. Usually,
resistors dissipate energy. This must be true for simple resistors and mechanical

Chapter 2 Literature Review
43
dampers. Similar R-element, C-element and I-element in different physical
domains are shown in Table 2.1. Accordingly, Effort and Flow have different
interpretations in different physical domains as shown in Table 2.2. The product
of the Effort and Flow is the instantaneous power transmitted via the power
port. For example, the energy transmitted to the R-element is P= e×f = R×f 2.
Figure 2.21 R-element representation
Table 2.1 R, C, and I variables in different physical domains
One port element Translation Rotation Electrical
R Damper Rotational damper Resistor
C Spring Torsional spring Capacitor
I Mass Inertia Inductor
Table 2.2 Effort and Flow variables in different physical domains
Bond Graph Translation Rotation Electrical
Effort Force Torque Voltage
e F N τ N.m V V
Flow Velocity Angular velocity Current
f v m/s ω rad/s I A
Examples of bond graph models
As the bond graph method can effectively gain valuable insights about the
system dynamic structure and behavior, models for the power-trains based on
bond graphs can be found in several literatures. For example, bond graph
modeling approach was used for wind turbines to build models of two different
complexity to compare their performance in [79], where the simplified model is

Chapter 2 Literature Review
44
shown in Figure 2.22. The physical meaning of each element is shown in Table
2.3. The models for several electric machines have been developed [80-82]. For
example, a model for a BLDC PM motor was built using the MODELICA bond
graph library in [80] as in Figure 2.23.
Figure 2.22 Simplified model for the wind turbine using the bond graph [79]
Table 2.3 Physical meaning of the variables in the simplified WT model [79]
Term Meaning
T_a Aerodynamic torque
J_H Hub inertia
D_H Hub damping
D_HGB Damping between hub and gearbox
K_HGB Stiffness between hub and gearbox
J_GB Gear wheel inertia
N_g Gearbox ratio
D_GBG Damping between gearbox and generator
K_GBG Stiffness between gearbox and generator
J_G Generator inertia
D_G Generator damping
T_em Electromagnetic torque

Chapter 2 Literature Review
45
Bond graphs provide a straightforward interpretation of physical systems,
giving a clear picture of the configurations. It has a high portability because the
submodels can be re-used elegantly. With the help of the existing software such
as 20-SIM, ENPORT, MODELICA, and COSMO, the co-simulation can be
achieved among models built with bond graphs and the ones based on block
diagram. For example, the bond graph models in 20-SIM can be converted into
S-functions, enabling them to be incorporated into SIMULINK. However,
limitations for bond graphs include: (1) bond graphs do not resemble to the
actual systems, which can be problematic for representation of complex
mechanical structures, and (2) the extension from one-dimensional models to
3D multi-body systems is complex and tedious, requiring the development of
vectorial bond graphs.
2.2.2.3 General mathematical descriptions
Most of the models reviewed in Section 2.2.1 are based on the mathematical
equations describing the dynamics of the power-trains, as the users often have
particular research purposes which cannot be met easily by the commercial
software. These equations can then be solved by numerical integration methods,
such as Euler’s method, Newmark’s method and Runge-Kutta method [24, 56,
83]. This modeling method is applicable to various types of EMPTs as far as
they can be described by the mathematical equations. It is especially useful in
modeling of unconventional systems which, for example, include a new
machine or faulty machine [65, 66].

Chapter 2 Literature Review
46
Figure 2.23 Two-axes model of a PM BLDC motor in terms of bond graphs [80]
The limitations of this general modeling approach are: (1) the derivation and
programming of the equations are energy and time consuming, especially for an
EMPT with complex configuration, (2) this method has a low efficiency as the
model equations built for an existing power-train cannot be directly used in a
power-train with new configurations, resulting in repeated effort, and (3) even
for the power-trains with similar configurations, their model equations vary
according to different research purposes. For instance, the backlash was
included in a power-train model to explore the backlash induced dynamics in
[84]. While the bearing stiffness effect was included in a model for another
power-train to investigate the bearing stiffness induced dynamics in [85].
Although these two models in [84, 85] were built for the power-trains sharing

Chapter 2 Literature Review
47
similar configurations, their equations look quite different from each other.
Therefore, this modeling approach can be considered inefficient.
Thus, in summary the noteworthy arguments for the three modeling techniques
are:
(1) The model library method is more efficient than other approaches as a few
models for the EMPT components have already been built in the libraries.
However, this method is not applicable to certain EMPTs such as the one with
faulty components;
(2) Bond graph provides a straightforward insight into the power-train
structures, while it will take significant effort to model a complex configuration
using this technique, especially a 3D model;
(3) The general mathematical description is applicable to different kinds of
power-trains for various research purposes. However, such models need to be
built from scratch for each configuration or investigation area which results in
repeated effort rendering this modeling method inefficient.
Therefore, there is a lack of an efficient modeling strategy that can provide an
overall electro-mechanical modeling capability for EMPTs.
2.3 Condition Health Monitoring of Electro-Mechanical
Power-Trains
The faults can occur in EMPTs due to many factors including fatigue, excessive
temperature, over speed and over load, high corrosion, strong vibration,

Chapter 2 Literature Review
48
improper manufacturing and maintenance, debris or dirt, and so on [86]. Based
on the fault location, they can be divided into three types: mechanical,
electrical, and magnetic faults as in Figure 2.24. These faults can result in
potential catastrophic accidents, long down-time. And they might require
expensive maintenance. Therefore, detecting such failures at an early stage can
significantly reduce the associated capital losses and down-time.
Figure 2.24 Fault types in the EMPTs
The most common mechanical faults in the power-trains include the gear tooth
fault [87-93], bearing fault [94, 95], rotor eccentricity [96, 97], and shaft fault
[98, 99]. For each type of these faults, examples are given in Figure 2.25. There
have been several approaches to detect the mechanical faults, such as vibration
analysis, acoustic analysis, oil debris analysis, thermal analysis, and motor
current signature analysis (MCSA). Since the mechanical faults might produce
higher temperature and larger vibration levels, the temperature and vibration

Chapter 2 Literature Review
49
information were utilized to detect the bearing faults in [100-102]. The material
loss due to the mechanical fault could result in a reduction of the contact
(a) (b)
(c) (d)
Figure 2.25 Mechanical faults (a) gear tooth crack, (b) bearing inner race defect, (c) static rotor
eccentricity, and (d) shaft crack
2.3.1 Mechanical faults
stiffness, which can excite a periodical vibration signature. For example, in
rolling element bearings, single point fault in the inner race usually manifests
itself as a characteristic frequency in the machine vibration [94, 95] as
( )pBR
B
IRF DDFN
F θcos12
+=
(2.15)

Chapter 2 Literature Review
50
where NB is number of rolling elements, FR is rotor frequency, DB is ball
diameter, θ is ball contact angle, and DP is pitch diameter. Therefore, the
sidebands in the vibration spectrum due to the characteristic frequencies were
used as an indicator to monitor the health condition of the power-trains [87-92].
Due to the electro-mechanical interactions, the vibration signature can be
reflected on the stator current of the electric machines. Therefore, the MCSA
was proposed as an alternative nonintrusive method to detect the rotor
eccentricity, shaft misalignment, and bearing fault [103-105]. However, the
practical application of MCSA still faces some challenges, such as (1) high
background noise exists in the stator current; (2) a few harmonics can be excited
by the electric machines and the mechanical dynamic characteristics; and (3) the
electro-mechanical interaction function has not been fully revealed.
Figure 2.26 Stator winding fault types [106]

Chapter 2 Literature Review
51
2.3.2 Electrical faults
The electrical faults in the EMPTs might occur in the stator winding, power
electronics, sensors, battery, and so on. The potential stator winding faults are
shown in Figure 2.26 ([106]). A few different approaches have been proposed to
monitor the health of the electrical components, such as MCSA, vibration
analysis, thermal analysis, electromagnetic torque analysis, and magnetic flux
analysis. In [107, 108], the motor current signature was processed using the
discrete wavelet transform to extract the energy distribution over different
levels, which can be used as an indicator of the turn-to-turn short circuit fault in
the stator winding. In [109, 110], the sidebands at the first and the second
harmonics of the fundamental frequency in the stator current spectra were
proposed to be a fault indicator of the current sensor measurement error. The
temperature was used to monitor the health condition of the PMSM as well in
[111].
2.3.3 Magnetic faults
Demagnetization can be caused by strong vibrations, overcurrent and high
temperature [97]. For example, when overcurrent is fed into the stator windings,
the PM might not be able to recover its initial residual flux density after
cancelling the armature magnetic reaction, resulting in a demagnetization fault.
A local demagnetization fault is simulated by removing a fraction of the PM
materials on the rotor as shown in Figure 2.27.

Chapter 2 Literature Review
52
Figure 2.27 Localized demagnetization [97]
The demagnetization can be manifested itself by the instantaneous or RMS
back-EMF excited by the PMSM rotor. So the estimation of the d-axis magnet
flux in the synchronous reference frame was proposed to monitor the rotor
demagnetization in [112]. A gradient-based iterative algorithm based on
permeance network method was also developed to calculate the remnant
induction values in the magnet regions and detect demagnetization [113].

Chapter 3 Modeling of Electro-Mechanical Power-Trains
53
Chapter 3 Modeling of Electro-Mechanical Power-Trains
In this chapter, a systematic co-simulation strategy is presented for the electro-
mechanical power-trains (EMPTs) by integrating several modeling techniques
including block diagram, multi-body system, bond graph, and finite element
analysis. In Section 3.1, an overall description of the modeling strategy is
provided, with details illustrated through case studies from Section 3.2 to 3.4. In
Section 3.2, a gearbox-based power-train model is built through co-simulation
of block diagram and multi-body system modeling approaches, which can be
used to explore the nonlinear dynamics in the power-trains. In Section 3.3, a
model of an electric machine connected to the load bank is demonstrated
through co-simulation of finite element analysis and block diagram approach,
where the built model can be used to explore the electro-mechanical
interactions. In Section 3.4 a faulty EMPT is modeled using the block diagram
approach, where the healthy components are directly chosen from the model
library. A faulty planetary gearbox is modeled using the basic blocks and the
gear meshing stiffness is estimated by finite element analysis.
3.1 Co-Simulation Strategy for Power-Trains
There are a few existing techniques to develop dynamic models for the EMPTs.
However, as discussed in Section 2.2, each method has its own advantages and
limitations. To achieve both a full modeling capacity and high efficiency for the
EMPTs, a systematic co-simulation strategy is proposed by effectively
integrating different modeling techniques as shown in Figure 3.1.

Chapter 3 Modeling of Electro-Mechanical Power-Trains
54
Figure 3.1 A co-simulation strategy for EMPTs
In the co-simulation strategy as in Figure 3.1, the block diagram (available in
MATLAB/ SIMULINK) is utilized as a model development platform which is
due to: (1) the basic mathematical blocks and the user-defined functions in
SIMULINK can be used to implement different control strategies and model the
unconventional machines such as a faulty component; and (2) it can provide a
few graphical user interfaces [68], which can integrate SIMULINK with several
other modeling techniques including bond graph (such as 20-SIM), multi-body
system (such as SIMPACK), and finite element analysis (such as ANSYS and
ANSOFT). Co-simulation between block diagram in SIMULINK and other
modeling tools enables people to incorporate detailed nonlinear dynamics into
the power-train models, where the nonlinearity is missing in SIMULINK.
Multi-body system (SIMPACK) provide basic lumped models for the
mechanical components such as gears, shafts, and bearings [69]. Compared to
block diagram (SIMULINK), the basic elements in SIMPACK can provide

Chapter 3 Modeling of Electro-Mechanical Power-Trains
55
more detailed dynamics. For example, the element incorporating the angle-
varying gear meshing stiffness and backlash can be found in SIMPACK.
With the finite element analysis specialized in electromagnetics (ANSOFT), the
finite element model of the electric machines can be easily built [70]. Compared
to the classical Park’s model built in SIMULINK, this finite element model can
provide more accurate information on the electro-mechanical interactions in the
EMPTs. Furthermore, it enables the users to model the complex power
electronics architectures in ANSOFT/SIMPLORER.
Bond graph (20-SIM) can represent the EMPT systems using physical modeling
concept. Co-simulation between SIMULINK and 20-SIM is able to model part
of the system using 20-SIM. For example, a dynamic model for the heating,
ventilation, and air-conditioning systems was built based on the co-simulation
[114], where the control strategy was implemented in SIMULINK and the
physical model in 20-SIM was translated into an S-Function of SIMULINK.
Finally, a few model parameters can be estimated based on general finite
element analysis (ANSYS). For example, the gear teeth meshing stiffness in the
gearbox was estimated using ANSYS [115].
3.2 Model 1: Co-Simulation of Multi-Body System and Block
Diagram
3.2.1 Multi-body system modeling approach
As a typical multi-body system simulation software, SIMPACK can be used for
dynamics analysis of mechanical or mechatronic systems [69]. It is used

Chapter 3 Modeling of Electro-Mechanical Power-Trains
56
primarily within automotive, engine, power transmission, railway, and wind
energy industrial sectors. It is operated via a graphical user interface, enabling
the users to generate and solve virtual 3D models in order to predict and
visualize the motion, coupling forces and stresses. The user inputs parameters
describing the system to be simulated, such as mass and inertias of each body,
and then the kinematic loops can be created by applying the pertinent joints,
constraints, and forces. SIMPACK also provides a force element library
containing specific force elements tailored for power-train simulation. Finally,
based on the model topology SIMPACK creates the motion equations internally
and allows the users to choose different options for the time integration.
3.2.2 A nonlinear model for a gearbox-based power-train
A typical nonlinear gearbox-based power-train is used as an example to
illustrate the co-simulation between SIMULINK and SIMPACK as shown in
Figure 3.2. The nonlinear dynamics inside the gearbox can be affected by
several important gear parameters, such as backlash, meshing stiffness,
damping, and geometry [12, 116]. All these mechanical parameters can be
easily setup in SIMPACK. The speed control strategy can be implemented
through the existing control toolbox in SIMULINK. Furthermore, the co-
simulation interface “SIMAT” can integrate SIMPACK and SIMULINK
together. SIMAT is designed to using the TCP/IP protocol to exchange the
results with a given time step between SIMPACK and SIMULINK, enabling to
run the simultaneous co-simulation model.

Chapter 3 Modeling of Electro-Mechanical Power-Trains
57
In Figure 3.2(a), a spur gearbox driven by pulsating torque is modeled by the
co-simulation between SIMULINK and SIMPACK. The pinion gear is
connected to a speed source through a flexible shaft, where the speed source can
be modeled in SIMULINK. And the applied load torque on the wheel gear
depends on its angular speed. The 3D visual spur gearbox model is shown in
Figure 3.2(b). In Figure 3.2(c), the 2D topology diagram of the model is shown
where the applied torque/force element and the gear interaction can be
observed. The elements from SIMPACK model library to model the system are
shown in Table 3.1. The Primitive “25: Gear Wheel” can be used to define the
gear geometry by setting up parameters such as module, pressure angle, helix
angle, backlash, flank width, addendum and dedendum coefficients, and the
modification factor. The Force Element “225: Gear Pair” can be used to model
the gear meshing stiffness as well as to detect the gear contact condition.
Table 3.1 SIMPACK library elements used to model components
Component SIMPACK element
Gears Primitive 25: Gear wheel
Gear meshing stiffness and damping Force element 225: Gear pair
Driving torque Force element 93: Force/Torque by u(t) Cmp
DOF constraint Joints
3.3 Model 2: Co-Simulation between Finite Element Method
and Block Diagram
3.3.1 Introduction of ANSOFT
ANSOFT consists of modules such as MAXWELL and SIMPLORER which
can be used to study the electromagnetics related problems [70]. In electric

Chapter 3 Modeling of Electro-Mechanical Power-Trains
58
Driv ing_Speed
Pinion_Speed
Driv ing_Torque
Shaft coupling
SIMAT 9.2/R2011b
(Co-Simulation Interface via IPC)
Sampling period: 0.001 [s]
Server remote: off
Server port: 20123
Auto start: off
Connected to SIMAPCK: no
$UI_Driving_Torque
$UI_Load_Torque
$Y_Pinion_Speed
$Y_Wheel_Speed
SIMPACK
Co-Simulation Interface
Wheel_SpeedLoad_Torque
Load
Driving_Speed
(a)
(b)
(c)
Figure 3.2 Model of a spur gearbox model (a) Co-simulation diagram in SIMULINK, (b) 3D
visual in SIMPACK, and (c) 2D topology diagram in SIMPACK

Chapter 3 Modeling of Electro-Mechanical Power-Trains
59
machines, the higher order harmonics can be excited in the stator current and
electromagnetic torque by factors such as slot effect, winding configuration and
magnetic saturation, [36-39]. These harmonics can excite significant amount of
vibration and noise in the power-trains. Furthermore, the harmonics in the stator
current can deteriorate the fault detection performance based on motor current
signature analysis. Compared to Park’s model which can only be used to
investigate the linear dynamics in the electric machines, MAXWELL together
with RMxprt (Rotational Machine Expert) is capable of building a nonlinear
dynamic model for the electric machine with finite element method.
SIMPLORER is an intuitive, multi-domain and multi-technology simulation
module which can be used to model the power electronic circuits with complex
architectures. Furthermore, co-simulation between SIMULINK and
SIMPLORER enables the detailed simulation of the electrical drive systems
comprised of electric machines, the power electronics, and the controller.
3.3.2 Modeling of electric machines connected to resistive load
The permanent magnet synchronous machines (PMSMs) have high energy
efficiency and can be found in lots of applications, such as hybrid electric
vehicles (HEVs), wind turbines and aircrafts [117, 118]. By inputting the design
parameters of the PMSM into RMxprt such as the geometry and materials, the
stator winding diagram and cross-section can be obtained as shown in Figure
3.3(a) and (b). With the provided geometry and material information, a 2D/ 3D

Chapter 3 Modeling of Electro-Mechanical Power-Trains
60
(a) (b)
(c)
PhaseA_in
PhaseB_in
PhaseC_in
MotionSetup1_in
PhaseA_out
PhaseB_out
PhaseC_out
MotionSetup1_out
R1
R2
R3
GND
MchRGndROT_V
ROT
ω+
V_ROT1
T
Torque_Meter
ROT_V
ROT
Torque
Ia
Ib
Ic
Speed
A
AM1
A
AM2
A
AM3
0
0
(d)
Figure 3.3 PMSM drives model (a) Stator winding diagram, (b) Cross section, (c) 2D
MAXWELL model, and (d) Model in SIMPLORER coupled with SIMULINK

Chapter 3 Modeling of Electro-Mechanical Power-Trains
61
finite element model can be further obtained using MAXWELL as shown in
Figure 3.3(c). The boundary conditions of the finite element model can be
automatically defined by MAXWELL, saving a lot of efforts. Then, this finite
element model can be coupled with the electrical circuits or power electronics
built in SIMPLORER. A co-simulation between SIMPLORER and SIMULINK
enables people to control the electrical drive system in SIMPLORER by the
controller designed in SIMULINK. A detailed nonlinear dynamic model for a
PMSM connected to the power load can be built as in Figure 3.3(d), where the
PMSM works as a generator with its running speed controlled by SIMULINK.
The driving torque applied on the PMSM and the stator current are measured in
SIMPLORER and then transmitted to SIMULINK.
3.4 Model 3: Model Development using Block Diagram
3.4.1 Existing blocks in SIMULINK
In SIMULINK, a few basic blocks are provided for the users to build their own
models [52] as shown in Figure 3.4, such as Sum block, Product block, Gain
block, Integrator block, Function block (to describe the mathematical function),
Signal Generator block (to generate the desired signal), Workspace block (to
output the simulation results to MATLAB workspace), and Subsystem block (to
represent the sub-models).

Chapter 3 Modeling of Electro-Mechanical Power-Trains
62
simout
To Workspace
Sum
In1 Out1
SubsystemSignal
Generator
Product
1
s
Integrator
1
Gain
f(u)
Fcn
Figure 3.4 Basic blocks in SIMULINK
3.4.2 Modeling of faulty planetary gearbox in SIMULINK
Planetary gearboxes are preferred in many power-trains applications, such as
wind turbines, maritime and automobiles. In a planetary gearbox, there is a sun
gear, an annulus gear, and a carrier with several planet gears mounted as shown
in Figure 3.5. In the shown configuration, the annulus gear is fixed and there are
four planets. The gear tooth fault frequently occurs due to factors such as heavy
load duty and bad lubricant conditions [87-89, 92]. If the tooth fault occurs,
whenever other gears pass through the faulty location, a local reduction in the
gear meshing stiffness will happen corresponds to the missing materials as
illustrated later in Figure 3.11 (in Section 3.4.2.3). Since the meshing stiffness
of the faulty tooth cannot be modeled in SIMPACK, the basic blocks in
SIMULINK are utilized to model the faulty planetary gearbox.

Chapter 3 Modeling of Electro-Mechanical Power-Trains
63
Planet 1
Planet 2
Planet 3
Planet 4
Sun gear Annulus gear
(Fixed)
ωp
ωs
ωc
Figure 3.5 A planetary gear set with four planets and fixed annulus gear
3.4.2.1 Motion equations of planetary gearbox
A lumped model can be built for the planetary gearbox shown in Figure 3.5, and
further represented as a matrix form (Eqn. 3.1 [57, 66])
TKQQCQM =++ ɺɺɺ
(3.1)
As the rotational DOFs have significant effect on the torsional dynamics of the
gearbox coupled with an electric machine, the vector Q only contains all the
rotational DOFs as
[ ]Tcpppps θθθθθθ 4321=Q
(3.2)
M is the mass matrix, C is the damping matrix, K is the stiffness matrix, the
subscript pi represents the planet where i=1 to 4, the subscripts s and c represent
the sun gear and carrier, and T is the external applied torque vector as

Chapter 3 Modeling of Electro-Mechanical Power-Trains
64
+
=
24 bcpc
p
p
p
p
s
rMJ
J
J
J
J
J
M
(3.3a)
( ) ( )( ) ( )
( ) ( )( ) ( )
( ) ( ) ( ) ( ) ( )
+−−−−−
−+
−+
−+
−+
−
=
∑∑
∑∑
==
==
4
1
244332211
4
1
44442
4
33332
3
22222
2
11112
1
4
14321
4
1
2
000
000
000
000
i
apispibcspapbcbpspapbcbpspapbcbpspapbcbp
i
spibcbs
spapbpbcspapbpspbpbs
spapbpbcspapbpspbpbs
spapbpbcspapbpspbpbs
spapbpbcspapbpspbpbs
i
spibsbcspbsbpspbsbpspbsbpspbsbp
i
spibs
ccrccrrccrrccrrccrrcrr
ccrrccrcrr
ccrrccrcrr
ccrrccrcrr
ccrrccrcrr
crrcrrcrrcrrcrrcr
C
(3.3b)
( ) ( )( ) ( )
( ) ( )( ) ( )
( ) ( ) ( ) ( ) ( )
+−−−−−
−+
−+
−+
−+
−
=
∑∑
∑∑
==
==
4
1
244332211
4
1
44442
4
33332
3
22222
2
11112
1
4
14321
4
1
2
000
000
000
000
i
apispibcspapbcbpspapbcbpspapbcbpspapbcbp
i
spibcbs
spapbpbcspapbpspbpbs
spapbpbcspapbpspbpbs
spapbpbcspapbpspbpbs
spapbpbcspapbpspbpbs
i
spibsbcspbsbpspbsbpspbsbpspbsbp
i
spibs
kkrkkrrkkrrkkrrkkrrkrr
kkrrkkrkrr
kkrrkkrkrr
kkrrkkrkrr
kkrrkkrkrr
krrkrrkrrkrrkrrkr
K
(3.3c)
[ ]T
cs TT 0000=T
(3.4)
where J is the inertia of the gear/carrier, θ is the angular displacement of the
gear/carrier, T is the applied torque, and rb is the base radius of the gear. c is the
gear damping coefficient, and k is the gear meshing stiffness. The subscript a,
represents the sun gear. For example, the stiffness between the annulus gear and
the planet 1 is
( ) ( )[ ] ( )1c1cminmaxmin1 squaresquare apapaap kNkkkk φθφθ +⋅∆−+⋅−+= (3.5)
where kmin is the low stiffness when less teeth pair are engaged, kmax is the high
stiffness with more teeth pair are engaged, Na is the number of teeth on the

Chapter 3 Modeling of Electro-Mechanical Power-Trains
65
annulus gear, ϕap1 is the relative phase for the gear pair comprised of the
annulus gear and planet 1, ∆k is the stiffness reduction due to the annulus gear
tooth fault, and the function “square” represents the square function with a
period 2π and amplitude 1.
3.4.2.2 Block diagram of planetary gearbox
In SIMULINK, the integration operator can provide better numerical
convergence performance in solving the differential equations than the
differential operator in the presence of the numerical error. To numerically
solve Eqn. 3.1 in SIMULINK, it can be rewritten as
( )[ ]dtdt∫ ∫ −−= − CQKQTMQ 1
(3.6)
Eqn. 3.6 is implemented in SIMULINK as in illustrated Figure 3.6 to 3.8. The
overall block diagram is shown in Figure 3.6(a), where the torque vector T is
represented by a subsystem block as in Figure 3.6(b). The stiffness matrix K
and the damping matrix C share similar forms as in Eqn. 3.3, therefore only K
is presented. According to Eqn. 3.5, if a gear tooth fault occurs, the
corresponding gear meshing stiffness will be composed of two parts: (1) the one
for a healthy gearbox, and (2) the stiffness reduction due to the gear tooth fault.
For example, kap1 between the annulus gear and planet 1 is shown in Figure
3.6(c). Furthermore, the gear meshing stiffness functions between the annulus
gear and all the planets are shown as in Figure 3.7 (a). According to Eqn. 3.3(c),
the stiffness matrix K can be obtained as in Figure 3.7(b), where k1 to k6
represent each row vector of K. The first row vector k1 is shown as an example
in Figure 3.7(c). The multiplication of K and Q is decomposed into the

Chapter 3 Modeling of Electro-Mechanical Power-Trains
66
multiplication of each row vector (k1 to k6) with Q as in Figure 3.8(a) with the
expression k1*Q shown in Figure 3.8(b). Then, the integration operation is
shown in Figure 3.8(c). Finally, the multiplication with inversed mass matrix is
shown in Figure 3.8(d). The built model for the faulty planetary gearbox can be
included in an overall model just like other general blocks in SIMULINK. With
this approach, the gearboxes with different types of fault can be developed. By
incorporating these gearbox models one by one into an overall power-train
model, all the concerned faulty cases can be studied with easy effort. Therefore,
this approach brings with a high efficiency.
3.4.2.3 Gear meshing stiffness estimation
The gear meshing stiffness are determined by the bending and fillet-foundation
stiffness of each meshing tooth, and Hertzian contact stiffness between the
meshing teeth as in [119]. The irregular shape of the faulty gear tooth makes the
estimation of stiffness become even more complicated, so ANSYS is used to
estimate this value. The meshing pair between the annulus gear and the planet in
a planetary gearbox (with parameters in Table 3.2) are used as an example to
show the influence of the missing material on the meshing stiffness, where one
tooth on the annulus gear loses 1/3rd tooth width and the annulus gear is fixed
on the housing as in Figure 3.9(a). In the simulation, a driving torque 110.4N.m
is applied on the planet through the nodes on its inner race, where the
coordinate system of these nodes needs to be rotated onto the cylindrical
coordinate before applying the torque. The gear tooth contact is setup through
contact elements 170 and 174.

Chapter 3 Modeling of Electro-Mechanical Power-Trains
67
1
Speed
Ts
Tc
T
T
In Q
M-1
Q KQ
K
In Out
Integrator2
T-KQ Out
Integrator1
du/dt
Q CQ
C
2
Tc
1
Ts
(a)
1
T
0
2
Tc
1
Ts
(b)
1
Kap1
t
Pulse Generator 2
t
Pulse Generator 1
u(6)+phiap1
Phase2
(u(6)+phiap1)*Na
Phase1
Kmin
Minimum sti ffness
1
Q
(c)
Figure 3.6 Block diagram of planetary gearbox in SIMULINK-Section 1 (a) overall picture, (b)
torque vector T, (c) stiffness kap1 between the annulus and planet 1

Chapter 3 Modeling of Electro-Mechanical Power-Trains
68
1
Kap
Q Kap4
Kap4
Q Kap3
Kap3
Q Kap2
Kap2
Q Kap1
Kap1
1
Q
(a)
6
k6
5
k5
4
k4
3
k3
2
k2
1
k1
Ksp
Kapk2
Ksp
Kapk5
Ksp
Kapk4
Ksp
Kapk3
Ksp
Kapk2
Ksp k1
2
Kap
1
Ksp
(b)
1
k1
-rbc*rbs*(u(1)+u(2)+u(3)+u(4))
6
rbp*rbs*u(4)
5
rbp*rbs*u(3)
4
rbp*rbs*u(2)
3
rbp*rbs*u(1)
2
rbs*rbs*(u(1)+u(2)+u(3)+u(4))
1
1
Ksp
(c)
Figure 3.7 Block diagram of planetary gearbox in SIMULINK – Section 2 (a) stiffness vector
between the annulus and planets Kap, (b) stiffness matrix K, (c) row vector k1

Chapter 3 Modeling of Electro-Mechanical Power-Trains
69
1
KQ
f(u)
k6*Q
f(u)
k5*Q
f(u)
k4*Q
f(u)
k3*Q
f(u)
k2*Q
f(u)
k1*Q
Ksp
Kap
k1
k2
k3
k4
k5
k6
Subsystem
Q Ksp
Ksp
Q Kap
Kap
1
Q
(a)
(b)
1
Out
1
s
1
s
1
s
1
s
1
s
1
s
1
T-KQ
(c)
1
Q
u/M(6,6)
x6
u/M(5,5)
x5
u/M(4,4)
x4
u/M(3,3)
x3
u/M(2,2)
x2
u/M(1,1)
x1
1
In
(d)
Figure 3.8 Block diagram of planetary gearbox in SIMULINK – Section 3 (a) multiplication of
K and Q, (b) multiplication between k1*Q, (c) integrator operation, and (d) multiplication with
M-1

Chapter 3 Modeling of Electro-Mechanical Power-Trains
70
Table 3.2 Parameters of the annulus and planet gear
Parameter Annulus Planet
Material/Density ρ (Kg/m3) Steel / 7.87×10³
Young modulus E (Pa) 190×109
Poisson coefficient vpc 0.27
Number of tooth Na, Np 84 28
Module m(mm) 2
Pressure angle α(°) 20
Tooth face width L (mm) 30
With the applied torque, the Von Mises stress obtained in ANSYS is shown in
Figure 3.9, where Figure 3.9(a) shows the fault tooth location while Figure
3.9(b) shows the healthy tooth location. The corresponding displacement
contour of the gear pair is shown in Figure 3.10. With the applied torque and the
obtained displacement, the corresponding gear tooth meshing stiffness can be
calculated easily. By rotating the gear pair with a small fractional angle each
time, the gear meshing stiffness for an overall meshing period can be achieved
as shown in Figure 3.11. Looking at the faulty location, when one teeth pair are
engaged, the local stiffness loss is 0.3×10⁸ N/(m.rad). When two teeth pairs are
engaged, the local stiffness loss is only 0.2×10⁸ N/(m.rad) as the load is
distributed on two teeth pairs. Furthermore, from the Von Mises stress contours
obtained under both the faulty and healthy conditions in Figure 3.9, it can be
found that the faulty tooth introduce a higher contact stress due to the missing
material. Therefore, the breaking process could be accelerated by the unevenly
distributed stress along the axial direction.

Chapter 3 Modeling of Electro-Mechanical Power-Trains
71
(a)
(b)
Figure 3.9 Von Mises stress of the gear pair (a) faulty location, and (b) healthy location
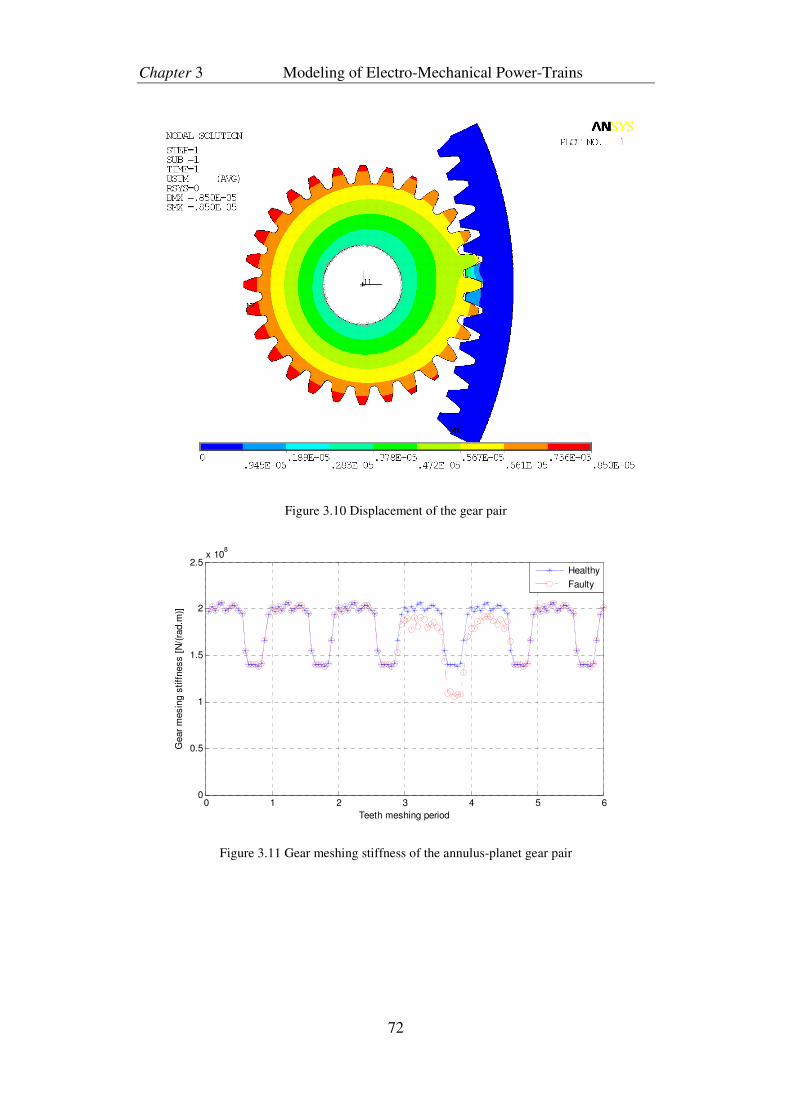
Chapter 3 Modeling of Electro-Mechanical Power-Trains
72
Figure 3.10 Displacement of the gear pair
0 1 2 3 4 5 60
0.5
1
1.5
2
2.5x 10
8
Teeth meshing period
Gear
mesin
g s
tiff
ness [
N/(
rad.m
)]
Healthy
Faulty
Figure 3.11 Gear meshing stiffness of the annulus-planet gear pair

Chapter 4 An Analytical Method to Evaluate Gear Parameters Effect
73
Chapter 4 An Analytical Method to Evaluate Gear
Parameters Effect on Rattling Noise
4.1 Introduction
Gear rattle is a common occurrence in transmission systems, such as those in
vehicles and marine vessels, under lightly loaded conditions [23, 24, 120].
When gear rattle occurs, the gear teeth oscillate within the backlash while
undergoing several consecutive tooth impacts that produce a high level of
vibration and noise. This noise resulting from gear rattle is an important source
of passenger discomfort in automotive applications [61, 62, 121, 122]. The
occurrence and severity of gear rattle induced impacts and emitted noise is
influenced by different components of power-trains such as the diesel engine,
the flywheel, the clutch, and the gearbox. Recent technological improvements
have significantly reduced the size of engines and flywheel, as well as mitigated
the frictional torques through improvements in bearings and lubricants
technology, which can increase the occurrence of gear rattle thus bringing it in
focus [120, 123, 124]. Therefore, to avoid expensive modifications later, it is
crucial to consider the gear rattle during the design stage of the gearbox itself.
Previous research has investigated the influence of the various transmission
components on the gear rattle. The effect of the inertia of the flywheel, as well
as the stiffness and hysteresis of the clutch on the gear impact has been
investigated through stiffness varying multi-DOF lumped parameter models of
the transmission [61, 62, 125]. It was shown that by increasing the flywheel
inertia, reducing the clutch rigidity and selecting adequate clutch hysteresis

Chapter 4 An Analytical Method to Evaluate Gear Parameters Effect
74
torque, the speed fluctuation transmitted from the diesel engine to the gearbox
can be reduced, thereby reducing gear rattle severity. Gearbox parameters can
also affect the rattle noise level [12, 116], e.g., an increase of backlash and gear
meshing stiffness can produce more rattling noise, while an increase of damping
factor and the wheel gear inertia can reduce the noise level. To quantify the
effect of different gear parameters on the rattling noise level, both numerical
modeling and experimental based approaches have been developed. For
example, a two-DOF lumped parameter model was developed for a spur gear
pair to explore the effect of gear backlash and inertia in [116, 126]. However, it
is time-consuming to assess gear parameters’ effect on the rattle noise by
individual numerical simulation that evaluates each parameter one by one.
Furthermore, investigations on power-trains with various configurations and
parameters do not provide an insight regarding the final expected rattle noise as
a combination of all these input variables. Experiment based approaches have
been carried out to investigate the effect of the variation of gear parameters on
rattle noise as well [12, 116]. However, an experimental investigation of gear
parameters on rattle noise requires manufacturing, installation and
commissioning of gears with different dimensions, which is both time-
consuming and expensive. Further, the experimental results are influenced by
errors in manufacturing and installation, such as gear profile error, shaft
misalignment and eccentricity [124, 127]. Therefore, an analytical approach to
evaluate the importance of gear parameters’ effect on the gear rattle noise is
required. According to [116, 128, 129], the root mean square (RMS) value of
the wheel gear acceleration is proportional to the noise level during the gear

Chapter 4 An Analytical Method to Evaluate Gear Parameters Effect
75
rattle and has been used as an indicator of the sound perception. Since the pure
rotational motion of the gear bodies produce negligible noise, the rattle noise
can be attributed to the period when gear impact occurs. Furthermore, even
though several consecutive impacts can occur gear teeth face at one side before
the gear teeth mesh together again, the first impact has the most dominant
energy as the subsequent impacts can get dampened quickly [130, 131]. It can
be deduced that the rattling noise level is mainly determined by the RMS value
of the wheel gear acceleration during the first impact period, which is used in
this work to estimate its value analytically.
Therefore, in this chapter the acceleration magnitude due to gear rattle is
analytically evaluated to investigate the contribution of different gear
parameters on the gear rattle. A two-DOF model developed for a typical power-
train configuration is simplified to a single-DOF equation of motion to describe
the teeth impact. This simplified model sufficiently describes the wheel gear
vibration within the backlash. The analytical solution obtained from this model
is used to evaluate the RMS value of the acceleration of the wheel gear due to
teeth impacts during gear rattle. This proposed formulation to access the gear
rattle noise is verified using a dynamic model of a typical transmission system
built in SIMPACK software environment. Previously reported experimental
results in [12, 116] are also shown to agree with the proposed method. Thus, the
proposed evaluation method for estimating the acceleration RMS value during
gear impacts can quantify the influence of gear parameters on the rattle noise,
and can thus provide an easy design guideline to determine the expected
severity of gear rattle at the gearbox design stage.

Chapter 4 An Analytical Method to Evaluate Gear Parameters Effect
76
4.2 Modeling of a Simplified Transmission
4.2.1 Gearbox parameters
Gear meshing stiffness and backlash
During operation, the gear teeth can bend along the line of action that is due to
material elasticity. The gear teeth meshing stiffness kg can be determined by
using the standards mentioned in [132, 133]. The backlash 2bls is the amount of
clearance between two mating pair of gear teeth that is usually kept for allowing
an unobstructed operation, as shown in Figure 4.1. However, torque and speed
fluctuations from a prime-mover can result in the teeth to vibrate within the
backlash, which results in the rattling noise.
Figure 4.1 Gear teeth meshing for a gear pair

Chapter 4 An Analytical Method to Evaluate Gear Parameters Effect
77
Bearing frictional torque
Palmgren model was developed based on a laboratory testing of different types
and sizes of bearings to describe the bearing frictional torque with respect to
rolling, sliding and lubricant loss effects as [134]
10 TTTbf +=
(4.1)
where, T0 is a load independent component determined by the lubricant
properties and a function of angular velocity, while T1 is a load dependent
component determined by the radial and axial load which can be assumed to be
a constant for a given load. The dependence of these frictional components on
bearing type, dimensions, load, rotational speed, and lubricant properties is
described in [134-136].
Lubricant churning losses
Grease lubrication is commonly used in medium-sized gearboxes, wherein all
the gears are either partially or completely submerged in the lubricant. This
results in a power loss component due to lubricant churning. The churning loss
is a complex process for which a dynamic model was developed in [137, 138],
where the churning torque can be expressed as a function of the grease viscosity
and immersion of the gears in the lubricant, which is dependent on dimensions
of gears and the gearbox housing. The churning torque function is given as
mmcch TSrT32
lub5.0 ωρ=
(4.2)

Chapter 4 An Analytical Method to Evaluate Gear Parameters Effect
78
where ρlub is the density of the lubricant oil, Sm is the immersion area of the gear
in the lubricant, and Tm is the dimensionless drag torque. At low speeds, Tm can
be obtained as
( ) ( ) 6.021.01.03
0
45.0 FrRe36.1 −−= ccm dVdhT
(4.3)
where h is the immersed depth of the gear in the lubricant, dc is the pitch
diameter, V0 is the volume of the lubricant oil, the Reynolds number
lub
2Re vrpω= , Froude number lub2Fr vrpω= and vlub is the dynamic
viscosity of the lubricant oil.
4.2.2 Transmission model under idling conditions
A typical five-speed manual transmission [139] is shown in Figure 4.2. In this
configuration, the output gears are usually rotating freely. To obtain a given
gear shift configuration which corresponds to a given speed ratio, one of the
three synchronizers (shown in blue color) is used to lock different gears with the
output shaft. However, the 4th gear speed is obtained by directly coupling the
input shaft with the output shaft using the first synchronizer from the left. Under
idling condition, all gears on the output shaft are in a free flight condition
wherein the only resistance to their motion is provided by a low drag torque that
is due to the bearing friction and lubricant churning.

Chapter 4 An Analytical Method to Evaluate Gear Parameters Effect
79
1st
2nd
3rdRev
5th
Output
Shaft
Counter
Shaft
Clutch
Hub Input
Gear
Idler
ABC
D
E
Input
Shaft
Counter
Gear
Figure 4.2 A typical five-speed manual transmission
To set up the dynamic model of the meshing gears, a two-DOF model
consisting of the equivalent pinion gear and the corresponding wheel gear as
shown in Figure 4.3 is formulated. Taking the example of the 3rd gear pair, the
inertias on the input and counter shafts, including gears A, B, D, E, counter gear,
input gears and clutch hub, are reflected onto the pinion gear C to obtain the
equivalent pinion gear inertia Ip. The governing equations of the two-DOF
model are obtained and can be written as
chpbfpgbpNbpppp TTcrfrTI −−−−= ξθ ɺɺɺ
(4.4a)
chwbfwgbwNbwww TTcrfrI −−+= ξθ ɺɺɺ
(4.4b)
where Tp is the driving torque applied on pinion gear, Iw is the wheel gear
inertia, rbp and rbw are the base radii of pinion and wheel gears, Tbfp and Tbfw are

Chapter 4 An Analytical Method to Evaluate Gear Parameters Effect
80
the bearing frictional torque of pinion and wheel gears, Tchp and Tchw are the
churning torque of pinion and wheel gears, θp and θw are the angular
displacement of the pinion and wheel gears, kg is the gear meshing stiffness, cg
is the damping coefficient of the gear pair, and fN is the contact force acting on
the gear teeth surface. fN can be expressed as
−<+
≤
>−
=
lsls
ls
lsls
gN
bb
b
bb
kf
ξξ
ξ
ξξ
0
(4.5)
where ξ = rbpθp - rbwθw is the dynamic transmission error.
Figure 4.3 A two-DOF model for the transmission
4.3 Analytical Evaluation of the Gear Tooth Impact
4.3.1 Modeling of the gear tooth impact
The unique working principle in an internal combustion engine (ICE) and the
unbalance from the internal rotational component can excite speed fluctuations
in a transmission system. For example, in a four stroke ICE, each cylinder needs
to rotate two revolutions to finish one stroke. And the frequency of speed

Chapter 4 An Analytical Method to Evaluate Gear Parameters Effect
81
fluctuations is proportional to the number of the cylinder. Therefore, in a N-
cylinder four-stroke ICE, the input angular speed at the pinion gear as applied
by the ICE can be described as [12]
cos2m m
Ntω ω ω ω
= + ∆
(4.6)
where the pinion gear speed ω fluctuates at N/2 times of the input rotational
frequency ωm. As the gear impact is determined only by the speed fluctuation
component, the mean gear speed can be ignored in the subsequent analysis and
thus the input velocity at pinion gear is taken as:
cos2 m
Ntω ω ω
= ∆
(4.7)
This speed fluctuation can result in alternating teeth separation and impacts
within the gearbox under idling conditions, as illustrated through the speed
profiles of the pinion and wheel gears in Figure 4.4. The loss of gear contact
occurs from point B to C and then from point E to F in Figure 4.4, during which
the pinion gear’s speed profile follows the solid line, while the wheel gear
follows the dashed line. In other regions, the gears remain in contact. The area
between the speed profiles of the two gears from point B to C or from point E to
F is the distance travelled by gear teeth between the impacts and equals the
backlash 2bls.

Chapter 4 An Analytical Method to Evaluate Gear Parameters Effect
82
(a)
(b)
Figure 4.4 Gears crossing across backlash (a) gears’ speed profiles, and (b) key configurations
[116]
Gear rattle occurs if the tangential deceleration at the contact point for the
pinion gear is greater than that for the wheel gear. Under idling condition, only

Chapter 4 An Analytical Method to Evaluate Gear Parameters Effect
83
the drag torque due to bearing and lubricant acts on the wheel gear. Therefore,
the deceleration threshold for the pinion above which gear rattle occurs is
( )wbpdragbwcritical IrTr=θɺɺ
(4.8)
where the drag torque Tdrag = Tchw + Tbfw consists of the bearing friction and the
lubricant churning components. Thus, a decrease of the drag torque or an
increase of the wheel gear inertia decreases the deceleration threshold limit,
thereby increasing the likelihood of gear rattle.
Gear rattle noise, which is directly perceived by the end user, is correlated to the
acceleration of the gear teeth. According to [116, 128, 129], the RMS value of
the wheel gear acceleration is linearly correlated with the noise level when the
gear rattle occurs. And this RMS value has been used to indicate the sound
perception. The noise produced by the pure rotation of the gear bodies is
negligible. Therefore, the rattle noise level is mainly determined by the period
when gear impact occurs. Furthermore, although several consecutive impacts
might occur before the gear teeth mesh together again, the first impact has the
dominant energy as the rest ones can be dampened quickly [130, 131]. As a
result, the rattling noise level is mainly determined by the RMS value of the
wheel gear acceleration during the first impact period. This reasonable
simplification enables the RMS value to be estimated analytically. Therefore,
the influence of gearbox parameters’ such as the meshing stiffness, damping
factor, gear inertia and backlash, on the rattling noise level can be accessed by
evaluating their effect on the RMS value of the wheel gear acceleration through
investigation of the dynamic model of gearbox presented in Eqn. 4.4. Taking

Chapter 4 An Analytical Method to Evaluate Gear Parameters Effect
84
example of a typical transmission presented in [139], the ratio of equivalent
inertia of the pinion gear with respect to the largest gear on the output shaft is
greater than six. Therefore, the output gear has little effect on the dynamic
response of input shaft. Furthermore, the wheel gear dynamics under idling
conditions can be represented by a single DOF model (similar to Ref. [12]) as
shown in Figure 4.5, where the wheel gear can be modeled as a rigid body
vibrating along the tangential direction insides the backlash. The boundary
conditions for the motion equation for the wheel teeth vibration are time-
varying due to the speed fluctuations from input at the pinion gear. Compared
with the 2-DOF model, the motion equation of the 1-DOF model can be solved
easily by analytical approach.
Figure 4.5 Single-DOF model for the gear impact
Considering with a six-cylinder four stroke ICE an impact on the front flank
side of the teeth, the equation of motion for the wheel gear from the time instant
at start of collision t0 till the time instant for separation t1 can be obtained by
substituting Eqns. 4.5 and 4.7 into the Eqn. 4.4b as

Chapter 4 An Analytical Method to Evaluate Gear Parameters Effect
85
( ) trrk
trrcbrkrTxrkxrcxI m
m
bwbpg
mbwbpglsbwgbwdragbwgbwgw ωω
ωωω 3sin
33cos
22222 ∆
+∆++−=++ ɺɺɺ (4.9)
where x = rbwθw is the tangential displacement of the wheel gear. The initial
conditions at t = t0-, when the gear pair are about to collide on the front flank
(side x1 in Figure 4.5) are
( ) ( )00 3sin3
tr
btx m
m
bw
lsw ωω
ω∆+−=−
(4.10a)
( ) ( )000 3cos tvtx mw ωω∆==−ɺ
(4.10b)
where v0 is the initial tangential speed of the pinion gear.
4.3.2 Analytical solution
In this section, the motion equation of the wheel gear is simplified and
analytically solved. For a typical gear pair, the ratio kg/cg is greater than 1×10⁴
while the idling speed of a medium sized engine ωm is less than 200 rad/s.
Compared to the third term on the right side of Eqn. 4.9, the second term has
much lower amplitude and therefore can be neglected. Furthermore, the drag
torque Tdrag induced acceleration component is much lower than the tooth
impact force induced acceleration during the impact period and can also be
neglected. Therefore,
trrk
brkxrkxrcxI m
m
bwbpg
lsbwgbwgbwgw ωω
ω3sin
3
2
222∆
+−≈++ ɺɺɺ
(4.11)
The solution of Eqn. 4.11 can be expressed as a sum of three terms
21 pph xxxx ++=
(4.12)
where xh is the homogeneous solution, xp1 is the particular solution
corresponding to the constant term lsbwg brk 2− , and xp2 is the particular solution

Chapter 4 An Analytical Method to Evaluate Gear Parameters Effect
86
corresponding to the sinusoidal term trrk
m
m
bwbpgω
ω
ω3sin
3
2 ∆. These three solutions
can be individually found as
( )tBtAex dd
t
hn ωωζω sincos 11 += −
(4.13a)
lsbwp brx −=1 (4.13b)
( ) ( )t
rcIrk
rkrx m
mbwgmwbwg
bwg
m
bp
p ωωωω
ω3sin
493 22222
2
2
+−⋅
∆=
(4.13c)
where the natural frequency w
bwg
nI
rk2
=ω , the damped natural frequency
nd ωζω 21−= , and damping factor wg
bwg
Ik
rc
2=ζ . For a typical gear pair,
mn ωω 3>> and gmg ck ω4>> . Therefore, Eqn. 4.13c can be rewritten as
( )tr
x m
m
bp
p ωω
ω3sin
32
∆≈
(4.14)
Using the initial condition shown in Eqn. 4.10, the coefficients A1 and B1 in xh
can be evaluated as
001
sin t
d
ddbw netvr
Aζω
ω
ω−=
(4.15a)
001
cos t
d
ddbw netvr
Bζω
ω
ω=
(4.15b)
where ( )00 3cos trvv mbpd ωω∆−= is the tangential speed difference between the
gears at time t = t0- when the impact is about to occur. Thus, tangential
displacement of the wheel gear (Eqn. 4.12) can be evaluated as
( ) ( )( )t
rbr
ttrvex m
m
bp
lsbw
d
dbwdttn ωω
ω
ω
ωζω 3sin3
sin 00∆
+−−
= −−
(4.16)

Chapter 4 An Analytical Method to Evaluate Gear Parameters Effect
87
The wheel gear tangential acceleration can be obtained by twice differentiating
the Eqn. 4.16 with respect to time
( )( ) ( ) ( )[ ]00
2 cos2sin210
ttttrIkvI
ex ddbwwgd
w
ttn
−+−−⋅≈−−
ωζωζζω
ɺɺ
(4.17)
It can be observed that the acceleration xɺɺ of gear teeth excited due to their
impacts is determined mainly by the homogeneous solution. The particular
solution xp1 is constant, and it disappears in Eqn. 4.17 during differentiation.
Also, 2pxɺɺ is much lower than the homogeneous solution hxɺɺ . However, it must
be noted that the pinion speed fluctuation ∆ω also affects the homogenous
component of wheel gear acceleration. A larger ∆ω produce a higher speed
difference vd, which will increase the RMS value of acceleration as given by
Eqn. 4.17. As is shown in previous literatures [116, 129], the rattling noise level
is linearly correlated with the RMS value of the impact-induced wheel gear
acceleration. Further, the first impact is the most dominant among the
consecutive impacts that may occur on a gear tooth face. Taking the duration of
the gear tooth first impact to be half of the damped oscillation period for the
gear teeth dtt ωπ=− 01 , the RMS value can be obtained as
( ) ∫−=
1
0
2
01
1RMS
t
tdtx
ttx ɺɺɺɺ
(4.18)
( ) ( )42
414
1ζ
ζπ
πζ
+−
≈−
w
bwg
dI
rekv
Furthermore, the shaded region in Figure 4.4(a) between the wheel gear speed
profile and the pinion gear speed profile can be treated as a triangle whose area
equals to the backlash amount 2bls. Therefore, the speed difference vd and

Chapter 4 An Analytical Method to Evaluate Gear Parameters Effect
88
backlash 2bls can be related as lsdd bkv 2≈ where kd is a constant coefficient
for a given speed fluctuation amplitude. Thus,
( )( ) ( ) ls
w
bwg
d bI
rekkx
4
2
414
12RMS ζ
ζπ
πζ
+−
=−
ɺɺ (4.19)
Based on Eqn. 4.19, it can be seen that RMS( xɺɺ ) increases if the meshing
stiffness kg or the backlash 2bls increases. However, it will decrease if the inertia
of the wheel gear Iw increases. If the damping factor ζ increases, the damping
related term ( )( ) ζζπζ 411 42 +− −e decreases in the typical range of damping
factor [140], 0.01 ≤ ζ ≤ 0.10, which results in a decrease of RMS( xɺɺ ) value.
4.4 Results and Discussion
The gear rattle occurring in a typical transmission is investigated in this section
through a transmission models as shown in Figure 4.6. A flywheel is connected
to the pinion gear through a clutch. The pinion gear meshes with the wheel gear
as a meshing pair. The equivalent inertia of the pinion gear is much larger than
that of the wheel gear because the equivalent pinion gear inertia should
considers the gears and rotor inertias at the input side as well as the counter
shafts’ inertia. In this study, this equivalent inertia is set to be six times of the
wheel gear, which is typical in automobile transmission design [61, 62, 139].
The corresponding model parameters are given in Table 4.1. The frictional
characteristics associated with lubricant churning are evaluated assuming that
3/10th of the gears are immersed in the lubricant (70°C).

Chapter 4 An Analytical Method to Evaluate Gear Parameters Effect
89
Table 4.1 Parameters of the transmission
Parameters Value
Number of teeth (pinion/wheel gears) 25/25
Module m (mm) 4
Pressure angle α (°) 20
Equivalent inertia of the pinion gear Ip (kg.m2) 7.0×10⁻³
Inertia of the wheel gear Iw (kg.m2) 1.16×10⁻³
Gear meshing stiffness kg (N/(m.rad)) 2.4×10⁸
Damping factor ζ of gear meshing 0.06
Half of backlash bls (µm) 50
Inertia of flywheel (kg.m2) 3×10⁻²
Stiffness of clutch (N.m/rad) 1×10⁻³
4.4.1 Modeling in SIMPACK
A typical transmission is modeled in SIMPACK (shown in Figure 4.6) where a
spur gear pair is connected to a large inertia to simulate the flywheel through an
equivalent torsional spring-damper system to simulate the clutch. The elements
from SIMPACK library used to model the system are shown in Table 4.2.
Table 4.2 Model components represented in SIMPACK
Component SIMPACK element
Gears Primitive 25: Gear wheel
Flywheel Primitive 2: Cylinder
Driving speed of the flywheel Joint: Single axis 40 u(t)
Gear meshing stiffness and damping Force element 225: Gear pair
Stiffness and damping of clutch Force element 52: Cardan joint

Chapter 4 An Analytical Method to Evaluate Gear Parameters Effect
90
Figure 4.6 Dynamic model of the transmission
4.4.2 Result analysis
If the gear rattle occurs, it can manifest itself as either a single-sided or double-
sided impact, which depends on the magnitude of the pinion gear deceleration.
With the model described in Section 4.4.1, letting ωm=83.78 rad/s (800RPM)
and ∆ω = 12.57 rad/s (120RPM) the double-sided impact occurs (as seen in the
dynamic transmission error fluctuations shown in Figure 4.7) which is a typical
gear rattle phenomenon [12]. Therefore, this case is analyzed to investigate the
gear parameters effect on the rattle impact. From Figure 4.8(a), it can be seen
that the bearing frictional torque and the lubricant churning torque components
are comparable under idling conditions. Both of them have a low value and
have similar contributions in determining the threshold of the rattle occurrence.
The tooth impacts periodically excite impulse like peaks in the gear teeth
contact force profile (Figure 4.8(b)), which is the root cause of the rattling noise.

Chapter 4 An Analytical Method to Evaluate Gear Parameters Effect
91
0 0.01 0.02 0.03 0.04 0.05-60
-40
-20
0
20
40
60
Time [s]
DT
E [
µm
]
Figure 4.7 Dynamic transmission error under rattle
The gear rattle noise level indicator presented in Eqn. 4.19 is verified by
varying the model parameters: wheel gear inertia, meshing stiffness, backlash,
and meshing damping factor in SIMPACK simulations, one at a time. The
wheel gear inertia, meshing stiffness and backlash are varied to 1/3, 2/3, 1, 4/3,
and 5/3 times their reference value presented in Table 4.1. The damping factor
is varied from 0.02 to 0.10 using a step size of 0.02. The obtained RMS
acceleration of the wheel gear is then normalized with respect to the RMS value
obtained using the reference values given in Table 4.1. The result from the
analytical expression and the SIMPACK dynamic model are compared in
Figure 4.9. It is seen that the proposed analytical expression predicts the
increase of the backlash amount and the gear meshing stiffness increases the
RMS acceleration of wheel, which matches closely with the results from
SIMPACK simulation (Figure 4.9(a) and (b)). A larger backlash will result in a

Chapter 4 An Analytical Method to Evaluate Gear Parameters Effect
92
larger gear speed difference at the time of impact, while a stiffer gear tooth will
also increase the contact force magnitude at the impact. Therefore, both these
factors increase the RMS acceleration as observed in the figure. A larger RMS
acceleration in turn implies that the noise due to gear rattle will be higher. The
backlash effect was verified in [12] through experiment, where the rattle noise
level was measured for an idler gear first as shown in Figure 4.10. Then an
elastic thrust collar was fitted onto the same idler gear surface to reduce the
backlash. The measurement showed that the rattling noise level can be reduced
with the reduced backlash. The analytical method also predicts that an increase
in inertia of the wheel gear or the damping factor reduces the RMS acceleration
of the wheel gear, which matches closely with the results obtained from the
SIMPACK simulations (Figure 4.9(c) and (d)). The reduced RMS acceleration
in turn indicates a lower noise level due to gear rattle. The wheel gear inertia
effect was verified through the experiment in [116] where the RMS values were
measured with three gears using different inertias as shown in Figure 4.11. The
results showed that high inertia resulted in a low RMS acceleration value, as
well as the rattle noise. Thus, it is shown that the proposed analytical method
can be used to evaluate the gear parameters effect on the rattling noise level,
and provide a gear rattle measure (Eqn. 4.19) to aid in the gearbox design
optimization.

Chapter 4 An Analytical Method to Evaluate Gear Parameters Effect
93
0 0.02 0.04 0.06 0.08 0.10.25
0.3
0.35
0.4
0.45
Time [s]
Fri
ction
al T
orq
ue [
N.m
]
Bearing
Lubricant
(a)
0 0.01 0.02 0.03 0.04 0.05-4
-3
-2
-1
0
1
2
3
4x 10
4
Time [s]
Conta
ct
forc
e [N
]
(b)
Figure 4.8 (a) Frictional torques and (b) gear teeth contact force at the wheel gear

Chapter 4 An Analytical Method to Evaluate Gear Parameters Effect
94
20 30 40 50 60 70 80
0.6
0.7
0.8
0.9
1
1.1
1.2
1.3
Half backlash [µm]
RM
S a
ccele
ratio
n
Predicted
Simpack
1 1.5 2 2.5 3 3.5 4
x 108
0.6
0.8
1
1.2
1.4
Meshing stiffness [N/(rad.m)]
RM
S a
ccele
ration
Predicted
Simpack
(a) (b)
0.4 0.6 0.8 1 1.2 1.4 1.6 1.8
x 10-3
0.8
1
1.2
1.4
1.6
1.8
Inertia [Kg.m2]]
RM
S a
cce
lera
tio
n
Predicted
Simpack
0.02 0.04 0.06 0.08 0.1
0.8
0.9
1
1.1
1.2
1.3
Damping factor
RM
S a
cce
lera
tio
n
Predicted
Simpack
(c) (d)
Figure 4.9 Normalized RMS of the wheel gear acceleration versus variation in gear parameters
(a) backlash, (b) meshing stiffness, (c) inertia of the wheel gear, and (d) damping factor
Figure 4.10 Effect of backlash on the rattling noise level at an angular acceleration amplitude of
600 rad/s2, based on results for the second gear idler gear [12]

Chapter 4 An Analytical Method to Evaluate Gear Parameters Effect
95
Figure 4.11 Influence of the unloaded gear inertia for an excitation at 45 Hz [116]
4.5 Conclusion
An analytical solution determining the RMS value of the rattle impact induced
acceleration component for wheel gears based on a dynamic model of a typical
manual transmission is presented in this chapter. Since RMS acceleration value
is proportional to the rattling noise level [116, 129], the proposed analytical
evaluation method is capable of investigating the gear parameters’ effect on the
rattle noise level. The evaluated RMS acceleration value for the wheel gear in
the typical transmission gearbox is then used to investigate the effect of
backlash, meshing stiffness, inertia and meshing damping factor on the rattle
noise levels. To verify the proposed analytical evaluation method, an MBS
dynamic model for the typical transmission is developed in SIMPACK. The
comparison of analytical and dynamics simulation analysis shows that the
proposed analytical expression for RMS acceleration value can effectively

Chapter 4 An Analytical Method to Evaluate Gear Parameters Effect
96
predict the influence of gear parameters. Moreover the obtained analytical and
simulation results also agrees with the previous experimental result in [12, 116].
Thus, the proposed evaluation method provides a simple guideline that can
optimize the gearbox parameters to reduce the gear rattle noise level.

Chapter 5 Detecting Planetary Gearbox Fault by MCSA
97
Chapter 5 Detecting Planetary Gearbox Fault by Motor
Current Signature Analysis
The electro-mechanical interactions in the electro-mechanical power-trains
(EMPTs) enable to investigate the torsional vibration through the electrical
signature from the electric machines. As a result, vibration signature excited by
the mechanical faults can be monitored by the stator current from the electric
machines, referred to as Motor Current Signal Analysis (MCSA). MCSA
provides an alternative nonintrusive fault detection approach. However, the
harmonics resulting from the structural properties of the electric machines and
the inherent system imperfections make it challenging to detect the incipient
fault in the planetary gearboxes, which will be explored in this chapter. In
Section 5.1, the overall configuration as well as the individual components in an
EMPT testbed are introduced, which can be used to verify the built models as
well as the proposed condition health monitoring (CHM) methods. In Section
5.2, a CHM method based on the resonance residual technique is proposed and
its performance over the existing methods is shown through both the simulation
and the experiments.
5.1 An Electro-Mechanical Power-Train Testbed
5.1.1 Overall configuration
To verify the models developed for the EMPTs and the proposed CHM method,
a configurable EMPT experimental testbed has already been built in
Mechatronics Lab, Nanyang Technological University. This testbed consists of

Chapter 5 Detecting Planetary Gearbox Fault by MCSA
98
two identical PMSMs (one as a driving motor, the other as a load generator),
two identical planetary gearboxes where each one has a back-to-back
configuration, a control panel, a load bank, a PC, a dSPACE 1104 DAQ &
control card, and a few sensors as in Figure 5.1. Both the PMSMs and the
gearboxes are installed on the slide ways. Together with the torque transducer
installed on a supporting beam, four different configurations can be achieved in
the EMPT as in Figure 5.2. This design helps to investigate a complex EMPT
step by step.
The driving motor is controlled by a variable frequency inverter, whose speed
command is prescribed through dSPACE 1104 through a D/A output port. The
load generator provides the load for the overall EMPT and the electricity
generated is dissipated by a load bank with variable steps. The dynamics of the
EMPT can be accessed by several different kinds of sensors including the LEM
current and voltage sensors, torque transducer, shaft encoder, as well as the
accelerometer. Finally, the experiment data is collected by dSPACE 1104 A/D
input ports.
5.1.2 Control panel
A control panel not only accommodates several electrical components but also
isolates the high frequency electromagnetic noise caused by the inverter from
the rest of the system. And the power cable should also be well shielded to
remove the electromagnetic interference on the sensor signal. Otherwise, the
acquired data from the sensors may contain significant interference noise. Inside
the control panel, there is a variable frequency inverter, a few circuit breakers,

Chapter 5 Detecting Planetary Gearbox Fault by MCSA
99
Figure 5.1 Electro-mechanical power-train testbed
(a) (b)
(c) (d)
Figure 5.2 Four configurations of the power-train testbed
two PCBs integrated with the current and voltage sensors, and a DC power to
supply the sensors as in Figure 5.3. The three phase terminal voltage and the
line current of each PMSM can be measured by the sensors integrated on the
PCBs. On the left wall of the control panel, there are four power cables

Chapter 5 Detecting Planetary Gearbox Fault by MCSA
100
connecting different EMPT components together. On the right wall, there are a
few BNC connectors to be as the signal interfaces.
Figure 5.3 Control panel for the EMPT testbed
5.1.3 Sensor integration
In the Hall Effect current and voltage sensors, a primary coil and a secondary
coil are coupled together. In the current sensor (LEM HX-10P), the line current
directly flows through the primary coil. In the voltage sensor (LEM LV 25-P),
the primary coil is connected between two phase terminals and a resistor R1 is
insert to allow only a small fractional current flow through the primary coil. In
both sensors, a current proportional to the measured current/ voltage will be

Chapter 5 Detecting Planetary Gearbox Fault by MCSA
101
excited in the secondary coil. A measuring resistor RM / RL is put into the
secondary coil to convert the output current value into voltage value for easy
measurement as in Figure 5.4. In order to calculate the suitable resistances R1,
RM and RL, the maximum value of the measured signal and the measuring range
of the data acquisition system should be taken into consideration.
Figure 5.4 Wiring diagram of the current and voltage sensors for three phase measurement
(a) Shaft encoder (b) Torque transducer
Figure 5.5 Speed and torque sensors

Chapter 5 Detecting Planetary Gearbox Fault by MCSA
102
A solid shaft incremental encoder, with 5000 pulse per revolution (PPR) and the
differential RS422 output circuit, is connected to the PMSM shaft to measure its
rotational speed as in Figure 5.5. The measuring range of the shaft torque
transducer is ±50N.m, where there is an additional shaft encoder with line driver
output (TTL) and 360 PPR.
5.1.4 Parameters of the PMSMs
A three phase permanent magnet synchronous machine (PMSM) is used in this
testbed with parameters shown in Table 5.1. It can work as either a driving
motor or a load generator.
Table 5.1 Parameters of the PMSM
Parameters Value
Nominal power (kW)
Nominal voltage (V)
Nominal speed (RPM)
Number of poles
Stator winding resistance rs (Ω)
4
380
1500
4
1.28
Stator winding inductance Lq (mH) 160.4
Stator winding inductance Ld (mH) 39
Permanent magnet flux linkage λ’f (A·H) 0.66
Inertia of rotor JM (kg.m2) 0.013
5.1.5 Load bank
In the testbed, an 8.6 kW three phase load bank with six different load steps is
used whose wiring diagram is shown in Figure 5.6. If the applied terminal
voltage per phase is 220V, the power consumed by these resistors will be 0.1,
0.2, 0.5, 1, 2, and 3kW respectively.

Chapter 5 Detecting Planetary Gearbox Fault by MCSA
103
Figure 5.6 Wiring diagram of the load bank
5.1.6 Planetary gearbox and gear tooth fault creation
Each planetary gearbox in the testbed consists of two identical planetary gear
sets connected in a back-to-back configuration such that the overall speed ratio
is 1/4×4 =1.0, where 4 is the speed ratio for each gear set. The sun gear of one
gear set is connected to the driving motor, while the sun gear of the other gear
set is connected to the load generator. The carriers of the planetary gear set are
connected together through a steel spline, and the annulus gears are fixed to the
housing. In each planetary gear set, there are four equally spaced planets. The
parameters for the gear set are shown in Table 5.2.
The frequent occurred faults in the planetary gearbox are the spalling fault and
crack fault in the gear teeth. To investigate the dynamics under gear tooth fault
and verify the proposed CHM methods, an artificial gear tooth crack is

Chapter 5 Detecting Planetary Gearbox Fault by MCSA
104
introduced on one of the annulus gear tooth by removing 1/3rd of the tooth as in
Figure 5.7.
Table 5.2 Parameters of the planetary gear set
Parameter Sun Planet Annulus Carrier
Number of tooth 28 28 84 -
Number of planet - 4 - -
Pressure angle (°) 22.5 -
Radius (mm) 51.74 51.74 155.2 56
Module (mm) 2 -
Tooth face width (mm) 30 -
Gear meshing stiffness [N/(rad.m) ] kmin = 1.4×10⁸, and kmax = 2×10⁸ -
Mass (kg) 0.576 0.576 - 5.4
Inertia (kg.m2) 2.25×10⁻⁴ 2.25×10⁻⁴ - 1.32×10⁻²
Figure 5.7 The simulated tooth crack on the annulus gear
5.2 Resonance Residual Technique
5.2.1 Motor current signature analysis
An electro-mechanical power-train consisting of electrical machines connected
to a planetary gearbox can be found in several heavy-duty applications such as
wind turbines, maritime vessels, helicopters and automobiles [141, 142]. They

Chapter 5 Detecting Planetary Gearbox Fault by MCSA
105
allow a larger transmitted torque to weight ratio, easier control, higher
reliability and efficiency, and reduced maintenance costs. However, a failure in
the planetary gearbox can cause catastrophic accidents, extended downtimes
and require expensive maintenance. Therefore, early detection of such failures
can significantly reduce the associated capital losses. The conventional fault
detection approaches for the gearboxes are usually based on the vibration and
acoustic emission signatures [87, 89-91, 143]. However, practical
implementation of such approaches can face several limitations, including (a)
vibration and acoustic signals contain a significant noise resulting from external
perturbations, (b) these measurements are affected by the sensor placement and
the optimal sensor location is not always accessible, and (c) measurement is
sensitive to the operating environment [51]. Furthermore, the vibration spectra
of a planetary gearbox has complex characteristics, which are attributed to: (1)
the angle-varying gear meshing stiffness from the planet-sun and planet-annulus
gear meshes, and (2) the modulation effects introduced from the planet motion
with respect to the fixed sensor mounted on the gearbox housing [122]. As a
result of this modulation effect, the sidebands in the vibration spectra of a
planetary gearbox are often non-symmetric and some of the expected frequency
components may be missing.
Motor current signal analysis (MCSA), utilizing the stator current measurement
from the electrical machines, provides an alternative non-intrusive approach to
detect mechanical faults. The basis of MCSA is the reflection of mechanical
torsional vibration on the stator current [19]. Mechanical faults such as rotor
eccentricity, shaft misalignments, and bearing faults have been successfully

Chapter 5 Detecting Planetary Gearbox Fault by MCSA
106
detected through MCSA [103-105] using the sidebands introduced in the
current measurement spectra. Compared to the vibration signature analysis,
utilizing MCSA for planetary gearbox fault detection can bring an additional
benefit, where the analysis and interpretation of the results can be simplified by
removing the modulation effect due to planet motion with respect to stationary
sensor in the measured signal spectra. Faults in the fixed-axis gearboxes
containing spur, helical, or worm gears have been detected using MCSA by
monitoring the sidebands located at fe ± m•fGM ± n•fGF [51, 144-149]. The lowest
fault indicating frequency components fe ± n•fGF (by setting m = 0) were used as
an indicator to detect the gear tooth fault in [144-147, 150]. The sidebands
around the gear meshing frequency and its harmonics fe ± m•fGM ± n•fGF (m ≠ 0)
were proposed as an alternative indicator in [51, 144, 149]. However, most of
the sidebands due to an incipient gear tooth fault have rather low amplitude.
Therefore, they are often hidden by the harmonics resulting from the motor
structure and noise. Thus, it is necessary to explore the location of the sidebands
with high amplitudes that can provide rich fault information. However, such
investigation for MCSA applications to detect faults in the planetary gearboxes
is still lacking. The sideband amplitude at a given frequency is determined by
the structural properties of the power-train. Vibration spectrum in the vicinity of
the structural natural frequencies has been used to detect the spur gearbox and
rolling bearing faults, where the fault induced sidebands show a higher
amplitude around the structural frequencies of the power-trains [92, 151, 152].
Inspired by these approaches, this paper presents the resonance residual

Chapter 5 Detecting Planetary Gearbox Fault by MCSA
107
technique that extracts the fault signature of a planetary gearbox using the
measured stator current which often includes a high level of background noise.
The fault detection scheme presented in this section uses identified structural
natural frequencies for the first time to detect gear tooth faults based on MCSA.
Both simulations and experimental verification are presented to show the
applicability of this proposed approach applied to an EMPT comprising of a
driving motor (a Permanent Magnet Synchronous Machine, PMSM) connected
to a load generator (another PMSM) through a planetary gearbox with back-to-
back configuration (Figure 5.8). A multi-degree-of-freedom (DOF) lumped
model for this power-train is developed and is numerically integrated using
Newmark’s method to investigate its dynamic response. It was shown in [149]
that a gear tooth failure, such as a cracked tooth, spalled tooth or broken tooth,
always results in a local reduction of the meshing stiffness when the faulty tooth
passes through the gear meshing. Therefore, a seeded annulus gear tooth crack
is modeled in this work through a local reduction in gear meshing stiffness
function corresponding to each of the planet-annulus gear pair. The resonance
residual technique is then applied onto the simulated or measured stator current.
The resonance region around the evaluated structural frequencies of the power-
train is utilized in this technique to extract spectral components with rich fault
information of the gearbox. Furthermore, a fault indicator value is obtained to
monitor the gearbox. The robustness of the proposed technique to detect
gearbox faults under different operating conditions is demonstrated through
experiments. Finally, the effectiveness of the proposed method over existing
methods in fault detection from stator current is verified by experiments as well.

Chapter 5 Detecting Planetary Gearbox Fault by MCSA
108
Figure 5.8 Schematic of the investigated electro-mechanical power-train
5.2.2 Dynamic model of an electro-mechanical power-train
5.2.2.1 State-Space representation of the PMSM
A three phase PMSM consists of (i) a fixed stator with three phase windings a,
b and c, and (ii) a rotor with permanent magnet poles (Figure 2.11). When a
three phase AC power supply is applied to the stator windings, a rotating
magnetic field is produced which interacts with the permanent magnet poles on
the rotor to push it forward. The dynamics of the PMSM can be described using
Park’s model as in [33, 35, 153], which can be rearranged in a state-space
equation representation on the rotor reference frame (d-q) as
( ) BΛAΛ
′+
+
−
−−=
dsfd
q
d
q
dsr
rqs
d
q
LRv
v
LR
LR
r
λλ
λ
ω
ω
λ
λ
ω
0
ɺ
ɺ
ɺ
(5.1)
where Λ is the magnetic flux linkage vector. The matrix A(ωr) is a function of
electrical rotor speed ωr, B is the input vector comprising of the terminal
voltages and a constant term from the permanent magnet flux linkage. The
stator current vector I can be evaluated using Λ as
GΛLI
′−+
=
−
dfd
q
d
q
d
q
LL
L
i
i
λλ
λ 0
10
01
1
(5.2)

Chapter 5 Detecting Planetary Gearbox Fault by MCSA
109
where L is the inductance matrix, and G is a constant vector. Based on Eqn. 5.1
and 5.2, a model for the PMSM (load generator) can be built in SIMULINK as
in Figure 5.10.
5.2.2.2 Lumped parameter model for planetary gearbox
With the multi-DOF lumped model developed for a planetary gear set in
Section 3.4.2, each gear set in the planetary gearbox can be represented as
jjjjjjj ΤQKQCQM =++ ɺɺɺ
(5.3)
where j = 1 or 2 represents one of the two gear sets, Mj is the mass matrix, Cj is
the damping matrix, Kj is the stiffness matrix, and Tj is the externally applied
torque vector. The vector Qj contains all the rotational DOFs of the gear set as
[ ]T
cjjpjpjpjpsjj θθθθθθ 4321=Q
(5.4)
where the subscript s represents the sun gear, the subscripts c represents the
carrier and p1 to p4 represent planet 1 to 4. If the gearbox is free of any defects,
the gear meshing stiffness is a function of the gear angular displacement and
can be described by a square waveform [57, 66]. The gear meshing stiffness for
a pair of teeth is determined by the teeth bending stiffness, fillet-foundation
stiffness, and the Hertzian contact stiffness [119]. If a tooth defect is present, a
partial loss of the contact occurs whenever the faulty tooth is engaged, resulting
in a local reduction in the meshing stiffness function [119] due to the increased
flexibility of the gear teeth. The meshing stiffness functions used in simulation
for healthy and faulty gear are shown in Figure 5.9. Due to the local reduction
in the meshing stiffness, amplitude and phase modulation effects are introduced
into the vibration response. These modulation effects appear as sidebands in the

Chapter 5 Detecting Planetary Gearbox Fault by MCSA
110
vibration spectrum, whose frequency locations are determined by the gear fault
location [92]. Furthermore, these sidebands are also reflected on the stator
current obtained from the electrical machines, which is discussed in detail in
Section 5.2.3.
LossK∆
Figure 5.9 Gear meshing stiffness under healthy and faulty conditions
Within the planetary gearbox, the torsional stiffness of the spline which couples
the two planetary gear sets in a back-to-back configuration can be estimated as
( ) ( )splsplIsplOspl LddGk 3244
−= π
(5.5)
where G is the shear modulus, dsplO is the outer diameter of the spline, dsplI is the
inner diameter, and Lspl is the spline length.
5.2.2.3 Model of the electro-mechanical power-train
As shown in Figure 5.8, two shaft couplings with different torsional flexibilities
are used to couple the two PMSMs with the planetary gearbox on each side,
whose stiffness and inertia properties are given in Table 5.3. The low stiffness
coupling (cpl1) is installed between a sun gear and the driving motor to remove
high frequency noise introduced from the motor side, while the high stiffness

Chapter 5 Detecting Planetary Gearbox Fault by MCSA
111
coupling (cpl2) is installed between sun gear of the other gear set and the load
generator.
Table 5.3 Parameters of the shaft couplings
Parameters Coupling 1(cpl1) Coupling 2(cpl2)
Torsional stiffness (kN•m/rad) 1.29 54
Inertia (kg.m2) 8.7×10⁻⁴ 8.8×10⁻³
Discrete,
Ts = 1e-06 s.
Zero-Order
Hold
var
To Workspace2
speed1
To Workspace
Carrier2
Carrier1
Tspl
Spline
Speed
Rate
Transition2
Rate
Transition1
RL
Load resistance
RL
Tpm
Output
Load Generator
Tsun
Tcarrier
Sun
Planet1
Planet2
Planet3
Planet4
Carrier
Healthy planetary gear set
-1
-1
Sun2
w m
Tfcpl2
Flexible coupling2
w m
Sun1
Tfcpl1
Flexible coupling1
Tsun
Tcarrier
Sun
Planet1
Planet2
Planet3
Planet4
Carrier
Faulty planetary gear set
SP Motor
Conv.
Ctrl
A
B
C
AC3
Tm
Wm
Driving Motor
A
B
C
460V 60Hz
<wm>
<wm>
<Thetam>
<idqs>
<iabcs>
<Tem>
Figure 5.10 Diagram of the EMPT model in SIMULINK

Chapter 5 Detecting Planetary Gearbox Fault by MCSA
112
With the model built for the planetary gear set in Section 3.4.2 as well as the
PMSM model in Section 5.2.2, the electro-mechanical power-train is modeled
in SIMULINK as Figure 5.10.
5.2.3 Resonance residual based fault detection technique
5.2.3.1 Planetary gearbox to load generator rotor transmission
The transmission of the torque fluctuation from the planetary gearbox to the
rotor vibration of the load generator is determined by the rotor inertias and the
shaft flexibilities. By reflecting the entire gearbox inertia on the sun gear
connected with the load generator, an equivalent inertia Jeq of the gearbox can
be obtained as ([57])
( )2
22
2
2
214
24
2 bc
bs
bcpc
bp
bs
psseqr
rrMPJ
r
rPJJJJ ⋅⋅++⋅++=
(5.6)
where the planetary gearbox comprises of two planetary gear sets, both of
which are taken into consideration. Js1= Js+Jcpl1/2 and Js2= Js+Jcpl2/2 are the
overall inertia at each sun gear, where half inertia of the couplings are added to
the corresponding sun gears. Js, Jp, Jc, Jcpl1, and Jcpl2 are the inertias of the sun
gear, planet, carrier (values provided in Table 5.2), and the coupling 1 and 2
(values provided in Table 5.3) respectively. P is the number of the planet. rbs,
rbp and rbc are the base radii of the sun gear, planets and the carrier respectively.
Mp is the mass of the planet. The overall power-train can be simplified as a two-
mass system shown in Figure 5.11. The governing equations for the simplified
two-mass system are
( )Leqcpleqeqeq kTJ θθθ −−= 2
ɺɺ
(5.7a)

Chapter 5 Detecting Planetary Gearbox Fault by MCSA
113
( )eqLcplLLL kTJ θθθ −−−= 2
ɺɺ
(5.7b)
where JL = JM + Jcpl2/2 is the overall inertia of the load generator, θeq is the
angular displacement of the equivalent gearbox inertia, θL is the angular
displacement of the load generator, Teq is the torque applied on the equivalent
inertia, and TL is the load torque. The damping in shaft and coupling is primarily
material based, which is low and therefore can be neglected. Equation 5.7 can
be simplified to describe the relationship between the gearbox torque fluctuation
and the torsional vibration experienced at the load generator as
( ) ( )( ) ( ) 2
24
21
δδδ
δθδ
cplLeqLeq
cpl
eq
L
kJJJJ
k
TG
++==
(5.8)
where δ is the Laplace variable and the parameters corresponding to the
considered testbed are shown in Table 5.1, Table 5.2 and Table 5.3. The
frequency response of G1(δ) is shown in Figure 5.12(a). It can be observed that
G1(δ) has a high amplitude gain around the natural frequency fN of the two-mass
system.
+=
Leq
cplNJJ
kf11
2
12
π (5.9)
Therefore, the transmitted vibration response from the gearbox side to the load
generator has energy concentration around the resonance frequency.
kcpl2θL
Jeq JL
θeq
Teq TL
Figure 5.11 Two-mass system representation for load generator with equivalent inertia

Chapter 5 Detecting Planetary Gearbox Fault by MCSA
114
5.2.3.2 Effect of generator vibration on stator current
MCSA relies on the reflection of the torsional vibration on the stator current.
However, the frequency response function of the stator current to the torsional
vibration has not yet been sufficiently investigated in the existing literatures.
For a balanced three phase PMSM, the voltage equation of phase a is
( )rf
cs
ascs
bs
asbs
as
asasassasdt
d
dt
diL
dt
diL
dt
diLiRv θλ sin′++++=
(5.10)
where Lasas is the self-inductance of stator winding as, Lasbs is the mutual-
inductance between the windings as and bs, Lascs is the mutual-inductance
between the windings as and cs, and θr is the electrical angular displacement of
the PMSM. The induced stator current is related to the electrical angular
displacement as
−−=
2cos2
πξθ rsas Ii
(5.11a)
−−=
6
7cos2
πξθ rsbs Ii
(5.11b)
+−=
6cos2
πξθ rscs Ii
(5.11c)
where Is is the root mean square of the stator current, and ξ is the lead angle of
the rotor magnetic field with respect to the stator magnetic field (generator
mode). The inductance of the stator winding
rBAlsasas LLLL θ2cos−+=
(5.12a)
−−−=
32cos
2
πθ rB
A
asbs LL
L (5.12b)
+−−=
32cos
2
πθ rB
A
ascs LL
L (5.12c)
where Lls is the leakage stator inductance, and LA and LB are defined as

Chapter 5 Detecting Planetary Gearbox Fault by MCSA
115
( )lsqdA LLLL 2
3
1−+=
(5.13a)
( )qdB LLL −=
3
1
(5.13b)
101
102
103
10-8
10-6
10-4
10-2
Frequency [Hz]
Am
plit
ude [
rad/(
N.m
)]
(a)
101
102
103
100.87
100.88
100.89
Frequency [Hz]
Am
plit
ude [
A/r
ad]
(b)
Figure 5.12 Frequency response functions (a) gearbox torque fluctuation to electrical machine
rotor vibration G1(δ), and (b) electrical machine rotor vibration to stator current signal G2(δ).

Chapter 5 Detecting Planetary Gearbox Fault by MCSA
116
Using Eqn. 5.10-5.13, the relationship between the applied stator voltage vas,
electrical angular displacement θr, and stator current ias for phase a is
( ) ( )rf
asj
BAlsassasdt
d
dt
dieLLLiRv θλπξ sin
2
3
2
3 22 ′+
−++= +
(5.14)
θr can be partitioned into terms corresponding to nominal speed and a
fluctuating component due to torsional vibrations
222 0 wwtw mmmr ⋅∆+⋅=⋅= θωθθ
(5.15)
where w is the number of poles of the PMSM. The nominal speed ωm0 is a
constant and does not affect frequency response. Therefore, it can be neglected.
The amplitude of ∆θm is usually low, resulting in sin(∆θm) ≈ ∆θm. Thus,
Eqn.5.14 can be rewritten as
( )mf
asj
BAlsassasdt
dw
dt
dieLLLiRv θλπξ ∆′+
−++= +
22
3
2
3 22
(5.16)
Furthermore, the transmission of the torsional vibration to the stator current
signal can be derived as
( )( )( ) ( ) δ
δλ
δθ
δδ
πξ
−++
′−=
∆=
+ 222
2
3
2
32
j
BAlss
f
m
as
eLLLR
w
iG
(5.17)
Equation 5.17 shows that the rotor speed oscillation ∆θm can be reflected onto
the stator current ias, where the PMSM parameters are described in Table 5.1.
The lead angle ξ is assumed to be 2π/3, which is typical in PMSMs. Figure
5.12(b) shows the frequency response of G2(δ). It can be observed that in the
lower frequency range, the amplitude response from ∆θm to ias increases with
the frequency, and approaches a constant in the higher frequency range. The
corner frequency which lies between these two regions is determined by the

Chapter 5 Detecting Planetary Gearbox Fault by MCSA
117
parameters of the PMSM. Thus, Eqn. 5.8 shows that the vibration signature can
be transmitted from the gearbox to the connected rotor of the PMSM wherein a
peak amplitude in transmission function is observed around the natural
frequency of the power-train, and Eqn. 5.17 shows that the mechanical vibration
reflected onto the stator current has a constant amplitude of the frequency
response function after the corner point. This implies that detecting gear fault
using sidebands in measured current signals around the power-train’s natural
frequency should be feasible. The remainder of this section presents a fault
detection algorithm based on MCSA that utilizes the peak in the transmission
function response around the natural frequency of the power-train.
Figure 5.13 Fault detection algorithm based on resonance residual approach
5.2.3.3 Fault detection algorithm
As discussed earlier, a gear tooth fault results in amplitude and phase
modulation of the nominal vibration signal, which can be detected by
monitoring the sideband patterns in the vibration spectra. Also, these gear
vibration signals can be transmitted to the rotor of the load generator, where the
dominant sidebands are expected to be around the structural frequency of the

Chapter 5 Detecting Planetary Gearbox Fault by MCSA
118
power-train. Therefore, the reflection of the sidebands on the stator current
enables detection of the gear fault by MCSA. Figure 5.13 shows a proposed
fault detection algorithm for a gearbox connected to a PMSM through the
measured stator current using the resonance residual technique. First, the stator
current is transformed from stationary reference frame (abc) to rotor reference
frame (d-q) to remove the fundamental line frequency fe which otherwise may
mask the sidebands arising from the fault. Then, the signal is resampled from
the time domain to the angle domain/shaft order domain to remove the influence
of small speed / load fluctuations that often blur the obtained current spectra.
This step improves the signal to noise characteristics of the measurements [65].
To obtain the spectrum of the current signal with respect to the shaft orders,
Fast Fourier Transform (FFT) is adopted. However, for presentation of results,
stator current spectrum is shown in the frequency domain where frequency =
shaft order × nominal operating speed × number of pole pair. Presenting the
results using the frequency domain instead of shaft order domain allows the
readers to easily locate the resonance region in presented spectra. In the
obtained current spectrum, the gear meshing frequency and its harmonics, as
well as the identified harmonics due to the electric machine structure are set to
zero. For this step, measuring the stator current spectrum of generator without
connecting it to the gearbox can predetermine the harmonics resulting from the
electrical machine structure. The signal is then band-pass filtered to remove the
stator current response and noise outside the resonance band. The center
frequency of the filter is set as the natural frequency fN of the power-train
corresponding to the gearbox-generator coupling estimated using Eqn. 5.9.

Chapter 5 Detecting Planetary Gearbox Fault by MCSA
119
Inverse Fast Fourier Transform (IFFT) is utilized to obtain the residual signal
r(t). Finally, a fault indicator FI, similar to that proposed in [93], is evaluated to
indicate the health condition of the gearbox as
( )( ) ,∑= iGMAtrPPFI
(5.18)
where PP(r(t)) is the peak to peak value of the residual signal r(t) to measure
the amplitude fluctuation, and ∑ iGMA , is the summation of the amplitude of
the meshing frequency and its harmonics determined by the operating
conditions.
5.2.4 Simulation results
5.2.4.1 Results from SIMULINK
Table 5.1, Table 5.2 and Table 5.3 provide the parameters for the shaft
couplings, three-phase PMSM, and the planetary gear set. The stiffness of the
two flexible couplings are kcpl1 = 1.29kN•m/rad and kcpl2 = 54kN•m/rad, while
the rotational gear meshing stiffness is significantly higher than the above two.
The natural frequencies of the power-train assembly can be evaluated as the
solutions of the equation det(-Mω2+K)=0 [32]. Because of the free boundary
conditions at the rotor inertias of electric machines, the first solution is zero,
which corresponds to the rigid body mode. This mode can be neglected in the
vibration response analysis of the system. Further, it can be seen from Figure
5.12(a) that the response transmission of vibration signal from gearbox to
generator side attenuates quickly as the frequency increases. Therefore, only the
next three frequencies determined as 90, 449, and 2530Hz are considered. A
lower stiffness results in a lower structural frequency. Therefore, the first

Chapter 5 Detecting Planetary Gearbox Fault by MCSA
120
natural frequency is found to be associated to coupling 1 (between the driving
motor and gearbox) which has the lowest corresponding stiffness. The second
natural frequency is found to be associated to coupling 2 between the load
generator and the gearbox, and the third natural frequency is associated to the
meshing among the gears which is significantly stiffer.
In the simulation, the operating condition for the power-train is set as: operating
speed = 600rpm, load power = 0.76kW, and load torque = 12.1N.m (which is
the same as the operating condition I used in experimental study as shown in
Table 5.4). A healthy gearbox is simulated first, followed by a gearbox with
cracked annulus gear tooth. At this operating speed, the gear meshing frequency
equals to 210Hz and the fault in the annulus gear will excite sidebands with
spacing equal to be 10Hz. Fluctuations in stator current are observed even for
the healthy planetary gearbox, which is a result of the variation in the gear
meshing stiffness with respect to the rotational angle. Such oscillations
evaluated from a healthy planetary gearbox are illustrated in Figure 5.14(a).
Finite element analysis using ANSYS estimated that losing one third of a teeth
in the annulus gear results in a local drop of around 0.2×10⁸ N/(rad.m) in gear
meshing stiffness function as in Section 3.4.2. This local reduction excites a
periodic impulse in the torsional vibration which is reflected on the stator
current signal as shown in Figure 5.14(b).
Under healthy condition, the gear meshing frequency and its harmonics are the
dominant frequency components in the spectrum of the stator current (Figure
5.15(a)). A few sidebands with low amplitude can be observed around 449 Hz

Chapter 5 Detecting Planetary Gearbox Fault by MCSA
121
0 0.05 0.1 0.15 0.2 0.25 0.3 0.35 0.4
-3.523
-3.5228
-3.5226
-3.5224
Time [s]
Curr
ent
[A]
(a)
0 0.05 0.1 0.15 0.2 0.25 0.3 0.35 0.4
-3.523
-3.5228
-3.5226
-3.5224
Time [s]
Curr
ent
[A]
TGF
(b)
Figure 5.14 Time waveform of the stator current id (a) healthy condition, and (b) gear tooth
crack
which is the natural frequency of the power-train (corresponding to the gearbox
generator coupling). The appearance of those sidebands can be attributed to the

Chapter 5 Detecting Planetary Gearbox Fault by MCSA
122
interaction between gear meshing frequency and the natural frequencies.
However, in presence of fault, several more sidebands having significantly
higher amplitude can be observed in Figure 5.15(b). Further, it is noteworthy to
observe that the amplitude of the sidebands at the low frequencies and those
around the 449Hz resonance frequency are comparable. However, there are
more sidebands in the latter location.
Using the proposed resonance residual technique shown in Figure 5.13, the
residual signals for both the healthy and faulty simulated cases are obtained in
Figure 5.16. The parameters used in the algorithm are as follows. In Step 5, the
gear meshing frequency 210Hz and its harmonics are set to be zero in the stator
current spectra. In Step 6, a band pass filter with a low cutoff frequency of 400
Hz and a high cutoff frequency of 500 Hz is used to extract the sidebands
around the evaluated natural frequency. In Step 7, IFFT command in MATLAB
is applied on the band passed signal to obtain the residual signal r(t). Finally,
the fault indicator value in Eqn. 5.18 is evaluated to monitor the health
condition of the gearbox. Periodic high peaks having time period corresponding
to the annulus gear fault can be observed in the residual signal obtained from
the faulty gearbox case in Figure 5.16, indicating a fault at the annulus gear
teeth of the planetary gearbox. The corresponding fault indicators for the faulty
and healthy gearbox are 8.9×10⁻³ and 2.8×10⁻³ respectively. Thus, it can be seen
that a gearbox fault produces a higher fault indicator value than the healthy case
demonstrating the capability of proposed algorithm to detect planetary gearbox
faults through MCSA. In the next section, the capability of the proposed
3f

Chapter 5 Detecting Planetary Gearbox Fault by MCSA
123
algorithm to detect planetary gearbox faults is further verified through
experiments.
0 100 200 300 400 500 600 700 8000
1
2
3
4
5
6
7
8x 10
-7
Frequency [Hz]
Am
plit
ude [
A]
(a)
0 100 200 300 400 500 600 700 8000
1
2
3
4
5
6
7
8x 10
-7
Frequency [Hz]
Am
plit
ude [
A]
Lower frequency region Natural frequency (b)
Figure 5.15 Sidebands excited in the spectra of the stator current (a) healthy condition, and (b)
gear tooth crack.
2fGM
fGM 3fGM
Sidebands

Chapter 5 Detecting Planetary Gearbox Fault by MCSA
124
0 0.5 1 1.5 2 2.5 3 3.5 4 4.5 5-1.5
-1
-0.5
0
0.5
1
1.5x 10
-6
Revolution of load generator
Am
plit
ude [
A]
Faulty
Healthy
Figure 5.16 Evaluated residual signals obtained from the stator current.
Table 5.4 Parameters for experimental operating conditions
Case Speed
(rpm)
Power
(kW)
Load torque
(N.m)
Gear meshing
frequency fGM (Hz)
Gear fault
frequency fGF (Hz)
I 600 0.76 12.1 210 10
II 600 0.26 4.2 210 10
III 1500 2.0 12.7 525 25
5.2.4.2 Results from a nonlinear model built in ANSOFT
To explore the dynamics response of stator current to vibration signature
induced by the gear tooth fault in the practical electric machines, a nonlinear
analytical model built in ANSOFT for the PMSM in Section 3.3.2 is utilized,
where the speed of the load generator acquired from Section 5.2.3 is used as the
speed input of the PMSM. The spectra of the stator current with gear tooth fault
are shown in Figure 5.17, where it can be seen that lots of sidebands are excited

Chapter 5 Detecting Planetary Gearbox Fault by MCSA
125
in the resonance region while there are few sidebands in the lower frequency
range.
Lower frequency: Resonance region:
Figure 5.17 Stator current spectra under faulty gear tooth based on model in ANSOFT
5.2.5 Experimental validation
The proposed fault detection method is experimentally verified using an EMPT
testbed whose configuration was shown earlier in Figure 5.8. An annulus gear
tooth crack is created on the second gear set by removing 1/3rd of a tooth
(Figure 5.7). The speed command of the driving motor is output through an
analog signal from dSPACE 1104. The electricity generated by the load
generator is dissipated at a resistive load bank at different power steps. The
current of the load generator are measured by three Hall Effect sensors. The
rotor speed of generator is measured by an incremental encoder having 5000
pulses per revolution. The power-train was operated under three different
operating conditions (Table 5.4) to show both the effectiveness of the proposed
3f

Chapter 5 Detecting Planetary Gearbox Fault by MCSA
126
method over the existing ones and its robustness to detect faults under different
operating conditions.
0 5 10 15 20 25 300
200
Speed [
rad/s
]
0 5 10 15 20 25 30-5000
0
5000
Accela
tion [
rad/s
2]
Time [s]
Speed
Acce
(a)
0 100 200 300 400 500 6000
0.005
0.01
0.015
0.02
0.025
0.03
0.035
0.04
0.045
0.05
Frequency [Hz]
Am
plit
ude [
rad/s
]
300.3 Hz
267 Hz
361 Hz
(b)
Figure 5.18 Identification of PMSM’s dominant structural frequencies (a) speed and
acceleration plots for load generator, and (b) spectrum of measured speed.

Chapter 5 Detecting Planetary Gearbox Fault by MCSA
127
0 5 10 15 20 25 300
200
Speed [
rad/s
]
0 5 10 15 20 25 30-1
0
1x 10
4
Accela
tion [
rad/s
2]
Time [s]
Speed
Acce
(a)
0 100 200 300 400 500 6000
0.005
0.01
0.015
0.02
0.025
Frequency [Hz]
Am
plit
ude [
rad/s
]
360.5 Hz
446 Hz300.1 Hz
(b)
Figure 5.19 Identification of the overall power-train structural frequencies (a) speed and
acceleration plots of load generator, and (b) spectrum of measured speed.

Chapter 5 Detecting Planetary Gearbox Fault by MCSA
128
5.2.5.1 Identification of the power-train’s natural frequencies
The PMSM injects several dominant frequencies due to its own structure in the
measured current spectra. These dominant frequencies from the motor structure
can affect the fault detection process and therefore must be identified
beforehand. For this, the driving motor is directly connected to the load
generator through coupling 1. Its low stiffness isolates the vibration of the
PMSMs from each other. Afterwards, the motor is given a ramp speed
command from 300 to 2400rpm followed by deceleration as shown in Figure
5.18(a). Whenever the operating speed of the motor matches one of the
structural/ resonance frequencies, large speed oscillations can be observed in the
measured encoder signal. The acceleration curve of the load generator, obtained
by differentiating the speed measured from the encoder, shows several such
resonances (Figure 5.18(a)). Three dominant structural frequencies were excited
at the load generator speed: 267, 300, and 361Hz (Figure 5.18(b)). Afterwards,
the planetary gearbox is installed to investigate the natural frequencies of the
power-train with the same speed profile, where a new dominant component
(around 446Hz) can be found in the spectrum of the load generator speed
(Figure 5.19). Compared with the previous theoretical results, it can be
determined that the 446 Hz component is the natural frequency of the power-
train arising from the flexibility of the generator gearbox connection.
5.2.5.2 Detection of gear tooth crack using stator current
The stator current spectrum of a healthy planetary gearbox under operation
condition I are shown as an example in Figure 5.20 to demonstrate its

Chapter 5 Detecting Planetary Gearbox Fault by MCSA
129
complexity due to dominant frequency components from different sources.
Even under the presumed healthy condition, several dominant frequency
components can be observed, which arises from the gear meshing frequency fGM
(given in Table 5.4) and its harmonics, as well as the manufacturing and
installation errors of the power-train. Furthermore, harmonics resulting from the
PMSM structure [36, 37] are also reflected in the stator current. These
harmonics were not reflected in the simulation study presented earlier using
Park’s model, as this model assumed that, (1) the number of the stator winding
coils is distributed sinusoidally around the stator, (2) magnetic saturation does
not occur, (3) the influence of the slot on the magnetic permeance is negligible,
(4) the higher order harmonics due to distribution of permanent magnet
materials can be ignored, and (5) the three-phase winding is ideally balanced.
For the described experimental test rig, it was identified that the PMSM
introduced significant contributions at the 1st, 2nd, 3rd, 4th, 6th, 12th, 14th, 16th,
18th, 21st, and 24th harmonics of the fundamental frequency as in Figure 5.20(a).
The application of the proposed algorithm for experimental investigation is
similar to that for simulation study. First, the measured stator current is
transformed to the rotor reference frame to remove the fundamental line
frequency, followed by resampling to angle domain to remove the speed
fluctuation in the power-train. Afterwards, the spectra of the measured stator
current are obtained using FFT. In Step 5, the gear meshing frequency fGM
(Table 5.4) and its harmonics, as well as the before mentioned PMSM structure
induced harmonics are set to be zero in the spectra. In Step 6, a band pass filter

Chapter 5 Detecting Planetary Gearbox Fault by MCSA
130
Sidebands excited by Gear meshing frequency and harmonics Harmonics from generator structure imperfection and gearbox fault
1st 2nd 3rd 4th 6th 12th 14th 16th 18th 21st 24th
0 100 200 300 400 500 6000
0.5
1
1.5x 10
-3
Frequency [Hz]
Am
plit
ude [A
]
Healthy
Faulty
(a)
400 410 420 430 440 450 460 470 480 490 5000
0.1
0.2
0.3
0.4
0.5
0.6
0.7
0.8
0.9
1x 10
-3
Frequency [Hz]
Am
plitude [A]
Healthy
Faulty
(b)
0 5 10 15 20 25 30 35 40 45 500
0.5
1
1.5
2
2.5
3
3.5
4
4.5
5x 10
-4
Frequency [Hz]
Am
plitude [A]
Healthy
Faulty
1st sideband
(c)
Figure 5.20 The stator current spectra of load generator (a) overall frequency band, (b) around
structural frequency, and (c) in low frequency range.

Chapter 5 Detecting Planetary Gearbox Fault by MCSA
131
with low cutoff frequency 400 and high cutoff frequency 500 Hz is used to
extract the rich gear fault information around the resonance frequency 446Hz as
in Figure 5.20. In Step 7, IFFT of the band passed signal produces the residual
signal r(t) as in Figure 5.21. Finally, the health condition can be identified by
the fault indicator in Eqn. 5.18. The robustness of the proposed method was
investigated through three different operating conditions I, II and III (Table 5.4),
where the corresponding fault indicator values for both the faulty and healthy
gearboxes as well as their ratios are shown in Table 5.5. From Table 5.5, it can
be seen that the evaluated fault indicator value depends on the operating
conditions of the experiments. Therefore, the fault indicator value evaluated at
one particular operating condition cannot be used as a reference to monitor the
gearbox health running under another operating condition. Further, it can be
seen that the fault indicator ratio is sensitive to the load torque, where a high
load torque results in a larger ratio between the faulty and healthy conditions.
Therefore, to implement the proposed method, the fault indicator for the healthy
gearbox should be pre-determined in its range of operating speed and load. The
thresholds for indicating gearbox faults can be set based on the fault indicator
ratio between the faulty and healthy gearboxes at a given operating condition.
During its operation, the fault indicator can be monitored continuously, where
an increase beyond the threshold limit indicates a fault in the gearbox.

Chapter 5 Detecting Planetary Gearbox Fault by MCSA
132
0 0.5 1 1.5 2 2.5 3 3.5 4 4.5 5-5
-4
-3
-2
-1
0
1
2
3
4
5x 10
-3
Revolution of load generator
Am
plit
ude [A
]
Faulty
Healthy
(a)
0 0.5 1 1.5 2 2.5 3 3.5 4 4.5 5-2
-1.5
-1
-0.5
0
0.5
1
1.5
2x 10
-3
Revolution of load generator
Am
plit
ude [A
]
Faulty
Healthy
(b)
(c)
Figure 5.21 Residual signal of the stator current (a) operating condition I, (b) operating
condition II, and (c) operating condition III

Chapter 5 Detecting Planetary Gearbox Fault by MCSA
133
Existing fault detection methods based on MCSA utilize the amplitude of the
sidebands in the lower frequency range of the stator current spectra as an
indicator to monitor a gearbox’s health condition [145-148]. For the conducted
experiments, only the 1st sideband corresponding to the annulus gear tooth crack
in the lower frequency range of current spectra shows apparent increase (Figure
5.20(c)). Therefore, this particular sideband was used as a fault indicator of the
gearbox health condition as well, where the fault indicator is rescaled by the
∑ iGMA , as in Eqn. 5.18. With the existing methods, the fault indicators for the
faulty and healthy gearboxes and their ratios are also given in Table 5.5.
Comparison of the fault indicators obtained from the existing method and the
proposed method shows that the former produces a lower fault indicator ratio.
Thus, the proposed method is more effective in detecting the gearbox fault
through MCSA.
Table 5.5 Fault indicators from existing and proposed methods
Case
FI from existing method FI from proposed method
Healthy Faulty Ratio Healthy Faulty Ratio
I 0.41 0.53 1.29 1.02 1.74 1.71
II 0.91 1.12 1.23 1.77 2.33 1.35
III 1.14 1.35 1.18 0.21 0.35 1.67
5.2.6 Conclusion
In this section, a novel fault detection scheme that extracts rich fault
information from the frequency region in vicinity of power-train resonance in
measured stator current spectrum is developed and implemented. This approach

Chapter 5 Detecting Planetary Gearbox Fault by MCSA
134
is applied through both simulations and experiments to an electro-mechanical
power-train consisting of a driving motor connected to a load generator through
a back-to-back planetary gearbox. The frequency response functions of the
transmitted vibration from gearbox to electrical machine rotor, and from rotor
vibration to stator current response are presented to show that the sidebands in
the vicinity of power-train natural frequency of current spectrum contain rich
fault information. The first frequency response function has a high amplitude
relationship around the power-train natural frequency, while the second one has
higher amplitude at the higher range of frequencies. Both simulations and
experiments show a significant presence of sidebands in the current spectrum in
vicinity of power-train natural frequency. The proposed algorithm is applied to
experiments conducted at different operating conditions. It is shown that the
fault indicator determined by proposed approach is more sensitive to presence
of gearbox faults as compared to existing MCSA based approaches.

Chapter 6 Conclusion and Remarks
135
Chapter 6 Concluding and Remarks
The electro-mechanical power-trains (EMPTs) are now utilized in many
applications. Compared with the conventional power-trains, the EMPTs provide
higher fuel efficiency, better dynamic performance, and lower maintenance
costs because, (1) the electrical components can decouple the power generation
stage from the load part, which enables the engine to operate always with high
efficiency, and (2) the electrical drives have a faster and smoother response than
the internal combustion engines.
However, the following factors challenge the reliability and applicability of
EMPTs:
(1) Modeling of the EMPTs is challenging due to the immense variation in
required model selection and approach with respect to the EMPTs’
configuration and the research applications. Furthermore, there is a lack of the
efficient model development techniques that offer a good overall electro-
mechanical modeling capability.
(2) The resulting challenge in being able to model the nonlinear dynamics of the
power-trains has let to insufficient investigation and lack of the design
optimization knowledge, for example, appropriate gearbox selection to reduce
the vibration and noise in the power-trains.
(3) The electro-mechanical interactions have not been fully revealed, especially
the reflection of the vibration signature onto the stator current of electric

Chapter 6 Conclusion and Remarks
136
machines. As a result, the stator current has not been effectively utilized to
analyze the dynamics and carry out condition monitoring of the EMPTs.
6.1 Contributions of this Thesis
To deal with the above mentioned research concerns on EMPTs, the following
three key contributions have been demonstrated in this presented thesis:
(1) A systematic co-simulation strategy, which utilizes the extensive model
libraries from block diagram (as available in MATLAB/SIMULINK), multi-
body system (such as SIMPACK), bond graph (such as 20-SIM), and finite
element analysis (such as ANSYS and ANSOFT), was presented to model the
EMPTs of various configurations for different research applications. The
proposed co-simulation strategy is applicable to different EMPT configurations
and can leverage on the model libraries to model healthy and faulty power-train
components accurately.
(2) A new analytical formulation to estimate the noise level due to the nonlinear
dynamic response exhibited by gear rattle in a typical automotive power-train
was developed. This formulation evaluated the effect of important gear design
parameters on the gear rattle vibration and noise level and thus can provide a
guideline in gearbox design to reduce the rattle noise concern. The formulation
was verified using co-simulation of automotive power-train model in
SIMPACK along with model library approach in MATLAB/ SIMULINK. The
results were also verified using existing experimental data available in
literatures.

Chapter 6 Conclusion and Remarks
137
(3) The electro-mechanical interactions were investigated through evaluation of
transfer function between the gearbox vibration and the stator current of the
electric machines. Based on this investigation, a novel condition health
monitoring (CHM) method based on the resonance residual technique is
proposed for the EMPTs through the measured stator current. Compared with
the existing CHM methods, this new method is more sensitive to incipient faults
in the EMPTs.
6.2 Future Work
Although the proposed CHM method for EMPTs is shown to be more sensitive
to the incipient faults than the existing methods, there is still some work to be
done in the future, including
(1) The performance of the proposed CHM method has only been explored
under steady speed. Thus, the CHM under unsteady speed condition will be
investigated in the future.
(2) The proposed CHM method was carried out on a load generator connected
to a pure resistive load in order to remove the nonlinearity and interference
introduced by the power electronics inverter and controller. To study the
influence of power electronics and control algorithms, the CHM will be
implemented at the driving motor side driven by the inverter in the future.

Bibliography
138
Bibliography
[1] I. Moir and A. G. Seabridge, Aircraft systems : mechanical, electrical,
and avionics subsystems integration, 3rd ed. Chichester, West Sussex, England ; Hoboken, NJ: Wiley, 2008.
[2] H. Zhang, C. Saudemont, B. Robyns, and M. Petit, "Comparison of technical features between a More Electric Aircraft and a Hybrid Electric Vehicle," in Vehicle Power and Propulsion Conference, 2008.
VPPC '08. IEEE, 2008, pp. 1-6.
[3] J. A. Rosero, J. A. Ortega, E. Aldabas, and L. Romeral, "Moving towards a more electric aircraft," Aerospace and Electronic Systems
Magazine, IEEE, vol. 22, pp. 3-9, 2007.
[4] Z. He, F. Mollet, C. Saudemont, and B. Robyns, "Experimental validation of energy storage system management strategies for a local DC distribution system of More Electric Aircraft," IEEE Transactions
on Industrial Electronics, vol. 57, pp. 3905-3916, 2010.
[5] U. Kiencke and L. Nielsen, Automotive control systems : for engine,
driveline, and vehicle, 2nd ed. Berlin: Springer, 2005.
[6] T. Katrasnik, "Hybridization of powertrain and downsizing of IC engine - A way to reduce fuel consumption and pollutant emissions - Part 1," Energy Conversion and Management, vol. 48, pp. 1411-23, 2007.
[7] I. Husain, Electric and hybrid vehicles : design fundamentals, 2nd ed. Boca Raton: CRC Press, 2011.
[8] Wikipedia, "Internal combustion engine," ed, 2013.
[9] P.-A. Michael, Decreasing fuel consumption and exhaust gas emissions
in transportation. New York: Springer, 2012.
[10] R. Izadi-Zamanabadi and M. Blanke, "A ship propulsion system as a benchmark for fault-tolerant control," Control Engineering Practice,
vol. 7, pp. 227-39, 1999.
[11] T. I. Fossen, Guidance and control of ocean vehicles. Chichester ; New York: Wiley, 1994.
[12] S. N. Dogan, "Loose part vibration in vehicle transmissions - gear rattle," Turkish Journal of Engineering and Environmental
Sciences/Turk Muhendislik ve Cevre Bilimleri Dergisi, vol. 23, pp. 439-454, 1999.

Bibliography
139
[13] M. L. Adams, Rotating machinery vibration : from analysis to
troubleshooting. New York: Marcel Dekker, 2001.
[14] E. F. Merrill, "Torsional dynamics of AC electrical machines and systems," in Conference Record of 1994 Annual Pulp and Paper
Industry Technical Conference, 1994, pp. 52-59.
[15] H. H. Lin, R. L. Huston, and J. J. Coy, "On dynamic loads in parallel shaft transmissions: part I-modelling and analysis," Journal of
mechanisms, transmissions, and automation in design, vol. 110, pp. 221-225, 1988.
[16] A. Farshidianfar, M. Ebrahimi, and H. Bartlett, "Hybrid modelling and simulation of the torsional vibration of vehicle driveline systems," Proceedings of the Institution of Mechanical Engineers, Part D: Journal
of Automobile Engineering, vol. 215, pp. 217-228, 2001.
[17] D. Jelaska, Gears and gear drives. Chichester, West Sussex ; Hoboken: John Wiley & Sons, 2012.
[18] D. J. Inman, Engineering vibration, 2nd ed. Upper Saddle River, N.J.: Prentice Hall, 2001.
[19] S. H. Kia, H. Henao, and G. A. Capolino, "Torsional vibration effects on induction machine current and torque signatures in gearbox-based electromechanical system," IEEE Transcations on Industrial
Electronics, vol. 56, pp. 4689-99, 2009.
[20] C. J. Li and H. Lee, "Gear fatigue crack prognosis using embedded model, gear dynamic model and fracture mechanics," Mechanical
Systems and Signal Processing, vol. 19, pp. 836-46, 2005.
[21] W. A. Tuplin, "Gear-tooth stresses at high speed," Institution of
Mechanical Engineers -- Proceedings, vol. 163, pp. 162-167, 1950.
[22] H. N. Özgüven, "A non-linear mathematical model for dynamic analysis of spur gears including shaft and bearing dynamics," Journal of Sound
and Vibration, vol. 145, pp. 239-260, 1991.
[23] L. Walha, T. Fakhfakh, and M. Haddar, "Nonlinear dynamics of a two-stage gear system with mesh stiffness fluctuation, bearing flexibility and backlash," Mechanism and Machine Theory, vol. 44, pp. 1058-1069, 2009.
[24] C. Siyu, T. Jinyuan, L. Caiwang, and W. Qibo, "Nonlinear dynamic characteristics of geared rotor bearing systems with dynamic backlash and friction," Mechanism and Machine Theory, vol. 46, pp. 466-478, 2011.

Bibliography
140
[25] M. A. Sargeant, S. J. Drew, and B. J. Stone, "Coupled torsional and transverse vibration of a back-to-back gearbox rig," Proceedings of the
Institution of Mechanical Engineers, Part K (Journal of Multi-Body
Dynamics), vol. 219, pp. 259-73, 2005.
[26] S. Sassi, B. Badri, and M. Thomas, "A numerical model to predict damaged bearing vibrations," Journal of Vibration and Control, vol. 13, pp. 1603-1628, 2007.
[27] T. Doguer, J. Strackeljan, and P. Tkachuk, "Using a dynamic roller bearing model under varying fault parameters," presented at the The sixth International Conference on Condition Monitoring and Machinery Failure Prevention-CM2009, Dublin, 2009.
[28] C. Mi, A. Masrur, and D. W. Gao, Hybrid electric vehicles : principles
and applications with practical perspectives. Chichester, West Sussex, U.K. ; Hoboken, N.J.: Wiley, 2011.
[29] K. Govindswamy, T. Wellmann, and G. Eisele, "Aspects of NVH integration in hybrid vehicles," in SAE 2009 Noise and Vibration
Conference and Exhibition, NVC 2009, May 19, 2009 - May 19, 2009, St. Charles, IL, United states, 2009.
[30] C. La, M. Poggi, P. Murphy, and O. Zitko, "NVH considerations for zero emissions vehicle driveline design," in SAE 2011 Noise and
Vibration Conference and Exhibition, NVC 2011, May 16, 2011 - May
19, 2011, Rapids, MI, United states, 2011.
[31] Rolls-Royce, "The HSG concept," P. E. S. Bergen, Ed., ed, 2010.
[32] Rolls-Royce, "Hybrid shaft generator propulsion system upgrade," P. E. S. Bergen, Ed., ed, 2010.
[33] P. C. Krause, O. Wasynczuk, and S. D. Sudhoff, Analysis of electric
machinery and drive systems, 2nd ed. New York: IEEE Press, 2002.
[34] R. Krishnan, Electric motor drives : modeling, analysis, and control. Upper Saddle River, N.J.: Prentice Hall, 2001.
[35] C.-M. Ong, Dynamic simulation of electric machinery : using
MATLAB/SIMULINK. Upper Saddle River, N.J.: Prentice Hall PTR, 1998.
[36] Z. Q. Zhu and D. Howe, "Instantaneous magnetic field distribution in brushless permanent magnet dc motors. Part II: Armature-reaction field," IEEE Transactions on Magnetics, vol. 29, pp. 136-142, 1993.

Bibliography
141
[37] Z. Q. Zhu and D. Howe, "Instantaneous magnetic field distribution in permanent magnet brushless dc motors. Part IV: Magnetic field on load," IEEE Transactions on Magnetics, vol. 29, pp. 152-158, 1993.
[38] Z. Q. Zhu and D. Howe, "Instantaneous magnetic field distribution in brushless permanent magnet dc motors. Part III: Effect of stator slotting," IEEE Transactions on Magnetics, vol. 29, pp. 143-151, 1993.
[39] Z. Q. Zhu, D. Howe, E. Bolte, and B. Ackermann, "Instantaneous magnetic field distribution in brushless permanent magnet dc motors. Part I: Open-circuit field," IEEE Transactions on Magnetics, vol. 29, pp. 124-135, 1993.
[40] R. Islam and I. Husain, "Analytical model for predicting noise and vibration in permanent-magnet synchronous motors," IEEE
Transactions on Industry Applications, vol. 46, pp. 2346-2354, 2010.
[41] W. Lei, D. Xianming, L. Jia, W. Kang, and W. Ruixian, "Design and finite element analysis of permanent magnet synchronous motor with novel rotor type," in 2010 Asia-Pacific Power and Energy Engineering
Conference (APPEEC), 2010, pp. 1-4.
[42] M. Cosovic, S. Smaka, I. Salihbegovic, and S. Masic, "Design optimization of 8/14 switched reluctance machine for electric vehicle," in 2012 International Conference on Electrical Machines (ICEM), 2012, pp. 2654-2659.
[43] B. Vaseghi, N. Takorabet, and F. Meibody-Tabar, "Fault analysis and parameter identification of permanent-magnet motors by the finite-element method," IEEE Transactions on Magnetics, vol. 45, pp. 3290 - 3295, 2009.
[44] V. M. Zivotic-Kukolj, W. L. Soong, and N. Ertugrul, "Investigation of iron losses in a high flux interior PM automotive alternator," in Australasian Universities Power Engineering Conference 2004, Brisbane, Australia, 2004.
[45] B. M. Ebrahimi and J. Faiz, "Feature extraction for short-circuit fault detection in permanent-magnet synchronous motors using stator-current monitoring," IEEE Transcations on Industrial Electronics, vol. 25, pp. 2673 - 2682, 2010.
[46] N. Mohan, T. M. Undeland, and W. P. Robbins, Power electronics :
converters, applications, and design, 3rd ed. Hoboken, NJ: John Wiley & Sons, 2003.
[47] P. Vas, Sensorless vector and direct torque control. Oxford ; New York: Oxford University Press, 1998.

Bibliography
142
[48] J. F. Gieras, Permanent magnet motor technology : design and
applications, 3rd ed. Boca Raton: CRC Press, 2010.
[49] P. g. W.-. 1050, "Vector control of pmsg for grid-connected wind turbine applications," Master Theses and Dissertations, Institute of Energy Technology, Aalborg University, Spring 2009.
[50] M. Durr, A. Cruden, S. Gair, and J. R. McDonald, "Dynamic model of a lead acid battery for use in a domestic fuel cell system," Journal of
Power Sources, vol. 161, pp. 1400-1411, 2006.
[51] N. Feki, G. Clerc, and P. Velex, "An integrated electro-mechanical model of motor-gear units-Applications to tooth fault detection by electric measurements," Mechanical Systems and Signal Processing,
vol. 29, pp. 377-390, May 2011.
[52] A. Abass and A. T. Shenton, "Automotive driveline modelling, inverse-simulation and compensation," in UKSim/AMSS 1st International
Conference on Intelligent Systems, Modelling and Simulation, ISMS
2010, January 27, 2010 - January 29, 2010, Liverpool, United kingdom, 2010, pp. 244-249.
[53] M. Cipek, J. Deur, and J. Petric, "Bond graph analysis of power flow in series-parallel hybrid electric vehicle transmissions," in UKACC
International Conference on CONTROL 2010, September 7, 2010 -
September 10, 2010, Coventry, United kingdom, 2010, pp. 217-223.
[54] B. K. Powell, K. E. Bailey, and S. R. Cikanek, "Dynamic modeling and control of hybrid electric vehicle powertrain systems," IEEE Control
Systems Magazine, vol. 18, pp. 17-33, 1998.
[55] A. R. Crowther and N. Zhang, "Torsional finite elements and nonlinear numerical modelling in vehicle powertrain dynamics," Journal of Sound
and Vibration, vol. 284, pp. 825-49, 2005.
[56] M. Todorov, I. Dobrev, and F. Massouh, "Analysis of torsional oscillation of the drive train in horizontal-axis wind turbine," in 2009 8th
International Symposium on Advanced Electromechanical Motion
Systems & Electric Drives Joint Symposium (ELECTROMOTION
2009), 1-3 July 2009, Piscataway, NJ, USA, 2009, p. 7 pp.
[57] Z. Daneshi-Far, H. Henao, and G. A. Capolino, "Planetary gearbox effects on induction machine in wind turbine: Modeling and analysis," in Proceedings - 2012 20th International Conference on Electrical
Machines, ICEM 2012, 2012, pp. 1790-1796.
[58] J. Wojnarowski, J. Kopec, and S. Zawislak, "Gears and graphs [gear modelling]," Journal of Theoretical and Applied Mechanics, vol. 44, pp. 139-62, 2006.

Bibliography
143
[59] P. Velex and M. Maatar, "Mathematical model for analyzing the influence of shape deviations and mounting errors on gear dynamic behaviour," Journal of Sound and Vibration, vol. 191, pp. 629-660, 1996.
[60] T. Eritenel and R. G. Parker, "Three-dimensional nonlinear vibration of gear pairs," Journal of Sound and Vibration, vol. 331, pp. 3628-3648, 2012.
[61] R. Singh, H. Xie, and R. J. Comparin, "Analysis of automotive neutral gear rattle," Journal of Sound and Vibration, vol. 131, pp. 177-96, 1989.
[62] M. Y. Wang, R. Manoj, and W. Zhao, "Gear rattle modelling and analysis for automotive manual transmissions," Proceedings of the
Institution of Mechanical Engineers, Part D: Journal of Automobile
Engineering, vol. 215, pp. 241-258, 2001.
[63] B. E. J., "Simulations of gear-based systems including backlash," Ph.D. theses and dissertations, Lehigh University, 2006.
[64] S. V. Neriya, R. B. Bhat, and T. S. Sankar, "On the dynamic response of a helical geared system subjected to a static transmission error in the form of deterministic and filtered white noise inputs," in Rotating
Machinery Dynamics. Presented at the 1987 ASME Design Technology
Conferences - 11th Biennial Conference on Mechanical Vibration and
Noise., Boston, MA, USA, 1987, pp. 287-296.
[65] L. Hong and J. S. Dhupia, "A time domain approach to diagnose gearbox fault based on measured vibration signals," Journal of Sound
and Vibration, vol. 333, pp. 2164-2180, 2014.
[66] M. Inalpolat and A. Kahraman, "A dynamic model to predict modulation sidebands of a planetary gear set having manufacturing errors," Journal
of Sound and Vibration, vol. 329, pp. 371-393, 2010.
[67] P. Fisette, O. Bruls, and J. Swevers, "Multiphysics modeling of mechatronic multibody systems," in International Conference on Noise
and Vibration Engineering 2006, ISMA 2006, September 18, 2006 -
September 20, 2006, Heverlee, Belgium, 2006, pp. 41-67.
[68] MathWorks Inc., Simulink® : simulation and model-based design :
using Simulink, 6. ed. Natick, MA: MathWorks, 2005.
[69] S. Hauptmann, S. Mulski, M. Kuhn, and L. Mauer, "Advanced drive train modeling in a virtual wind turbine using the multibody simulation code simpack," in European Wind Energy Conference and Exhibition
2007, EWEC 2007, May 7, 2007 - May 10, 2007, Milan, Italy, 2007, pp. 1074-1079.

Bibliography
144
[70] A. Yuejun, W. Hongliang, M. Zhaojun, Z. Wenqiang, and L. Guoming, "Performance analysis of novel magnet arrayed permanent magnet synchronous motor based on ANSOFT," Piscataway, NJ, USA, 2010, pp. 715-18.
[71] D. Liu, H. Chen, R. Jiang, and W. Liu, "Study of driving performance of semi-active suspension based on hybrid control strategy," in 2010 2nd
WRI Global Congress on Intelligent Systems, GCIS 2010, December 16,
2010 - December 17, 2010, Wuhan, China, 2010, pp. 43-46.
[72] Y. Yasa, Y. Sozer, and E. Mese, "Unbalanced fault analysis of doubly fed induction generator drive system for wind turbine applications," in Applied Power Electronics Conference and Exposition (APEC), 2013
Twenty-Eighth Annual IEEE, 2013, pp. 2953-2960.
[73] O. Haedrich and U. Knorr, "Electric circuit and control system simulation by linking simplorer and Matlab/Simulink - analysis of interactions of subsystems of modern electric drives," in 7th Workshop
on Computers in Power Electronics, July 16, 2000 - July 18, 2000, Blacksburg, VA, USA, 2000, pp. 192-196.
[74] H. M. Paynter, Analysis and design of engineering systems. Cambridge, Mass.,: M. I. T. Press, 1961.
[75] D. Karnopp and R. C. Rosenberg, Analysis and simulation of multiport
systems; the bond graph approach to physical system dynamics. Cambridge, Mass.,: M.I.T. Press, 1968.
[76] D. Karnopp and R. C. Rosenberg, System dynamics : a unified
approach. New York: Wiley, 1975.
[77] D. Karnopp, D. L. Margolis, and R. C. Rosenberg, System dynamics : a
unified approach, 2nd ed. New York: Wiley, 1990.
[78] J. U. Thoma, Introduction to bond graphs and their applications, 1st ed. Oxford ; New York: 1975., 1975.
[79] T. Bakka and H. R. Karimi, "Wind turbine modeling using the bond graph," in Computer-Aided Control System Design (CACSD), 2011
IEEE International Symposium on, 2011, pp. 1208-1213.
[80] M. Ronkowski, "Modelling of electrical machines using the Modelica Bond-Graph Library," in Power Electronics and Motion Control
Conference, 2008. EPE-PEMC 2008. 13th, 2008, pp. 880-886.
[81] L. I. Silva, P. M. de la Barrera, C. H. De Angelo, G. R. Bossio, and G. O. Garcia, "Multi-domain modeling of electric traction drives using Bond Graphs: Application to fault diagnosis," in Industrial Electronics,

Bibliography
145
2009. IECON '09. 35th Annual Conference of IEEE, 2009, pp. 3455-3460.
[82] B. Umesh Rai and L. Umanand, "Bond graph toolbox for handling complex variable," Control Theory & Applications, IET, vol. 3, pp. 551-560, 2009.
[83] S. He, R. Gunda, and R. Singh, "Effect of sliding friction on the dynamics of spur gear pair with realistic time-varying stiffness," Journal
of Sound and Vibration, vol. 301, pp. 927-949, 2007.
[84] H.-H. Lin, R. L. Huston, and J. J. Coy, "On Dynamic Loads in Parallel Shaft Transmissions: I - Modeling and Analysis," 1987.
[85] M. T. Khabou, N. Bouchaala, F. Chaari, T. Fakhfakh, and M. Haddar, "Study of a spur gear dynamic behavior in transient regime," Mechanical Systems and Signal Processing, vol. 25, pp. 3089-101, 2011.
[86] P. J. Tavner, Condition monitoring of rotating electrical machines. London, U.K.: Institution of Engineering and Technology, 2008.
[87] P. D. Samuel and D. J. Pines, "A review of vibration-based techniques for helicopter transmission diagnostics," Journal of Sound and
Vibration, vol. 282, pp. 475-508, 2005.
[88] R. B. Randall, "New method of modeling gear faults," American Society
of Mechanical Engineers, 1981.
[89] M. J. Zuo and F. Xianfeng, "Gearbox fault detection using Hilbert and wavelet packet transform," Mechanical Systems and Signal Processing,
vol. 20, pp. 966-82, 2006.
[90] D. He, L. Ruoyu, and E. Bechhoefer, "Split torque type gearbox fault detection using acoustic emission and vibration sensors," in 2010
International Conference on Networking, Sensing and Control (ICNSC
2010), 10-12 April 2010, Piscataway, NJ, USA, 2010, pp. 62-6.
[91] P. T. Monsen, E. S. Manolakos, and M. Dzwonczyk, "Helicopter gearbox fault detection and diagnosis using analog neural networks," in Proceedings of 27th Asilomar Conference on Signals, Systems and
Computers, 1-3 Nov. 1993, Los Alamitos, CA, USA, 1993, pp. 381-5.
[92] W. Wang, "Early detection of gear tooth cracking using the resonance demodulation technique," Mechanical Systems and Signal Processing,
vol. 15, pp. 887-903, 2001.

Bibliography
146
[93] F. K. Choy, S. Huang, J. J. Zakrajsek, R. F. Handschuh, and D. P. Townsend, "Vibration signature analysis of a faulted gear transmission system," Journal of Propulsion and Power, vol. 12, pp. 289-295, 1996.
[94] J. R. Stack, R. G. Harley, and T. G. Habetler, "An amplitude Modulation detector for fault diagnosis in rolling element bearings," IEEE
Transcations on Industrial Electronics, vol. 51, pp. 1097-1102, 2004.
[95] J. R. Stack, T. G. Habetler, and R. G. Harley, "Fault-signature modeling and detection of inner-race bearing faults," IEEE Transactions on
Industry Applications, vol. 42, pp. 61-68, 2006.
[96] B. M. Ebrahimi, J. Faiz, and M. J. Roshtkhari, "Static-, dynamic-, and mixed-eccentricity fault diagnoses in permanent-magnet synchronous motors," IEEE Transcations on Industrial Electronics, pp. 4727 - 4739, 2009.
[97] A. Djerdir, J.-A. Farooq, A. Rezig, and A. Miraoui, "Faults in permanent magnet traction motors: state of the art and modelling approaches," presented at the 2010 IEEE Power & Energy Society General Meeting, 2010.
[98] J. J. Sinou and A. W. Lees, "The influence of cracks in rotating shafts," Journal of Sound and Vibration, vol. 285, pp. 1015-37, 2005.
[99] B. Wagner, "Rotating Equipment Defect Detection Using the Algorithm of Mode Isolation," Ph.D. , School of Mechanical Engineering, Georgia Institute of Technology, 2007.
[100] M. S. Yilmaz and E. Ayaz, "Adaptive neuro-fuzzy inference system for bearing fault detection in induction motors using temperature, current, vibration data," in IEEE EUROCON 2009, 18-23 May 2009, Piscataway, NJ, USA, 2009, pp. 1140-5.
[101] A. D. Nembhard, J. K. Sinha, A. J. Pinkerton, and K. Elbhbah, "Fault diagnosis of rotating machines using vibration and bearing temperature measurements," Diagnostyka, vol. 14, pp. 45-51, 2013.
[102] J. C. Banks, M. Lebold, and K. Reichard, "Fault localization for gear tooth failure in coupled mechanical systems," in 2003 IEEE Aerospace
Conference, March 8, 2003 - March 15, 2003, Big Sky, MT, United states, 2003, pp. 3295-3304.
[103] B. M. Ebrahimi, J. Faiz, and M. J. Roshtkhari, "Static-, dynamic-, and mixed-eccentricity fault diagnoses in permanent-magnet synchronous motors," IEEE TRANSACTIONS ON INDUSTRIAL ELECTRONICS, pp. 4727 - 4739, 2009.

Bibliography
147
[104] B. Yazici, G. B. Kliman, W. J. Premerlani, R. A. Koegl, G. B. Robinson, and A. Abdel-Malek, "Adaptive, on-line, statistical method for bearing fault detection using stator current," in Proceedings of the 1997 IEEE
Industry Applications Conference 32nd IAS Annual Meeting. Part 3 (of
3), October 5, 1997 - October 9, 1997, New Orleans, LA, USA, 1997, pp. 213-220.
[105] H. Liu and J. S. Dhupia, "A time-domain fault detection method based on an electrical machine stator current measurement for planetary gear-sets," in 2013 IEEE/ASME International Conference on Advanced
Intelligent Mechatronics (AIM), 9-12 July 2013, Piscataway, NJ, USA, 2013, pp. 1631-6.
[106] T. G. Habetler, "Current-Based Motor Condition Monitoring: Complete Protection of Induction and PM Machines," presented at the IEEE, 2007.
[107] J. Rosero, A. G. Espinosa, J. Cusido, J. A. Ortega, and L. Romeral, "Simulation and fault detection of short circuit winding in a Permanent Magnet Synchronous Machine (PMSM) by means of fourier and wavelet transform," presented at the IEEE International Instrumentation and Measurement Technology Conference, Victoria, Vancouver Island, Canada, 2008.
[108] L. Romeral, J. A. Rosero, A. G. Espinosa, J. Cusido, and J. A. Ortega, "Electrical Monitoring for Fault Detection in an EMA," IEEE Aerospace
and Electronic Systems Magazine, pp. 4 - 9, MARCH 2010.
[109] C. Dae-Woong, S. Seung-Ki, and L. Dong-Choon, "Analysis and compensation of current measurement error in vector controlled AC motor drives," in Industry Applications Conference, 1996. Thirty-First
IAS Annual Meeting, IAS '96., Conference Record of the 1996 IEEE, 1996, pp. 388-393 vol.1.
[110] S. Diao, Z. Makni, J. F. Bisson, D. Diallo, and C. Marchand, "Sensor fault diagnosis for improving the availability of electrical drives," in IECON 2013 - 39th Annual Conference of the IEEE Industrial
Electronics Society (IECON 2013), 10-13 Nov. 2013, Piscataway, NJ, USA, 2013, pp. 3108-13.
[111] T. G. Habetler, "Current-based condition monitoring of electrical machines in safety critical applications," presented at the 13th International Power Electronics and Motion Control Conference, 2008.
[112] W. le Roux, R. G. Harley, and T. G. Habetler, "Detecting rotor faults in low power permanent magnet synchronous machines," IEEE
Transcations on Industrial Electronics, vol. 22, pp. 322-8, 2007.
[113] J. A. Farooq, A. Djerdir, and A. Miraoui, "Identification of demagnetization faults in a permanent magnet synchronous machine by

Bibliography
148
permeance network," COMPEL - The International Journal for
Computation and Mathematics in Electrical and Electronic
Engineering, vol. 28, pp. 1619-1631, 2009.
[114] B. Yu and A. H. C. Van Paassen, "Simulink and bond graph modeling of an air-conditioned room," Simulation Modelling Practice and Theory,
vol. 12, pp. 61-76, 2004.
[115] E. M. Alawadhi, Finite element simulations using ANSYS. Boca Raton: CRC Press, 2010.
[116] M. Barthod, B. Hayne, J. L. Tebec, and J. C. Pin, "Experimental study of dynamic and noise produced by a gearing excited by a multi-harmonic excitation," Applied Acoustics, vol. 68, pp. 982-1002, 2007.
[117] A. J. Mitcham and J. J. A. Cullen, "Permanent magnet generator options for the More Electric Aircraft," in Power Electronics, Machines and
Drives, 2002. International Conference on (Conf. Publ. No. 487), 2002, pp. 241-245.
[118] M. Comanescu, A. Keyhani, and D. Min, "Design and analysis of 42-V permanent-magnet generator for automotive applications," Energy
Conversion, IEEE Transactions on, vol. 18, pp. 107-112, 2003.
[119] F. Chaari, W. Baccar, M. S. Abbes, and M. Haddar, "Effect of spalling or tooth breakage on gearmesh stiffness and dynamic response of a one-stage spur gear transmission," European Journal of Mechanics / A
Solids, vol. 27, pp. 691-705, 2008.
[120] J. Zhang, J. S. Dhupia, and C. J. Gajanayake, "Gear Rattle under Influence of Bearings, Lubricant Churning and Gear Tooth Sliding Friction within a Geared Mechanism," in in 2014 International
Symposium on Flexible Automation (ISFA2014), Awaji-Island, Hyogo, Japan, 2014.
[121] E. Rocca and R. Russo, "Theoretical and experimental investigation into the influence of the periodic backlash fluctuations on the gear rattle," Journal of Sound and Vibration, vol. 330, pp. 4738-4752, 2011.
[122] L. Hong, J. S. Dhupia, and S. Sheng, "An explanation of frequency features enabling detection of faults in equally-spaced planetary gearbox," Mechanism and Machine Theory, vol. 73, pp. 169-183, 2014.
[123] M. Esmaeli and A. Subramaniam, "Engine Timing Geartrain Concepts and Proposals for Gear Rattle Noise Reduction in Commercial Vehicles," Master of Science, Department of Product and Production Development, Division of Product Development, Chalmers University of Technology, Göteborg, Sweden, 2011.

Bibliography
149
[124] J. R. Ottewill, S. A. Neild, and R. E. Wilson, "An investigation into the effect of tooth profile errors on gear rattle," Journal of Sound and
Vibration, vol. 329, pp. 3495-3506, 2010.
[125] S. Ohnuma, S. Yahata, M. Inagawa, and T. Fujimoto, "Research on idling rattle of manual transmission," in Surface Vehicle Noise and
Vibration Conference, May 15, 1985 - May 17, 1985, Traverse City, MI, United states, 1985.
[126] H. Moradi and H. Salarieh, "Analysis of nonlinear oscillations in spur gear pairs with approximated modelling of backlash nonlinearity," Mechanism and Machine Theory, vol. 51, pp. 14-31, 2012.
[127] G. Bonori and F. Pellicano, "Non-smooth dynamics of spur gears with manufacturing errors," Journal of Sound and Vibration, vol. 306, pp. 271-83, 2007.
[128] M. Barthod, B. Hayne, and J. L. Tebec, "Auditory perception of noise known as "rattle" in gearboxes," Acta Acustica United With Acustica,
vol. 91, pp. 180-91, 2005.
[129] R. Singh, "Gear noise: Anatomy, prediction and solutions," in 38th
International Congress and Exposition on Noise Control Engineering
2009, INTER-NOISE 2009, August 23, 2009 - August 26, 2009, Ottawa, ON, Canada, 2009, pp. 3691-3720.
[130] Y. Kadmiri, E. Rigaud, J. Perret-Liaudet, and L. Vary, "Experimental and numerical analysis of automotive gearbox rattle noise," Journal of
Sound and Vibration, vol. 331, pp. 3144-3157, 2012.
[131] J. L. Dion, S. Le Moyne, G. Chevallier, and H. Sebbah, "Gear impacts and idle gear noise: experimental study and non-linear dynamic model," Mechanical Systems and Signal Processing, vol. 23, pp. 2608-28, 2009.
[132] "Calculation of load capacity of spur and helical gears," Standard ISO 6336-1, 2007.
[133] I. P. Girsang, J. S. Dhupia, E. Muljadi, M. Singh, and L. Y. Pao, "Gearbox and drivetrain models to study dynamic effects of modern wind turbines," in 2013 IEEE Energy Conversion Congress and
Exposition (ECCE), 15-19 Sept. 2013, Piscataway, NJ, USA, 2013, pp. 874-81.
[134] P. Eschmann, L. Hasbargen, Weigand, J. Brändlein, and FAG Kugelfischer Georg Schäfer KGaA., Ball and roller bearings : theory,
design, and application, 2nd ed. München; Chichester; New York: R. Oldenbourg; Wiley, 1985.
[135] G. SKF, "SKF general catalogue," ed, 2003.

Bibliography
150
[136] S. Iqbal, F. Al-Bender, J. Croes, B. Pluymers, and W. Desmet, "Frictional power loss in solid-grease-lubricated needle roller bearing," Lubrication Science, vol. 25, pp. 351-367, 2013.
[137] C. Changenet and P. Velex, "A model for the prediction of churning losses in geared Transmissions-preliminary results," Transactions of the
ASME. Journal of Mechanical Design, vol. 129, pp. 128-33, 2007.
[138] C. Changenet, X. Oviedo-Marlot, and P. Velex, "Power loss predictions in geared transmissions using thermal networks-applications to a six-speed manual gearbox," Transactions of the ASME. Journal of
Mechanical Design, vol. 128, pp. 618-25, 2006.
[139] R. L. Seaman, C. E. Johnson, and R. F. Hamilton, "Component inertial effects on transmission design," in Truck and Bus Meeting and
Exposition, December 3, 1984 - December 6, 1984, Dearborn, MI, United states, 1984.
[140] P. Velex, "On the modelling of spur and helical gear dynamic behaviour," Mechanical Engineering, pp. 75-106, 2012.
[141] I. P. Girsang, J. S. Dhupia, E. Muljadi, M. Singh, and J. Jonkman, "Modeling and control to mitigate resonant load in variable-speed wind turbine drivetrain," IEEE Journal of Emerging and Selected Topics in
Power Electronics, vol. 1, pp. 277-286, 2013.
[142] I. P. Girsang, J. S. Dhupia, E. Muljadi, M. Singh, and L. Y. Pao, "Gearbox and drivetrain models to study dynamic effects of modern wind turbines," in Energy Conversion Congress and Exposition (ECCE),
2013 IEEE, 2013, pp. 874-881.
[143] R. B. Randall, "A New Method of Modeling Gear Faults," Journal of
Mechanical Design, vol. 104, pp. 259-267, 1982.
[144] M. Rgeai, F. Gu, A. Ball, M. Elhaj, and M. Ghretli, "Gearbox fault detection using spectrum analysis of the drive motor current signal," in Proceedings of the 4th World Congress on Engineering Asset
Management, Athen, Greece, 2009, pp. 758-769.
[145] M. Haram, T. Wang, F. Gu, and A. D. Ball, "Electrical motor current signal analysis using a modulation signal bispectrum for the fault diagnosis of a gearbox downstream," Journal of Physics: Conference
Series, vol. 364, 2012.
[146] I. X. Bogiatzidis, A. N. Safacas, and E. D. Mitronikas, "Detection of backlash phenomena appearing in a single cement kiln drive using the current and the electromagnetic torque signature," IEEE Transcations on
Industrial Electronics, vol. 60, pp. 3441-3453, 2013.

Bibliography
151
[147] S. Rajagopalan, T. G. Habetler, R. G. Harley, T. Sebastian, and B. Lequesne, "Current/voltage-based detection of faults in gears coupled to electric motors," IEEE Transcations on Industrial Applications, vol. 42, pp. 1412-20, 2006.
[148] C. Kar and A. R. Mohanty, "Monitoring gear vibrations through motor current signature analysis and wavelet transform," Mechanical Systems
and Signal Processing, vol. 20, pp. 158-187, 2006.
[149] J. Zhang, L. Hong, and J. S. Dhupia, "Gear fault detection in planetary gearbox using stator current measurement of ac motors," ASME 2012
5th Annual Dynamic Systems and Control Conference Joint with the
JSME 2012 11th Motion and Vibration Conference, DSCC 2012-
MOVIC 2012, vol. 1, pp. 673-680, 2012.
[150] Z. Jidong, J. S. Dhupia, and C. J. Gajanayake, "Model based current analysis of electrical machines to detect faults in planetary gearboxes," in 2014 IEEE/ASME International Conference on Advanced Intelligent
Mechatronics (AIM), 8-11 July 2014, Piscataway, NJ, USA, 2014, pp. 1616-21.
[151] Q. Hao, L. Gao, X. Wang, and H. Ye, "Application study on resonance demodulation technique in fault diagnosis of gear box," in International
Conference on Engineering Design and Optimization, ICEDO 2010,
October 28, 2010 - October 30, 2010, Ningbo, China, 2010, pp. 198-202.
[152] A. Ghasemlooniaa and S. E. Z. Khadem, "Gear tooth failure detection by the resonance demodulation technique and the instantaneous power spectrum method: A comparative study," Shock and Vibration, vol. 18, pp. 503-23, 2011.
[153] D. W. Novotny and T. A. Lipo, Vector control and dynamics of AC
drives. Oxford, New York: Clarendon Press; Oxford University Press, 1996.

List of Publications
152
List of Publications
1. J. Zhang, J. S. Dhupia, and C. J. Gajanayake, "Model Based Current
Analysis of Electrical Machines to Detect Faults in Planetary Gearboxes,"
Proceedings of AIM 2014, IEEE/ASME International Conference on Advanced
Intelligent Mechatronics, 2014.
2. J. Zhang, J. S. Dhupia, and C. J. Gajanayake, "Gear Rattle under
Influence of Bearings, Lubricant Churning and Gear Tooth Sliding Friction
within a Geared Mechanism," Proceedings of ISCIE/ASME 2014 International
Symposium on Flexible Automation, 2014.
3. J. Zhang, J. S. Dhupia, and C. J. Gajanayake, "Stator Current Analysis
from Electrical Machines Using Resonance Demodulation Technique to Detect
Faults in Planetary Gearboxes ", IEEE Transactions on Industrial Electronics,
accepted, 2015.
4. J. Zhang, J. S. Dhupia, L. Hong, and C. J. Gajanayake, "Evaluating the
Effects of Gearbox Parameters on the Gear Rattle Noise," International Journal
of Automotive Technology, to be submitted soon, 2015.
5. J. Zhang, L. Hong, and J. S. Dhupia, "Gear fault detection in planetary
gearbox using stator current measurement of ac motors," ASME 2012 5th
Annual Dynamic Systems and Control Conference Joint with the JSME 2012
11th Motion and Vibration Conference, vol. 1, pp. 673-680, 2012.
Top Related