


Languages
Pages
Legal

Chapter 5
Mode II Delamination Of
Interlayered Composites
In this part of the study the same methodology was followed as was used for the mode
I DCB testing. Optical and SEM micrographs were used to explain observed fracture
behaviour and fracture toughness trends, and the test results were further supported
by developing FEA models of the mode II delamination process. Also, some specimens
were pre-cracked under fatigue mode I loading to assess the influence of pre-cracking
on mode II fracture toughness of these materials.
5.1 Initial experimental study
5.1.1 Materials, specimen preparation and testing procedures
Test specimens for this part of the study were produced from the same materials as
in the mode I study. The standard ENF specimen geometry was used for the test
specimens and the test procedure from Chapter 3 was followed to obtain the initiation
and maximum mode II fracture toughness values.
119
MODE II DELAMINATION OF INTERLAYERED COMPOSITES 120
5.1.2 Results and discussion
Mode II ENF testing
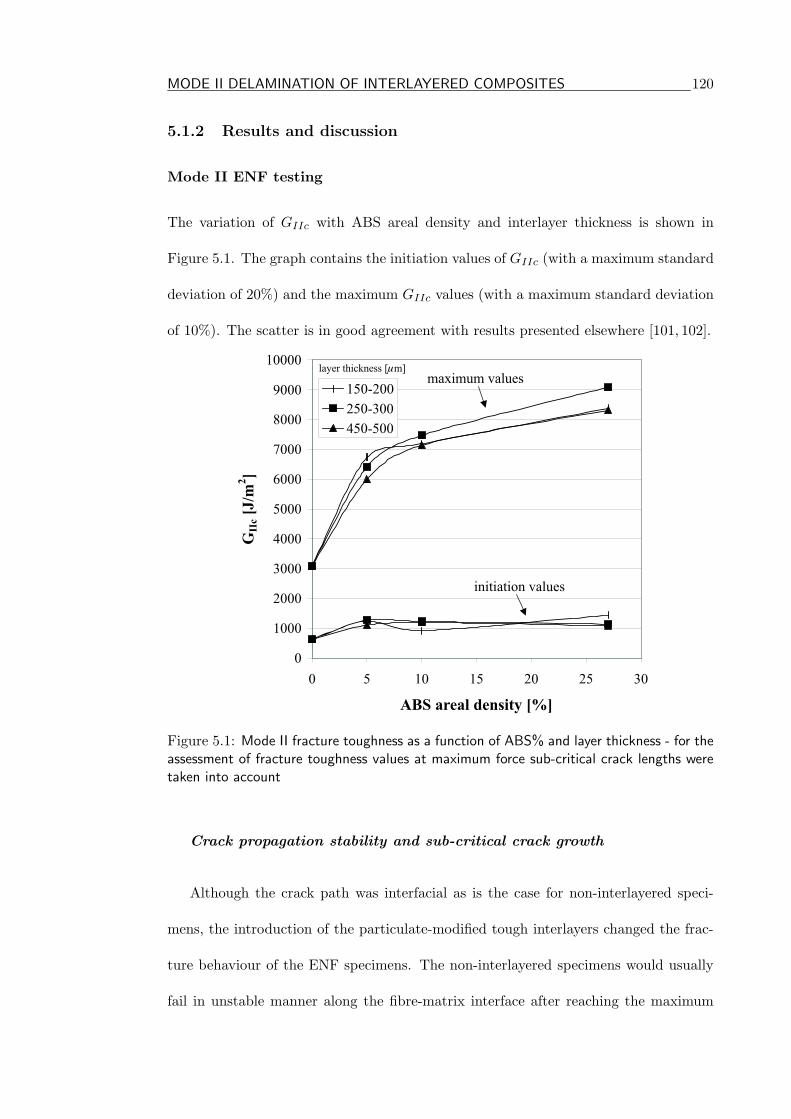
The variation of GIIc with ABS areal density and interlayer thickness is shown in
Figure 5.1. The graph contains the initiation values of GIIc (with a maximum standard
deviation of 20%) and the maximum GIIc values (with a maximum standard deviation
of 10%). The scatter is in good agreement with results presented elsewhere [101, 102].
0
1000
2000
3000
4000
5000
6000
7000
8000
9000
10000
0 5 10 15 20 25 30
ABS areal density [%]
GII
c[J
/m2]
150-200
250-300
450-500
initiation values
maximum valueslayer thickness [�m]
Figure 5.1: Mode II fracture toughness as a function of ABS% and layer thickness - for theassessment of fracture toughness values at maximum force sub-critical crack lengths weretaken into account
Crack propagation stability and sub-critical crack growth
Although the crack path was interfacial as is the case for non-interlayered speci-
mens, the introduction of the particulate-modified tough interlayers changed the frac-
ture behaviour of the ENF specimens. The non-interlayered specimens would usually
fail in unstable manner along the fibre-matrix interface after reaching the maximum
MODE II DELAMINATION OF INTERLAYERED COMPOSITES 121
sustainable loading during the test . However, all interlayered specimens failed in a
stable manner, along the interlayer-fibre interface, with stable crack propagation ob-
served before the recorded load reached the maximum value. This can be defined as
sub-critical crack growth, since after the maximum load point is reached unstable crack
growth occurs. This unstable crack propagates until it reaches the region under the
loading-nose, where a strong compressive zone arrests the crack. Measurement of the
sub-critical crack length showed that the specimens with the interlayers that contained
10% and 5% of ABS only allowed crack propagation of around 3mm, while the 27%
ABS interlayer allowed the crack to grow 6mm in length. In addition, sub-critical crack
length was not dependent on interlayer thickness. The measurements of the sub-critical
crack lengths were taken into account when the GmaxIIc values were calculated, while the
initiation values were calculated by using the initial crack length (ao=25mm).
Optical and scanning electron microscopy
The initiation fracture toughness, GiniIIc, results, beside being totally independent of
the interlayer thickness, remained uninfluenced by the particle concentration. Reaching
an initial increase of approximately 100% for the 5% ABS interlayers, compared with
the non-interlayered material, fracture toughness remained at the level of 1200J/m2
for all particle concentrations. This initial fracture toughness increase was possibly a
consequence of the chemical modification due to the butadiene dissolution.
The fracture toughness initiation results in Figure 5.1 suggest the complete absence
of any interlayer thickness influence (i.e. the constraint effect), proving that the thinnest
interlayer of 150µm was sufficient to allow full development of the mode II damage zone.
Additional evidence for this statement can be found in Figures 5.2(a) and (b). Here, it is
important to note that all optical micrographs were obtained from polished specimens
MODE II DELAMINATION OF INTERLAYERED COMPOSITES 122
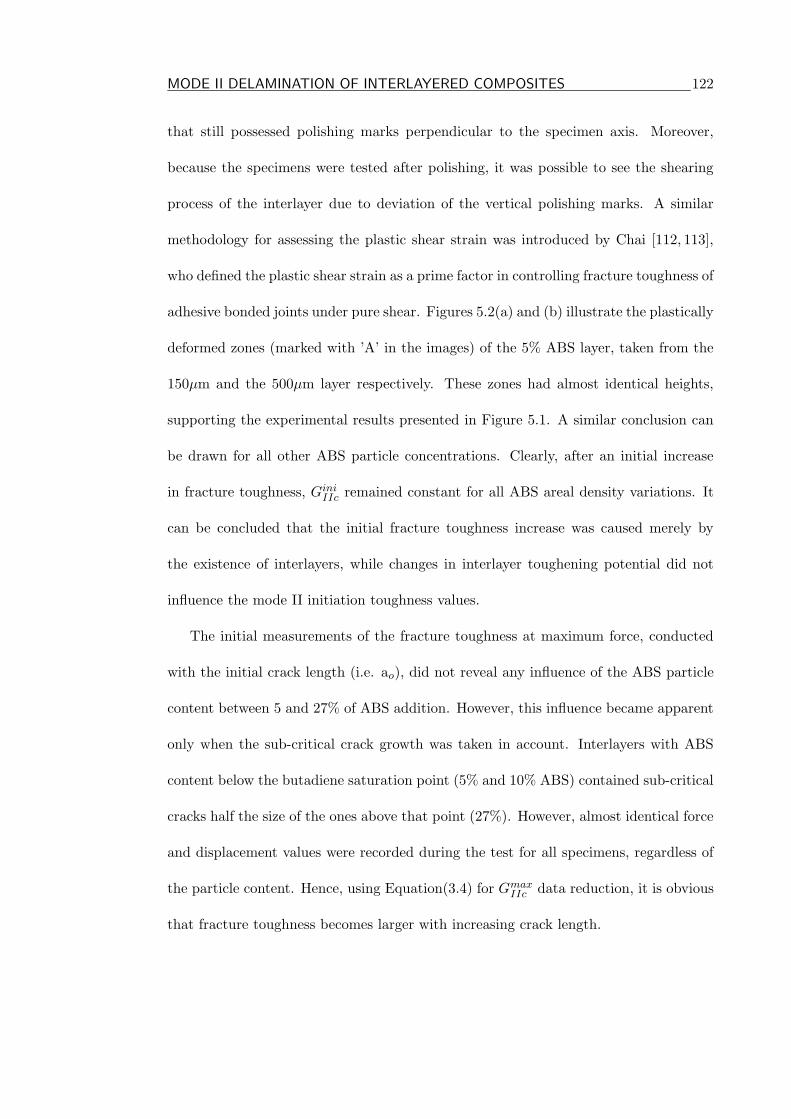
that still possessed polishing marks perpendicular to the specimen axis. Moreover,
because the specimens were tested after polishing, it was possible to see the shearing
process of the interlayer due to deviation of the vertical polishing marks. A similar
methodology for assessing the plastic shear strain was introduced by Chai [112, 113],
who defined the plastic shear strain as a prime factor in controlling fracture toughness of
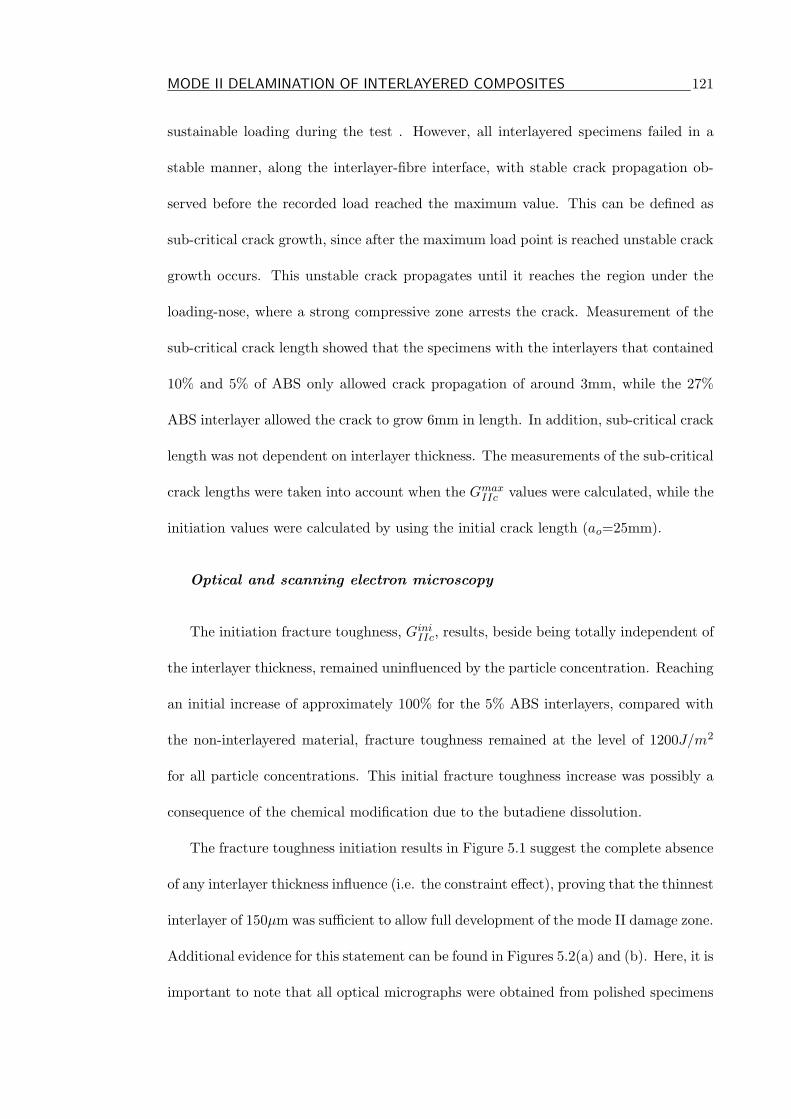
adhesive bonded joints under pure shear. Figures 5.2(a) and (b) illustrate the plastically
deformed zones (marked with ’A’ in the images) of the 5% ABS layer, taken from the
150µm and the 500µm layer respectively. These zones had almost identical heights,
supporting the experimental results presented in Figure 5.1. A similar conclusion can
be drawn for all other ABS particle concentrations. Clearly, after an initial increase
in fracture toughness, GiniIIc remained constant for all ABS areal density variations. It
can be concluded that the initial fracture toughness increase was caused merely by
the existence of interlayers, while changes in interlayer toughening potential did not
influence the mode II initiation toughness values.
The initial measurements of the fracture toughness at maximum force, conducted
with the initial crack length (i.e. ao), did not reveal any influence of the ABS particle
content between 5 and 27% of ABS addition. However, this influence became apparent
only when the sub-critical crack growth was taken in account. Interlayers with ABS
content below the butadiene saturation point (5% and 10% ABS) contained sub-critical
cracks half the size of the ones above that point (27%). However, almost identical force
and displacement values were recorded during the test for all specimens, regardless of
the particle content. Hence, using Equation(3.4) for GmaxIIc data reduction, it is obvious
that fracture toughness becomes larger with increasing crack length.
MODE II DELAMINATION OF INTERLAYERED COMPOSITES 123
B
A
(a)
A
B
C
D
(b)
Figure 5.2: Optical micrographs of the mode II crack path: (a) 5% ABS, 150µm deformedlayer (A) visible as a dark gray zone underneath the interfacial crack (B) (black zone); (b)5% ABS 500µm deformed layer - the height of the dark gray zone (A) (plastic deformation)is the same as within the 150µm layer, while some deformation is visible around the particles(C). A larger part of the interlayer remained without visible deformation (D)
MODE II DELAMINATION OF INTERLAYERED COMPOSITES 124
A
BA
E
(a)
B
A
E
(b)
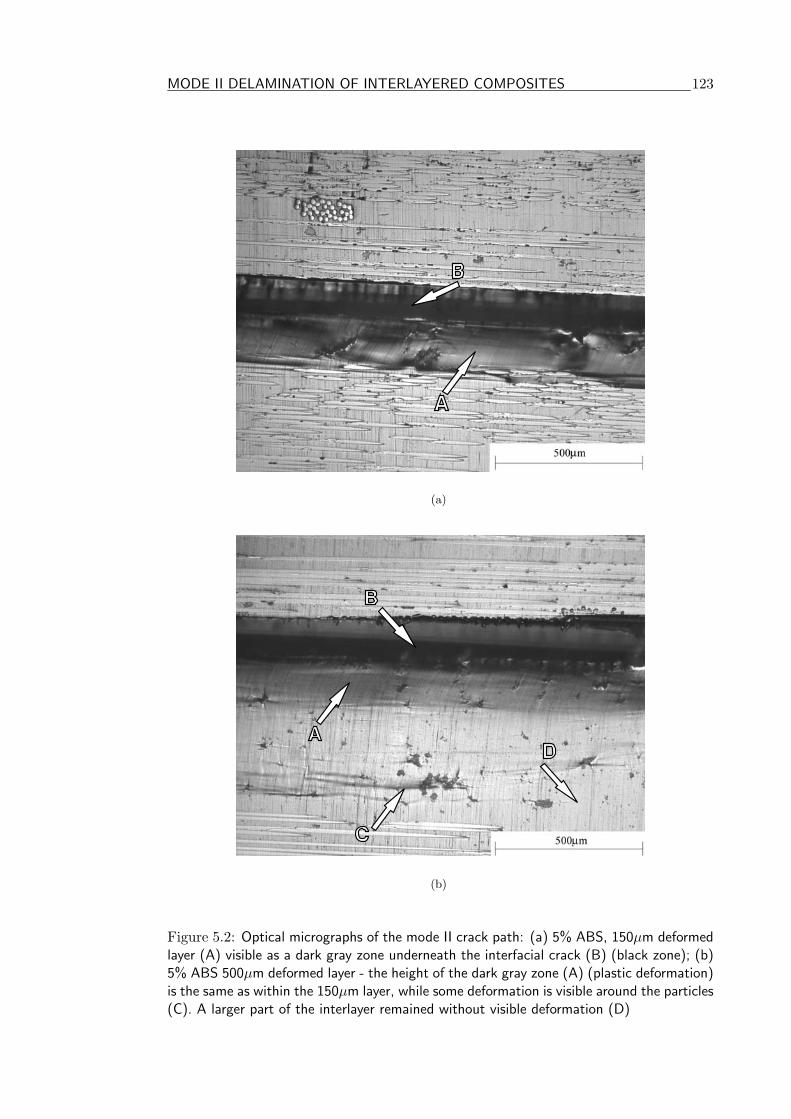
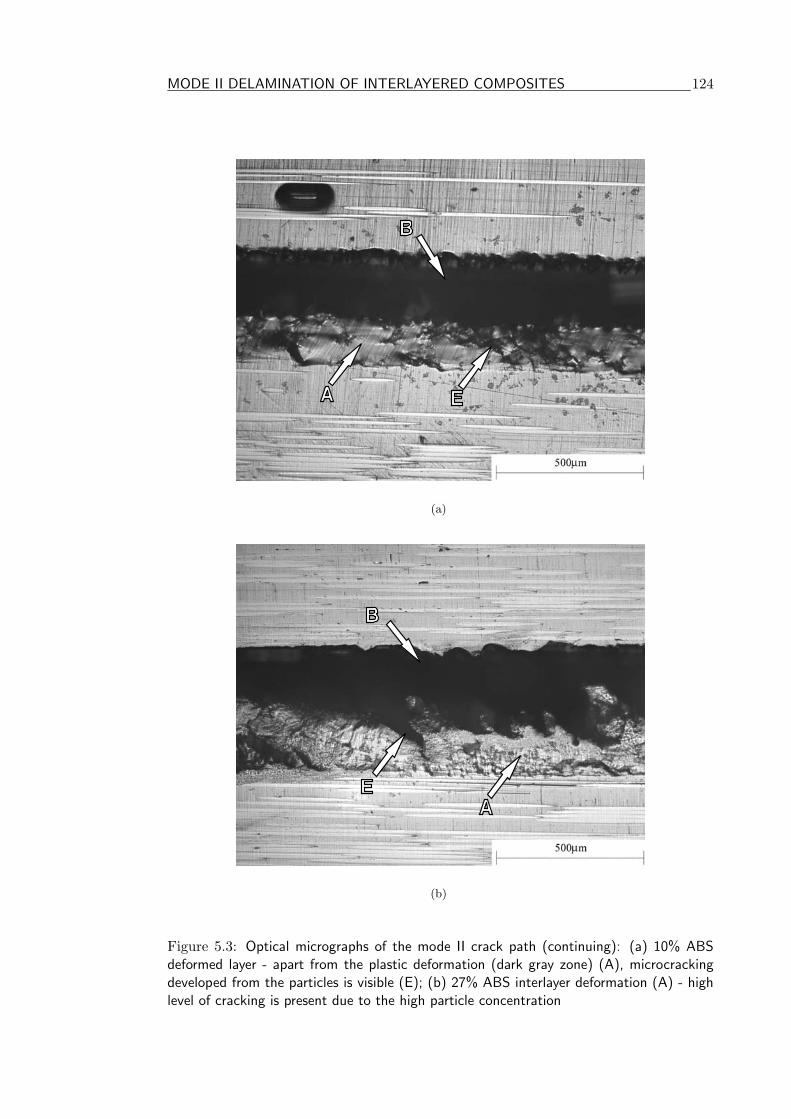
Figure 5.3: Optical micrographs of the mode II crack path (continuing): (a) 10% ABSdeformed layer - apart from the plastic deformation (dark gray zone) (A), microcrackingdeveloped from the particles is visible (E); (b) 27% ABS interlayer deformation (A) - highlevel of cracking is present due to the high particle concentration
MODE II DELAMINATION OF INTERLAYERED COMPOSITES 125
One of the possible reasons for the difference observed in the crack length could
be influence of the increased ABS particle presence in the interlayers after the bu-
tadiene saturation. This possibly produced overall more compliant interlayers, since
the particles can generate stress concentrations around them and in regions with high
particle concentrations this can produce zones which are favorable for crack devel-
opment. Some support for this can be found in Figures 5.2 and 5.3. Figure 5.2(b)
shows shaded deformation zones (marked with a ’C’) connecting particles in the inter-
layer while the remainder (remote from the zone of the interfacial crack propagation,
marked with a ’D’) is without permanent deformation. Although deformation bands
exist occasionally between the particles, no internal micro cracking is observed in this
interlayer. However, in the zone along the interlayer-fiber interface the main crack (B)
was formed due to the coalescence of the interfacial oblique micro-cracks (hackles) in
front of the crack tip [56, 113]. The 10% ABS interlayer is shown in Figure 5.3(a),
where increased deformation of the interlayer (A) below the main shear crack (B) is
visible. The shear deformation bands between the particles exist in a larger number,
causing some micro-cracking at several sites (E). The main crack formation was no
different from the previously explained hackle coalescence. Finally, Figure 5.3(b) rep-
resents a crack propagation through a 27% ABS interlayer. The interlayer deformation
is extremely high (A), making individual particles hardly visible. The microcracking
(E) of the interlayer is even more developed, almost to the level of complete interlayer
disintegration.
Clearly, by increasing particle content internal microcracking of interlayers became
more apparent. This could cause the prolonged sub-critical crack growth in the 27%
ABS interlayers, whilst maintaining the stable main crack growth by absorbing a con-
siderable amount of accumulated fracture energy. Further support for this can be found
MODE II DELAMINATION OF INTERLAYERED COMPOSITES 126
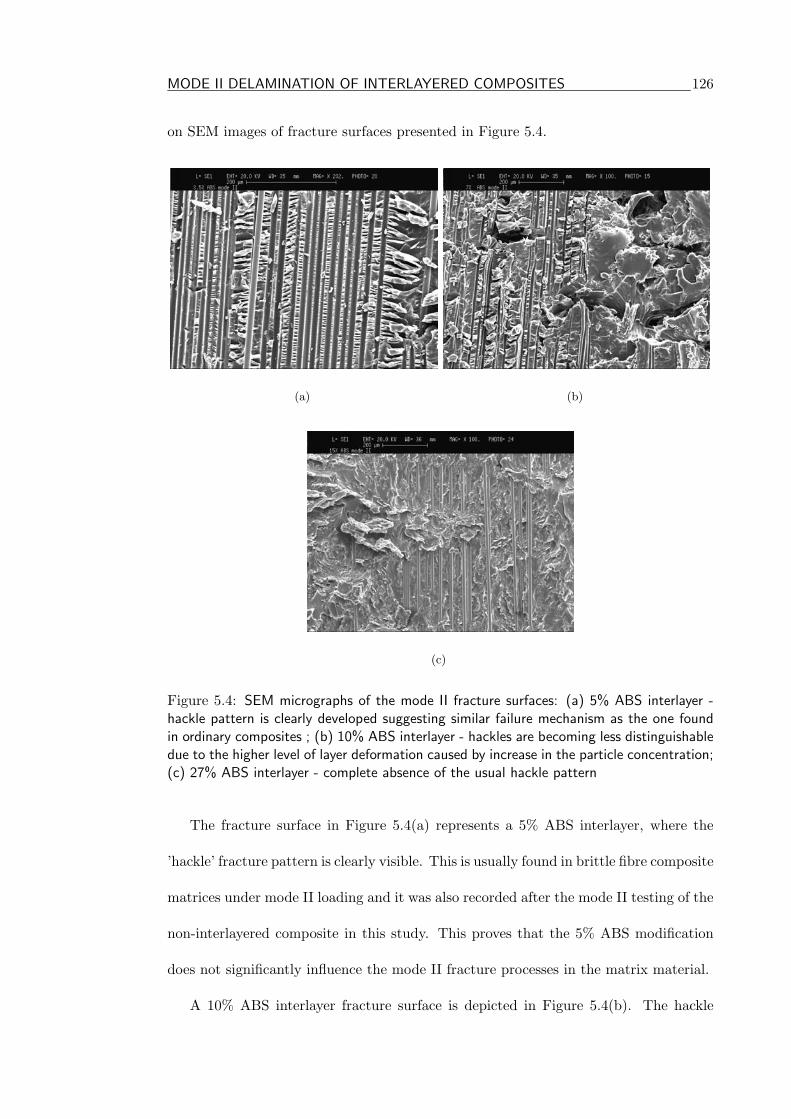
on SEM images of fracture surfaces presented in Figure 5.4.
(a) (b)
(c)
Figure 5.4: SEM micrographs of the mode II fracture surfaces: (a) 5% ABS interlayer -hackle pattern is clearly developed suggesting similar failure mechanism as the one foundin ordinary composites ; (b) 10% ABS interlayer - hackles are becoming less distinguishabledue to the higher level of layer deformation caused by increase in the particle concentration;(c) 27% ABS interlayer - complete absence of the usual hackle pattern
The fracture surface in Figure 5.4(a) represents a 5% ABS interlayer, where the
’hackle’ fracture pattern is clearly visible. This is usually found in brittle fibre composite
matrices under mode II loading and it was also recorded after the mode II testing of the
non-interlayered composite in this study. This proves that the 5% ABS modification
does not significantly influence the mode II fracture processes in the matrix material.
A 10% ABS interlayer fracture surface is depicted in Figure 5.4(b). The hackle
MODE II DELAMINATION OF INTERLAYERED COMPOSITES 127
formation was still visible but significantly less distinguished, even overgrowing occa-
sionally to a non-hackle fracture pattern, visible in the right-hand side of the image.
The latter was possibly a consequence of a higher degree of layer microcracking. A
fracture surface from a 27% ABS interlayer is depicted in Figure 5.4(c), and shows an
absence of hackles, or at least an absence of hackles similar to those in the 5% ABS
interlayers. This indicates the possibility that the 27% ABS interlayer material fails un-
der the maximum shear strain due to its high toughness, rather than under maximum
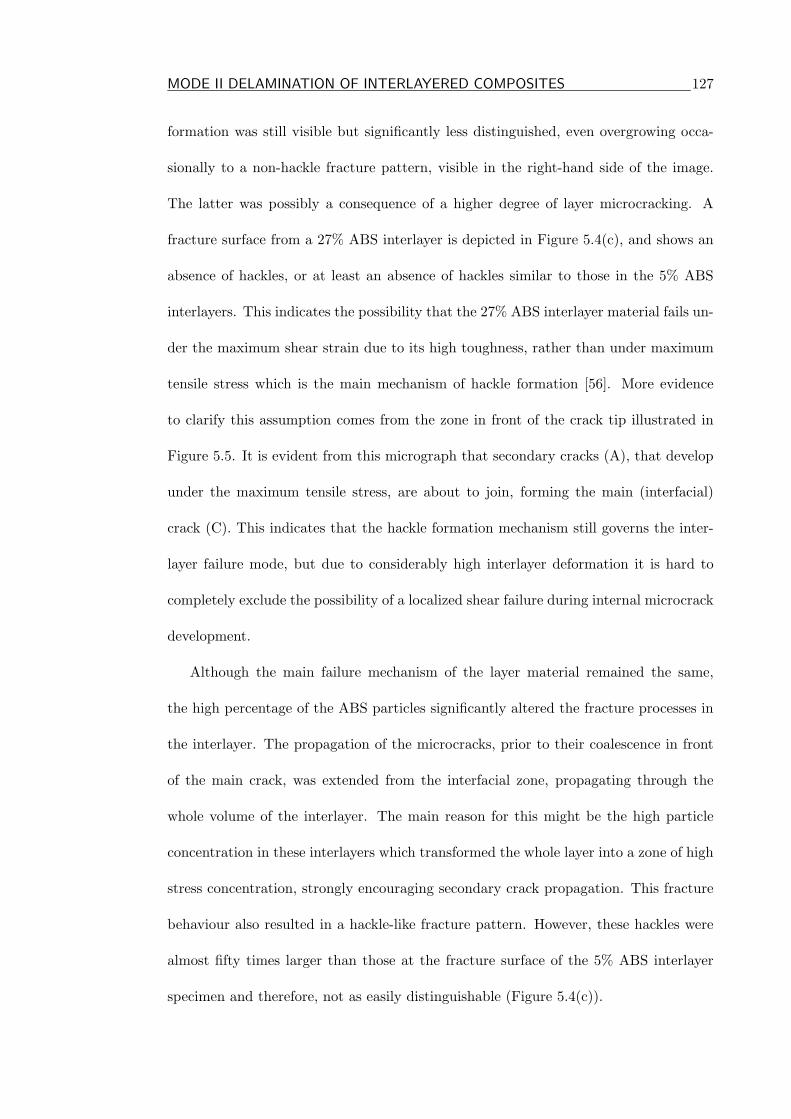
tensile stress which is the main mechanism of hackle formation [56]. More evidence
to clarify this assumption comes from the zone in front of the crack tip illustrated in
Figure 5.5. It is evident from this micrograph that secondary cracks (A), that develop
under the maximum tensile stress, are about to join, forming the main (interfacial)
crack (C). This indicates that the hackle formation mechanism still governs the inter-
layer failure mode, but due to considerably high interlayer deformation it is hard to
completely exclude the possibility of a localized shear failure during internal microcrack
development.
Although the main failure mechanism of the layer material remained the same,
the high percentage of the ABS particles significantly altered the fracture processes in
the interlayer. The propagation of the microcracks, prior to their coalescence in front
of the main crack, was extended from the interfacial zone, propagating through the
whole volume of the interlayer. The main reason for this might be the high particle
concentration in these interlayers which transformed the whole layer into a zone of high
stress concentration, strongly encouraging secondary crack propagation. This fracture
behaviour also resulted in a hackle-like fracture pattern. However, these hackles were
almost fifty times larger than those at the fracture surface of the 5% ABS interlayer
specimen and therefore, not as easily distinguishable (Figure 5.4(c)).
MODE II DELAMINATION OF INTERLAYERED COMPOSITES 128
A
BA
C
Figure 5.5: Optical micrographs of the mode II crack path (continued): 27% ABS layerdeformation and cracking in front of the main crack tip - the main failure is clearly developedunder the maximum tensile stress producing 45◦ cracks (A) which form interfacial failure(C) after touching the fibres. High level of deformation (B) is present in the whole volumeof the layer material
Two toughening mechanisms played the major role in increasing the mode II frac-
ture toughness. Firstly, the plastic deformation of interlayer materials is considered
to be the main toughening mechanism. This conclusion was made also by Chai [109],
working with adhesively bonded joints (of various brittle and toughened epoxy resins),
which are believed to be a good approximation for interlayered composite materials.
He concluded that the formation of the oblique micro-cracks (hackles) may affect GIIc
only marginally while the plastic deformation in the interlayer dominates the fracture
toughness. Secondly, various forms of interlayer cracking (not necessarily just hackle
formation) were proven to influence the fracture toughness. However, some problems
in gaining a full explanation of these mechanisms still exist. It is not clear how these
mechanisms function during the main crack propagation and how they interact. These
problems are especially pronounced in 27% ABS interlayerers, where severe microcrack-
MODE II DELAMINATION OF INTERLAYERED COMPOSITES 129
ing and damage of the interlayers hides information on the fracture micrographs which
may lead to some explanation. In order to shed more light on these problems, an ad-
ditional set of micrographs were obtained together with employment of comprehensive
finite element analysis.
5.2 Examination of sub-critical crack growth: failure mech-
anisms and particle influence
The previous microscopic analysis of the crack path under mode II loading revealed sev-
eral important failure features. Firstly, interlayers with lower particle contents revealed
gray-shaded regions (A) visible after fracture, assumed to be zones of high plastic defor-
mation. They are visible in Figures 5.2 (a) and (b), while the majority of the interlayer
material far from the crack process zone (D) remained intact. In addition, signs of mi-
crocracking (E) are noticable in Figures 5.3 (a) and (b). By increasing particle content,
damage of interlayers recorded after the test became so severe that no specific failure
features could be distinguished in the crack propagation zone. This was a consequence
of the severe damage caused to the interlayers after the maximum load was exceeded
(i.e. after the sub-critical crack growth). This damage was caused by the inevitable
unstable fracture after the maximum force point, combined with compressive loading of
the loading-nose. Obviously, soft and compliant 27% ABS interlayers could not with-
stand such a combined loading. As a consequence, any micrographic evidence of the
sub-critical crack growth is lost. By the examination of such an interlayer, misleading
conclusions can be easily made. For example, the micrographs suggest extremely high
energy absorption of the interlayers with the high particle content. However, that con-
clusion was not reflected in the obtained fracture toughness trend seen in Figure 5.1.
MODE II DELAMINATION OF INTERLAYERED COMPOSITES 130
The fracture toughness observed with the high ABS content interlayers was merely
associated with the longer sub-critical cracks, while the initial measurements of the
fracture energy did not show any variation in toughness as a function of ABS particle
content beyond 5% of ABS modification. Obviously, a new set of micrographs was
required, which would contain only sub-critical cracking and possibly be able to give a
better explanation of the experimentally obtained fracture toughness trend.
For this purpose a new set of specimens was tested so as to suppress the unstable
crack growth after the maximum load point. This requirement was fulfilled by loading
the specimens up to the point of maximum load, and then stopping, ensuring that
the polished edges contain only micrographic information about the sub-critical crack
growth. In addition, this set of tests was used for precise measurement of the sub-critical
crack lengths in interlayers with different particle contents and they were found to be
identical as those recorded during previous set of tests. The typical crack initiation
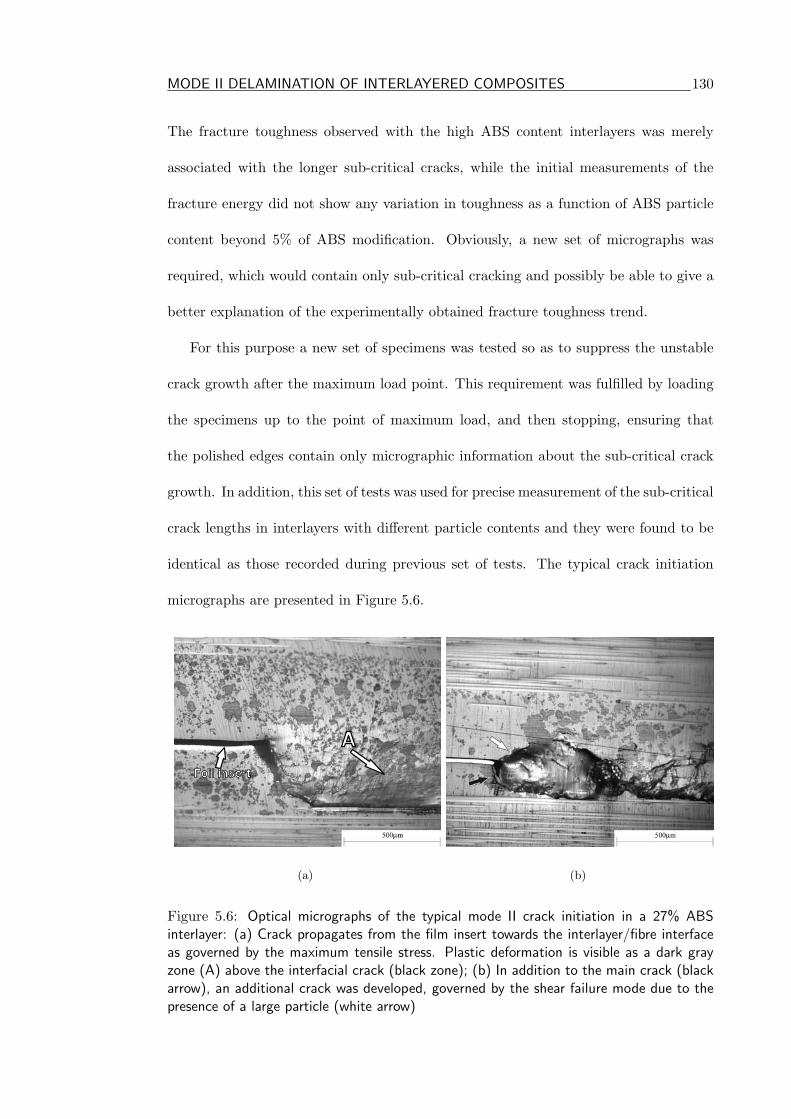
micrographs are presented in Figure 5.6.
A
Foil insert
(a) (b)
Figure 5.6: Optical micrographs of the typical mode II crack initiation in a 27% ABSinterlayer: (a) Crack propagates from the film insert towards the interlayer/fibre interfaceas governed by the maximum tensile stress. Plastic deformation is visible as a dark grayzone (A) above the interfacial crack (black zone); (b) In addition to the main crack (blackarrow), an additional crack was developed, governed by the shear failure mode due to thepresence of a large particle (white arrow)
MODE II DELAMINATION OF INTERLAYERED COMPOSITES 131
The mode II loading applied upon a ENF specimen causes crack initiation governed
by the maximum tensile stress in a form of crack developing from the film insert along
the 45◦ direction. This is visible in both images in Figure 5.6. After making contact
with the interlayer/fiber interface, the crack propagates along the interface, as governed
by the development of hackle microcracks.
Figure 5.6 (a) depicts a 27% ABS interlayer, where the crack propagated in the
same fashion as for the lower ABS content interlayers. Although it was evident from
the previous set of micrographs that 27% ABS interlayers were the most compliant to
crack growth, it is obvious that the plastic zone was not different in size to those found
in the 5% and 10% ABS interlayers. The height of the plastically deformed material
(marked with an ’A’) is visible in Figure 5.6 (a), in the form of dark grey zone above
the main interfacial crack. It is measured to be not larger than 200µm. This finding
supports the initial numerical data, where the amount of fracture energy calculated
at constant crack length was equal for the all interlayer materials. When the real
crack length was included in the GmaxIIC calculation, the high ABS content interlayers
exhibited their capability of sustaining high applied strain energies while containing
a longer crack than those with less ABS. Another sub-critical crack growth area is
illustrated in Figure 5.6 (b). Apart from some similar features found in the previous
micrograph, evidence of local shear failure is clearly visible (marked with the white
arrow). Due to the particle distribution around the film insert tip, a large particle
interacted with the tip causing a shear failure developed together with the dominant
interfacial crack development (marked with the black arrow). In addition to this feature,
the depicted crack process zone is dominated by micro-cracking. Various micro-cracks
were developed along with the main crack, possibly due to interactions between the
main crack and particles or solely among particles. This is even more distinguishable
MODE II DELAMINATION OF INTERLAYERED COMPOSITES 132
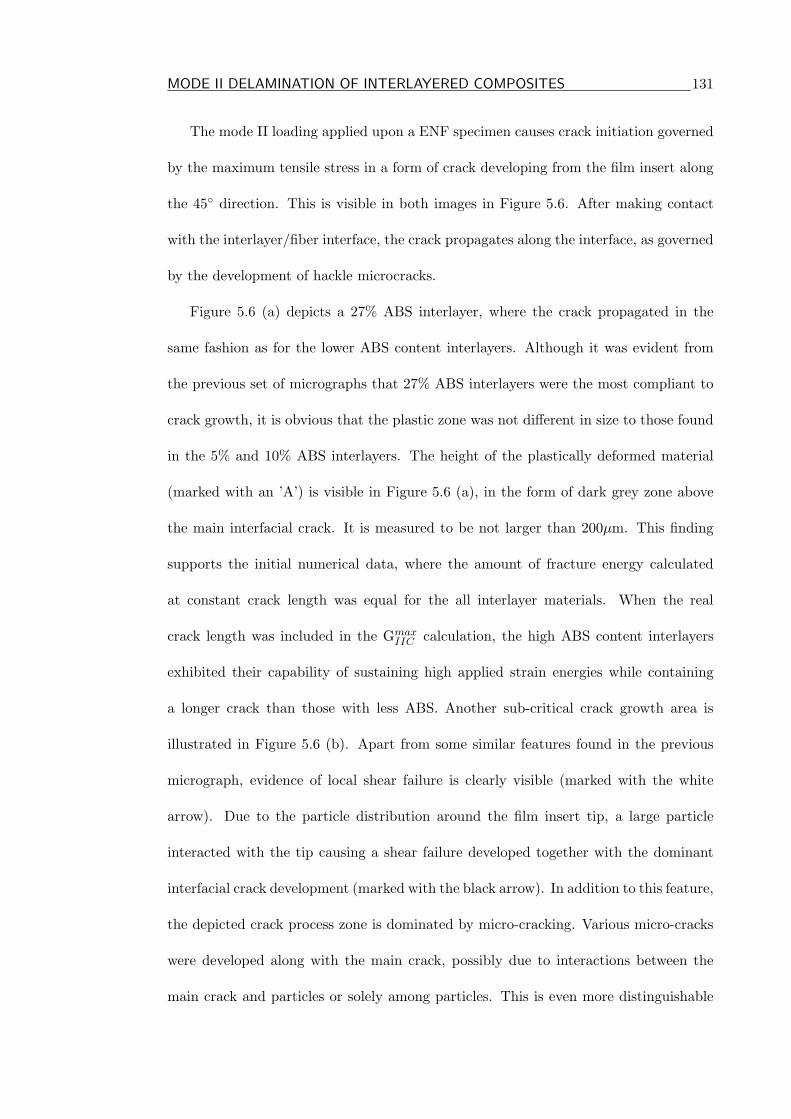
during further crack propagation, as illustrated in Figure 5.7.
A
B
Figure 5.7: Optical micrograph of the sub-critical mode II crack path: interlayer defor-mation and cracking (A) is visible in the zone above the main crack. Interactions amongparticles are in the form of dark grey regions (B), possibly caused by irregular particle shapes
The crack/particle (A) and particle/particle (B) interactions, through development
of highly deformed zones and micro-cracks, continued in a similar fashion during sub-
critical crack propagation. These findings clearly support the scenario where particles
are responsible for initiation of microcracks and subsequent development of the longer
sub-critical crack, while maintaining stable growth of the main interfacial crack. The
more particles in the interlayer the stronger this effect will be, especially after the
butadiene saturation is reached, as in the case of 27% ABS interlayers.
In addition, it can be noticed that these interactions were more pronounced around
particle corners due to their irregular shape. Interestingly, the influence of the particle
shapes was absent during mode I crack propagation, while mode II loading obviously
caused completely different failure mechanisms. In addition, while under mode I load-
ing, the crack path was under the direct influence of the particles, especially their size,
MODE II DELAMINATION OF INTERLAYERED COMPOSITES 133
mode II fracture did not show such a dependence. These differences between the two
loading modes were reflected in the fracture toughness data: while 27% ABS interlay-
ers caused significant toughness improvement under mode I loading, they resulted in
moderately improved fracture toughness under mode II loading, compared to the low
ABS content interlayers.
While all presented results and micrographs present considerable evidence for the
proposed fracture behaviour, they do not provide sufficient information about the na-
ture of the microcracks developed among the ABS particles. Also, apart from some
indications, there is no direct evidence to support the claim that the plastic zone size
is not influenced by the increased particle content. The most interesting is the propo-
sition that particle shape can be important for micro-failure development, which also
requires additional evidence. In order to obtain the required evidence, a number of
FEA modelling techniques were employed.
MODE II DELAMINATION OF INTERLAYERED COMPOSITES 134
5.3 Finite element analysis of mode II delamination
The initial objective of the FEA was to model the boundary conditions of an ENF
fracture toughness test specimen. The FEA study can then be employed to estimate
the influence of the ABS particle content on the plastic zone development around the
initial crack. Also, an examination of the particle influence on the crack initiation, the
possibility of shear failure development and the geometric influence of particles can be
carried out. Finally, a crack propagation analysis was conducted to visualize stress and
strain distributions during crack/particle interactions.
All models were developed by using material models utilized in the previous mode I
finite element study. The material properties were listed in Table 4.1.
5.3.1 ENF models and development of equivalent shear models
The initial model mimicked the geometry of the ENF specimen. It was built from
approximately 5500 plane strain second order elements, containing a line of gap ele-
ments which served to simulate a sharp crack. The gap elements were one-dimensional
line elements possessing very low shear and very high compressive stiffness in order to
obtain a proper load transfer from the upper to the lower half-arm of the crack. This
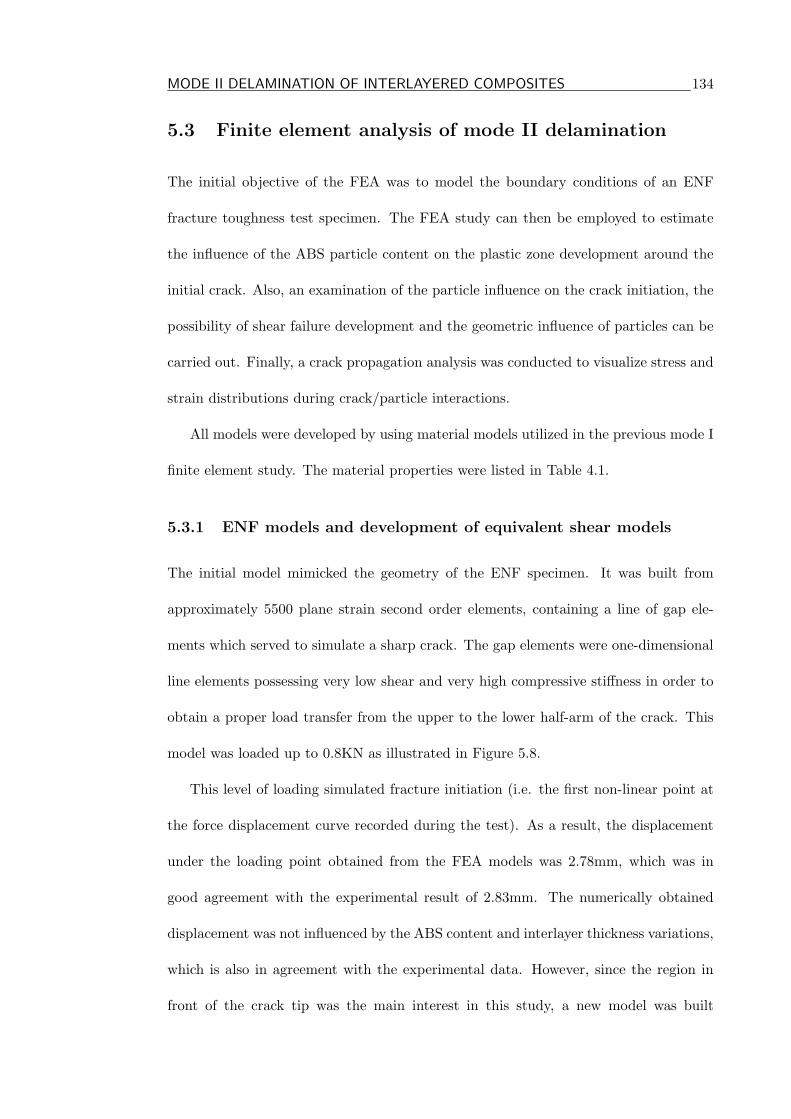
model was loaded up to 0.8KN as illustrated in Figure 5.8.
This level of loading simulated fracture initiation (i.e. the first non-linear point at
the force displacement curve recorded during the test). As a result, the displacement
under the loading point obtained from the FEA models was 2.78mm, which was in
good agreement with the experimental result of 2.83mm. The numerically obtained
displacement was not influenced by the ABS content and interlayer thickness variations,
which is also in agreement with the experimental data. However, since the region in
front of the crack tip was the main interest in this study, a new model was built
MODE II DELAMINATION OF INTERLAYERED COMPOSITES 135
P=0.8kN
Interlayer
Orthotropic composite
layer
Orthotropic composite
layer
Y=0
X=0.015mm
X=-0.015mmInsert film
1mm
0.6
mm
y
x
The equivalent shear model
The initial ENF model
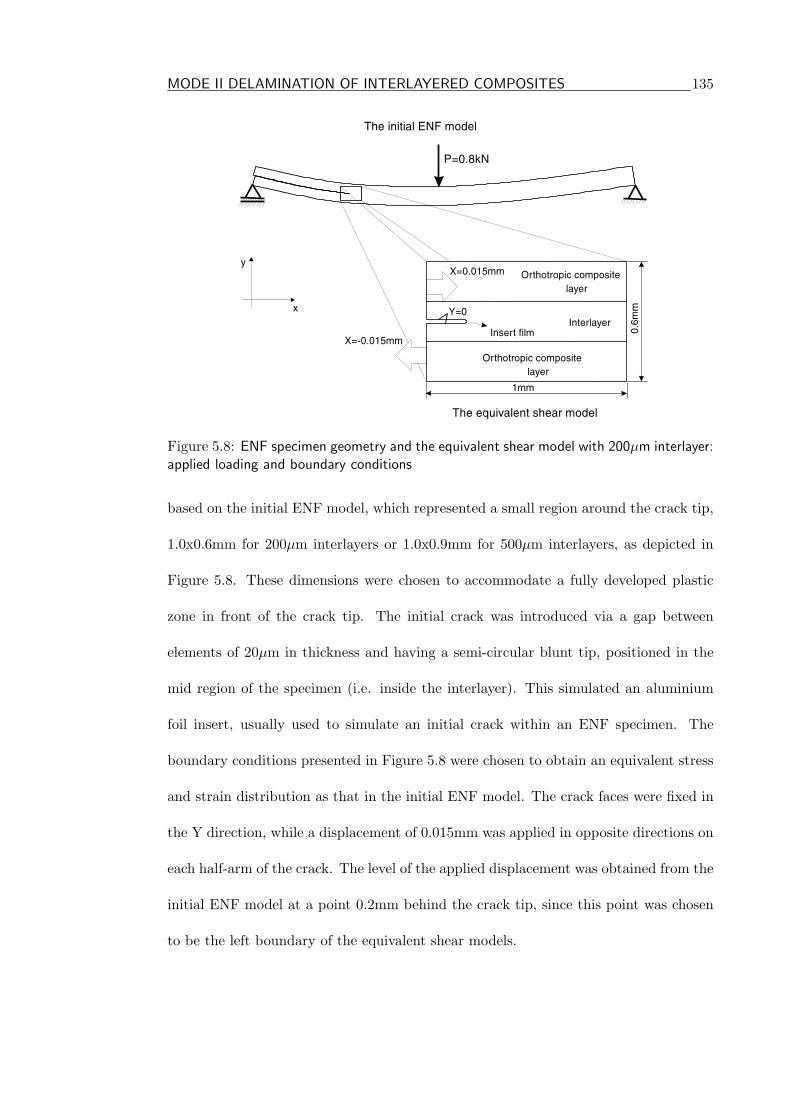
Figure 5.8: ENF specimen geometry and the equivalent shear model with 200µm interlayer:applied loading and boundary conditions
based on the initial ENF model, which represented a small region around the crack tip,
1.0x0.6mm for 200µm interlayers or 1.0x0.9mm for 500µm interlayers, as depicted in
Figure 5.8. These dimensions were chosen to accommodate a fully developed plastic
zone in front of the crack tip. The initial crack was introduced via a gap between
elements of 20µm in thickness and having a semi-circular blunt tip, positioned in the
mid region of the specimen (i.e. inside the interlayer). This simulated an aluminium
foil insert, usually used to simulate an initial crack within an ENF specimen. The
boundary conditions presented in Figure 5.8 were chosen to obtain an equivalent stress
and strain distribution as that in the initial ENF model. The crack faces were fixed in
the Y direction, while a displacement of 0.015mm was applied in opposite directions on
each half-arm of the crack. The level of the applied displacement was obtained from the
initial ENF model at a point 0.2mm behind the crack tip, since this point was chosen
to be the left boundary of the equivalent shear models.
MODE II DELAMINATION OF INTERLAYERED COMPOSITES 136
5.3.2 Plastic zone size and shape
Comparison with theory and experiments
The experimentally obtained micrographic evidence suggested that the plastically de-
formed material can be identified as dark-gray regions. There are several reasons for
this. Firstly, the dark-grey shaded zones were found in the vicinity and inside the crack
process zone, usually followed by severe micro-cracking. Secondly, the deviation of the
polishing marks, representing high deformation zones in the interlayer material, were
found to be coincidental with the dark-gray regions. The FEA models developed for the
plastic zone size assessment were two dimensional plane strain, representing the central
section of the ENF specimen geometry. It is known that the center and the edges of the
ENF specimen geometry contain different stress distributions and consequently differ-
ent plastic zone sizes. While in the central section the stress condition is plane strain
due to the plastic zone confinement from the surrounding material, the edges are under
plane stress condition since the stress component along the direction perpendicular to
the sections has to be zero. The latter condition produces a biaxial stress state, with
significantly larger plastic zone. If the numerical and experimental results were directly
correlated, there was a possibility of producing misleading conclusions, since the plane
stress and plane strain plastic zones are generally not comparable. For the purpose of
clarifying these problematic issues a three-dimensional shear model was developed in
order to define differences in yielding under plane stress and plane strain conditions.
The final mesh of the model is depicted in Figure 5.9.
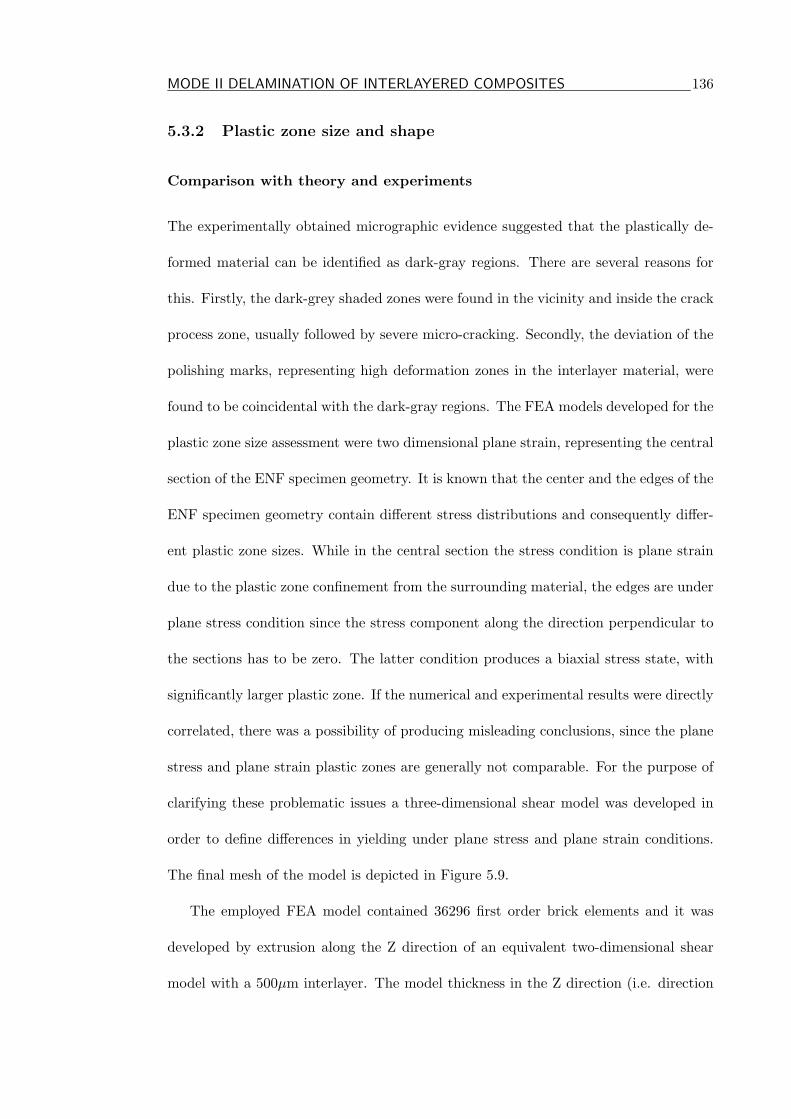
The employed FEA model contained 36296 first order brick elements and it was
developed by extrusion along the Z direction of an equivalent two-dimensional shear
model with a 500µm interlayer. The model thickness in the Z direction (i.e. direction
MODE II DELAMINATION OF INTERLAYERED COMPOSITES 137
Figure 5.9: Final mesh of the 3D shear model with 500µm interlayer - zone around thecrack tip
3 in Figure 5.9) was 0.8mm. The applied boundary conditions, depicted in Figure 5.8,
were also extruded in the Z direction, resulting in the internal crack faces being fixed in
the Y direction. In addition, all other surfaces except those at Z=0 and Z=0.8mm (i.e.
free edges) were constrained in Z direction to suppress mode III, out-of-plane shear
deformation. A displacement of 0.015mm was applied in the opposite directions along
the X axis to the upper and lower half-arm of the crack to simulate mode II, in-plane
shear deformation. The prepared model was solved using elastic-plastic solver in HKS
ABAQUS FEA code [114]. The results are presented in a form of contour plots of
equivalent plastic strain in Figure 5.10.
Figure 5.10 (a) illustrates the middle section of the specimen subjected to the plane
strain condition, while Figure 5.10 (b) represents plane stress conditions active at the
free-edges of the model. It must be noted that the results contain stress information
only for the interlayer, while for the purpose of simplification, stress was not plotted
in the orthotropic composite layers. The plastic zone is in the form of dual elliptical
shapes connected by a narrower section in the region of the crack tip. The main feature
MODE II DELAMINATION OF INTERLAYERED COMPOSITES 138
(a) (b)
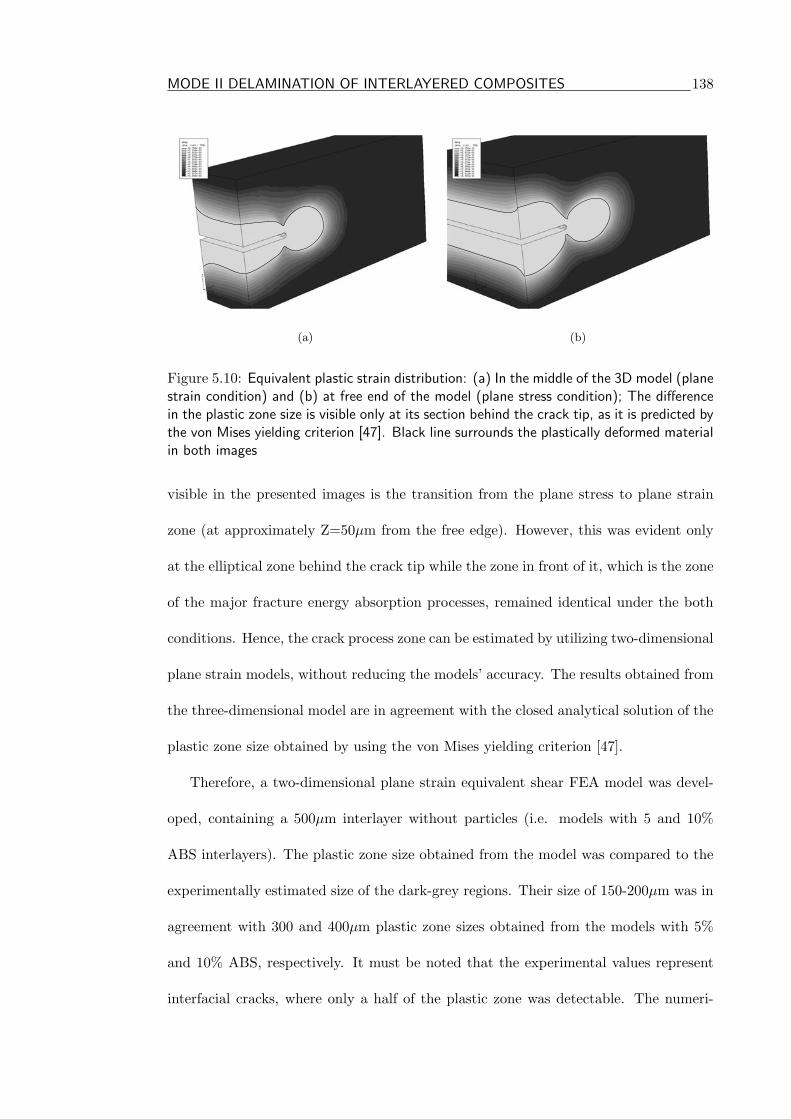
Figure 5.10: Equivalent plastic strain distribution: (a) In the middle of the 3D model (planestrain condition) and (b) at free end of the model (plane stress condition); The differencein the plastic zone size is visible only at its section behind the crack tip, as it is predicted bythe von Mises yielding criterion [47]. Black line surrounds the plastically deformed materialin both images
visible in the presented images is the transition from the plane stress to plane strain
zone (at approximately Z=50µm from the free edge). However, this was evident only
at the elliptical zone behind the crack tip while the zone in front of it, which is the zone
of the major fracture energy absorption processes, remained identical under the both
conditions. Hence, the crack process zone can be estimated by utilizing two-dimensional
plane strain models, without reducing the models’ accuracy. The results obtained from
the three-dimensional model are in agreement with the closed analytical solution of the
plastic zone size obtained by using the von Mises yielding criterion [47].
Therefore, a two-dimensional plane strain equivalent shear FEA model was devel-
oped, containing a 500µm interlayer without particles (i.e. models with 5 and 10%
ABS interlayers). The plastic zone size obtained from the model was compared to the
experimentally estimated size of the dark-grey regions. Their size of 150-200µm was in
agreement with 300 and 400µm plastic zone sizes obtained from the models with 5%
and 10% ABS, respectively. It must be noted that the experimental values represent
interfacial cracks, where only a half of the plastic zone was detectable. The numeri-
MODE II DELAMINATION OF INTERLAYERED COMPOSITES 139
cal plastic zones are obtained around the initial crack tip positioned in the mid-zone
of the interlayers, since modelling of crack propagation along bi-material interfaces by
FEA is not reliable due to various numerical problems which were discussed in previous
chapters. Therefore, the experimental and numerical results were identical since the
only half of the plastic zone is active in energy absorption processes during the crack
propagation.
Influence of the particles on the plastic zone size
Based on the experimental results, it was assumed that particles do not have any
influence on the plastic zone size. However, it was important to employ FEA modelling
to obtain additional evidence for this assumption. For this purpose an equivalent shear
model was utilized, containing randomly distributed circular particles, random in size,
within the 500µm thick interlayer. The results were to be compared with those from
the model of the same geometry but without particles, employed in the study explained
in the previous section. The final mesh of 19259 plane strain second order elements is
depicted in Figure 5.11 and the results are presented in Figure 5.12.
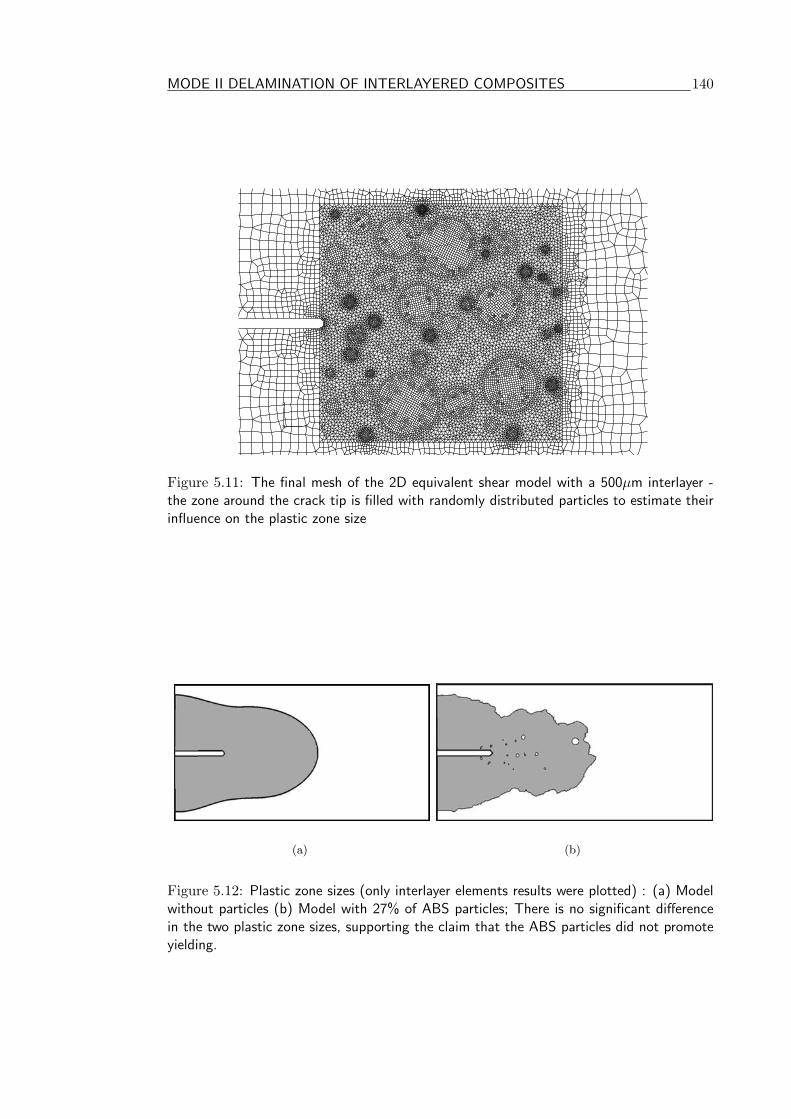
The main feature of these images is the negligible influence of the particles on the
plastic zone size. Some small variations of shape and size of the zone are visible but
there is no significant difference that can lead to the conclusion that the ABS particles
promoted yielding of the surrounding layer material. This finding can be associated
with nearly identical yield stresses measured for the particles and the matrix material,
as listed in Table 4.1. The obtained size of the plastic zone in both cases was between
350 and 400µm. Again, this was in agreement with the experimental micrographic
evidence.
MODE II DELAMINATION OF INTERLAYERED COMPOSITES 140
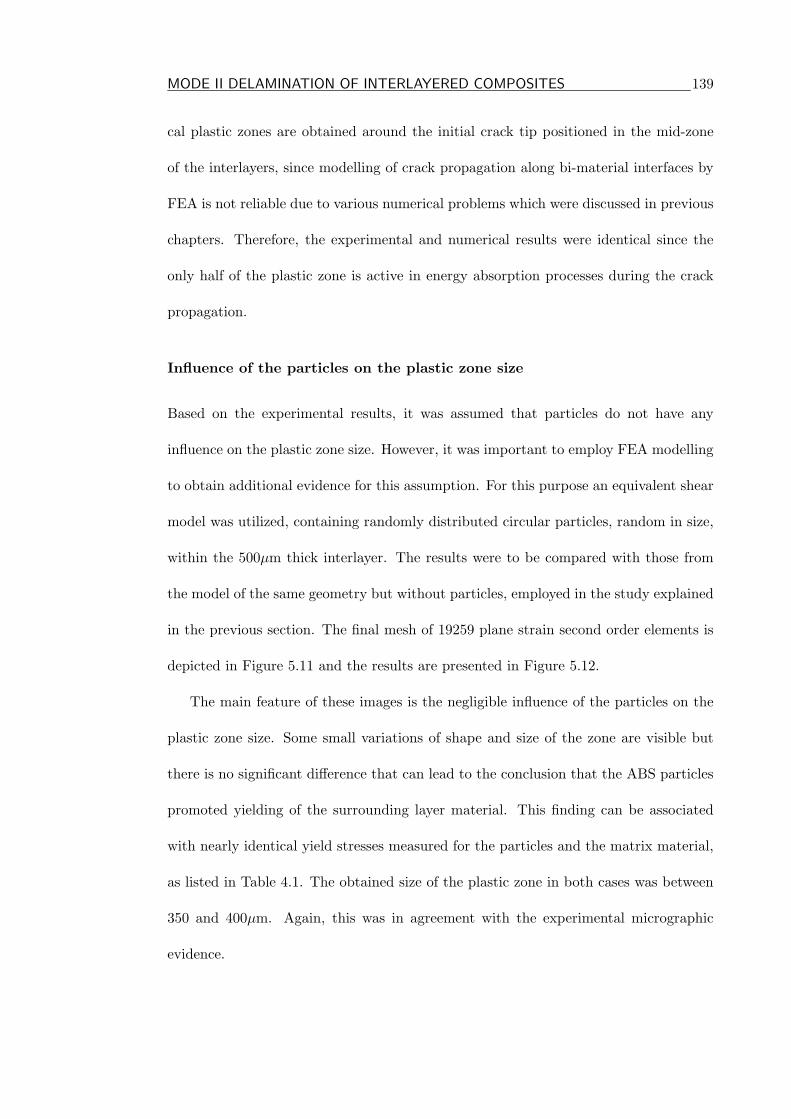
Figure 5.11: The final mesh of the 2D equivalent shear model with a 500µm interlayer -the zone around the crack tip is filled with randomly distributed particles to estimate theirinfluence on the plastic zone size
(a) (b)
Figure 5.12: Plastic zone sizes (only interlayer elements results were plotted) : (a) Modelwithout particles (b) Model with 27% of ABS particles; There is no significant differencein the two plastic zone sizes, supporting the claim that the ABS particles did not promoteyielding.
MODE II DELAMINATION OF INTERLAYERED COMPOSITES 141
The most significant finding of this and the previous analysis, which employed 3D
modelling, was that they correlated the observed dark-gray zones with the plastic defor-
mation of the materials. The consequence of this finding is that the similar conclusion
stands for other, more localized, micrographic features like dark shaded zones (marked
with ’B’) developing among the particles visible in Figure 5.7. This feature dominated
regions around the sharp particle edges due to their irregular shapes. The analysis of
their possible influence on the failure mechanisms will be undertaken in the following
sections.
5.3.3 Influence of the particles on crack initiation
Circular particle shape
The particles in the interlayers obviously have a significant influence on failure pro-
cesses. Although they did not improve the yielding capabilities of the interlayer they
had a strong localized influence, triggering micro-cracking. Some micrographs suggested
that under favorable circumstances a distribution of particles in vicinity of the crack tip
can induce localized shear failure, as indicated in Figure 5.6 (b). This mode of fracture
was not dominant since the interlayer materials were all considerably brittle, regardless
of the level of ABS modification. However, it was necessary to examine the possibil-
ity of shear failure as a consequence of crack/particle interactions. Naturally, similar
stress/strain interactions, remote from the crack tip, could induce micro-cracking of
the interlayer matrix, also representing important failure mechanism.
A model employed for this purpose is illustrated in Figure 5.11. Randomly dis-
tributed particles were positioned in a 500µm interlayer, in the zone in front of the
crack tip. The results in the form of an equivalent plastic strain contour plot are
depicted in Figure 5.13.
MODE II DELAMINATION OF INTERLAYERED COMPOSITES 142
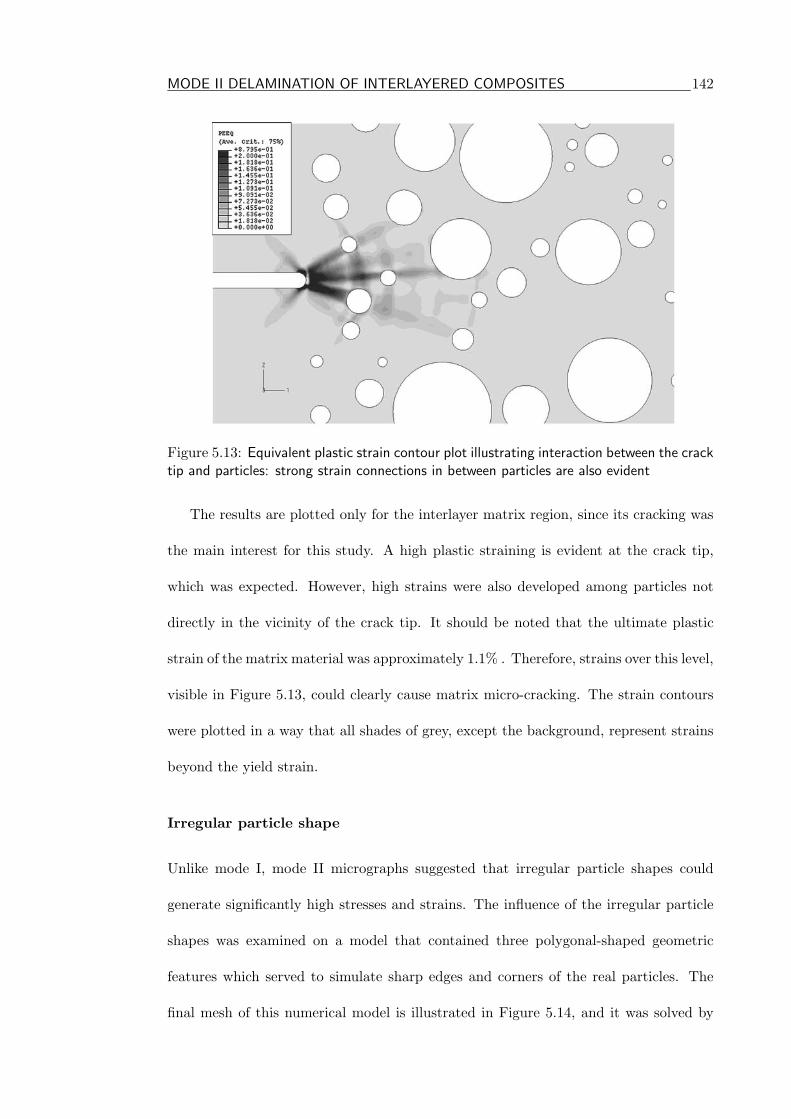
Figure 5.13: Equivalent plastic strain contour plot illustrating interaction between the cracktip and particles: strong strain connections in between particles are also evident
The results are plotted only for the interlayer matrix region, since its cracking was
the main interest for this study. A high plastic straining is evident at the crack tip,
which was expected. However, high strains were also developed among particles not
directly in the vicinity of the crack tip. It should be noted that the ultimate plastic
strain of the matrix material was approximately 1.1% . Therefore, strains over this level,
visible in Figure 5.13, could clearly cause matrix micro-cracking. The strain contours
were plotted in a way that all shades of grey, except the background, represent strains
beyond the yield strain.
Irregular particle shape
Unlike mode I, mode II micrographs suggested that irregular particle shapes could
generate significantly high stresses and strains. The influence of the irregular particle
shapes was examined on a model that contained three polygonal-shaped geometric
features which served to simulate sharp edges and corners of the real particles. The
final mesh of this numerical model is illustrated in Figure 5.14, and it was solved by
MODE II DELAMINATION OF INTERLAYERED COMPOSITES 143
HKS Abaqus FEA code [114].
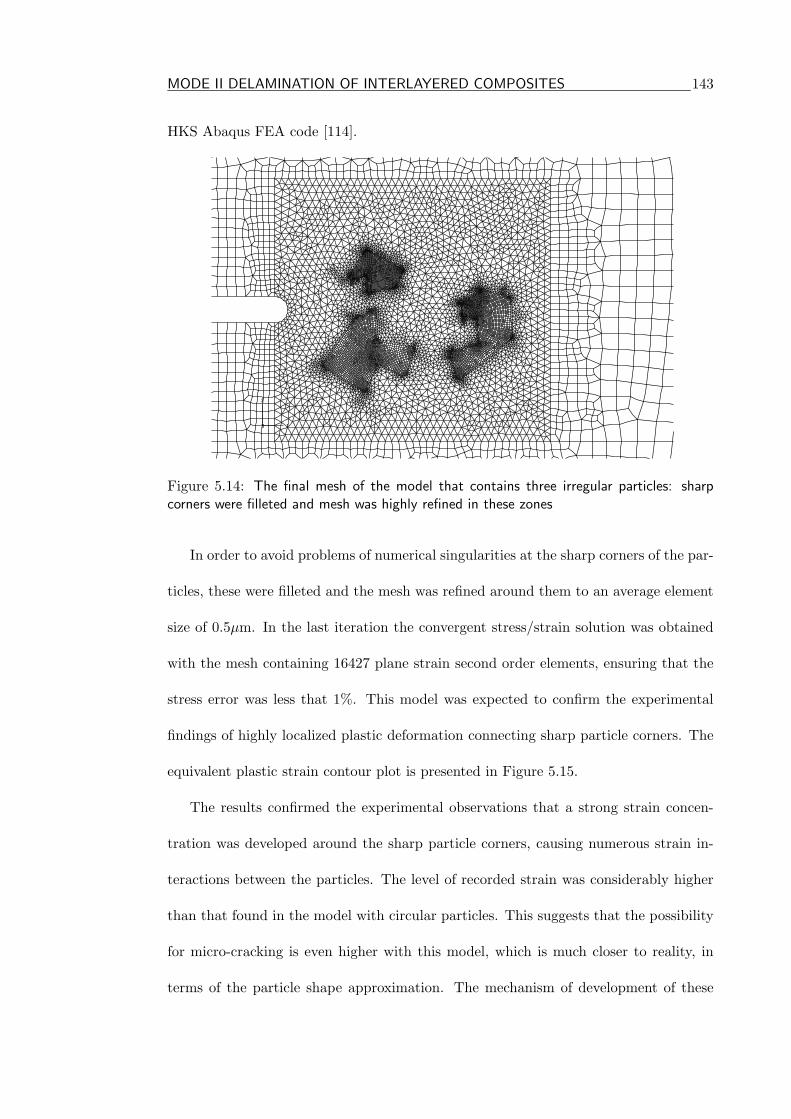
Figure 5.14: The final mesh of the model that contains three irregular particles: sharpcorners were filleted and mesh was highly refined in these zones
In order to avoid problems of numerical singularities at the sharp corners of the par-
ticles, these were filleted and the mesh was refined around them to an average element
size of 0.5µm. In the last iteration the convergent stress/strain solution was obtained
with the mesh containing 16427 plane strain second order elements, ensuring that the
stress error was less that 1%. This model was expected to confirm the experimental
findings of highly localized plastic deformation connecting sharp particle corners. The
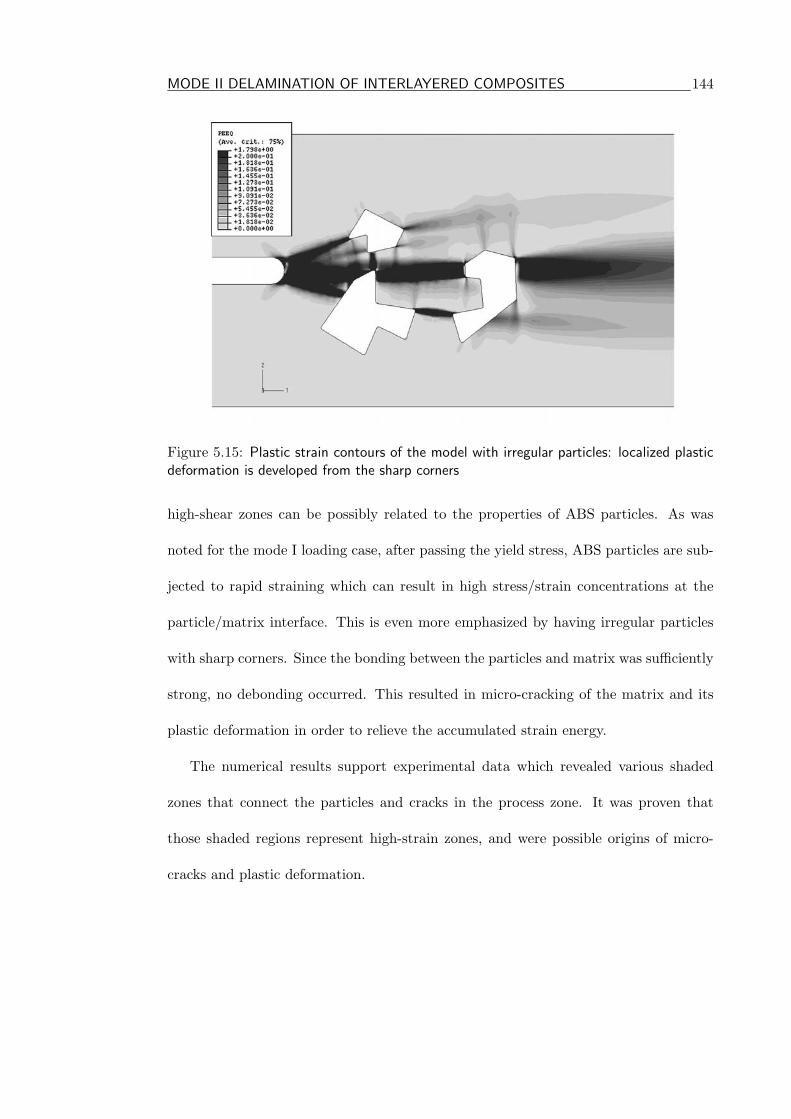
equivalent plastic strain contour plot is presented in Figure 5.15.
The results confirmed the experimental observations that a strong strain concen-
tration was developed around the sharp particle corners, causing numerous strain in-
teractions between the particles. The level of recorded strain was considerably higher
than that found in the model with circular particles. This suggests that the possibility
for micro-cracking is even higher with this model, which is much closer to reality, in
terms of the particle shape approximation. The mechanism of development of these
MODE II DELAMINATION OF INTERLAYERED COMPOSITES 144
Figure 5.15: Plastic strain contours of the model with irregular particles: localized plasticdeformation is developed from the sharp corners
high-shear zones can be possibly related to the properties of ABS particles. As was
noted for the mode I loading case, after passing the yield stress, ABS particles are sub-
jected to rapid straining which can result in high stress/strain concentrations at the
particle/matrix interface. This is even more emphasized by having irregular particles
with sharp corners. Since the bonding between the particles and matrix was sufficiently
strong, no debonding occurred. This resulted in micro-cracking of the matrix and its
plastic deformation in order to relieve the accumulated strain energy.
The numerical results support experimental data which revealed various shaded
zones that connect the particles and cracks in the process zone. It was proven that
those shaded regions represent high-strain zones, and were possible origins of micro-
cracks and plastic deformation.
MODE II DELAMINATION OF INTERLAYERED COMPOSITES 145
5.3.4 Crack propagation analysis: the nature of mode II interfacial
failure
The experimental evidence suggested that after initiation, the crack rapidly grows to-
wards the interlayer/fibre interface and subsequently propagates along the interface.
Therefore, the FEA models which examined crack/particle and particle/particle inter-
actions in the mid-region of the interlayer might not be sufficient to explain all failure
mechanisms that exist under mode II loading. It is obvious that an FEA modelling
that includes crack propagation can give the necessary information. This stage of the
study was conducted in a similar fashion to the mode I loading analysis, using the
elastic-plastic crack propagation FEA capabilities of the FRANC 2DL code [74].
The micrographs of crack initiation in Figure 5.6 illustrate the main failure devel-
oping under the maximum tensile stress. This failure mode was due to the brittle-like
nature of the interlayer matrix and the applied far-field loading (i.e. pure shear). Hence,
subsequent interfacial failure was not induced due to weak interfacial bonding between
the interlayer and the rest of the composite. Further crack propagation, in addition
to the hackle formation process, activates significant involvement of the local particles.
It was assumed that a simulation of this process could be performed by analysis of
the crack propagation before the crack encounters the interface. This modelling proce-
dure was designed to explain the stress state in the vicinity of the interface before its
encounter with the main crack, together with possible failure processes that develop
during the crack propagation. This was conducted by developing models with and
without particles, as depicted in Figure 5.16.
Both models contained 200µm interlayers, while the meshes were developed from
approximately 6000 second order plane strain elements. The homogeneous interlayer
possessed properties equivalent to 10% ABS/VE blend, while the model with particles
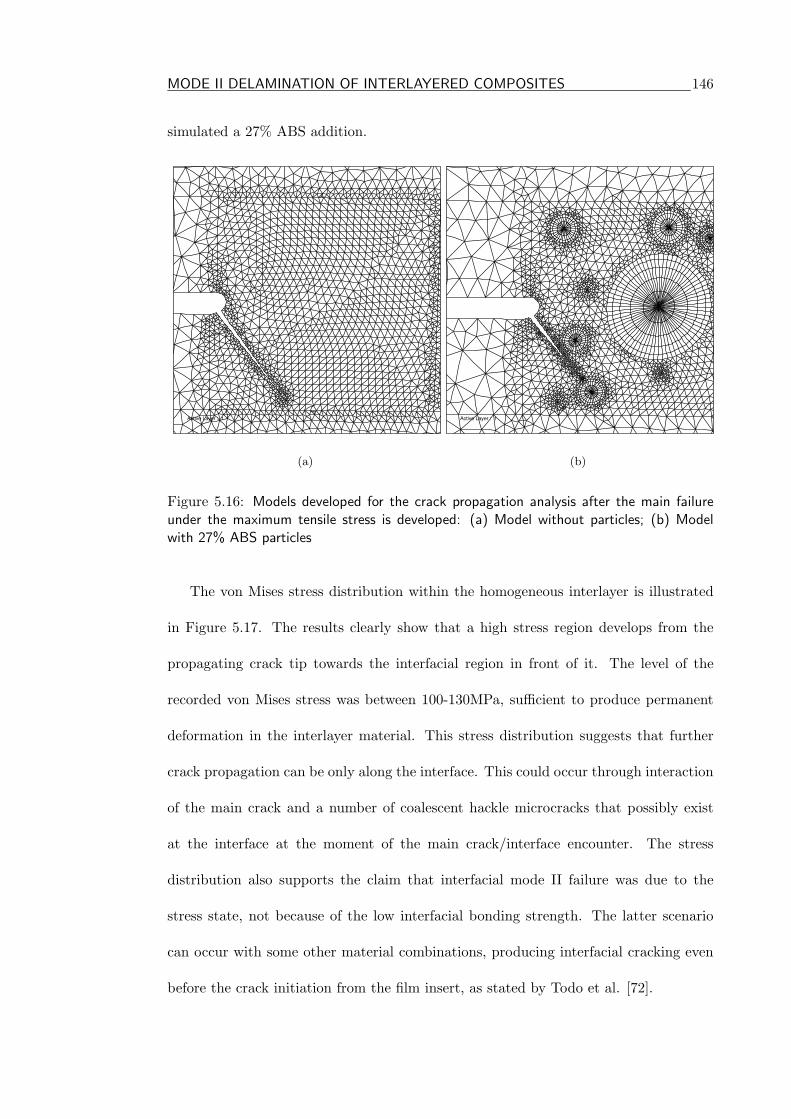
MODE II DELAMINATION OF INTERLAYERED COMPOSITES 146
simulated a 27% ABS addition.
Active Layer : 1
(a)
Active Layer : 1
(b)
Figure 5.16: Models developed for the crack propagation analysis after the main failureunder the maximum tensile stress is developed: (a) Model without particles; (b) Modelwith 27% ABS particles
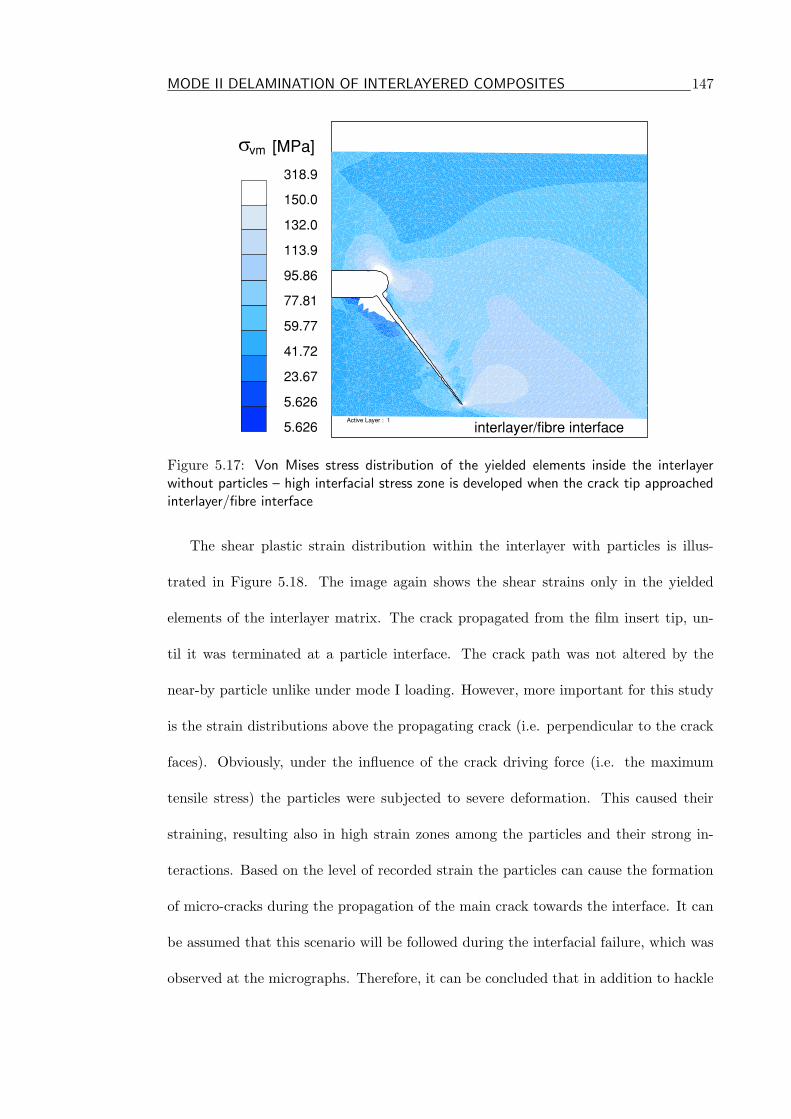
The von Mises stress distribution within the homogeneous interlayer is illustrated
in Figure 5.17. The results clearly show that a high stress region develops from the
propagating crack tip towards the interfacial region in front of it. The level of the
recorded von Mises stress was between 100-130MPa, sufficient to produce permanent
deformation in the interlayer material. This stress distribution suggests that further
crack propagation can be only along the interface. This could occur through interaction
of the main crack and a number of coalescent hackle microcracks that possibly exist
at the interface at the moment of the main crack/interface encounter. The stress
distribution also supports the claim that interfacial mode II failure was due to the
stress state, not because of the low interfacial bonding strength. The latter scenario
can occur with some other material combinations, producing interfacial cracking even
before the crack initiation from the film insert, as stated by Todo et al. [72].
MODE II DELAMINATION OF INTERLAYERED COMPOSITES 147
Active Layer : 1
5.626
5.626
23.67
41.72
59.77
77.81
95.86
113.9
132.0
150.0
318.9
�vm �����
interlayer/fibre interface
Figure 5.17: Von Mises stress distribution of the yielded elements inside the interlayerwithout particles – high interfacial stress zone is developed when the crack tip approachedinterlayer/fibre interface
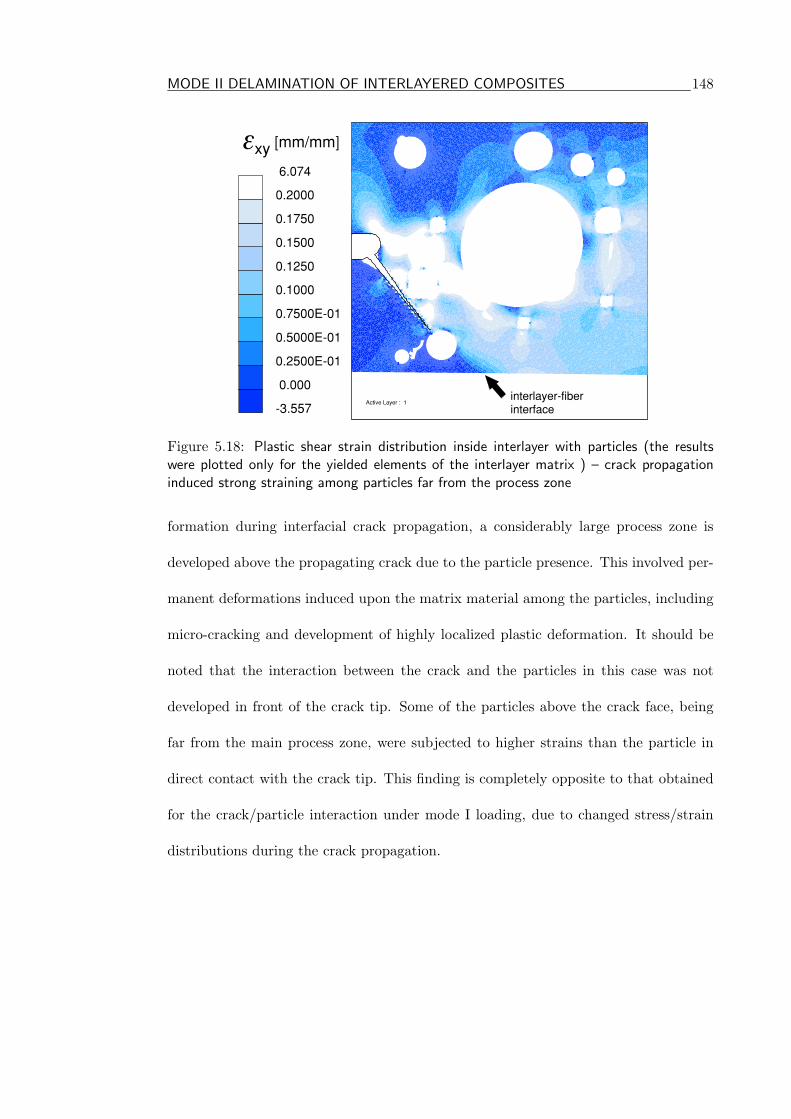
The shear plastic strain distribution within the interlayer with particles is illus-
trated in Figure 5.18. The image again shows the shear strains only in the yielded
elements of the interlayer matrix. The crack propagated from the film insert tip, un-
til it was terminated at a particle interface. The crack path was not altered by the
near-by particle unlike under mode I loading. However, more important for this study
is the strain distributions above the propagating crack (i.e. perpendicular to the crack
faces). Obviously, under the influence of the crack driving force (i.e. the maximum
tensile stress) the particles were subjected to severe deformation. This caused their
straining, resulting also in high strain zones among the particles and their strong in-
teractions. Based on the level of recorded strain the particles can cause the formation
of micro-cracks during the propagation of the main crack towards the interface. It can
be assumed that this scenario will be followed during the interfacial failure, which was
observed at the micrographs. Therefore, it can be concluded that in addition to hackle
MODE II DELAMINATION OF INTERLAYERED COMPOSITES 148
Active Layer : 1
-3.557
0.000
0.2500E-01
0.5000E-01
0.7500E-01
0.1000
0.1250
0.1500
0.1750
0.2000
6.074
�xy [ ]mm/mm
interlayer-fiberinterface
Figure 5.18: Plastic shear strain distribution inside interlayer with particles (the resultswere plotted only for the yielded elements of the interlayer matrix ) – crack propagationinduced strong straining among particles far from the process zone
formation during interfacial crack propagation, a considerably large process zone is
developed above the propagating crack due to the particle presence. This involved per-
manent deformations induced upon the matrix material among the particles, including
micro-cracking and development of highly localized plastic deformation. It should be
noted that the interaction between the crack and the particles in this case was not
developed in front of the crack tip. Some of the particles above the crack face, being
far from the main process zone, were subjected to higher strains than the particle in
direct contact with the crack tip. This finding is completely opposite to that obtained
for the crack/particle interaction under mode I loading, due to changed stress/strain
distributions during the crack propagation.
MODE II DELAMINATION OF INTERLAYERED COMPOSITES 149
5.4 Preliminary study on influence of fatigue pre-cracking
The mode II fracture toughness results, presented in Table 5.1, are obtained from end-
notch-flexure (ENF) specimens using the Direct Beam Theory as suggested in the ESIS
protocol [98]. Results presented in Table 5.1 suggest that pre-cracking produced a drop
in toughness for both initiation and maximum GIIc values. It was noticed during the
mode II testing that all the interlayer toughened coupons exhibited stable crack growth,
in contrast to the mainly unstable crack growth exhibited by those without the tough-
ened interlayer. Crack growth was stable before the maximum load level was reached,
resulting in a similar crack length of approximately 6mm for all specimens. It should
be noted that the GmaxIIc values given in Table 5.1 were calculated based on the true
crack length at the point of maximum load, not the initial crack length. It is interesting
that pre-cracking influenced both initiation and maximum fracture toughness values,
despite being clearly separated by a considerable crack growth process. This influence
was not noticed under mode I loading, suggesting diverse fracture mechanisms acting
under the two fracture modes.
GIIc[J/m2] 250µm layer 250µm layer 500µm layerpre-crack Al-foil Al-foil
initiation (NL) 702(70) 1135(167) 1088(134)maximum 5796(505) 9081(312) 8318(835)
Table 5.1: Mode II fracture toughness of interlayered specimens with and without fatiguepre-cracks and with different interlayer thicknesses (standard deviations are given in paren-theses); NL stands for non-linear point
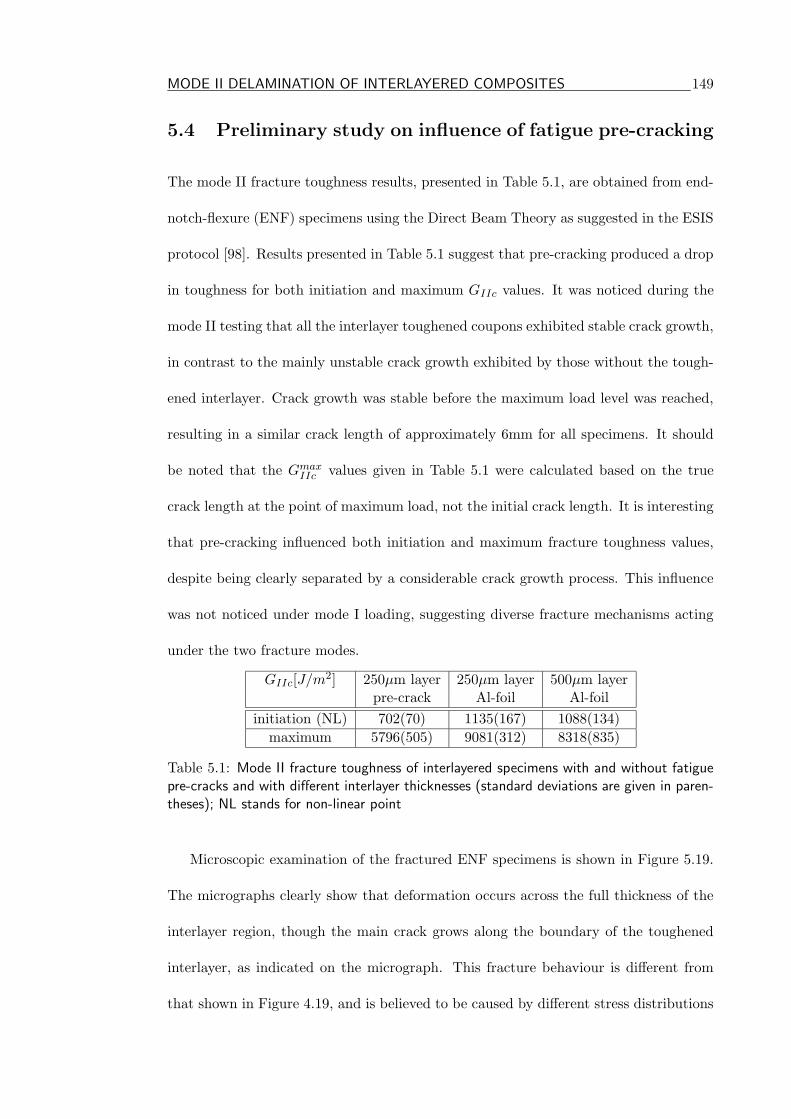
Microscopic examination of the fractured ENF specimens is shown in Figure 5.19.
The micrographs clearly show that deformation occurs across the full thickness of the
interlayer region, though the main crack grows along the boundary of the toughened
interlayer, as indicated on the micrograph. This fracture behaviour is different from
that shown in Figure 4.19, and is believed to be caused by different stress distributions
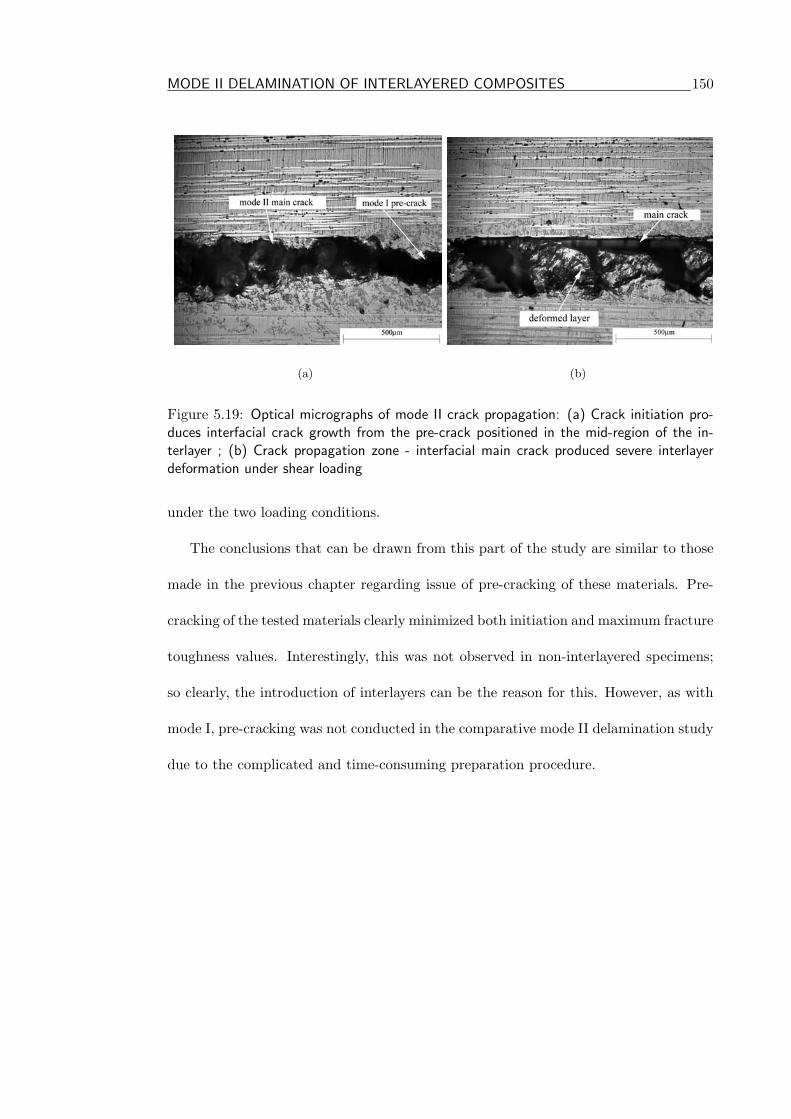
MODE II DELAMINATION OF INTERLAYERED COMPOSITES 150
(a) (b)
Figure 5.19: Optical micrographs of mode II crack propagation: (a) Crack initiation pro-duces interfacial crack growth from the pre-crack positioned in the mid-region of the in-terlayer ; (b) Crack propagation zone - interfacial main crack produced severe interlayerdeformation under shear loading
under the two loading conditions.
The conclusions that can be drawn from this part of the study are similar to those
made in the previous chapter regarding issue of pre-cracking of these materials. Pre-
cracking of the tested materials clearly minimized both initiation and maximum fracture
toughness values. Interestingly, this was not observed in non-interlayered specimens;
so clearly, the introduction of interlayers can be the reason for this. However, as with
mode I, pre-cracking was not conducted in the comparative mode II delamination study
due to the complicated and time-consuming preparation procedure.
MODE II DELAMINATION OF INTERLAYERED COMPOSITES 151
5.5 Analysis and summary of the results
The mode II fracture toughness testing program revealed one of the most important
issues from this study – sub-critical crack growth. This fracture event resulted in
different fracture toughness trends calculated for the crack initiation point GiniIIc and
the maximum load point GmaxIIc . Hence, the both sets of fracture toughness data were
taken to be of equal importance for the material fracture characterization under the
pure, in-plane shear loading. Fracture testing results assessed at the point of crack
initiation (i.e. calculated with the same initial crack length for all ABS contents), did
not show any variation of GIIc with ABS content or interlayer thickness. Due to the
difference in the sub-critical crack length, fracture toughness values calculated at the
maximum load point increased with increasing ABS content, but not with variation in
interlayer thickness. It should be noted that GmaxIIc values are always determined more
accurately than GiniIIc, since the maximum load point is easier to define than the first
non-linear point at load-displacement curves. Therefore, only explanation of the GmaxIIc
trend will be undertaken in this section.
Similarly to the mode I fracture toughness trends, the initial increase in toughness
was predominantly due to the existence of interlayer, which allowed the full formation
of the plastic zone around the crack tip. Beyond this initial increase, any variation
of ABS content and interlayer thickness failed to cause any change in fracture tough-
ness calculated from a constant crack length. The insensitivity to interlayer thickness
variation can be directly correlated to the maximum size of the plastic zone for the
interlayer materials. This conclusion was supported by both experimental and finite
element results, that the ABS particles did not influence the yielding potential of inter-
layers. The optimum interlayer thickness was smaller for mode II loading than that for
mode I, and this can be explained by the different shapes of these two plastic zones and
MODE II DELAMINATION OF INTERLAYERED COMPOSITES 152
different crack propagation mechanisms under these two loading conditions. By using
the von Mises yielding criterion it can be seen that the mode I plastic zone is much
larger along the direction perpendicular to the crack. Contrary to this, the mode II
plastic zone develops predominantly along the crack. Secondly, while the mode I crack
propagated through the middle of interlayer, mode II crack propagation was always
interfacial. The latter results in constraining one half of the mode II plastic zone, so
mode II fracture needs less material for full yielding than mode I.
Although the ABS particles did not promote yielding, they did induce some addi-
tional failure processes within the interlayers. They acted through secondary damage
processes such as micro-cracking. However, the main failure was always brittle-like
fracture, governed by the maximum tensile stress. Particles interacted with the prop-
agating interfacial crack and also among themselves, causing localized plastic defor-
mation and micro-cracking. By comparing this to mode I fracture, several differences
were observed. Secondary damage rarely propagated through the particles, which was
not the case under mode I loading. Even if such fracture occurred, the crack would
have been rapidly arrested by the fractured particle. An example is the shear fracture
event captured in Figure 5.6 (b). Also, secondary cracking and plastic deformation
that developed from the sharp corners of irregular particles was absent from mode I
fracture events, where the main crack and micro-cracks easily propagated through the
particles.
Finally, based on all recorded observations, a possible explanation for the mode II
fracture can be given. The secondary damage processes possibly absorbed significant
amounts of energy during the propagation of the main crack, causing a decrease in the
main crack speed. The consequence is completely stable crack propagation, so called
sub-critical crack growth. It can be assumed that 27% ABS interlayers had the highest
MODE II DELAMINATION OF INTERLAYERED COMPOSITES 153
energy absorption potential, since the micro-cracking in these interlayers that followed
the main interfacial fracture was capable of maintaining slow crack growth significantly
longer that those in 5% and 10% ABS interlayers. Consequently, 27% ABS interlay-
ers demonstrated the maximum mode II fracture toughness. This fracture toughness
increase was smaller than the one found under mode I loading (30%, compared with
70% under mode I loading). This can be explained by the nature of mode II failure,
where neither the main crack nor the secondary micro-cracks propagated through the
ABS particles.
Top Related