


Languages
Pages
Legal


Mobile data market overview
Forecasts
&
Reality
Dominic Schreiber, TBI

What’s there to be excited about?
1,385 million mobile subs at end-03
(Source: Global Mobile Subscriber Database)

What the forecasts say...
• Ovum (Aug-03): US$77.8 billion revenues from information and entertainment services globally in 2007 (traffic and content) In 2005, mobile operators will make US$22.3 bil; others US$15.5 billion.
• Gartner (Aug-03): US$39.7 billion, mobile data revenues, Western Europe, 2007.

What the forecasts say...
• Yankee Group (Feb.-04): Operator data ARPU, Western Europe, up from €4.89/mo in 2003 to nearly €10 in 2007. One-third of subs active MMS users in 2007.

What the forecasts say: video
• Strategy Analytics (Jan-04): 150 million mobile video users worldwide, revenues US$4.7 billion in 2008
• Yankee Group: €4 billion mobile video market, Western Europe, 2007. Streamed and downloaded entertainment content lead the market in 2004-05
What the forecasts say: games
• IDC (Dec-03): 65.2 million U.S. mobile gamers by 2008 (34.7% of all subs)
• Analysys (Nov-03): €3 billion mobile gaming market, Western Europe, 2008. Around 80% from downloadable games. (Total WE mobile entertainment and content market around €15.8 bil.)

Mobile entertainment revenues(US$27,463 mil. in 2008), by application

Mobile Entertainment, share of revenues (%)2008
20%
6%
30%
14%6%
24%
Games Images Gambling Music Adult Video

Worldwide Handset Features Roadmap 2001-2008
Cameras
Colour Display
Java
Bluetooth
EMS
MMS
Streaming Video
Feature Launched- Penetration<50%
Penetration>50%
2001 2003 2004 2005 2006 20072002 2008
Slot-in Memory
GPS/A-GPS

Global java handsets, mil.
Source: ARC, March 2004
0
100
200
300
400
500
600
2004 2005 2006 2007 2008
Java handsets

Global camera-phones, mil.
0
50
100
150
200
250
2003 2004 2005 2006 2007 2008
0.0%5.0%
10.0%15.0%20.0%25.0%
30.0%35.0%
Camera phones (integrated) % total handsets
Source: ARC, mid-03

MMS handset penetration, end-03
mmO2 Group 2.7Vodafone UK 3.1Vodafone Gernany 3.0Vodafone Italy 1.9TIM Italy 7.7Telefonica Spain 5.8mobilkom Austria 7.7Orange UK 6.0Orange France 5.1T-mobile Germany 3.0T-mobile UK 4.5
Source: Exane

SMS per sub per month, 4Q03France Orange France 16.34
SFR 24.01Bouygues 18.73
Germany T-Mobile 37.39E-Plus 38.68Vodafone D2 37.39O2 Germany (Viag Interkom) 28.79
Greece Cosmote 38.99Vodafone (Panafon) 40.27Stet Hellas 31.00
Italy TIM 35.81Wind 40.03
Spain Telefonica 53.32United Kingdom O2 UK (BT Cellnet) 54.53
T-Mobile (One2One) 23.35Orange 33.63Vodafone 31.67
Source: Mobile Media: Operator data, Baskerville estimates

Ring tone market estimates
• 2003 global: €3 billion (Consect, industry consensus)
• 2003 Europe: €1 billion
• 2003 UK: €50-60 million

Ring tones in Japan• JASRAC* mobile-related revenues nearly
doubled in the year to March 2003• ¥7.32 billion (US$ 61.2 million) from ‘wire
diffusion’ (95% mobile) = 7% of total revenues
• Mobile takings 185% higher than JASRAC forecast
*Japan collection society
Source: Music & Copyright

MMS traffic/users, selected ops.
Operator Total subsMMS-enabled
subs MMS active usersActive users as %
subs
Average MMS usage
per active user per month
MMS traffic (per
month, unless noted)
Vodafone Australia 2,416 840 36,000 n/a n/a n/a
Up to 35,000
MMSes in one day
Proximus, Belgium 4,218,000 n/a100,000 (Aug
2003) 2.37 n/a n/a
Eurotel Praha, Czech Rep. 4,019,000 n/a 88,000 (Oct 2003) 2.2 n/a n/a
O2, Germany* 5,250,000 n/a n/a n/a n/a 953,000 in 2Q03
Cosmote, Greece 4,208,000 n/a 130,000 3.1 3.2 416,000
Maxis, Malaysia 3,705,000 70,000 40,000 1.08 n/a n/a
Telenor, Norway 2,330,000 n/a n/a n/a n/a
1.6 million (free
MMSes, Jul 2003)
MobileOne, Singapore 1,066,000 159,000 103,935 9.75 5-7 519,675-727,545
DTAC, Thailand 6,256,634 n/a Adds 30,000/mo. n/a n/a65,670 (2Q03
monthly average)
Etisalat, United Arab Emirates 2,314,410 n/a 200,000 8.64 n/a n/a
O2 UK 12,600,000 ** n/a n/a n/a 1.6 million in 2Q03
T-mobile, Worldwide >80,000,000 n/a***** n/a*** n/a n/a
15 million MMSes
sent Jan-Oct 2003
Source: Mobile Media, Dec. 03

Mobile games market
• Sony Pictures Mobile: 4.5 million games downloads 1Q04 (U.S. top, Europe 2nd)
• Top Gun – more than 500,000 DL• Anno 1503 100,00 DL on German portal Jamba by end-03• MobileScope: Games average 100,000 DL• Mobile games provider Jamdat: US$1 million in revenues from
BREW/month (globally)• Mobile games service provider In-Fusio: profitable, 2003
revenues: €11.3 mil.; more than 1.6 mil. active players
Source: Mobile Media, Mobile Games Analyst

Mobile video market
• Increasing number of handsets, many operators offering services
• Range of aggregators in the market• Penetration, price• 20% of DoCoMo (Japan) 3G users
access video services

Mobile content market today
Personalization is proven...
...communication is proven...
...but paid mobile content consumption is not!

NTT DoCoMo, Japan
• 40.46 million i-mode online mobile data subs (total subscriber base: 45.43 mil.)
• Content typically YEN100-300/month (US$0.95-2.84). Upper limit recently increased to YEN500
• DoCoMo takes 9% of content revenues in billing charges.
• Estimated that DoCoMo takes 90% of total revenues for content (traffic+content charges)

But
52%...of i-mode users pay for content
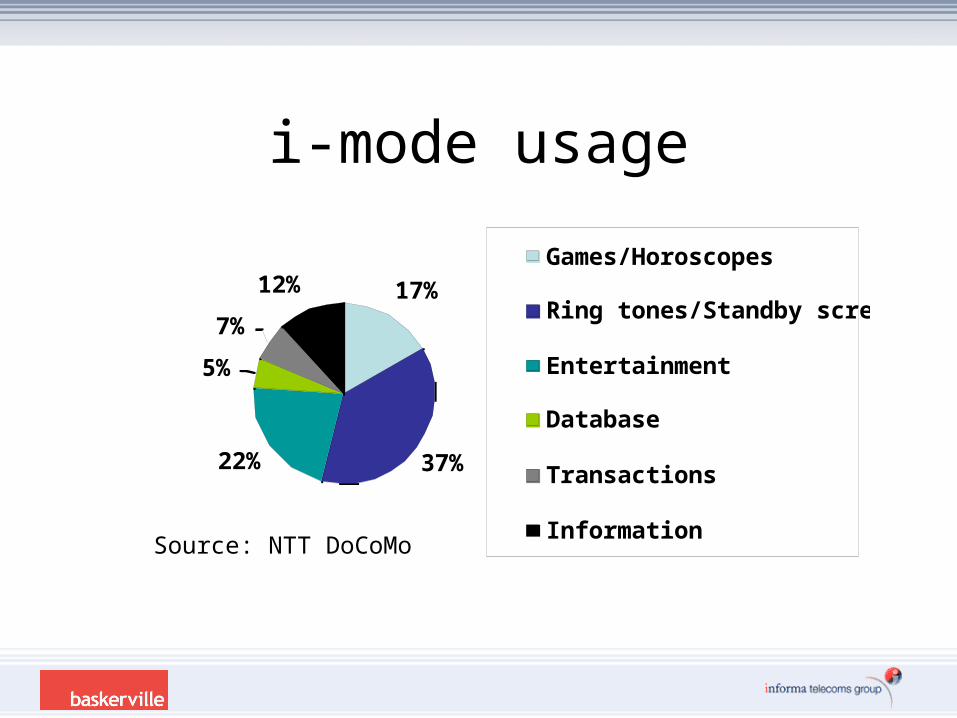
i-mode usage
17%
37%22%
5%
7%
12%Games/Horoscopes
Ring tones/Standby screens
Entertainment
Database
Transactions
InformationSource: NTT DoCoMo

Some of the hurdles
• Technology fragmentation• DRM• Business models and business relationships• Billing; revenue leakage• Uncertain market

If you send pictures from your mobile phone, how often are they recieved, in good quality, by the recipient?
18.52%
34.26%9.26%
13.89%
14.35% Never
I don't know
Rarely
Sometimes
Most of the time
Source: Mobile Media/SMS.ac 2004
Mobile
• Data: Typically 10-15% of mobile operator revenues.
• Aim: grow this to 20-25%

Music & media
• Mobile: Growing share of media’s interactive revenues, but very small share of total income

The big squeeze
40-50%?
?
Mobile
40-50%?
Media
Top Related