


Languages
Pages
Legal


Wes
te
rnAustr li
Wes
te
rnAustrali
Investment Attraction DivisionDepartment of Industry and ResourcesThe Atrium, 168-170 St Georges TerracePerth Western Australia 6000
Phone: +61 8 9327 5496Fax: +61 8 9222 3862
Email: [email protected]
This publication is available on our website
www.doir.wa.gov.au
For further information on the mineral and petroleum resources of Western Australia to complement this publication please refer to:
• Western Australia Mineral Exploration and Development
• Western Australia Atlas of Mineral Deposits and Petroleum Fields 2003
• Western Australian Oil and Gas Industry 2002
• A Guide to Petroleum Exploration and Production in Western Australia
• Prospect magazine
ssssttttttttrr iiAAAAAAuussuussssssttrraaaaaa
Mineral and PetroleumStatistics Digest
2001-02

WESTERN AUSTRALIA MINERAL AND PETROLEUM STATISTICS DIGEST 2001–02 i
CONTENTS
FOREWORD 1
1. ECONOMIC AND SOCIAL ENVIRONMENT 2
1.1 Global Economy 2
1.2 National and Western Australian Economic Context 4
1.3 Policy Issues Affecting the Mining Industry 6
2. EXPLORATION AND INVESTMENT 10
2.1 Mineral Exploration 10
2.2 Petroleum Exploration 10
2.3 Investment 11
3. RESOURCE FOCUS 2001–02 13
3.1 Overview and Outlook 13
3.2 Commodity Price Index 14
3.3 Petroleum 15
3.4 Iron Ore 20
3.5 Alumina 24
3.6 Gold 26
3.7 Nickel 29
3.8 Mineral Sands 33
3.9 Diamonds 37
3.10 Base Metals 39
3.11 Other Minerals 39
TABLES
1. Quantity and Value of Minerals and Petroleum 42
2. Quantity and Value of Selected Major Commodities 44
3. Quantity and Value of Minerals and Petroleum by Local Government Area 46
4. Royalty Receipts 2000–01 and 2001–02 52
5. Average Number of Persons Employed in the WA Mineral and Petroleum Industries 54
6. Principal Mineral and Petroleum Producers 2001–02 58
ABBREVIATIONS, REFERENCES, UNITS AND CONVERSION FACTORS 62
DATA SOURCES 63
The Statistics Digest has been compiled in good faith by the Department of Industry and Resources from information and data gathered
in the course of the Digest’s production. The Department believes information contained in this document is correct and that any
opinions and conclusions are reasonably held or made as at the time of compilation. However, the Department does not warrant
their accuracy and undertakes no responsibility to any person or organisation in respect of this publication.
WESTERN AUSTRALIA MINERAL AND PETROLEUM STATISTICS DIGEST 2001–02ii WESTERN AUSTRALIA MINERAL AND PETROLEUM STATISTICS DIGEST 2001–02 1
LIST OF FIGURES
Figures Page
1.1 Exchange Rate US$/A$ 5
1.2 Exchange Rate Trade Weighted Index 5
1.3 Tenements in Force Act 1978 7
2.1 Mineral Exploration Expenditure, WA versus Australia 10
2.2 Petroleum Exploration Expenditure, WA versus Australia 11
2.3 Mining Investment, WA versus Australia 11
3.1 Major Commodities by Value 2000–01 and 2001–02 13
3.2 Sales by Commodity 13
3.3 Commodity Price Index 15
3.4 Petroleum Exports 15
3.5 Crude Oil Exports 15
3.6 TAPIS Crude Oil Price 16
3.7 Crude Oil and Condensate - Quantity and Value by Quarter 16
3.8 Crude Oil and Condensate Quantity, WA versus Australia 17
3.9 Condensate Exports 18
3.10 Gas Sales 18
3.11 Iron Ore Exports 20
3.12 Iron Ore Price 20
3.13 Iron Ore — Quantity and Value by Quarter 21
3.14 Iron Ore Quantity, WA versus Australia 21
3.15 Alumina Exports 24
3.16 Alumina Price 24
3.17 Alumina — Quantity and Value by Quarter 25
3.18 Alumina Quantity, WA versus Australia 25
3.19 Gold Exports 26
3.20 Gold Price 27
3.21 Gold — Quantity and Value by Quarter 27
3.22 Gold Production, WA versus Australia 28
3.23 Nickel Exports 29
3.24 Nickel Price 29
3.25 Nickel — Quantity and Value by Quarter 30
3.26 Nickel Quantity, WA versus Australia 30
3.27 Heavy Mineral Sands Exports 34
3.28 Heavy Mineral Sands — Value by Quarter 34
3.29 Heavy Mineral Sands Price Index 34
3.30 Heavy Mineral Sands Value of Production, WA versus Australia 36
3.31 Selected WA Commodities Relative to World Production 41
Local Government Boundaries (map) 64
Major Mineral and Petroleum Projects in Western Australia (map) 65
WESTERN AUSTRALIA MINERAL AND PETROLEUM STATISTICS DIGEST 2001–02ii WESTERN AUSTRALIA MINERAL AND PETROLEUM STATISTICS DIGEST 2001–02 1
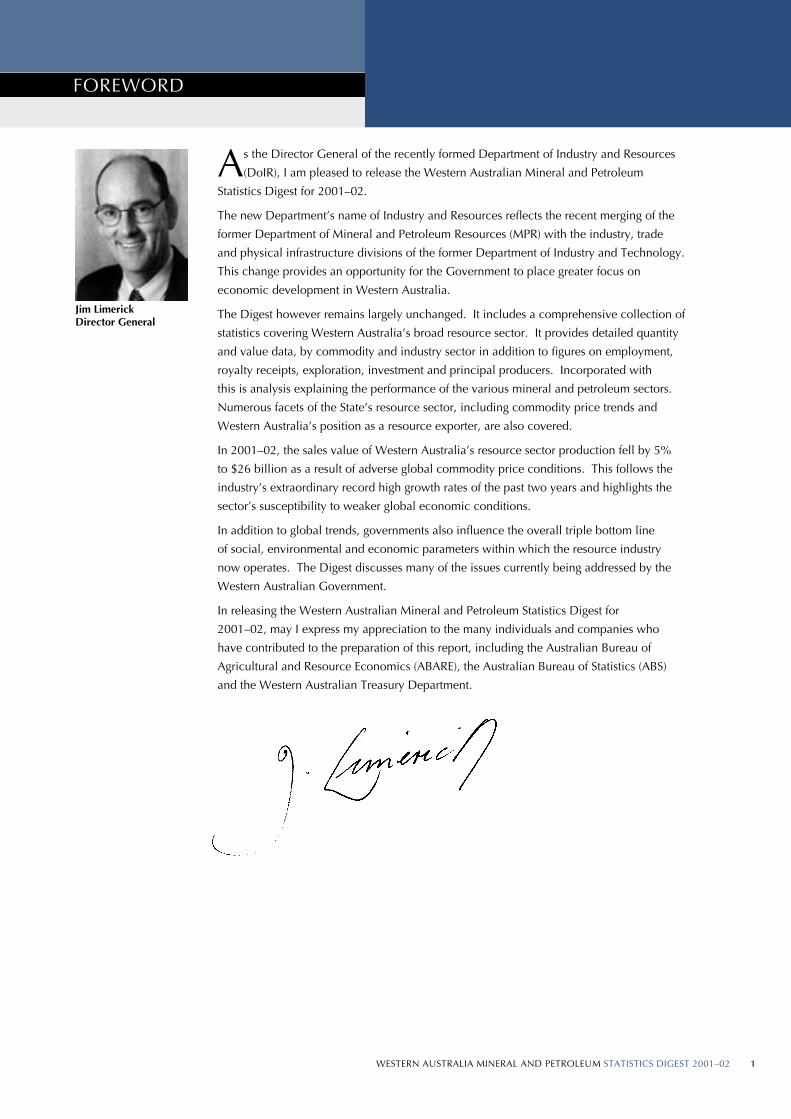
FOREWORD
As the Director General of the recently formed Department of Industry and Resources
(DoIR), I am pleased to release the Western Australian Mineral and Petroleum
Statistics Digest for 2001–02.
The new Department’s name of Industry and Resources refl ects the recent merging of the
former Department of Mineral and Petroleum Resources (MPR) with the industry, trade
and physical infrastructure divisions of the former Department of Industry and Technology.
This change provides an opportunity for the Government to place greater focus on
economic development in Western Australia.
The Digest however remains largely unchanged. It includes a comprehensive collection of
statistics covering Western Australia’s broad resource sector. It provides detailed quantity
and value data, by commodity and industry sector in addition to fi gures on employment,
royalty receipts, exploration, investment and principal producers. Incorporated with
this is analysis explaining the performance of the various mineral and petroleum sectors.
Numerous facets of the State’s resource sector, including commodity price trends and
Western Australia’s position as a resource exporter, are also covered.
In 2001–02, the sales value of Western Australia’s resource sector production fell by 5%
to $26 billion as a result of adverse global commodity price conditions. This follows the
industry’s extraordinary record high growth rates of the past two years and highlights the
sector’s susceptibility to weaker global economic conditions.
In addition to global trends, governments also infl uence the overall triple bottom line
of social, environmental and economic parameters within which the resource industry
now operates. The Digest discusses many of the issues currently being addressed by the
Western Australian Government.
In releasing the Western Australian Mineral and Petroleum Statistics Digest for
2001–02, may I express my appreciation to the many individuals and companies who
have contributed to the preparation of this report, including the Australian Bureau of
Agricultural and Resource Economics (ABARE), the Australian Bureau of Statistics (ABS)
and the Western Australian Treasury Department.
Jim LimerickDirector General

WESTERN AUSTRALIA MINERAL AND PETROLEUM STATISTICS DIGEST 2001–022 WESTERN AUSTRALIA MINERAL AND PETROLEUM STATISTICS DIGEST 2001–02 3
1.1 Global Economy
The world economy recovered slowly during most
of 2002, driven by growth in the United States.
However, early expectations for a sustained and robust
recovery, based on rapid growth in the US in the fi rst
quarter of 2002, were revised down. This was due to
sharp declines in global sharemarkets, uncertainties
in the Middle East and associated oil price rises. The
inability of the major economies to move into sustained
growth refl ects these broad global factors combined
with others more specifi c to each economy.
United StatesGlobal recovery to date has depended heavily on the
strong growth recorded by the US economy in late
2001 and early 2002. For example, US demand for
Japanese exports helped offset weak domestic Japanese
growth. Improved trade in the electronics trade, lifted
by US growth, also added to strong domestic growth
experienced in Non-Japan Asia. US demand also drove
European export growth, compensating for sluggish
domestic growth, notably in Germany.
Inventory building and strong consumer spending
drove the initial recovery in the US in early 2002,
with the latter refl ecting low interest rates, wages
growth and rising housing prices. However, since
early 2002, growth in the US economy has slowed
signifi cantly, driven by sharply higher imports and
softer consumption amid rising uncertainty in the US
economy.
Business investment, the key driver of economic
growth, has remained weak, in part explaining the
sluggishness of the recovery in the US to date. This
weakness has persisted because the strong investment of
recent years up to 2001, particularly in manufacturing
and information technology, led to over-capacity. The
combination of this over-capacity and rising uncertainty
about the growth prospects for the US economy have
caused US businesses to put off investment spending.
As a result, unemployment has continued to drift up
from its 2001 trough of 3.9% to near 6%, placing a
potential constraint on household spending.
Rising uncertainty in the US has partly been driven by
continued sharp declines on US, and international,
stock markets. These declines have refl ected concerns
about corporate governance, downward revisions of
previous excessively optimistic profi t expectations and
signs that the strong growth of early 2002 was fading.
The US dollar has also fallen sharply against the Euro
and Yen refl ecting the above concerns and the rising
US current account defi cit. Concerns about the pace
of the recovery have also led to a sharp weakening of
consumer and investor confi dence from early 2002
highs.
Into this rising uncertainty and reduction in US wealth
has been thrown the rising international political
tensions surrounding Iraq and the spate of terrorist
attacks in a range of economies including Indonesia and
the Middle East more generally.
The outlook for the US economy depends to a signifi cant
degree on the extent to which lower equity prices
and rising global tensions lead to lower consumption
growth and/or a further delay in recovery in investment
spending. While some economists have pointed out that
long-term interest rates have fallen to very low levels
and thus should support US investment, to a signifi cant
degree the decline in rates has refl ected market concerns
about the weakness in recovery and associated fl ows of
capital out of equities into safer long-term bonds. The
outlook for investment therefore partly depends on the
extent to which low interest rates counterbalance the
gloom about the economy and the reductions in equity-
based wealth that has caused them. As Japan’s case
indicates, the outcome is not always positive.
A lower US dollar should boost the positive impact
of lower long-term interest rates by lifting export
competitiveness (though a lower dollar may retard the
very weak growth in other major economies, notably
Japan, whose growth to date has depended on exports to
the US).
On a positive note, there have been signs that investment
is beginning to improve, notably in terms of software and
capital equipment spending. In addition, oil prices have
fallen since earlier peaks, increasing the spending power
of consumers. On balance, therefore, the US economy
should continue its mild recovery, though consumption
and investment are likely to be signifi cantly softer than
previously expected.
One of the key risks to this benign outlook is that
the equities market continues to sag, causing further
1. ECONOMIC AND SOCIAL ENVIRONMENT

WESTERN AUSTRALIA MINERAL AND PETROLEUM STATISTICS DIGEST 2001–022 WESTERN AUSTRALIA MINERAL AND PETROLEUM STATISTICS DIGEST 2001–02 3
erosion in consumption and investment plans to be
further delayed. High levels of consumer and business
debt have the potential to exacerbate this factor in
two ways. If investors and consumers decide that the
associated decline in wealth and ongoing uncertainty
about employment and economic growth requires
balance sheet rebuilding, households will lift savings
and reduce consumption and firms will cut back on
investment. Second, if further falls in equities add to
the uncertainties in the economy, financial institutions,
in a climate of rising bad debts, may decide to restrict
access to finance, reducing the ability of households
and investors to borrow.
Another risk is that further instability in the Middle
East causes oil prices to rise sharply. Sharp rise in fuel
prices would reduce real consumer spending and raise
business costs, reducing profitability.
JapanFollowing the third and most severe contraction in the
Japanese economy in the past ten years, economic
activity seems to have bottomed. The current outlook is
for a modest recovery in 2003.
Activity accelerated mildly in the first half of 2002
driven by net exports and industrial production has
picked up in response. Domestic demand however,
particularly household consumption, has remained very
weak, raising questions about the sustainability of any
recovery. Prices have continued to fall, exacerbating
consumers’ tendency to wait and see before
spending. Lack of domestic demand has provided a
disincentive for businesses to invest and consequently
unemployment has resumed its drift upwards to 5.4% in
July 2002.
As with the US, business investment remains a weak
link, with investment falling since the beginning of 2001
reflecting lower production and corporate earnings.
There are, however, signs of an initial stabilisation.
Shipments of capital goods, which had fallen since
early 2001, have stopped declining and software
investment has started a reasonable recovery. More
recently, business surveys including the Bank of Japan’s
tankan (Short-Term Economic Survey of Enterprises)
suggest that business investment is on the verge of
picking up. However, with weak retail sales and rising
unemployment, any lift is likely to be modest.
Significant excess capacity remains and price deflation
continues to increase the real debt burden on firms and
the financial sector. The balance sheets of the latter
are further weakened by falling equity and land prices,
restricting the ability of the sector to lend to willing
investors. Macroeconomic policy, with official interest
rates already at zero and gross public debt at around
140% of GDP, is proving ineffective in dealing with
these problems.
The outlook is for an improvement in domestic
demand with household consumption rising and, as
noted, business investment slowly recovering. Stronger
import demand as consumption and investment rise,
combined with the rise of the Yen against the US dollar
will weaken net exports’ contribution to growth. Tax
cuts will offset some of the negative impact of fiscal
consolidation on spending.
The key risks to the economy are on the downside and
to a large degree external. A deterioration in global,
particularly US, growth or a further appreciation of the
Yen, would reduce net exports. Internally, further falls
in equity prices would erode fragile confidence and the
precarious state of the banks.
While a mild recovery is in prospect, the lack to date of
concerted structural reform in the Japanese economy is
the underlying cause of ongoing weakness in economic
growth. Banking reform, including the reduction of
bad debts and re-capitalisation of viable banks and
corporate restructuring are vital in the process of
boosting the attractiveness of investment in Japan. The
fact that the short-term costs, particularly in terms of
unemployment, of such restructuring are likely to be
high may be a political constraint on such changes
taking place in the short term.
EuropeRecovery in European economic growth has lagged
behind that of the US, Canada and much of Asia.
As in the case of Japan, growth in Europe has been
driven by net exports rather than domestic growth with
exports rising and imports actually falling.
Household consumption is weak and investment has
yet to recover from its 2001 slump. Recent indicators of
retail sales, GDP and business confidence, particularly
in Germany and Italy, have been softer than expected.

WESTERN AUSTRALIA MINERAL AND PETROLEUM STATISTICS DIGEST 2001–024 WESTERN AUSTRALIA MINERAL AND PETROLEUM STATISTICS DIGEST 2001–02 5
Growth performance across the regional economies has
varied widely, with Germany, Italy, Austria, Belgium
and the Netherlands performing less well relative to the
United Kingdom, France, Spain, Greece and Ireland.
Positive factors supporting the European growth outlook
are the likely end of the stock cycle so that production
rises to lift inventories, underpinned by stronger
consumption spending. The latter reflects higher
wages and employment growth and modest inflation.
Investment should be boosted by improved corporate
earnings and falling levels of capacity utilisation.
There are a number of risks to the outlook. Weaker
world growth and/or further appreciation of the Euro
would reduce the stimulus from net exports. While
Europeans are not as exposed to equities as US investors,
European markets have fallen further in recent quarters
than their US counterparts. Further falls have the
potential to dampen consumer demand and put pressure
on financial sector balance sheets, reducing the latter’s
capacity to lend. There have been signs of some equity-
related financial sector difficulties already.
The German economy is of some concern, given its
relatively dominant role in the European economy,
with an uncertain outlook for industrial production and
domestic demand. Generalised weakness in Germany
would be a significant drag on Europe as a whole.
Non-Japan AsiaIn contrast with other regions, the Asian region
(excluding Japan) has seen a stronger than expected
recovery in growth from the recession of 2001.
Stronger growth in global trade, particularly in electronic
goods, has provided the key boost to growth prospects.
However, domestic demand growth in some instances,
notably China, India and South Korea, has played an
important role. Macroeconomic policy, notably fiscal
policy in South Korea, has contributed to kick-starting
sustained growth.
The International Monetary Fund’s current forecast
outlook for the region is for a mild acceleration in
growth, specifically, in the newly industrialised Asian
economies from 4.7% in 2002 to 4.9% in 2003 and in
the developing Asian economies, from 6.1% in 2002 to
6.3% in 2003. China is expected to slow mildly from
growth of 7.5% in 2002 to 7.2% in 2003.
The key risk to the outlook is that global growth is
disappointing, removing one of the underpinnings
present in the strong performance to date.
Global OutlookSupportive macroeconomic policies in the major
economies, in the context of ongoing low inflation,
should allow a modest recovery to continue. However,
there is significant uncertainty in the outlook and there
are major risks on the downside reflecting the potential
for further financial market weakness (and associated
possibility of systemic financial sector problems), higher
oil prices due to Middle East instability and terrorist
activity.
The outlook for the global economy as outlined in the
International Monetary Fund’s September 2002 World
Economic Outlook is for slower than expected, but still
improving, growth into 2003.
1.2 National and Western Australian Economic Context
Both the Australian and Western Australian economies
saw continued strong economic growth in the first half
of 2002 and beyond despite only weak growth in the
international economy and export markets.
The Australian economy grew by 3.8% in the year
to June 2002, with domestic demand growing very
strongly by 6.9%. Key contributors to growth over the
year were strong increases in household consumption
and dwelling investment as well as a recovery in
business investment. As expected, given strong
domestic and weak international growth, net exports
detracted significantly from growth.
The Western Australian economy showed similar
growth patterns to the national economy through the
year. While domestic demand grew by 6.9% in the
year to June quarter 2002 in the national economy,
Western Australian domestic demand grew by 7.2%
over the same period. The State’s strong domestic
growth was underpinned by ongoing dwelling
investment, higher business investment and strong
household consumption.
While the global outlook has worsened over the past
six months, Australia’s position has remained relatively
strong.
Employment has grown, providing solid support to
consumer spending. Levels of housing finance and
dwelling approvals have been maintained longer

WESTERN AUSTRALIA MINERAL AND PETROLEUM STATISTICS DIGEST 2001–024 WESTERN AUSTRALIA MINERAL AND PETROLEUM STATISTICS DIGEST 2001–02 5
than expected following the winding down of the
Government’s expanded First Home Owners Grant and
business investment and consumption growth have
continued to expand, consistent with economic growth
of about 4% a year. This strength has withstood the
negative impact of a severe drought on the rural sector
and slowdown in the US, Europe and Japan.
The Reserve Bank of Australia (RBA) has faced a
dilemma in monetary policy-making until recently.
Ordinarily, with the official interest rate at 4.75% (in
October 2002), below the Bank’s estimated neutral
rate and the economy growing strongly with inflation
already above the mid-point of its target range, the
RBA would have continued its series of small increases
begun in May and June of 2002. The strong rises in
housing prices and related borrowing taking place in
recent quarters would have added justification to this
approach.
However, given the significant economic and political
uncertainties besetting an unexpectedly weak global
recovery, the RBA has held rates at 4.75% and is likely
to be highly cautious during 2002–03 in determining
whether further tightening of monetary policy is
justified. The expected detraction from growth due
to the drought’s effect on the rural sector, external
uncertainties and the current lack of price and wage
pressures in the domestic economy will be key factors
in the Bank’s decisions.
Alternatively, if the world economy picks up strength
and domestic growth continues, the RBA may resume a
modest series of interest rate increases. This will aim to
avert the possibility that inflationary pressures become
entrenched in the economy, requiring larger increases
in rates later.
Exchange RateFollowing a period of appreciation beginning in the
second half of 2001, the Australian dollar fell against
major currencies from June 2002.
The early appreciation was driven by a number of basic
factors including:
• rising and expectations of further strengthening in
global growth;
• rising commodity prices;
• falling risk aversion to peripheral and growth-
driven currencies like the Australian dollar; and
• expectation that Australian interest rates would
likely rise more quickly than those in other
economies due to Australia’s relatively strong
growth rate.
Since then, these factors have generally turned around
and in early November 2002, the Australian dollar was
around 4% lower against the Yen, 2% lower against
the US dollar, 7% lower against the Euro and 3% lower
against the trade weighted index (TWI).
Driving these modest falls have been:
• deterioration in actual and expected global growth
reflecting the slowdown in the US economy;
• ongoing volatility in equity markets;
• rising risk aversion to peripheral currencies due to
developments relating to Iraq and the war on terror;
and
• reduced expectations of further RBA monetary
policy tightening.
EXCHANGE RATE US$/A$
0.48
0.50
0.52
0.54
0.56
0.58
0.60
Jul-00 Jan-01 Jul-01 Jan-02
US$
Source: Reserve Bank of Australia Figure 1.1
Jun-02
EXCHANGE RATETRADE WEIGHTED INDEX(units of foreign currency per A$)
45.00
47.50
50.00
52.50
55.00
Jul-00 Jan-01 Jul-01
(May 1997 = 100)
Jun-02
Source: Reserve Bank of Australia Figure 1.2

WESTERN AUSTRALIA MINERAL AND PETROLEUM STATISTICS DIGEST 2001–026 WESTERN AUSTRALIA MINERAL AND PETROLEUM STATISTICS DIGEST 2001–02 7
Providing some support to the currency has been the
strong domestic growth that Australia continues to
experience.
The outlook for the Australian dollar remains governed
by the factors identified above. Continued declines in
equity markets, weaker global growth prospects and
ongoing increases in risk aversion, if terrorist attacks
like those experienced in Bali persist, would likely put
downward pressure on the Australian dollar. However,
if global economic and political prospects improve and
financial markets stabilise, the Australian dollar may
resume the appreciation begun earlier in 2002.
1.3 Policy Issues Affecting the Mining Industry
Native TitleA major development in Native Title in 2002 was the
resolution of the Ward High Court decision, in which
the Court found that the Miriuwung and Gajerrong
people had significant native title rights over a large
area of land in the East Kimberley. The Court found
that native title did not entail any rights over minerals
or petroleum under the ground where native title
may apply. This has positive implications for current
methods of collecting royalties on minerals and
petroleum. The Court also found that the grant of a
mining title did not wholly extinguish native title, but
did extinguish the right to be asked permission or to
have access in relation to the whole of the area of the
lease.
A State Government initiative to improve the fairness
and workability of the Native Title regime was the
Wand Review of the State Government’s General
Guidelines for Native Title Determinations and
Agreements. The Review was released in November
2001. Among its key recommendations were:
• A summit of Government, the Federal Court, peak
bodies and claimants to coordinate the resolution
of native title applications;
• Rigorous assessment of evidence of connection to
the country;
• Enhanced access to Government records that could
assist claimants in compiling evidence in support of
their application;
• An overhaul of State land use and management
laws to integrate processes for the recognition of
native title and other rights of traditional owners;
and
• A public education campaign to encourage
agreement making.
Progress is being made on implementing the
recommendations of the Review. Evidence guidelines
for native title claimants were released by the Deputy
Premier on 8 October 2002.
The Keating Review of the Project Development Approvals SystemIn September 2001, the Minister for State Development
appointed Dr Michael Keating to chair a review of the
Project Development Approvals System. The Review
Committee released an interim report in late January
2002 for a period of public comment which was
completed in February 2002.
The main recommendations of the Review were:
• Reducing the jurisdiction of the Wardens Court
with a commensurate expansion of the role of the
Environmental Protection Authority (EPA);
• Greater use of timelines to improve levels of
certainty and predictability, with a ‘stop the clock’
mechanism to ensure that project approvals facing
deadlines are not penalised for events beyond their
control;
• Allowing the State to undertake environmental
assessments on behalf of the Commonwealth; and
• An integrated approvals system for projects of ‘State
significance’.
A Ministerial committee is now considering the Keating
Review’s recommendations into streamlining the
approvals process and recommendations from this
report will be considered by Cabinet in the near future.
Technical Taskforce on Processing of Mining, Exploration and Land Title ApplicationsIn April 2001, the Government established a Technical
Taskforce to assess how mineral, petroleum and land
title applications can be dealt with more efficiently,
while recognising and protecting the native title rights of
Indigenous people.
The Taskforce released a discussion paper in August
2001, which set out options for reducing the current
backlog of some 11,000 tenement applications and
preventing a backlog developing in the future. The

WESTERN AUSTRALIA MINERAL AND PETROLEUM STATISTICS DIGEST 2001–026 WESTERN AUSTRALIA MINERAL AND PETROLEUM STATISTICS DIGEST 2001–02 7
Taskforce also provided its preferred option for dealing
with exploration and mining title applications. The final
report of the Taskforce was released by the Government
in December 2001.
One of the key recommendations of the taskforce was
the introduction of extended exploration licences to
mitigate the need for explorers to take up mining leases,
with the consequent deferral of native title processes
until productive mining is to take place.
Action on the Taskforce’s recommendations is
progressing. In March 2002 Cabinet approved funding
for eleven additional case management/liaison/education
staff ($2.9 million over four years), with four to be
allocated to MPR and the remaining seven to support
Native Title Representative Bodies.
Ministerial Inquiry into Greenfields Exploration in Western AustraliaIn April 2002, the Government announced a ‘Ministerial
Inquiry into Greenfields Exploration’ chaired by
Mr John Bowler, MLA, Member for Eyre.
The purpose of the Inquiry was to investigate the reasons
for reduced levels of private investment in greenfields
exploration in Western Australia. Also, the Inquiry was
to recommend ways in which Government can achieve
a level of exploration expenditure necessary for a
sustainable future for the resources industry.
The completed Inquiry, representing the first review
of its kind ever undertaken in Australia, was handed
to State Development Minister Clive Brown in early
November 2002.
The report contained recommendations designed to
lay the foundation for new strategies to encourage
exploration expenditure. The Inquiry found that
tackling the backlog of unprocessed mining title
applications in line with addressing the issue of native
title was pivotal to restoring the industry.
Other key recommendations of the Inquiry included:
• Increased provision of regional geoscientific data;
• Changes to the heritage protection procedures and
support for native title bodies to expedite access to
land;
• Establishment of a greenfields exploration title; and
• The introduction of investment incentives for
smaller exploration companies such as flow-
through share schemes.
The Inquiry received 37 submissions from across the
resource industry including the Association of Mining
and Exploration Companies, Western Australian
Chamber of Minerals and Energy, Amalgamated
Prospectors’ and Leaseholders’ Association and the
Australia Petroleum Production and Exploration
Association.
A total of 33 recommendations were contained in the
Inquiry’s report and the report was open for public
comment until mid-December 2002.
House of Representatives Inquiry into Resource Exploration ImpedimentsOn 24 May 2002, the Commonwealth Minister
for Industry, Tourism and Resources, the Hon. Ian
Macfarlane MP, advised that the Standing Committee
Tenements in Force 1978 Act
1996–97 1997–98 1998–99 1999–00 2000–01 2000–02
Number 000 ha Number 000 ha Number 000 ha Number 000 ha Number 000 ha Number 000 ha
Prospecting Licences 8,212 1,100 7,525 992 6,242 809 5,827 745 5,512 711 4,964 635
Exploration Licences 4,718 38,279 4,505 35,993 3,463 23,732 3,394 20,687 3,162 18,152 2,899
Mining Leases 5,180 2,047 6,690 2,031 7,555* 2,263 4,865 1,829 4,841 1,803 4,820 1,774
Other 1,537 89 1,584 205 2,001 468 3,625 2,840 3,618 3,002
Mineral Claims & Other 1904 Act 310 34 309 34 307 34 194 22 186 21 186 22
Total 19,647 41,515 19,029 39,255 17,567 26,838 16,280 23,751 17,326 23,829 16,487
23,988
* Includes Other Source: MPRFigure 1.3

WESTERN AUSTRALIA MINERAL AND PETROLEUM STATISTICS DIGEST 2001–028 WESTERN AUSTRALIA MINERAL AND PETROLEUM STATISTICS DIGEST 2001–02 9
on Industry and Resources (chaired by The Hon. Geoff
Prosser, MP) would inquire into and report on any
impediments to increasing investment in mineral and
petroleum exploration in Australia, including:
• An assessment of Australia’s resource endowment
and the rates at which it is being drawn down;
• The structure of the industry and role of small
companies in resource exploration in Australia;
• Impediments to accessing capital, particularly by
small companies;
• Access to land including Native Title and Cultural
Heritage issues;
• Environmental and other approval processes,
including across jurisdictions;
• Public provision of geoscientific data;
• Relationships with Indigenous communities; and
• Contributions to regional development.
Public submissions to the Inquiry have been sought,
and the Committee was holding public meetings at the
end of 2002 to collect further information. The State
Government has provided input into the Inquiry through
submissions drawn from the expertise gathered by
the Ministerial Inquiry into Greenfields Exploration in
Western Australia.
On 12 September 2002, the Commonwealth announced
a new action agenda for mining exploration. The
Action Agenda will address issues such as investment
incentives, Native Title rulings, land access and
environmental regulation to develop a set of strategies
for the industry to encourage further investment.
Electricity Reform Task ForceIn August 2001, the State Government established
the Electricity Reform Task Force to develop detailed
recommendations regarding the disaggregation of
Western Power; the structure of the electricity market to
be established in Western Australia; the establishment of
a Western Australian Electricity Code; and arrangements
for full retail contestability.
The main objective of the Task Force is to remove
impediments to competition and to achieve sustainable
lower electricity prices for all customers while
maintaining a uniform tariff for residential and small
business customers. This was to be done without
compromising the reliability, security, quality and safety
of electricity supply.
The structure of the electricity industry in the future is
likely to consist of competitive generation and retail
sectors, with private companies competing on an equal
footing with government entities created from Western
Power, and a State-owned transmission and distribution
company, with power being traded through bilateral
contracts and a balancing market.
The Electricity Reform Task Force also gave
consideration to the role that sustainable/renewable
energy has in reducing greenhouse gas emissions.
Two detailed Discussion Papers were released and
public comment sought. In October 2002, the Task
Force’s final report, Electricity Reform in Western
Australia, ‘A Framework for the Future’ was provided
to the Minister for Energy, the Hon. Eric Ripper, and
released publicly.
The reform proposals include converting Western Power
into three separate State-owned businesses in the South
West Interconnected System – State Generation, State
Networks and State Retail. A separate State-owned
Regional Power Corporation, independent of these
three bodies, is also proposed, to look after the interests
of regional consumers and carry out Western Power’s
current activities in the North West Interconnected
System and all other regional systems.
A key aspect of the reform strategy is disaggregation
of Western Power by separating the network activity
from its generation and retail businesses. Currently,
any independent power producer wanting to enter
the market must negotiate with Western Power – its
competitor in the generation sector – for access to its
transmission and distribution networks. This represents
a huge disincentive to private sector investment in
electricity infrastructure.
The Task Force also recommended the establishment
of a market in which buyers and sellers can trade
electricity at the wholesale level. This includes a
bilateral contract market with features to encourage
new entrants, reduce price volatility and minimise
transition costs.
Consumer interests are to be protected by the
establishment of a strong, independent regulatory
system with the retention of the uniform tariff and all
existing rebates with all retailers supplying household
customers, including State retail, obliged to offer supply

WESTERN AUSTRALIA MINERAL AND PETROLEUM STATISTICS DIGEST 2001–028 WESTERN AUSTRALIA MINERAL AND PETROLEUM STATISTICS DIGEST 2001–02 9
at or below the uniform tariff rates. The Task Force also
proposed that funding of uniform tariffs continue in a
manner consistent with current arrangements, but that the
mechanisms be made more transparent.
GreenhouseGreenhouse gas emissions control is still a source of
uncertainty for the mining and petroleum industries,
although the Commonwealth Government has stated that
it will not sign the Kyoto Protocol unless the United States
also signs and developing countries commit to greenhouse
gas reductions. Canada and Russia have indicated their
intention to ratify the Kyoto Protocol, giving the Protocol
enough signatories to come into force. In February 2002,
the Commonwealth Government signed the joint Australia-
US Climate Action Partnership to collaborate on research
into climate change, and in July 2002 announced 19 joint
projects under its auspices.
The Commonwealth and State Governments are
tackling greenhouse gas emissions through the National
Greenhouse Strategy, and are aiming to meet Australia’s
commitment under the Kyoto Protocol to reduce
greenhouse gas emissions to 108% of 1990 levels by 2010,
even if the Protocol is not ratified.
The State Government is also developing its approach to
greenhouse gas abatement through the State Sustainability
Strategy and Greenhouse Strategy. Approaches already
being implemented include:
• carbon rights legislation;
• establishment of a Sustainable Energy Development
Office;
• mandatory energy efficiency improvements for
Government agencies; and
• improving the carbon efficiency of the Western Power
network.
SustainabilitySustainability has been recognised as a major issue for
the resources industry. The World Summit on Sustainable
Development was held in Johannesburg in August/
September 2002 and gave rise to new initiatives in the
resources field such as:
• Establishment of an Association of Southeast Asian
Nations Mineral Database;
• Improving transparency of payments to governments
by the resources extraction industries;
• A global gas-flaring reduction partnership; and
• Globally harmonised system for chemical
classification and labelling.
The private sector has been active in addressing the
issues, with the Global Mining Initiative conference held
in Toronto in May 2002. The outcome of the conference
was the “Toronto Declaration”, which is a statement
of principles emphasising the role of community
engagement and accountability in achieving the goals
of economic, social and environmental sustainability. It
urges the mining industry to lead the way in achieving
industry practice that leads to sustainable outcomes. Its
priorities will form the basis of the International Council
on Mining and Minerals’ work program.
In Western Australia, the State Government has
undertaken to produce a State Sustainability Strategy.
In September 2002, the Department of the Premier
and Cabinet released a public consultation draft of the
Strategy. The State Sustainability Strategy encompasses a
broad range of policy areas and aims to identify:
• Critical sustainability issues for Western Australia;
• Barriers to achieving sustainability and how these
will be overcome;
• Actions to promote and encourage long-term
progress towards sustainability, including new
initiatives, policy and legislative change and
institutional reform;
• Short-, medium- and long-term goals for
sustainability across regions and sectors;
• Research and development required to help solve
long-term problems for sustainability;
• Examples of best-practice sustainability in different
sectors in Western Australia; and
• Means of securing ongoing commitment to
sustainability by Government, business and
community.
In regard to the mining and petroleum industries, the
Draft Strategy includes recommendations that:
• All major projects be assessed using sustainability
criteria;
• A set of sustainability operating principles be
developed for the mining sector, building on the
work of the Global Mining Initiative; and
• Transparent processes be established to improve
community awareness of the regulatory system for
mining and mineral production.
The draft Strategy was open for public comment until 10
January 2003.
WESTERN AUSTRALIA MINERAL AND PETROLEUM STATISTICS DIGEST 2001–0210 WESTERN AUSTRALIA MINERAL AND PETROLEUM STATISTICS DIGEST 2001–02 11
2. EXPLORATION AND INVESTMENT
MINERAL EXPLORATION EXPENDITURE
0
200
400
600
800
1,000
1,200
1,400
91-92 93-94 95-96 97-98 99-00 01-02
$Million
Rest of Australia
Western Australia
Source: ABS Figure 2.1
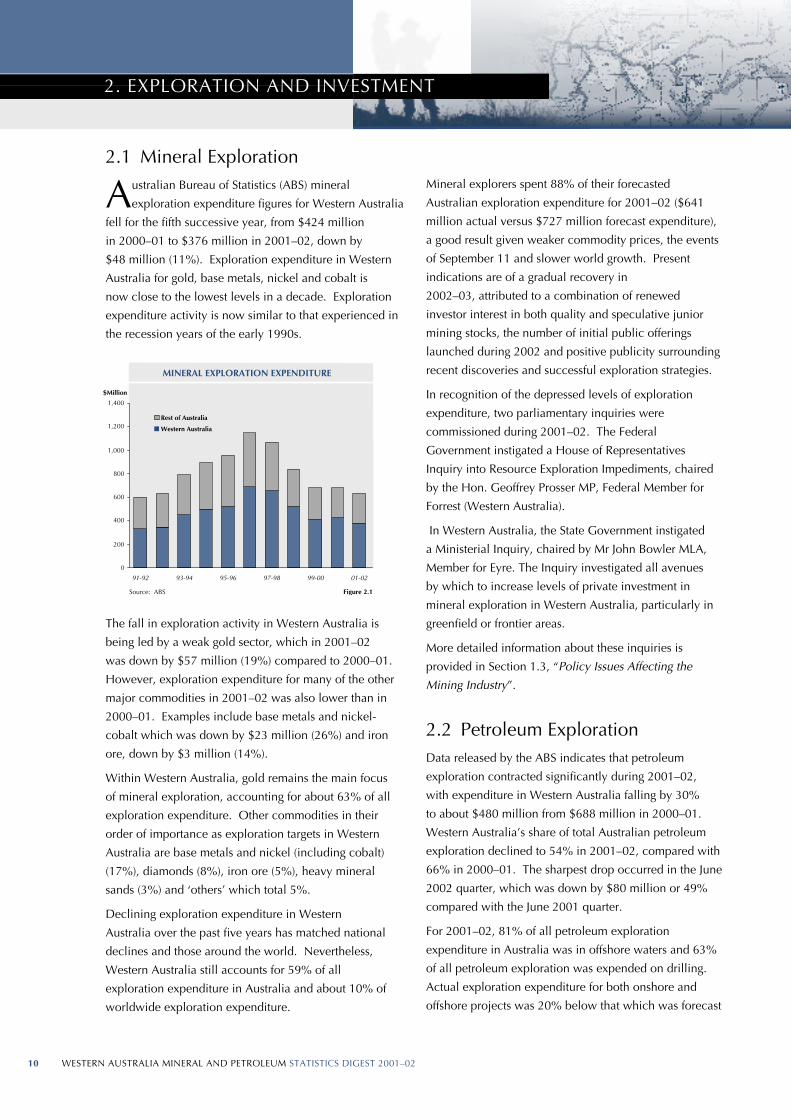
2.1 Mineral Exploration
Australian Bureau of Statistics (ABS) mineral
exploration expenditure fi gures for Western Australia
fell for the fi fth successive year, from $424 million
in 2000–01 to $376 million in 2001–02, down by
$48 million (11%). Exploration expenditure in Western
Australia for gold, base metals, nickel and cobalt is
now close to the lowest levels in a decade. Exploration
expenditure activity is now similar to that experienced in
the recession years of the early 1990s.
The fall in exploration activity in Western Australia is
being led by a weak gold sector, which in 2001–02
was down by $57 million (19%) compared to 2000–01.
However, exploration expenditure for many of the other
major commodities in 2001–02 was also lower than in
2000–01. Examples include base metals and nickel-
cobalt which was down by $23 million (26%) and iron
ore, down by $3 million (14%).
Within Western Australia, gold remains the main focus
of mineral exploration, accounting for about 63% of all
exploration expenditure. Other commodities in their
order of importance as exploration targets in Western
Australia are base metals and nickel (including cobalt)
(17%), diamonds (8%), iron ore (5%), heavy mineral
sands (3%) and ‘others’ which total 5%.
Declining exploration expenditure in Western
Australia over the past fi ve years has matched national
declines and those around the world. Nevertheless,
Western Australia still accounts for 59% of all
exploration expenditure in Australia and about 10% of
worldwide exploration expenditure.
Mineral explorers spent 88% of their forecasted
Australian exploration expenditure for 2001–02 ($641
million actual versus $727 million forecast expenditure),
a good result given weaker commodity prices, the events
of September 11 and slower world growth. Present
indications are of a gradual recovery in
2002–03, attributed to a combination of renewed
investor interest in both quality and speculative junior
mining stocks, the number of initial public offerings
launched during 2002 and positive publicity surrounding
recent discoveries and successful exploration strategies.
In recognition of the depressed levels of exploration
expenditure, two parliamentary inquiries were
commissioned during 2001–02. The Federal
Government instigated a House of Representatives
Inquiry into Resource Exploration Impediments, chaired
by the Hon. Geoffrey Prosser MP, Federal Member for
Forrest (Western Australia).
In Western Australia, the State Government instigated
a Ministerial Inquiry, chaired by Mr John Bowler MLA,
Member for Eyre. The Inquiry investigated all avenues
by which to increase levels of private investment in
mineral exploration in Western Australia, particularly in
greenfi eld or frontier areas.
More detailed information about these inquiries is
provided in Section 1.3, “Policy Issues Affecting the
Mining Industry”.
2.2 Petroleum ExplorationData released by the ABS indicates that petroleum
exploration contracted signifi cantly during 2001–02,
with expenditure in Western Australia falling by 30%
to about $480 million from $688 million in 2000–01.
Western Australia’s share of total Australian petroleum
exploration declined to 54% in 2001–02, compared with
66% in 2000–01. The sharpest drop occurred in the June
2002 quarter, which was down by $80 million or 49%
compared with the June 2001 quarter.
For 2001–02, 81% of all petroleum exploration
expenditure in Australia was in offshore waters and 63%
of all petroleum exploration was expended on drilling.
Actual exploration expenditure for both onshore and
offshore projects was 20% below that which was forecast

WESTERN AUSTRALIA MINERAL AND PETROLEUM STATISTICS DIGEST 2001–0210 WESTERN AUSTRALIA MINERAL AND PETROLEUM STATISTICS DIGEST 2001–02 11
Rest of Australia
Western Australia
Source: ABS Figure 2.3
MINING INVESTMENT
0
2,000
4,000
6,000
8,000
10,000
12,000
1991-92 1993-94 1995-96 1997-98 1999-2000 2001-02
$Million
for the financial year, due to a combination of events
comprising September 11 2001, a general weakening in
major commodity prices and slower world growth.
In 2001–02, a total of 59 new wells were drilled in
Western Australia. This was a decrease compared
to the 75 wells drilled in 2000–01. Wells drilled
consisted of 37 new-field wildcats, 12 extension and
10 development wells. The drilling occurred in the
Bonaparte (8), Browse (2), Canning (3), Carnarvon (35)
and Perth (11) Basins.
Offshore exploration in Western Australia continued
at significant levels, with 28 new-field wildcats drilled,
20 of which were in the Carnarvon Basin, one in
the Perth Basin, two in the Browse Basin and five in
the Bonaparte Basin. Of the nine onshore new-field
wildcats drilled, the breakdown comprised three in the
Canning Basin, two in the Carnarvon Basin and four in
the Perth Basin.
In total, seven oil discoveries and four significant gas
discoveries were made from the 37 new-field wildcat
wells and the discovery rate for 2001–02 was 29%.
Significant gas discoveries were reported from the
offshore Bonaparte (Blacktip 1) and Carnarvon (Victoria
1, Denver 1) Basins and from Beharra Springs North 1 in
the onshore Perth Basin. Oil discoveries were reported
in the Perth (onshore and offshore) and Carnarvon
(offshore) Basins. Of particular note was the success
of Hovea 1 (onshore) and Cliff Head 1 (offshore) in the
Perth Basin and Victoria 1, Pedika 1, Little Sandy 1,
Norfolk 1 and Exeter 1 in the offshore Carnarvon Basin.
A total of 23,833 line kilometres of 2D seismic data was
acquired during 2001–02, and 7,627 line of 3D data.
Rest of Australia
Western Australia
PETROLEUM EXPLORATION EXPENDITURE
0
200
400
600
800
1,000
1,200
91–92 93–94 95–96 97–98 99-00 01-02
$Million
Source: ABS Figure 2.2
Surveys were conducted in the Bonaparte, Browse,
Carnarvon and Perth Basins, with the majority of line
kilometres being in the Carnarvon Basin.
Petroleum explorers predicted that exploration in
Australia would continue to decline, in both onshore
and offshore basins for the first part of 2002–03. The
biggest fall was expected in offshore exploration, of
about 21%.
2.3 InvestmentABS private new capital expenditure statistics for
2001–02 indicate that mining accounted for around
53% of Western Australia’s total investment, compared
to around 48% in 2000–01. The total value of State
investment rose by 11% from around $4.95 billion
in 2000–01 to $5.51 billion in 2001–02. In terms of
Western Australian mining investment, it rose by around
21.8% from $2.39 billion in 2000–01 to $2.91 billion in
2001–02.
Total national mining investment in 2001–02 was $6.8
billion. Western Australia accounted for around 43%
of this.
It is important to note that the figures reported above
do not capture all mining investment as the ABS
uses classifications specified in the 1993 edition of
the Australian and New Zealand Standard Industrial
Classification (ANZSIC) (ABS Catalogue number
1292.0). Accordingly, mining is broadly defined as
the extraction of minerals occurring naturally as solids
such as coal and ores, liquids such as crude petroleum

WESTERN AUSTRALIA MINERAL AND PETROLEUM STATISTICS DIGEST 2001–0212 WESTERN AUSTRALIA MINERAL AND PETROLEUM STATISTICS DIGEST 2001–02 13
and natural gas. Downstream mining activities
such as smelting of minerals or ores (other than
preliminary smelting of gold) or refi ning are classifi ed as
manufacturing activities under the ANZSIC. Products
such as coke and alumina are also included in the
ANZSIC manufacturing category.
The ABS released a paper which addressed some of
the above classifi cation issues relating to the Western
Australian resource sector in June 2002 (as a feature
article in ABS Catalogue number 1367.5). However,
the resulting investment data cover only the State, not
national, economy and does not include data for the
years 2000–01 and 2001–02.
Some notable Western Australian mining sector projects
currently in construction or committed include:
• The expansion of the North West Shelf LNG project
fourth LNG train.
• BHP Iron Ore’s iron ore mine–Mining Area C.
Construction of the fourth LNG train as part of the North West Shelf LNG project is a signifi cant investment currently taking place in the Western Australian resource sector.

WESTERN AUSTRALIA MINERAL AND PETROLEUM STATISTICS DIGEST 2001–0212 WESTERN AUSTRALIA MINERAL AND PETROLEUM STATISTICS DIGEST 2001–02 13
3. RESOURCE FOCUS 2001–02
Figure 3.1
Major Commodities by Value 2000-01 and 2001-02
0 1,000 2,000 3,000 4,000 5,000 6,000 7,000
COAL
BASE METALS
DIAMONDS
HEAVY MINERAL SANDS
NATURAL GAS & LPG
NICKEL
LNG
GOLD
ALUMINA
IRON ORE
CRUDE OIL & CONDENSATE
$million
2001-02
2000-01
Source: MPR
Figure 3.2
Others10%
Alumina14%
Gold12%
Iron ore20%
Nickel8%
Petroleum36%
Natural Gas7%
Condensate18%
LPG — Propane2%
LNG27%
LPG — Butane2%
Crude Oil44%
SALES BY COMMODITY
Source: MPR
3.1 Overview and Outlook
After an impressive 29% increase in the value of
sales to record levels in the previous year, the
Western Australian mineral and petroleum industry
succumbed to adverse global commodity price conditions
in 2001–02, contracting in value by 5% to $26 billion. This
outcome needs to be seen in perspective of poor global
commodity prices and the industry’s extraordinary record
high growth rates of the past two years.
World events driven by a downturn in the key markets
of Europe, the United States and Asia coupled with the
fallout of the events of September 11 greatly impacted on
commodity prices. With the value of the Australian dollar
in US terms being on average just 3% lower in 2001–02, it
offered little shelter from the depressed prices.
Petroleum, the State’s largest resource sector, was
particularly hurt. Whilst the sales volume of key petroleum
products such as crude oil and liquefi ed natural gas (LNG)
increased to record production levels, the total value of
petroleum sales fell by $980 million, or 9%. This was due
to a 20% drop in oil prices, on average over the course of
2001–02. Similarly, lower international prices for nickel,
diamonds, alumina and base metals translated to these
sectors reporting decreased, or at best static sales values for
2001–02, despite physical sales volume increases.
The gold sector in contrast, despite an 8% drop in sales
volumes to 5.9 million ounces, experienced more buoyant
prices which translated to a small sales value increase.
Similarly, the iron ore industry increased its sales value
thanks to higher prices from an earlier round of negotiations.
Despite the check on growth in the Western Australian
mineral and petroleum industry during 2001–02, it is
noteworthy that compared to the value of mineral and
petroleum production ten years ago, the current level
is well over double that amount. It has demonstrated
a solid average annual growth rate of 8.1% per annum
and represents a doubling of the value of production
every ten years, far outstripping growth of the
economy in general.
World market prices of metal and energy commodities
are currently low. At the closure of 2002, the outlook
for Western Australia’s minerals and petroleum
industry is dependent on world economic growth.
Global economic growth needs to strengthen to
increase demand and therefore prices for the State’s
mineral and petroleum commodity exports. To a great
extent this in turn depends on economic developments
in the US, where a weak business investment
environment does not augur well for a pick up in
growth. As a result, as foreseen by ABARE, world
economic growth is assumed to remain relatively
weak, averaging 2.8% in 2003. This compares with
3.7% on average in the fi ve years up to 2000.

WESTERN AUSTRALIA MINERAL AND PETROLEUM STATISTICS DIGEST 2001–0214 WESTERN AUSTRALIA MINERAL AND PETROLEUM STATISTICS DIGEST 2001–02 15
Nevertheless, there is cause for some optimism that
most metal prices are in fact expected to rise in 2003.
This is due to an albeit modest, consumption recovery
which will outstrip production. ABARE, for example,
has forecasted price increases in major base metals
of between 5% for copper and 15% for nickel and
for one of the State’s major mineral exports, iron ore,
prices negotiated for 2003–04 are likely to increase.
Increase in steel demand in Asia, particularly strength in
China’s iron ore import demand will underpin upward
pressure on prices. While gold is expected by many to
be weaker this depends on hedging and the numerous
‘world crisis’ factors which may in fact support a rally in
2003. Likewise, oil prices, are expected to ease in 2003
as production outpaces consumption. Again, this of
course depends on the extent and rate at which the ‘war
premium’ diminishes and global political developments
in 2003 subside.
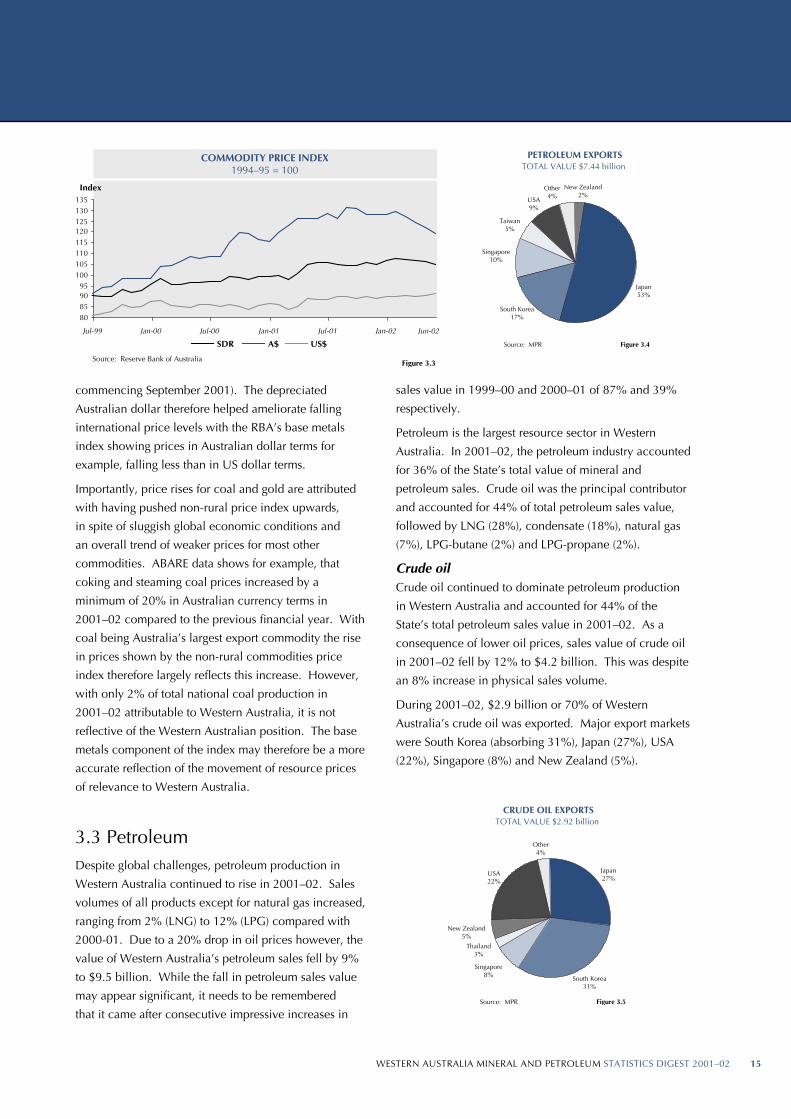
3.2 Commodity Price IndexThe Reserve Bank of Australia (RBA) produces a
monthly commodity price index comprising non-rural
commodity prices. Commodities included in the
index are both steaming and coking coal, LNG, gold,
iron ore and base metals consisting of aluminium,
copper, nickel, zinc and lead. The RBA also produces
a separate index comprising just the latter group of base
metals.
In 2001–02, the annual average of the non-rural
commodity price index figures, in Australian currency
terms, indicated that non-rural commodity prices had
risen by 7% on the previous year. This was despite an
11% fall in the average price level for the base metals
component of the index. The increase in the non-rural
commodity price index over the whole of 2001–02 can
be partially explained by the Australian dollar being
3% down on average in 2001–02 compared to the
previous year (in spite of eight months of appreciation
Reserve Bank of Australia (RBA) Commodity Price Index
The Reserve Bank of Australia Commodity Price Index is based on the price of 17 major commodities exported by Australia. These commodities collectively account for around two-thirds of total commodity exports. The index is apportioned into three sections — rural, non-rural and base metals.
The non-rural index comprises base metals (which consist of aluminium, copper, nickel, zinc and lead), gold, coking coal, steaming coal, iron ore and LNG. The index is compiled monthly and is expressed in US dollars, Australian dollars and Special Drawing Rights (SDR).
The RBA’s index, expressed in US dollar terms is useful because most commodities are traded in world markets in US dollars. However such an index is subject to changes in the US dollar exchange rate (as it is based on spot prices). In this respect, the SDR index is a better indication of underlying supply and demand for commodities than the US dollar index.
SDR is a unit of account used by the International Monetary Fund (IMF). Its value is based on a basket of currencies comprising the Euro, Yen, Pound and US Dollar. Weights are assigned to each of these currencies to reflect their relative importance in world terms. The RBA expresses the SDR component of its index in US dollar terms, with commodity prices derived from the
London Metal Exchange and Bloomberg and converted to monthly averages of daily data.
Alternatively, the Australian dollar index is useful for gauging the domestic currency price received by Australian commodity exporters as it reflects the interrelation between world commodity prices and the Australian exchange rate. For example, if prices in foreign currency terms remain unchanged but the Australian dollar depreciates, this will be recorded as a favourable upward shift in the index, which would not be evident in either the SDR or US dollar, indexes.
The RBA index is a fixed-weight Laspeyres index, using 1994–95 as the base year and excludes crude oil. The index is re-based every five years in order to make long-run reliable comparisons, unlike the national accounts that are re-based annually to track short-run movements. Base-period weights indicate the relative importance given to individual commodities. They are based on gross exports thus explaining the omission of crude oil (for which Australia is a net importer) and correspond to the export value of each commodity as a share of total exports. These weights change over time to reflect changes in the composition of commodity exports. Movements in the index from one period to the next reflect underlying price movements and do not take into account changes in volumes.
WESTERN AUSTRALIA MINERAL AND PETROLEUM STATISTICS DIGEST 2001–0214 WESTERN AUSTRALIA MINERAL AND PETROLEUM STATISTICS DIGEST 2001–02 15
CRUDE OIL EXPORTSTOTAL VALUE $2.92 billion
Japan27%
South Korea31%
Thailand3%
New Zealand5%
USA22%
Other4%
Singapore8%
Source: MPR Figure 3.5
Source: MPR Figure 3.9
CONDENSATE EXPORTSTOTAL VALUE $1.45 billion
Japan4%
South Korea20%
Singapore37%
Taiwan28%
USA3%
Other8%
Source: MPR Figure 3.4
PETROLEUM EXPORTSTOTAL VALUE $7.44 billion
Japan53%
Singapore10%
Taiwan5%
USA9%
Other4%
New Zealand2%
South Korea17%
Figure 3.3
COMMODITY PRICE INDEX1994–95 = 100
80859095
100105110115120125130135
Jul-99 Jan-00 Jul-00 Jan-01 Jul-01 Jan-02
Index
SDR A$ US$
Source: Reserve Bank of Australia
Jun-02
commencing September 2001). The depreciated
Australian dollar therefore helped ameliorate falling
international price levels with the RBA’s base metals
index showing prices in Australian dollar terms for
example, falling less than in US dollar terms.
Importantly, price rises for coal and gold are attributed
with having pushed non-rural price index upwards,
in spite of sluggish global economic conditions and
an overall trend of weaker prices for most other
commodities. ABARE data shows for example, that
coking and steaming coal prices increased by a
minimum of 20% in Australian currency terms in
2001–02 compared to the previous financial year. With
coal being Australia’s largest export commodity the rise
in prices shown by the non-rural commodities price
index therefore largely reflects this increase. However,
with only 2% of total national coal production in
2001–02 attributable to Western Australia, it is not
reflective of the Western Australian position. The base
metals component of the index may therefore be a more
accurate reflection of the movement of resource prices
of relevance to Western Australia.
3.3 PetroleumDespite global challenges, petroleum production in
Western Australia continued to rise in 2001–02. Sales
volumes of all products except for natural gas increased,
ranging from 2% (LNG) to 12% (LPG) compared with
2000-01. Due to a 20% drop in oil prices however, the
value of Western Australia’s petroleum sales fell by 9%
to $9.5 billion. While the fall in petroleum sales value
may appear significant, it needs to be remembered
that it came after consecutive impressive increases in
sales value in 1999–00 and 2000–01 of 87% and 39%
respectively.
Petroleum is the largest resource sector in Western
Australia. In 2001–02, the petroleum industry accounted
for 36% of the State’s total value of mineral and
petroleum sales. Crude oil was the principal contributor
and accounted for 44% of total petroleum sales value,
followed by LNG (28%), condensate (18%), natural gas
(7%), LPG-butane (2%) and LPG-propane (2%).
Crude oilCrude oil continued to dominate petroleum production
in Western Australia and accounted for 44% of the
State’s total petroleum sales value in 2001–02. As a
consequence of lower oil prices, sales value of crude oil
in 2001–02 fell by 12% to $4.2 billion. This was despite
an 8% increase in physical sales volume.
During 2001–02, $2.9 billion or 70% of Western
Australia’s crude oil was exported. Major export markets
were South Korea (absorbing 31%), Japan (27%), USA
(22%), Singapore (8%) and New Zealand (5%).
CRUDE OIL EXPORTSTOTAL VALUE $2.92 billion
Japan27%
South Korea31%
Thailand3%
New Zealand5%
USA22%
Other4%
Singapore8%
Source: MPR Figure 3.5
Source: MPR Figure 3.9
CONDENSATE EXPORTSTOTAL VALUE $1.45 billion
Japan4%
South Korea20%
Singapore37%
Taiwan28%
USA3%
Other8%
Source: MPR Figure 3.4
PETROLEUM EXPORTSTOTAL VALUE $7.44 billion
Japan53%
Singapore10%
Taiwan5%
USA9%
Other4%
New Zealand2%
South Korea17%

WESTERN AUSTRALIA MINERAL AND PETROLEUM STATISTICS DIGEST 2001–0216 WESTERN AUSTRALIA MINERAL AND PETROLEUM STATISTICS DIGEST 2001–02 17
In 2001–02, Western Australia produced 95 million
barrels of crude oil, accounting for more than 50%
of Australia’s total. The top ten oil fields in Western
Australia were Wanaea, Legendre, Griffin, Cossack,
Stag, Hermes, Wandoo, Chinook,Scindian, Barrow
Island and Buffalo. Together, these accounted for 87%
of the State’s total production. The Wanaea field was
the largest contributor and accounted for nearly 30% of
the State’s total. The Legendre (north and south) field
that started production in July 2001 took the second
position and contributed 12% to the State’s total.
In addition to the Legendre fields, further production
increases were attributable to the Laminaria Phase two
project, the Hovea field, the Gipsy and North Gipsy
field (which began producing late in the first quarter
of 2001) and the Simpson field (which commenced
production in November 2001). The Laminaria phase
two project, which came on-stream in June 2002, will
add an extra 70,000 barrels per day to the output of
the existing Laminaria and Corallina fields (from which
production has typically been around 73,000 barrels
per day).
Looking into the short to medium term, significant
additional oil production for the State will arise from the
proposed development of the Woollybutt field and the
Enfield, Laverda and Vincent oil fields by Woodside.
The Woollybutt field, located 40-50 km west of Barrow
Island, will be developed using floating production,
storage and off-loading facilities. First oil production is
expected in early 2003. Initial production is expected
at a rate of up to 35,000 barrels per day. The Enfield,
Laverda and Vincent fields are located 50 km northwest
of Exmouth and will also comprise floating production,
storage and off-loading facilities. Two development
CRUDE OIL AND CONDENSATEQuantity and Value by Quarter
4.2
4.4
4.6
4.8
5.0
5.2
5.4
5.6
5.8
Sep-00 Dec-00 Mar-01 Jun-01 Sep-01 Dec-01 Mar-02 Jun-02
Gigalitres
0
250
500
750
1,000
1,250
1,500
1,750
2,000$ millionQuantity
Value
Source: MPR Figure 3.7
scenarios are being considered, which would see the
development commence either in late 2005 or 2006.
Construction is expected to commence in mid 2004.
Other projects in the pipeline for the oil sector include
the Gorgon gas/condensate fields and the Macedon and
Pyrenees oil and gas fields. The Macedon and Pyrenees
fields are adjacent, but separate offshore hydrocarbon
fields within the West Muiron structure, about 50 km
north of Exmouth. The Macedon field is wholly gas while
the Pyrenees contains both oil and gas. According to
ABARE, these oil fields will augment Western Australia’s
oil output in the medium term. However in-principle
approval for Gorgon is still to be obtained following
preparation of an environmental, social and economic
(ESE) review of the project by the Gorgon joint venture,
and there are also no immediate plans to develop the
latter. The ESE Review will be released for 6 weeks of
public review and comment early in 2003.
ABARE estimates that crude oil and condensate
production in Australia will decline steadily in the
medium term. In Western Australia, production declines
albeit moderate, are evident and overall production
volumes remain steady. While no shutdowns were
experienced in 2001–02, at Airlie Island, production
volumes are declining from the Chervil field and it is
expected to shutdown in the next 12 to 24 months. No
other shutdowns are envisaged in the short- to medium-
term, however production volumes are also on the
decline at the Saladdin, Roller and Skate fields. Output
at the Saladdin field, which came on-line in 1989, has
declined to approximately one-fifth of the field’s peak oil
and condensate output, while the Roller field which was
TAPIS CRUDE OIL PRICE US$/bbl
18
22
26
30
34
Jul-00 Jan-01 Jul-01 Jan-02
US$
Source: WA Treasury Corporation
Jun-02
Figure 3.6

WESTERN AUSTRALIA MINERAL AND PETROLEUM STATISTICS DIGEST 2001–0216 WESTERN AUSTRALIA MINERAL AND PETROLEUM STATISTICS DIGEST 2001–02 17
CRUDE OIL AND CONDENSATE QUANTITY
0
5
10
15
20
25
30
35
40
45
1965 1970 1975 1980 1985 1990 1995 2000
Gigalitres
Rest of Australia
Western Australia
Source: MPR and ABARE Figure 3.8
producing in excess of 50,000 barrels per day in the
mid nineties, now produces less than 10,000 barrels per
day.
The average price of Brent, Tapis and West Texas
in 2001–02 was US$23.23 per barrel, a drop of
20% on the average price in 2000–01. This caused
the State’s total sales value to decrease despite the
increased volumes of sales. Even though there was
an overall average downward price shift, the year was
characterised by a series of international events which
placed short-term supply side pressures on international
oil trade. Speculations over the potential halt of oil
shipments resulting from tense US relations with Iraq,
in conjunction with increased fighting between Israel
and the Palestinians, increased uncertainty in the oil
market. For example, in early April 2002, the Iraqi
cabinet voted to suspend oil exports for 30 days —
equivalent to a supply reduction of two million barrels
per day. The move was intended to engender support
for an oil embargo on the US and other allies of Israel.
However, by early May, Iraq resumed exports, having
failed to gain support from the nation’s oil-producing
counterparts. Both Kuwait and Saudi Arabia rejected
the notion of attempting to use oil as a ‘weapon’, which
was confirmed by increased OPEC production during
the thirty-day embargo. According to Bloomberg, six of
the other seven OPEC producers from the Middle East
actually raised production during this period. While
the OPEC response to these events went some way
to soften the price effects of these supply constraints,
concerns over supply disruptions from other areas
emerged during 2001–02, with for example, strikes by
oil workers in Venezuela.
Politically driven tensions continue to underpin
uncertainty in the world oil market and will
undoubtedly dominate the events and trends in the
short to medium term, causing prices to remain
relatively high. Despite tempered oil demand arising
from a slower than expected global economic recovery,
oil prices remain very buoyant, reflecting the potential
for supply disruptions from the Middle East and the
continued tight stance on OPEC production levels.
However, on the latter issue, with OPEC production
exceeding quota limits by an estimated 13%, the
contradictions between the official OPEC position
and actual supply continue with Middle Eastern OPEC
producers appearing willing to increase production to
meet supply short-falls. Overall, ABARE estimates oil
prices will rise by approximately 5% in 2003, reflecting
the net effect of this scenario, causing a rise in the value
of oil sales. This is pertinent to Western Australia,
which exports a higher proportion of its oil than other
states in Australia.
CondensateWestern Australia is the nation’s dominant condensate
producer. The State’s sales volumes increased by 9%
in 2001–02 to 40.9 million barrels, accounting for 83%
of Australia’s total. 98% of condensate was produced
from five fields — Goodwyn, Perseus, Echo/Yodel, East
Spar and North Rankin. The Goodwyn field remained
the largest contributor, accounting for about 56% of the
State’s total. The Echo/Yodel field, which commenced
production in late December 2001 increased the State’s
capacity significantly, adding 6.3 million barrels to the
State’s total in less than seven months.

WESTERN AUSTRALIA MINERAL AND PETROLEUM STATISTICS DIGEST 2001–0218 WESTERN AUSTRALIA MINERAL AND PETROLEUM STATISTICS DIGEST 2001–02 19
Although quantity sold increased by 9%, 2001≈02 saw
the value of Western Australia’s condensate sales fall
by 15% due to significantly lower prices. On average,
prices for condensate were 22% lower in the year.
In 2001–02, nearly $1.5 billion or 87% of the State’s
condensate was exported. Singapore was the largest
export market, accounting for 37% of Western
Australia’s condensate exports, followed by Taiwan
(28%) and South Korea (20%).
While Goodwyn remains the State’s chief producer,
production volumes from this field have been declining.
In 2001–02, Goodwyn’s production was down by
11%. This reflected depletion of the field’s condensate
reservoirs. However, it is expected that commencement
of production from the North West Shelf Gas Project’s
Echo/Yodel field during 2001–02 will ameliorate
declining production levels from the Goodwyn field.
The Echo/Yodel field is connected via a 23-km sub-sea
tie-back to the Goodwyn A platform. At its peak Echo/
Yodel is expected to produce 30,000 barrels per day of
condensate in addition to gas and is expected to remain
in production for approximately five years.
Liquefied natural gas (LNG)LNG is Western Australia’s second most valuable
petroleum product after crude oil. LNG sales in
2001–02 continued to climb, increasing by 2% to a
record 8.24 million tonnes. Due to price lags and
contractual arrangements, the value of LNG shipments
did not feel the full brunt of weaker oil prices and
decreased relatively marginally compared to other
petroleum products, by 2% to $2.6 billion.
The traditional customers of Western Australia’s LNG
are the Japanese power utilities. In 2001–02, about
99% of Western Australia’s LNG was exported to
Japan. Since 1989, the North West Shelf Gas Project
has landed more than 1,300 LNG cargos in Japan. In
addition to the contract sales to existing customers, spot
cargoes have also been sold to other customers around
the world.
Importantly for the Western Australian economy, in
September 2001, construction of the fourth processing
train in the North West Shelf LNG plant commenced.
The $1.6-billion LNG Train 4 and the associated $800-
million second trunkline are expected to be operational
by mid-2004. Development of a fifth train is currently
under consideration.
As with the initial LNG export program, construction of
Train 4 is being underpinned by 25–30-year contracts
with the Japanese power utilities. Japanese customers
have been signed-up for two-thirds of the LNG to be
produced by the expansion with letters of intent having
been signed by Tokyo Gas and Toho Gas (for supplying
1 million tonnes per annum from 2004), Osaka Gas (1
million tonnes per annum from 2004), Tohoku Electric
(0.4 million tonnes per annum from 2005) and Kyushu
Electric (0.5 million tonnes per annum).
Another important event was the conclusion to the
three-way international battle between Australia,
Indonesia and Qatar for a major LNG contract with
China. In January 2002, Western Australia’s North
West Shelf Venture (NWSV) was short-listed by the
Chinese Government to provide LNG to China’s first
LNG terminal in Guangdong province. Australian LNG
Pty Ltd (ALNG), which is responsible for marketing
North West Shelf LNG under long-term contract outside
Japan, lodged its final bid in April. After a four-month
GAS SALES
0
50,000
100,000
150,000
200,000
250,000
300,000
350,000
Sep-00 Dec-00 Mar-01 Jun-01 Sep-01 Dec-01 Mar-02 Jun-02
Million cubic feet
Western Australia
Australia
Source: APPEA Figure 3.10
CRUDE OIL EXPORTSTOTAL VALUE $2.92 billion
Japan27%
South Korea31%
Thailand3%
New Zealand5%
USA22%
Other4%
Singapore8%
Source: MPR Figure 3.5
Source: MPR Figure 3.9
CONDENSATE EXPORTSTOTAL VALUE $1.45 billion
Japan4%
South Korea20%
Singapore37%
Taiwan28%
USA3%
Other8%
Source: MPR Figure 3.4
PETROLEUM EXPORTSTOTAL VALUE $7.44 billion
Japan53%
Singapore10%
Taiwan5%
USA9%
Other4%
New Zealand2%
South Korea17%
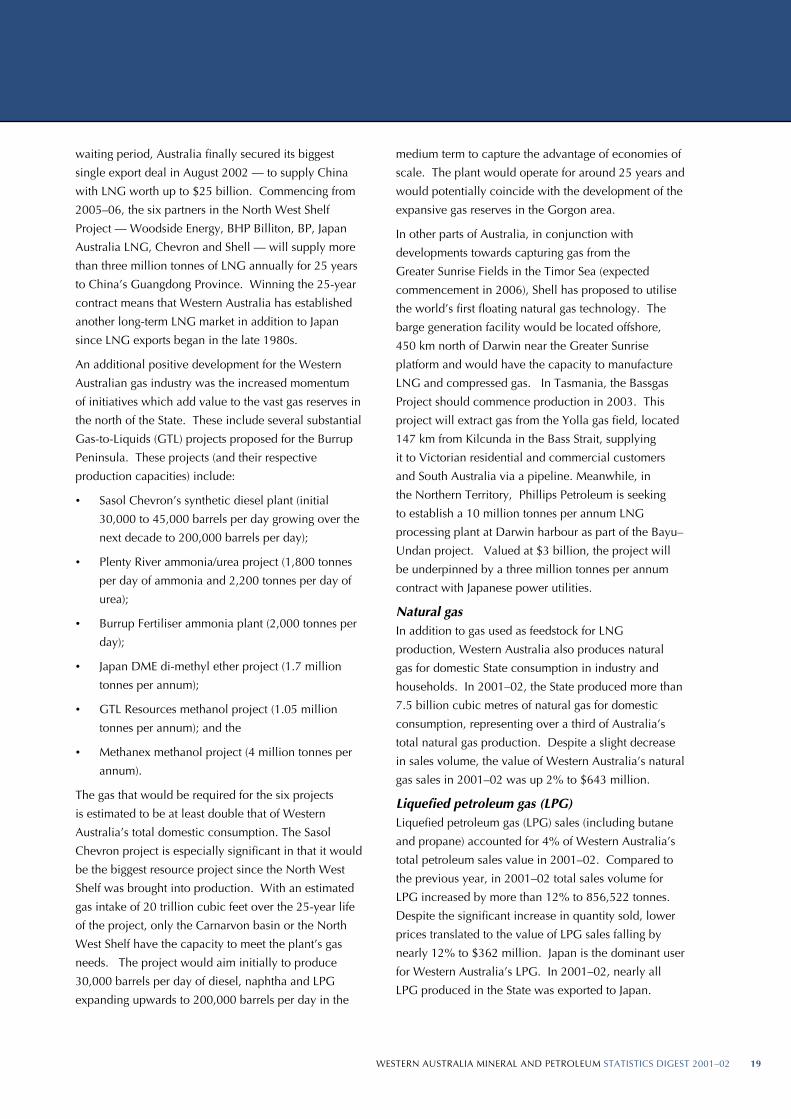
WESTERN AUSTRALIA MINERAL AND PETROLEUM STATISTICS DIGEST 2001–0218 WESTERN AUSTRALIA MINERAL AND PETROLEUM STATISTICS DIGEST 2001–02 19
waiting period, Australia finally secured its biggest
single export deal in August 2002 — to supply China
with LNG worth up to $25 billion. Commencing from
2005–06, the six partners in the North West Shelf
Project — Woodside Energy, BHP Billiton, BP, Japan
Australia LNG, Chevron and Shell — will supply more
than three million tonnes of LNG annually for 25 years
to China’s Guangdong Province. Winning the 25-year
contract means that Western Australia has established
another long-term LNG market in addition to Japan
since LNG exports began in the late 1980s.
An additional positive development for the Western
Australian gas industry was the increased momentum
of initiatives which add value to the vast gas reserves in
the north of the State. These include several substantial
Gas-to-Liquids (GTL) projects proposed for the Burrup
Peninsula. These projects (and their respective
production capacities) include:
• Sasol Chevron’s synthetic diesel plant (initial
30,000 to 45,000 barrels per day growing over the
next decade to 200,000 barrels per day);
• Plenty River ammonia/urea project (1,800 tonnes
per day of ammonia and 2,200 tonnes per day of
urea);
• Burrup Fertiliser ammonia plant (2,000 tonnes per
day);
• Japan DME di-methyl ether project (1.7 million
tonnes per annum);
• GTL Resources methanol project (1.05 million
tonnes per annum); and the
• Methanex methanol project (4 million tonnes per
annum).
The gas that would be required for the six projects
is estimated to be at least double that of Western
Australia’s total domestic consumption. The Sasol
Chevron project is especially significant in that it would
be the biggest resource project since the North West
Shelf was brought into production. With an estimated
gas intake of 20 trillion cubic feet over the 25-year life
of the project, only the Carnarvon basin or the North
West Shelf have the capacity to meet the plant’s gas
needs. The project would aim initially to produce
30,000 barrels per day of diesel, naphtha and LPG
expanding upwards to 200,000 barrels per day in the
medium term to capture the advantage of economies of
scale. The plant would operate for around 25 years and
would potentially coincide with the development of the
expansive gas reserves in the Gorgon area.
In other parts of Australia, in conjunction with
developments towards capturing gas from the
Greater Sunrise Fields in the Timor Sea (expected
commencement in 2006), Shell has proposed to utilise
the world’s first floating natural gas technology. The
barge generation facility would be located offshore,
450 km north of Darwin near the Greater Sunrise
platform and would have the capacity to manufacture
LNG and compressed gas. In Tasmania, the Bassgas
Project should commence production in 2003. This
project will extract gas from the Yolla gas field, located
147 km from Kilcunda in the Bass Strait, supplying
it to Victorian residential and commercial customers
and South Australia via a pipeline. Meanwhile, in
the Northern Territory, Phillips Petroleum is seeking
to establish a 10 million tonnes per annum LNG
processing plant at Darwin harbour as part of the Bayu–
Undan project. Valued at $3 billion, the project will
be underpinned by a three million tonnes per annum
contract with Japanese power utilities.
Natural gasIn addition to gas used as feedstock for LNG
production, Western Australia also produces natural
gas for domestic State consumption in industry and
households. In 2001–02, the State produced more than
7.5 billion cubic metres of natural gas for domestic
consumption, representing over a third of Australia’s
total natural gas production. Despite a slight decrease
in sales volume, the value of Western Australia’s natural
gas sales in 2001–02 was up 2% to $643 million.
Liquefied petroleum gas (LPG)Liquefied petroleum gas (LPG) sales (including butane
and propane) accounted for 4% of Western Australia’s
total petroleum sales value in 2001–02. Compared to
the previous year, in 2001–02 total sales volume for
LPG increased by more than 12% to 856,522 tonnes.
Despite the significant increase in quantity sold, lower
prices translated to the value of LPG sales falling by
nearly 12% to $362 million. Japan is the dominant user
for Western Australia’s LPG. In 2001–02, nearly all
LPG produced in the State was exported to Japan.

WESTERN AUSTRALIA MINERAL AND PETROLEUM STATISTICS DIGEST 2001–0220 WESTERN AUSTRALIA MINERAL AND PETROLEUM STATISTICS DIGEST 2001–02 21
Source: MPR Figure 3.11
IRON ORE EXPORTSTOTAL VALUE $4.81 billion
Japan40%
South Korea16%
Taiwan8%
Europe7%
USA1%
China28%
IRON ORE PRICE A$/Fe unit
0.38
0.42
0.46
0.50
0.54
0.58
Jul-00 Jan-01 Jul-01 Jan-02
A$
Source: Tex Report, High Grade Fine Ore Prices Figure 3.12
Jun-02
3.4 Iron OreWestern Australian iron ore producers continued to
fare well in 2001–02 despite the continued sluggish
global economic conditions. At 160 million tonnes,
Western Australian iron ore sales volumes were
down only marginally by 1%. Higher prices from the
previous round of negotiations earlier in 2001 and
a low Australian dollar in trade-weighted terms for
September 2001 allowed for the value of these sales to
rise by almost 4% to $5,099 million. This was despite
a turnaround in the exchange rate for the second half
of period, which appreciated by about 5% against the
US dollar in the third quarter of 2001–02. This marked
the end of a four-year overall depreciation trend for
Australia’s exchange rate and increased the competitive
pressure on Western Australia’s producers. In value
terms, for the Western Australian economy, iron ore
remains the second largest commodity after crude oil
and condensate.
based steel output, deregulation of iron ore import
arrangements and rationalisation within the domestic
iron ore industry. Rationalisation has been based on
closure of a large number of small, low iron content,
relatively inefficient Chinese mines with high internal
transport costs due to their poor location relative to
the industrialised steel producing centres on the coast.
Efficiently produced, imported, quality iron ore has
therefore become more attractive to Chinese steel
manufacturers.
With demand flailing in other parts of the globe, the
size and relative stability of Chinese iron ore demand
presents an attractive market for producers keen to
continue increasing production. According to ABARE,
in 2001, Australian producers had an estimated 41%
share of the Chinese import market, whereas Brazilian
suppliers had a 27% share and India 18%. Historically
Australia’s high share has been attributed to competitive
transport costs due to Australia’s proximity to China.
Western Australian iron ore miners also continue to
set world standards for production efficiency with
further adjustments driving per unit costs down from
US$9.71 per tonne in 1997 to US$7.08 per tonne in
2001–02.
However, the world’s largest producer, the Brazilian
Companhia Vale do Rio Doce (CVRD) continues an
aggressive approach to secure a greater share of the
Chinese market. CVRD’s share of the world market has
already increased over the last three years from 12% to
18%. The Western Australian Chamber of Minerals and
Energy estimates that Western Australia’s share of the
Chinese market is down four percentage points in 2002
compared to 2001, while CVRD’s share of the Chinese
In 2001–02, the state accounted for approximately 17%
of the world’s iron ore production and 97% of Australia’s
total production. Less than 5% of Western Australia’s
total iron ore production was retained for domestic use.
While the value of Western Australian iron ore exports
to Japan were down two percentage points from 42%
to 40%, 2001–02 saw the value of exports to China
rise three percentage points to 28%. Other East Asian
destinations were also up, with South Korea and Taiwan
accounting for 16% and 8% of Western Australia’s iron
ore exports respectively. Only 8% of the State’s iron
ore exports were attributable to European (7%) and US
customers (1%).
Steady and increasing Chinese demand for iron ore was
largely due to strong growth in Chinese blast-furnace–

WESTERN AUSTRALIA MINERAL AND PETROLEUM STATISTICS DIGEST 2001–0220 WESTERN AUSTRALIA MINERAL AND PETROLEUM STATISTICS DIGEST 2001–02 21
IRON OREQuantity and Value by Quarter
30
35
40
45
50
Sep-00 Dec-00 Mar-01 Jun-01 Sep-01 Dec-01 Mar-02 Jun-02
Million tonnes
0
250
500
750
1,000
1,250
1,500
$ million
Quantity
Value
Source: MPR Figure 3.13
IRON ORE QUANTITY
0
20
40
60
80
100
120
140
160
180
1950 1955 1960 1965 1970 1975 1980 1985 1990 1995 2000
Million tonnes
Rest of Australia
Western Australia
Source: MPR and ABARE Figure 3.14
market has increased by four percentage points over the
same period. Meanwhile, India’s share of the market
has jumped an extraordinary 17 percentage points.
Brazil has rapidly consolidated its iron ore industry,
with producers being absorbed through expansion
strategies. In 2001–02 for example, CVRD acquired
Belem from Bethlehem Steel Corporation and
Bethlehem Steel International. The company was also
engaged in negotiations with Mitsui over the merger of
Ferteco and MBR. Further to this, the Brazilian giant
intends to invest US$6 billion to expand and upgrade
its projects, developing new mines and making further
acquisitions. As part of this strategy CVRD plans to
construct a 450,000-tonne bulk carrier in partnership
with its Chinese customers. The resultant reduction in
iron ore transport costs will squeeze Western Australia’s
competitive advantage in transport, reducing the cost
margin between Australian and Brazilian supply and
could potentially further erode Western Australia’s
Chinese market share.
Following protracted negotiations, an agreement on
prices for fine, lump and Yandi ore between Australian
iron ore producers and Japanese customers was finally
reached in June 2002. The price of fine ore dropped
by 2.4% to US28.28 cents per dry long ton unit (dltu).
The price of lump ore decreased 5% to US36.13 cents
per dltu and the price of Yandi ore fell by 2.4% to
US26.58 cents per dltu. With the price cuts applying
for the Japanese fiscal year commencing April 2002,
Western Australia’s iron ore producers will collectively
experience a loss of around $100 million.
The outlook for iron ore prices is for this weakness
to continue, with price cuts driven by a 30% decline
in demand for steel products as the global economy
remains slow, in tandem with large iron ore inventories.
Lesser contributing factors are weak European and
Japanese markets, financially strained iron ore mills
and pressure for price cuts from recently consolidated
miners in the form of ‘olive branch’ style gestures of
good faith to mills. Proposed changes to steel import
barriers in the US will potentially add another factor to
the downward pressure on iron ore prices and will have
a significant impact on the pattern of world steel trade.
Forecasts by ABARE suggest that iron ore production
will continue to climb by 3% over the next twelve
months to national levels of about 190 million tonnes
per annum, however the value of exports is expected
to slip — due to appreciation of the Australian dollar
and lower prices. Estimates suggest export values could
fall by almost 2%. In the longer term, to 2007 global
growth in seaborne trade of 536 million tonnes over the
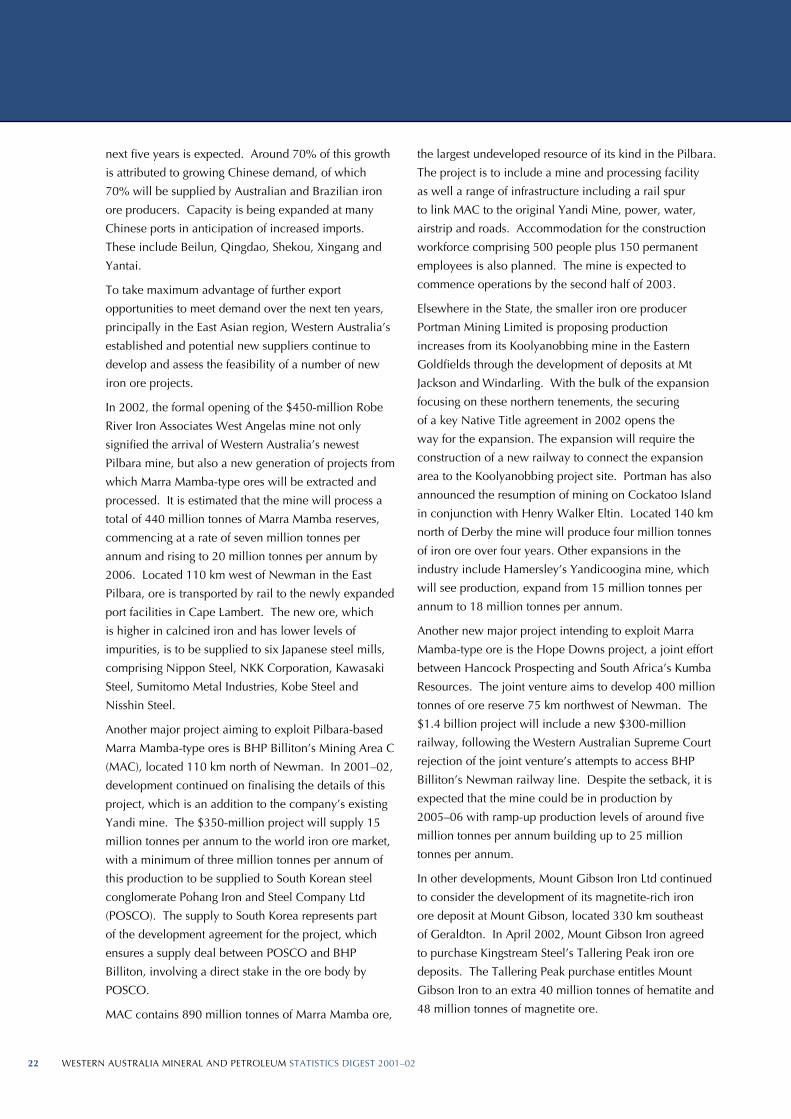
WESTERN AUSTRALIA MINERAL AND PETROLEUM STATISTICS DIGEST 2001–0222 WESTERN AUSTRALIA MINERAL AND PETROLEUM STATISTICS DIGEST 2001–02 23
next five years is expected. Around 70% of this growth
is attributed to growing Chinese demand, of which
70% will be supplied by Australian and Brazilian iron
ore producers. Capacity is being expanded at many
Chinese ports in anticipation of increased imports.
These include Beilun, Qingdao, Shekou, Xingang and
Yantai.
To take maximum advantage of further export
opportunities to meet demand over the next ten years,
principally in the East Asian region, Western Australia’s
established and potential new suppliers continue to
develop and assess the feasibility of a number of new
iron ore projects.
In 2002, the formal opening of the $450-million Robe
River Iron Associates West Angelas mine not only
signified the arrival of Western Australia’s newest
Pilbara mine, but also a new generation of projects from
which Marra Mamba-type ores will be extracted and
processed. It is estimated that the mine will process a
total of 440 million tonnes of Marra Mamba reserves,
commencing at a rate of seven million tonnes per
annum and rising to 20 million tonnes per annum by
2006. Located 110 km west of Newman in the East
Pilbara, ore is transported by rail to the newly expanded
port facilities in Cape Lambert. The new ore, which
is higher in calcined iron and has lower levels of
impurities, is to be supplied to six Japanese steel mills,
comprising Nippon Steel, NKK Corporation, Kawasaki
Steel, Sumitomo Metal Industries, Kobe Steel and
Nisshin Steel.
Another major project aiming to exploit Pilbara-based
Marra Mamba-type ores is BHP Billiton’s Mining Area C
(MAC), located 110 km north of Newman. In 2001–02,
development continued on finalising the details of this
project, which is an addition to the company’s existing
Yandi mine. The $350-million project will supply 15
million tonnes per annum to the world iron ore market,
with a minimum of three million tonnes per annum of
this production to be supplied to South Korean steel
conglomerate Pohang Iron and Steel Company Ltd
(POSCO). The supply to South Korea represents part
of the development agreement for the project, which
ensures a supply deal between POSCO and BHP
Billiton, involving a direct stake in the ore body by
POSCO.
MAC contains 890 million tonnes of Marra Mamba ore,
the largest undeveloped resource of its kind in the Pilbara.
The project is to include a mine and processing facility
as well a range of infrastructure including a rail spur
to link MAC to the original Yandi Mine, power, water,
airstrip and roads. Accommodation for the construction
workforce comprising 500 people plus 150 permanent
employees is also planned. The mine is expected to
commence operations by the second half of 2003.
Elsewhere in the State, the smaller iron ore producer
Portman Mining Limited is proposing production
increases from its Koolyanobbing mine in the Eastern
Goldfields through the development of deposits at Mt
Jackson and Windarling. With the bulk of the expansion
focusing on these northern tenements, the securing
of a key Native Title agreement in 2002 opens the
way for the expansion. The expansion will require the
construction of a new railway to connect the expansion
area to the Koolyanobbing project site. Portman has also
announced the resumption of mining on Cockatoo Island
in conjunction with Henry Walker Eltin. Located 140 km
north of Derby the mine will produce four million tonnes
of iron ore over four years. Other expansions in the
industry include Hamersley’s Yandicoogina mine, which
will see production, expand from 15 million tonnes per
annum to 18 million tonnes per annum.
Another new major project intending to exploit Marra
Mamba-type ore is the Hope Downs project, a joint effort
between Hancock Prospecting and South Africa’s Kumba
Resources. The joint venture aims to develop 400 million
tonnes of ore reserve 75 km northwest of Newman. The
$1.4 billion project will include a new $300-million
railway, following the Western Australian Supreme Court
rejection of the joint venture’s attempts to access BHP
Billiton’s Newman railway line. Despite the setback, it is
expected that the mine could be in production by
2005–06 with ramp-up production levels of around five
million tonnes per annum building up to 25 million
tonnes per annum.
In other developments, Mount Gibson Iron Ltd continued
to consider the development of its magnetite-rich iron
ore deposit at Mount Gibson, located 330 km southeast
of Geraldton. In April 2002, Mount Gibson Iron agreed
to purchase Kingstream Steel’s Tallering Peak iron ore
deposits. The Tallering Peak purchase entitles Mount
Gibson Iron to an extra 40 million tonnes of hematite and
48 million tonnes of magnetite ore.

WESTERN AUSTRALIA MINERAL AND PETROLEUM STATISTICS DIGEST 2001–0222 WESTERN AUSTRALIA MINERAL AND PETROLEUM STATISTICS DIGEST 2001–02 23
It is possible that the Tallering Peak deposits may be
mined before the Mount Gibson deposit due to Tallering
Peak’s closer location to the port of Geraldton.
It was also announced in April 2002 that the Swiss
commodities giant, Glencore, had signed an initial
five-year offtake agreement with Mount Gibson Iron,
commencing in 2003 with an option to extend the
contract for a further five years. Later, in May 2002,
Mount Gibson Iron announced that it had entered
into an agreement with Ausmelt to investigate the
production of pig iron in Western Australia using Mount
Gibson iron ore resources, locally sourced coal and
Ausmelt’s AusIron technology.
During 2002 Hamersley Iron and China’s Shanghai
Baosteel Group Corporation agreed to form a joint
venture which guarantees Baosteel 200 million tonnes
of iron ore products over the next twenty years. The
joint venture aims to develop a new mine in the Pilbara
region, 10 km east of the existing Paraburdoo mine,
which will be built and operated by Hamersley who has
a 54% share in the venture. Hamersley also intends to
develop its Nammuldi iron ore deposits near its current
Brockman No. 2 iron ore mine, 55 km northwest of
Tom Price. The project will produce Marra Mamba
lump and fine ores at around 20 million tonnes per
annum.
In terms of iron ore processing, Austeel continued
with plans on its $2.8 billion Cape Preston project.
The project involves the development of an open pit
iron ore mine based on Fortescue magnetite deposits.
Processing will include the production of hot briquetted
iron for shipment to the proposed $1.8-billion Protech
Steel Pty Ltd Cold Mill Facility (CMF) on Kooragang
Island, Newcastle in New South Wales. The CMF in
New South Wales recently received approval from the
Environmental Protection Authority, paving the way for
the first stage of the project which should be operating
by the latter half of 2004. The CMF will produce
520,000 tonnes of coated and painted carbon steel per
year. However, the processing component Austeel’s
project in Western Australia hit a stumbling block in
May 2002 when an EPA assessment concluded that
the project will contravene greenhouse gas reduction
targets. A further $330 million will need to be spent to
reduce the project’s environmental impacts.
Other highlights for the iron ore processing industry in
2001–02 included final environmental approval for the
proposed HIsmelt Corporation commercial facility at
Kwinana, a key component in the commercialisation
of Marra Mamba fines. The project is a joint venture
with Nucor (25%), Mitsubishi (10%) and Shougang
(5%). The $400-million plant has secured $50 million
in Federal Government funding and State Government
assistance in the form of land and port access to the
value of $30 million. The project aims to produce high
quality pig iron at an annual capacity of up to 820,000
tonnes in its first phase, increasing to 1.64 million
tonnes per annum in phase two by 2006. Construction
is to commence in early 2003 employing an estimated
320 people, while full commissioning is set for late
2004 with an estimated 65 full-time positions required
for this operational phase.
A scoping study is also under way to investigate the
feasibility of the potential for a pig iron plant in Collie.
Proposed by Westralia Iron and Steel Corporation, the
$700-million plant would produce 1.5 million tonnes
per annum of high-grade pig iron for the export market.
Western Australia’s export capacity is to be boosted
by a number of primarily iron ore-driven port
facility upgrades throughout the State as part of the
Government’s $225-million port enhancement program.
Esperance Port is set for a $54-million upgrade to
include dredging to create the deepest port facility in
southern Australia. Other work will include a new
berth and loading facility, construction of a 300,000
tonne iron ore storage facility and reclamation of 23
hectares of land to build a seawall. On completion of
the upgrade, Esperance Port will have the capacity to
accommodate cape-class vessels and increased export
flows of at least 6 million tonnes by 2004, up from
3 million tonnes in 2001. The expansion has been
facilitated by the involvement of Portman, which agreed
to underwrite the development.
Similarly, Geraldton Port is to undergo a $100-million
enhancement including plans to deepen the harbour to
over 12 metres. On a smaller scale BHP Billiton intends
to increase its export capacity by developing a new
stockpile area and upgraded berth to handle 25,000
tonne ships at its Finucane Island Port Facility. The
company also intends to upgrade its harbour tunnel in
Port Hedland.

WESTERN AUSTRALIA MINERAL AND PETROLEUM STATISTICS DIGEST 2001–0224 WESTERN AUSTRALIA MINERAL AND PETROLEUM STATISTICS DIGEST 2001–02 25
ALUMINA EXPORTSTOTAL VALUE $3.27 billion
Indonesia3%
South Africa13%
Bahrain10%
China19%
United Arab Emirates10%
Canada13%
Other5%
Mozambique6%
Egypt3%
USA18%
Source: MPR Figure 3.15
ALUMINA PRICE A$/tonne
280
300
320
340
360
380
Jul-00 Jan-01 Jul-01 Jan-02
A$
Source: ABARE and ABS Figure 3.16
Jun-02
3.5 AluminaAustralia is the largest alumina producer in the world.
According to statistics compiled by ABARE and AME
Mineral Economics, Australia exports 80% of national
alumina production and supplies approximately 33%
of the world’s total alumina from its six refineries. Four
refineries, with a combined production capacity of
9.8 million tonnes per annum, are located in Western
Australia at Kwinana, Wagerup, Pinjarra and Collie
(Worsley). Worsley is majority owned by Billiton
Aluminium (56%) while Alcoa World Alumina — the
largest alumina producer in the world responsible for
24% of the world’s total alumina output, owns the
remaining three refineries.
Western Australia’s refineries set the global standard
for operating costs and efficiency, with ongoing world
class technical research largely responsible for annual
production cost gains estimated at 3% per annum.
According to AME Mineral Economics Worsley, Pinjarra
and Wagerup refineries make up three of the world’s
five top rating refineries in terms of lowest production
costs per tonne.
In 2001–02 the State produced almost 21% of the
world’s alumina and accounted for over 66% of
Australian production. This translated to export sales
valued at $3.27 billion, down less than 1%, on 2000–01
figures. China comprised the largest share of the State’s
exports by value, at 19%, followed by the US which
accounted for 18% of the State’s alumina exports.
Other significant export destinations were South Africa
(13%), United Arab Emirates (10%) and Canada (13%).
Western Australia’s alumina output continued
to increase in 2001–02, rising by 4% to a record
10.9 million tonnes. Worsley’s alumina production,
increasing to maximum capacity following its refinery
expansion, contributed to this growth. However, a
severe downturn in world alumina prices in 2001–02
translated to local producers receiving lower prices.
Total alumina sales value was therefore almost static
at $3.58 billion, marginally below (less than 0.5%) the
previous financial year.
While significant price fluctuations ranging from $338
per tonne to $378 per tonne characterised the previous
financial year, in 2001–02 alumina prices formed a
steady trend, albeit downward. Commencing 2001–02
at $346 per tonne, prices dropped to $282 per tonne
by June 2002, ending 2001–02 with the lowest price
recorded for the financial year. Overall, the average
alumina price in 2001–02 was $315 per tonne which
was 14% lower compared to 2000–01.
More than 90% of the world’s alumina is used
in aluminium production, so alumina trends are
strongly tied to events in the aluminium industry.
Weak demand, oversupply and a contradictory mix
of production cutbacks, shutdowns and restarts
characterised the aluminium industry throughout
2001–02. Weak demand for aluminium was primarily
attributed to the slow global economy and sluggish
automotive and aviation sectors. By the end of the
financial year, three additional US operations were
either closed or scaled back and total annual idled
aluminium production capacity for Alcoa stood at 11%
or 4 million tonnes.
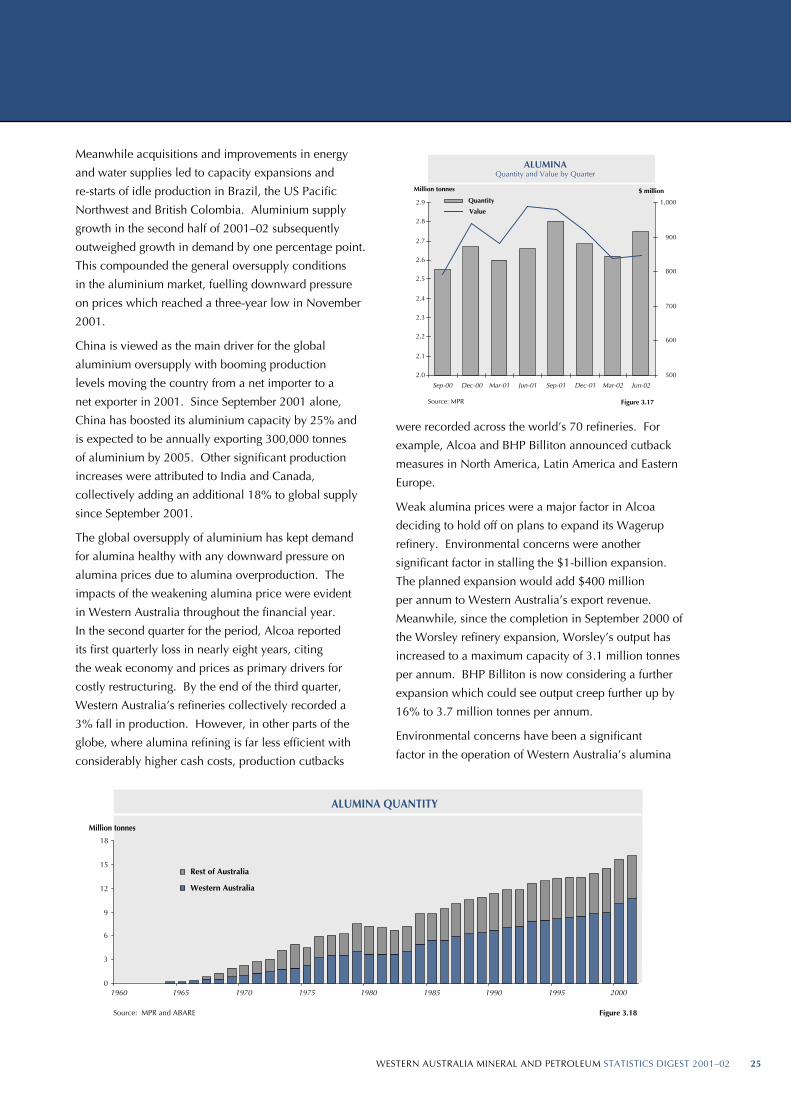
WESTERN AUSTRALIA MINERAL AND PETROLEUM STATISTICS DIGEST 2001–0224 WESTERN AUSTRALIA MINERAL AND PETROLEUM STATISTICS DIGEST 2001–02 25
Quantity
Value
ALUMINAQuantity and Value by Quarter
2.0
2.1
2.2
2.3
2.4
2.5
2.6
2.7
2.8
2.9
Sep-00 Dec-00 Mar-01 Jun-01 Sep-01 Dec-01 Mar-02 Jun-02
Million tonnes
500
600
700
800
900
1,000
$ million
Source: MPR Figure 3.17
Rest of Australia
Western Australia
ALUMINA QUANTITY
0
3
6
9
12
15
18
1960 1965 1970 1975 1980 1985 1990 1995 2000
Million tonnes
Source: MPR and ABARE Figure 3.18
Meanwhile acquisitions and improvements in energy
and water supplies led to capacity expansions and
re-starts of idle production in Brazil, the US Pacific
Northwest and British Colombia. Aluminium supply
growth in the second half of 2001–02 subsequently
outweighed growth in demand by one percentage point.
This compounded the general oversupply conditions
in the aluminium market, fuelling downward pressure
on prices which reached a three-year low in November
2001.
China is viewed as the main driver for the global
aluminium oversupply with booming production
levels moving the country from a net importer to a
net exporter in 2001. Since September 2001 alone,
China has boosted its aluminium capacity by 25% and
is expected to be annually exporting 300,000 tonnes
of aluminium by 2005. Other significant production
increases were attributed to India and Canada,
collectively adding an additional 18% to global supply
since September 2001.
The global oversupply of aluminium has kept demand
for alumina healthy with any downward pressure on
alumina prices due to alumina overproduction. The
impacts of the weakening alumina price were evident
in Western Australia throughout the financial year.
In the second quarter for the period, Alcoa reported
its first quarterly loss in nearly eight years, citing
the weak economy and prices as primary drivers for
costly restructuring. By the end of the third quarter,
Western Australia’s refineries collectively recorded a
3% fall in production. However, in other parts of the
globe, where alumina refining is far less efficient with
considerably higher cash costs, production cutbacks
were recorded across the world’s 70 refineries. For
example, Alcoa and BHP Billiton announced cutback
measures in North America, Latin America and Eastern
Europe.
Weak alumina prices were a major factor in Alcoa
deciding to hold off on plans to expand its Wagerup
refinery. Environmental concerns were another
significant factor in stalling the $1-billion expansion.
The planned expansion would add $400 million
per annum to Western Australia’s export revenue.
Meanwhile, since the completion in September 2000 of
the Worsley refinery expansion, Worsley’s output has
increased to a maximum capacity of 3.1 million tonnes
per annum. BHP Billiton is now considering a further
expansion which could see output creep further up by
16% to 3.7 million tonnes per annum.
Environmental concerns have been a significant
factor in the operation of Western Australia’s alumina

WESTERN AUSTRALIA MINERAL AND PETROLEUM STATISTICS DIGEST 2001–0226 WESTERN AUSTRALIA MINERAL AND PETROLEUM STATISTICS DIGEST 2001–02 27
3.6 GoldAs experienced of late, 2001–02 continued to be
characterised by production reductions and mine
closures. This resulted in the fifth successive year of
falling output from the State’s gold industry. National
gold production levels were also down, having
reached a seven-year low in the March quarter of
2002. Compared with 2000–01, Western Australian
gold sales in 2001–02 dropped 8% to 5.9 million
ounces (185 tonnes). Western Australia’s contribution
to national gold production however, remained
considerable at 67%.
In Australian currency terms, in 2001–02 average
gold prices were 10% higher, up from $501 per
ounce in 2000–01 to $553 per ounce in 2001–02.
In international terms, the average price of gold in
2001–02 was up by 7% on the average for the previous
financial year.
The value of gold exports from Western Australia
totalled $2,681 million in 2001–02, a reduction of
14% on the previous period, while volumes were 16%
down. The top four export destinations were the United
Kingdom, South Korea, Singapore, and Hong Kong.
The consolidation trend for the Australian gold
industry continued throughout 2001–02, driven by the
incentives of cost reduction and the increased likelihood
of attracting institutional investment. In 2001–02,
a number of significant rationalisations occurred,
including the merger of Barrick Gold Corporation
with Homestake Mining Company (December 2001)
and Croesus Mining NL with Central Norseman Gold
Corporation Ltd (January 2002). After acquiring
Western Mining’s (WMC) Agnew and St Ives projects,
Goldfields Limited also merged with Delta Gold Limited
GOLD EXPORTSTOTAL VALUE $2.68 billion
Japan8%
South Korea16%
Singapore16%
United ArabEmirates
3%
Saudi Arabia3%
UK24%
India3%
Other9%
Taiwan3%
Hong Kong15%
Source: MPR Figure 3.19
refineries. In addition to their impact on the expansion
of the Wagerup refinery, Worsley’s liquor burner was
shut down in May 2002 in response to health concerns
raised by the community which began in late 2001.
Other environmental matters concerning the industry
included ground water pollution arising from Alcoa’s
operations at Kwinana, Pinjarra and Wagerup.
In other parts of Australia, work has commenced in
Chadstone, Queensland, on Comalco’s 1.4 million
tonnes per annum smelter grade alumina brownfield
site. The wholly owned Rio Tinto subsidiary estimates
that the refinery will come on-stream by 2005. The
State and federal governments have made additional
funding and infrastructure commitments to the project
which will include wharf facilities, conveyers, grinding
mills, storage silos, coal handling and a rail delivery
system, gas and electricity distribution systems, a
steam generation plant and associated plant buildings.
Initial production levels will be 1.4 million tonnes per
annum with expansion allowing for production of up
to 4 million tonnes per annum. The existing alumina
industry in the area was a drawcard for the attraction
of the new refinery with bauxite and all other inputs,
except caustic soda, being sourced locally.
The number of people employed within the Western
Australian alumina industry in 2001–02 rose marginally
by 3%, compared to a 12% fall in employment levels
recorded in 2000–01, following the completion of the
Worsley refinery expansion. The prospect of future
expansions could see temporary jumps in employment
levels in the medium term. However, Alcoa World
Alumina announced 200 voluntary redundancies during
2001–02 in response to increased efficiency at its
Pinjarra, Kwinana and Wagerup operations. The effect
of these cutbacks is not yet evident.
ABARE forecasts show national Alumina production
increasing in excess of 18.6 million tonnes by
2006–07. With few new projects in the pipeline,
exports are projected to be relatively constant until
expected production increases around 2005–06. On an
annual average basis, exports are expected to increase
at a rate of 2.1% between 2001–02 and 2006–07,
reaching 14.6 million tonnes by 2006–07.
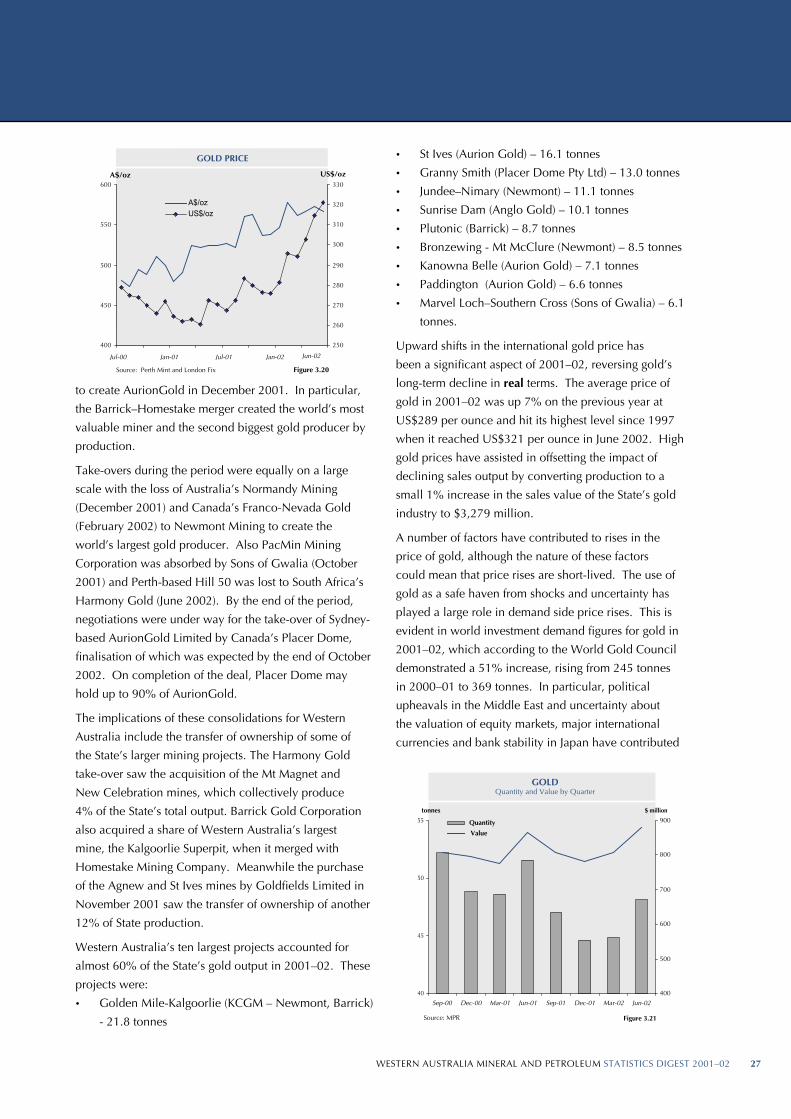
WESTERN AUSTRALIA MINERAL AND PETROLEUM STATISTICS DIGEST 2001–0226 WESTERN AUSTRALIA MINERAL AND PETROLEUM STATISTICS DIGEST 2001–02 27
GOLD PRICE
400
450
500
550
600
Jul-00 Jan-01 Jul-01 Jan-02
A$/oz
250
260
270
280
290
300
310
320
330
US$/oz
A$/ozUS$/oz
Source: Perth Mint and London Fix
Jun-02
Figure 3.20
Quantity
Value
GOLDQuantity and Value by Quarter
40
45
50
55
Sep-00 Dec-00 Mar-01 Jun-01 Sep-01 Dec-01 Mar-02 Jun-02
tonnes
400
500
600
700
800
900
$ million
Source: MPR Figure 3.21
to create AurionGold in December 2001. In particular,
the Barrick–Homestake merger created the world’s most
valuable miner and the second biggest gold producer by
production.
Take-overs during the period were equally on a large
scale with the loss of Australia’s Normandy Mining
(December 2001) and Canada’s Franco-Nevada Gold
(February 2002) to Newmont Mining to create the
world’s largest gold producer. Also PacMin Mining
Corporation was absorbed by Sons of Gwalia (October
2001) and Perth-based Hill 50 was lost to South Africa’s
Harmony Gold (June 2002). By the end of the period,
negotiations were under way for the take-over of Sydney-
based AurionGold Limited by Canada’s Placer Dome,
finalisation of which was expected by the end of October
2002. On completion of the deal, Placer Dome may
hold up to 90% of AurionGold.
The implications of these consolidations for Western
Australia include the transfer of ownership of some of
the State’s larger mining projects. The Harmony Gold
take-over saw the acquisition of the Mt Magnet and
New Celebration mines, which collectively produce
4% of the State’s total output. Barrick Gold Corporation
also acquired a share of Western Australia’s largest
mine, the Kalgoorlie Superpit, when it merged with
Homestake Mining Company. Meanwhile the purchase
of the Agnew and St Ives mines by Goldfields Limited in
November 2001 saw the transfer of ownership of another
12% of State production.
Western Australia’s ten largest projects accounted for
almost 60% of the State’s gold output in 2001–02. These
projects were:
• Golden Mile-Kalgoorlie (KCGM – Newmont, Barrick)
- 21.8 tonnes
• St Ives (Aurion Gold) – 16.1 tonnes
• Granny Smith (Placer Dome Pty Ltd) – 13.0 tonnes
• Jundee–Nimary (Newmont) – 11.1 tonnes
• Sunrise Dam (Anglo Gold) – 10.1 tonnes
• Plutonic (Barrick) – 8.7 tonnes
• Bronzewing - Mt McClure (Newmont) – 8.5 tonnes
• Kanowna Belle (Aurion Gold) – 7.1 tonnes
• Paddington (Aurion Gold) – 6.6 tonnes
• Marvel Loch–Southern Cross (Sons of Gwalia) – 6.1
tonnes.
Upward shifts in the international gold price has
been a significant aspect of 2001–02, reversing gold’s
long-term decline in real terms. The average price of
gold in 2001–02 was up 7% on the previous year at
US$289 per ounce and hit its highest level since 1997
when it reached US$321 per ounce in June 2002. High
gold prices have assisted in offsetting the impact of
declining sales output by converting production to a
small 1% increase in the sales value of the State’s gold
industry to $3,279 million.
A number of factors have contributed to rises in the
price of gold, although the nature of these factors
could mean that price rises are short-lived. The use of
gold as a safe haven from shocks and uncertainty has
played a large role in demand side price rises. This is
evident in world investment demand figures for gold in
2001–02, which according to the World Gold Council
demonstrated a 51% increase, rising from 245 tonnes
in 2000–01 to 369 tonnes. In particular, political
upheavals in the Middle East and uncertainty about
the valuation of equity markets, major international
currencies and bank stability in Japan have contributed

WESTERN AUSTRALIA MINERAL AND PETROLEUM STATISTICS DIGEST 2001–0228 WESTERN AUSTRALIA MINERAL AND PETROLEUM STATISTICS DIGEST 2001–02 29
Rest of Australia Western Australia
GOLD PRODUCTION
0
50
100
150
200
250
300
350
1890 1900 1910 1920 1930 1940 1950 1960 1970 1980 1990 2000
tonnes
Source: MPR and ABARE Figure 3.22
to increased demand. Conversely higher prices have
impacted on industrial and jewellery demand, which
declined by 16% and 14% respectively in 2001–02,
while dental demand remained unchanged.
On the supply side, stable central bank sales and flat
world production are also responsible for gold rallying
above the US$300 per ounce mark. Other factors include
the dramatic shift by gold’s major producers away from
forward contracts. For example, AngloGold Limited, one
of the world’s largest producers, cut its hedge book by
60% during the period from 12.9 million ounces to 7.8
million ounces. Despite this, Australia is the only country
in the world where all the major gold companies are
hedged. Reasons behind producers reducing their hedge
books are the recent increases in gold prices virtually
eliminating the positive forward contango and perhaps
most importantly, the devaluation of local currencies
has significantly increased the value of domestically
denominated gold prices. Consolidation trends in the
industry are further intensifying the spread towards
reduced or no hedge books.
ABARE predictions of acceleration in global economic
activity for 2003 could mean that investors re-weight
their portfolios away from defensive assets such as gold,
resulting in a reduction in investment demand.
In terms of the State gold production outlook, the falling
rate of gold exploration is placing pressure on the level of
economically demonstrated gold resources. Therefore,
the State’s gold production is forecast by ABARE to
continue falling, primarily as a result of older mines
coming to the end of their mine life. Important gold
mining operations that ceased operations during 2001–02
included the Boddington mine, from which output sales
fell from 44,000 ounces in the December 2001 quarter
to 3,000 ounces in the March 2002 quarter. Viceroy
Resource Corporation, owners of the Bounty mine, also
placed the management and control of their Australian
assets with an Administrator, while the Dalgaranga mine
ceased operations in June 2002.
There are however, some significant new gold projects
which should at least ameliorate the declining rate of
production. These include:
• LionOre’s/Dalrymple Resources’ Thunderbox gold
project.
This project near Leinster, is expected to produce
some 220,000 ounces of gold in the first year of
its operation and 150,000 ounces per annum in
subsequent years. All up, total recovered gold is
expected to be 800,000 ounces for the initial five-
year open pit mine life;
• Newcrest’s resurrection of the Telfer gold mine.
Newcrest Mining has confirmed that the Telfer gold
mine resurrection is to go ahead. This mine will
provide the biggest and most dramatic boost to
the State’s gold production. The Telfer operation,
which has reserves of 19 million ounces, is expected
to topple the Superpit as Australia’s biggest gold
mine when it resumes production in late 2004. The
project will include completion of development
of the existing mine with both open pit and
underground mines. Power for the project is to be
supplied from gas-fired turbines supplied from the
North West Shelf; and
• Expansion of the Wandoo underground operations
at Boddington.
The Wandoo expansion, estimated to produce
around 680,000 ounces per year, is subject to
negotiations regarding the proportion of stakes held
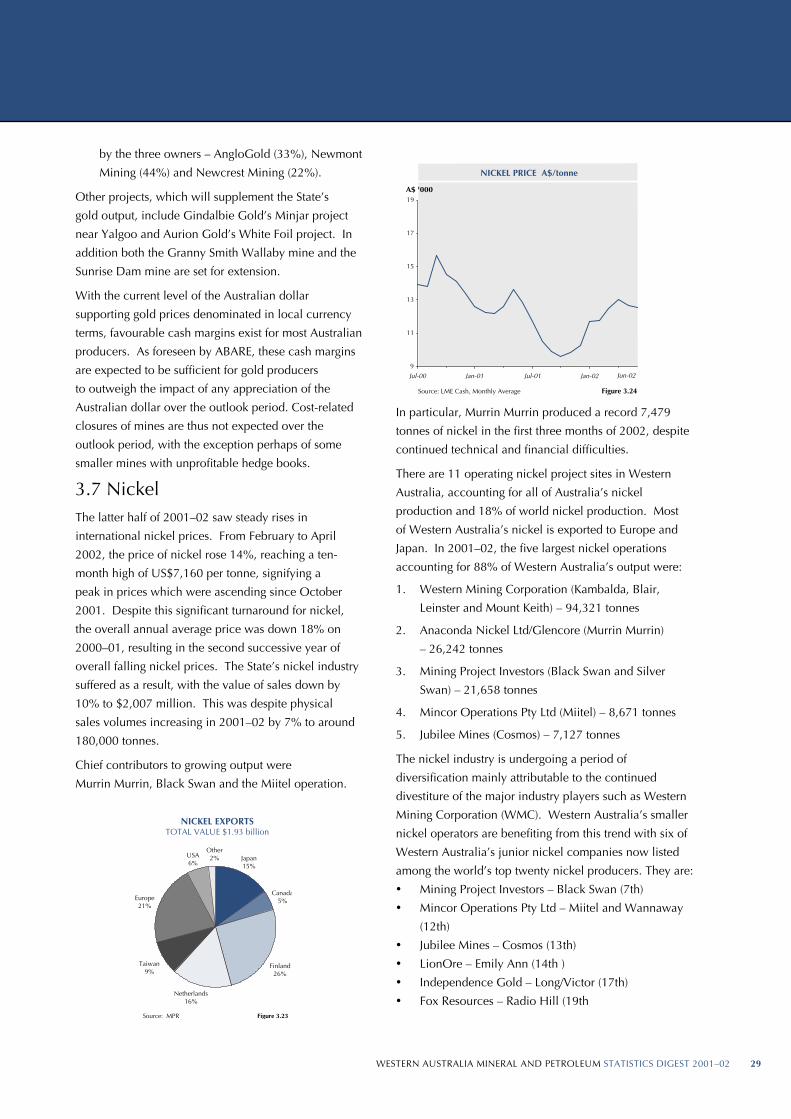
WESTERN AUSTRALIA MINERAL AND PETROLEUM STATISTICS DIGEST 2001–0228 WESTERN AUSTRALIA MINERAL AND PETROLEUM STATISTICS DIGEST 2001–02 29
NICKEL EXPORTSTOTAL VALUE $1.93 billion
Canada5%
Finland26%
Netherlands16%
Taiwan9%
Europe21%
USA6%
Other2% Japan
15%
Source: MPR Figure 3.23
NICKEL PRICE A$/tonne
9
11
13
15
17
19
Jul-00 Jan-01 Jul-01 Jan-02
A$ '000
Source: LME Cash, Monthly Average
Jun-02
Figure 3.24
by the three owners – AngloGold (33%), Newmont
Mining (44%) and Newcrest Mining (22%).
Other projects, which will supplement the State’s
gold output, include Gindalbie Gold’s Minjar project
near Yalgoo and Aurion Gold’s White Foil project. In
addition both the Granny Smith Wallaby mine and the
Sunrise Dam mine are set for extension.
With the current level of the Australian dollar
supporting gold prices denominated in local currency
terms, favourable cash margins exist for most Australian
producers. As foreseen by ABARE, these cash margins
are expected to be sufficient for gold producers
to outweigh the impact of any appreciation of the
Australian dollar over the outlook period. Cost-related
closures of mines are thus not expected over the
outlook period, with the exception perhaps of some
smaller mines with unprofitable hedge books.
3.7 NickelThe latter half of 2001–02 saw steady rises in
international nickel prices. From February to April
2002, the price of nickel rose 14%, reaching a ten-
month high of US$7,160 per tonne, signifying a
peak in prices which were ascending since October
2001. Despite this significant turnaround for nickel,
the overall annual average price was down 18% on
2000–01, resulting in the second successive year of
overall falling nickel prices. The State’s nickel industry
suffered as a result, with the value of sales down by
10% to $2,007 million. This was despite physical
sales volumes increasing in 2001–02 by 7% to around
180,000 tonnes.
Chief contributors to growing output were
Murrin Murrin, Black Swan and the Miitel operation.
In particular, Murrin Murrin produced a record 7,479
tonnes of nickel in the first three months of 2002, despite
continued technical and financial difficulties.
There are 11 operating nickel project sites in Western
Australia, accounting for all of Australia’s nickel
production and 18% of world nickel production. Most
of Western Australia’s nickel is exported to Europe and
Japan. In 2001–02, the five largest nickel operations
accounting for 88% of Western Australia’s output were:
1. Western Mining Corporation (Kambalda, Blair,
Leinster and Mount Keith) – 94,321 tonnes
2. Anaconda Nickel Ltd/Glencore (Murrin Murrin)
– 26,242 tonnes
3. Mining Project Investors (Black Swan and Silver
Swan) – 21,658 tonnes
4. Mincor Operations Pty Ltd (Miitel) – 8,671 tonnes
5. Jubilee Mines (Cosmos) – 7,127 tonnes
The nickel industry is undergoing a period of
diversification mainly attributable to the continued
divestiture of the major industry players such as Western
Mining Corporation (WMC). Western Australia’s smaller
nickel operators are benefiting from this trend with six of
Western Australia’s junior nickel companies now listed
among the world’s top twenty nickel producers. They are:
• Mining Project Investors – Black Swan (7th)
• Mincor Operations Pty Ltd – Miitel and Wannaway
(12th)
• Jubilee Mines – Cosmos (13th)
• LionOre – Emily Ann (14th )
• Independence Gold – Long/Victor (17th)
• Fox Resources – Radio Hill (19th
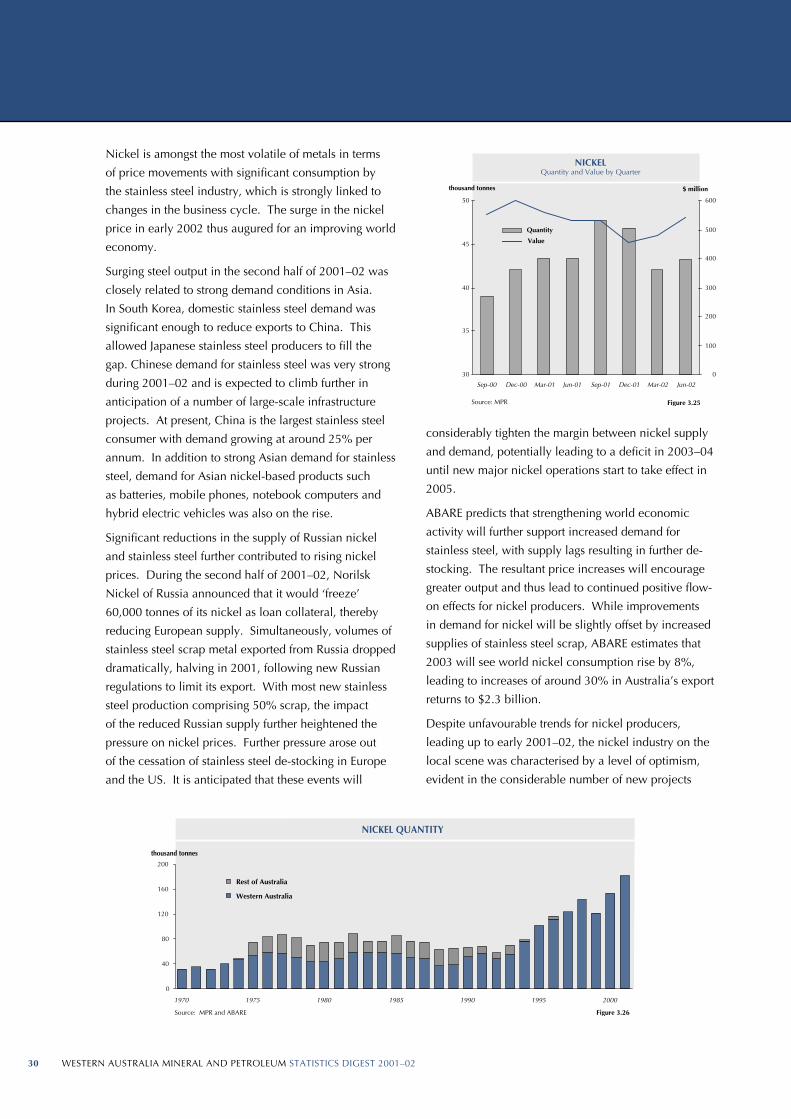
WESTERN AUSTRALIA MINERAL AND PETROLEUM STATISTICS DIGEST 2001–0230 WESTERN AUSTRALIA MINERAL AND PETROLEUM STATISTICS DIGEST 2001–02 31
Rest of Australia
Western Australia
NICKEL QUANTITY
0
40
80
120
160
200
1970 1975 1980 1985 1990 1995 2000
thousand tonnes
Source: MPR and ABARE Figure 3.26
Quantity
Value
Source: MPR Figure 3.25
NICKELQuantity and Value by Quarter
30
35
40
45
50
Sep-00 Dec-00 Mar-01 Jun-01 Sep-01 Dec-01 Mar-02 Jun-02
thousand tonnes
0
100
200
300
400
500
600
$ million
Nickel is amongst the most volatile of metals in terms
of price movements with significant consumption by
the stainless steel industry, which is strongly linked to
changes in the business cycle. The surge in the nickel
price in early 2002 thus augured for an improving world
economy.
Surging steel output in the second half of 2001–02 was
closely related to strong demand conditions in Asia.
In South Korea, domestic stainless steel demand was
significant enough to reduce exports to China. This
allowed Japanese stainless steel producers to fill the
gap. Chinese demand for stainless steel was very strong
during 2001–02 and is expected to climb further in
anticipation of a number of large-scale infrastructure
projects. At present, China is the largest stainless steel
consumer with demand growing at around 25% per
annum. In addition to strong Asian demand for stainless
steel, demand for Asian nickel-based products such
as batteries, mobile phones, notebook computers and
hybrid electric vehicles was also on the rise.
Significant reductions in the supply of Russian nickel
and stainless steel further contributed to rising nickel
prices. During the second half of 2001–02, Norilsk
Nickel of Russia announced that it would ‘freeze’
60,000 tonnes of its nickel as loan collateral, thereby
reducing European supply. Simultaneously, volumes of
stainless steel scrap metal exported from Russia dropped
dramatically, halving in 2001, following new Russian
regulations to limit its export. With most new stainless
steel production comprising 50% scrap, the impact
of the reduced Russian supply further heightened the
pressure on nickel prices. Further pressure arose out
of the cessation of stainless steel de-stocking in Europe
and the US. It is anticipated that these events will
considerably tighten the margin between nickel supply
and demand, potentially leading to a deficit in 2003–04
until new major nickel operations start to take effect in
2005.
ABARE predicts that strengthening world economic
activity will further support increased demand for
stainless steel, with supply lags resulting in further de-
stocking. The resultant price increases will encourage
greater output and thus lead to continued positive flow-
on effects for nickel producers. While improvements
in demand for nickel will be slightly offset by increased
supplies of stainless steel scrap, ABARE estimates that
2003 will see world nickel consumption rise by 8%,
leading to increases of around 30% in Australia’s export
returns to $2.3 billion.
Despite unfavourable trends for nickel producers,
leading up to early 2001–02, the nickel industry on the
local scene was characterised by a level of optimism,
evident in the considerable number of new projects

WESTERN AUSTRALIA MINERAL AND PETROLEUM STATISTICS DIGEST 2001–0230 WESTERN AUSTRALIA MINERAL AND PETROLEUM STATISTICS DIGEST 2001–02 31
and proposed expansions. Driving this optimism are
forecasts that export earnings from nickel will grow
75% over the next two years boosted by increases in
production and higher world prices. ABARE predicts
that earnings in 2003–04 are expected to reach $3.6
billion. Longer-term growth in production is expected
to arise as a result of planned incremental expansions
at existing nickel projects. The largest increases in
mine output are expected from Anaconda Nickel’s
Murrin Murrin operation and WMC’s suite of mines.
Expanding output from LionOres’s Emily Ann mine and
the soon-to-be-recommissioned Long-Victor will also
boost output.
LionOre Australia (Nickel) Ltd commenced operation at
its Emily Ann nickel sulphide project in August 2001.
Located 540 km east of Perth, this project produces
concentrates containing an average of 6,700 tonnes of
nickel per year. However, in an attempt to consolidate
ownership of the Emily Ann and Maggie Hays mine,
Canadian miner LionOre Mining International Ltd has
put in a bid to increase its ownership share of LionOre
Australia, its 80%-owned subsidiary. This will bring
LionOres’s total interest in LionOre Australia (Nickel)
Ltd to 82.3%. The international company also has a
60% stake in the soon-to-be-commissioned Thunderbox
gold mine.
Sally Malay Mining Ltd recently secured US$5 million
project financing for its nickel, copper and cobalt
project in the East Kimberley. With strong support
for the project including an agreement with Jinchuan
Group Ltd and Sino Mining International for uptake of
100% of the project’s concentrate production, the mine
looks to commence production in December 2003.
Construction of the $54-million operation, which is to
include open-cut and underground mining, is expected
to commence by March 2003.
Progress was also made during 2001–02 in the
development prospects of the proposed $950-million
BHP Billiton Ravensthorpe Nickel Project (RNP).
The State Government has committed funding of
$18.4 million to the project on the condition that the
Federal Government matches this, although a federal
commitment has not yet been made. A decision to go
ahead with the project could be reached by mid-2003.
The project is regarded as one of national significance
in terms of the scale of the capital expenditure
involved, the potential export income and employment
and in terms of its strategic importance to the $300
million enhancement of the Yabulu Nickel Refinery in
Townsville.
In other expansion developments, WMC estimates that
the expansion of its Mt Keith nickel operation near
Leinster is between three and five years away. The
planned expansion would entail the company’s nearby
North Six-Mile deposit and Yakabindie nickel deposit,
the latter which was purchased from Rio Tinto early in
2001.
Work on the underground section of the high-grade
Cosmos Deeps ore reserve at Cosmos nickel mine
40 km north of Leinster also progressed during 2002.
This additional underground development will more
than double the life of the present open-pit. Further
exploration by Jubilee Mines is focusing on the Randles
Find nickel sulphide resource in the northeastern
goldfields, which the company hopes to mine. Also,
Western Areas is to commence drilling at its Forrestania
nickel sulphide project following an additional high-
grade find at the site.
In terms of potential new projects, activity has increased
in the West Musgrave Region, 1,300 km northeast of
Perth. WMC and West Musgrave Mining (WMM) are
undertaking drilling in the area, while BHP Billiton
has formed an alliance with WMM to fund exploration
in the area. In addition, ReLODE has reached an
agreement with the Ngaanyatjarra Land Council to
explore land in the region.
Reshuffling in the industry saw the purchase of
Outokumpu’s Kalgoorlie Black Swan and Silver Swan
mines in addition to the Honeymoon Well prospect,
by a consortium led by Mining Project Investors Pty
Ltd (MPI). Honeymoon Well, located between Mt
Keith and Wiluna, is yet undeveloped. The consortium
consisted of Melbourne-based MPI (80%) and the
OM Group (20%). The OM Group also acquired the
Cawse project from Centaur Mining and Exploration in
December 2001.
Other changes of ownership included the purchase of
the Radio Hill Nickel Mine from Titan Resources by
Fox Resources in July 2002. However, Titan Resources
will continue its BioHeap trials adjacent to the Radio
Hill mine, near Karratha. Titan has indicated that the
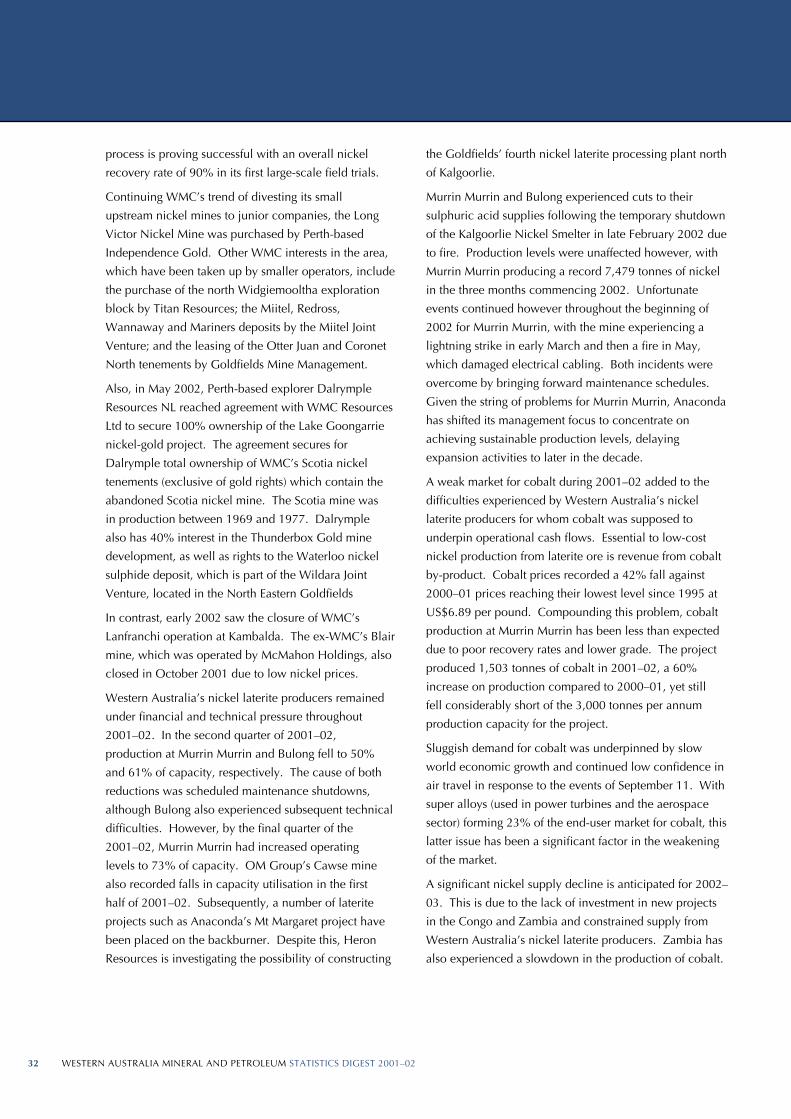
WESTERN AUSTRALIA MINERAL AND PETROLEUM STATISTICS DIGEST 2001–0232 WESTERN AUSTRALIA MINERAL AND PETROLEUM STATISTICS DIGEST 2001–02 33
process is proving successful with an overall nickel
recovery rate of 90% in its first large-scale field trials.
Continuing WMC’s trend of divesting its small
upstream nickel mines to junior companies, the Long
Victor Nickel Mine was purchased by Perth-based
Independence Gold. Other WMC interests in the area,
which have been taken up by smaller operators, include
the purchase of the north Widgiemooltha exploration
block by Titan Resources; the Miitel, Redross,
Wannaway and Mariners deposits by the Miitel Joint
Venture; and the leasing of the Otter Juan and Coronet
North tenements by Goldfields Mine Management.
Also, in May 2002, Perth-based explorer Dalrymple
Resources NL reached agreement with WMC Resources
Ltd to secure 100% ownership of the Lake Goongarrie
nickel-gold project. The agreement secures for
Dalrymple total ownership of WMC’s Scotia nickel
tenements (exclusive of gold rights) which contain the
abandoned Scotia nickel mine. The Scotia mine was
in production between 1969 and 1977. Dalrymple
also has 40% interest in the Thunderbox Gold mine
development, as well as rights to the Waterloo nickel
sulphide deposit, which is part of the Wildara Joint
Venture, located in the North Eastern Goldfields
In contrast, early 2002 saw the closure of WMC’s
Lanfranchi operation at Kambalda. The ex-WMC’s Blair
mine, which was operated by McMahon Holdings, also
closed in October 2001 due to low nickel prices.
Western Australia’s nickel laterite producers remained
under financial and technical pressure throughout
2001–02. In the second quarter of 2001–02,
production at Murrin Murrin and Bulong fell to 50%
and 61% of capacity, respectively. The cause of both
reductions was scheduled maintenance shutdowns,
although Bulong also experienced subsequent technical
difficulties. However, by the final quarter of the
2001–02, Murrin Murrin had increased operating
levels to 73% of capacity. OM Group’s Cawse mine
also recorded falls in capacity utilisation in the first
half of 2001–02. Subsequently, a number of laterite
projects such as Anaconda’s Mt Margaret project have
been placed on the backburner. Despite this, Heron
Resources is investigating the possibility of constructing
the Goldfields’ fourth nickel laterite processing plant north
of Kalgoorlie.
Murrin Murrin and Bulong experienced cuts to their
sulphuric acid supplies following the temporary shutdown
of the Kalgoorlie Nickel Smelter in late February 2002 due
to fire. Production levels were unaffected however, with
Murrin Murrin producing a record 7,479 tonnes of nickel
in the three months commencing 2002. Unfortunate
events continued however throughout the beginning of
2002 for Murrin Murrin, with the mine experiencing a
lightning strike in early March and then a fire in May,
which damaged electrical cabling. Both incidents were
overcome by bringing forward maintenance schedules.
Given the string of problems for Murrin Murrin, Anaconda
has shifted its management focus to concentrate on
achieving sustainable production levels, delaying
expansion activities to later in the decade.
A weak market for cobalt during 2001–02 added to the
difficulties experienced by Western Australia’s nickel
laterite producers for whom cobalt was supposed to
underpin operational cash flows. Essential to low-cost
nickel production from laterite ore is revenue from cobalt
by-product. Cobalt prices recorded a 42% fall against
2000–01 prices reaching their lowest level since 1995 at
US$6.89 per pound. Compounding this problem, cobalt
production at Murrin Murrin has been less than expected
due to poor recovery rates and lower grade. The project
produced 1,503 tonnes of cobalt in 2001–02, a 60%
increase on production compared to 2000–01, yet still
fell considerably short of the 3,000 tonnes per annum
production capacity for the project.
Sluggish demand for cobalt was underpinned by slow
world economic growth and continued low confidence in
air travel in response to the events of September 11. With
super alloys (used in power turbines and the aerospace
sector) forming 23% of the end-user market for cobalt, this
latter issue has been a significant factor in the weakening
of the market.
A significant nickel supply decline is anticipated for 2002–
03. This is due to the lack of investment in new projects
in the Congo and Zambia and constrained supply from
Western Australia’s nickel laterite producers. Zambia has
also experienced a slowdown in the production of cobalt.

WESTERN AUSTRALIA MINERAL AND PETROLEUM STATISTICS DIGEST 2001–0232 WESTERN AUSTRALIA MINERAL AND PETROLEUM STATISTICS DIGEST 2001–02 33
Whether this creates a market deficit will depend
upon the pace at which the world economy recovers.
Expectations are that a recovery will be slow, especially
given speculation in relation to the US economy and
concerns over future terrorist attacks.
3.8 Mineral SandsRunning against the trend for most mineral
commodities, heavy mineral sands prices in 2001–02
were generally positive. However, despite this, after
a healthy 25% increase in sales value in the previous
financial year, the heavy mineral sands industry
contracted in 2001–02 with the value of sales down by
6% to $859 million. This was attributable to drops in
sales volumes, chiefly ilmenite and upgraded ilmenite
products, which were down 287,000 tonnes (26%)
and 57,000 tonnes (9%) respectively. Rutile sales, at
123,000 tonnes were also down by 4% on the previous
year. The volume of zircon sales also decreased,
by more than 7% to 318,000 tonnes. However,
thanks to significant increases in international zircon
prices in 2001–02, sales values increased by 10% to
$219 million.
The heavy mineral sands industry in Western Australia
is concentrated in the southwest area of the State and is
valued at close to $1 billion per annum. The sector is
the sixth largest mineral and petroleum commodity by
value to the State. Production from the heavy mineral
sands industry comprises titanium minerals such as
ilmenite, rutile, leucoxene and synthetic rutile. These
minerals are the feedstock for the production of titanium
dioxide pigment and titanium metal. Other non-
titanium minerals derived from the industry are zircon,
garnet, staurolite and monazite.
The heavy mineral sands industry in Western Australia
is highly consolidated, similar to the global industry,
where five companies control over 75% of current
world production capacity. The four major entities
dominating the State’s mineral sands activities comprise
Iluka Resources, created from the merger of RGC and
Westralian Sands in late 1998 to form the world’s
second largest producer of mineral sands; Cable Sands
(WA); The Tiwest Joint Venture, jointly owned by
Ticor and Kerr McGee Chemical Corporation; and
Millennium Chemicals.
Iluka produce mineral sands from two main regions
in the State, Eneabba (Mid West) and Capel (South
West). Cable Sands operates exclusively in the region
around Bunbury. The Tiwest Joint Venture has mining
operations approximately 170 km north of Perth at
its Cooljarloo mine and processing operations at its
Chandala synthetic rutile plant near Muchea, about
60 km north of Perth. Some synthetic rutile from the
Chandala processing site is railed to its pigment plant in
Kwinana. Millennium Chemicals manufactures titanium
dioxide pigment from synthetic rutile at Kemerton near
Bunbury.
Throughout the first half of 2001–02, prices for
titanium dioxide (TiO2) pigment and feedstock were
flat, however the latter half of the financial year saw
TiO2 prices begin to pick up as pigment producers in
the US and the EU pushed through price increases
in the third quarter of 2001–02. Improved pigment
demand in the fourth quarter of 2001–02 was evident
with increased sales volumes for key producers. For
example, Millennium Chemicals, the world’s second-
largest producer of TiO2, reported a 12% improvement
in year-to-date pigment sale volumes. Higher demand
was attributed to improved global business conditions,
healthy demand from coatings manufacturers, customer
restocking in advance of anticipated price increases
and seasonal effects.
Unfortunately, large inventories initially prevented
corresponding flow-on effect to the titanium feedstock
sector. Worldwide feedstock prices fell in the early
stages of 2002 in response to low demand and
corresponding production cutbacks in the US. By June
2002 however, a clear increase in feedstock demand
was becoming evident resulting in the restarting of
the Tiwest North Cooljarloo mine, which had stopped
in January 2002 to reduce stockpiles. Similarly the
Chandala synthetic rutile plant near Muchea, which
receives production from the Tiwest north and south
Cooljarloo mines, returned to full operating capacity
after operating at 80% capacity since October 2001.
The demand improvements are viewed as a moderate
turning point in the otherwise depressed feedstock
market, where the outlook in the medium term remains
moderate in the wake of anticipated production
increases.

WESTERN AUSTRALIA MINERAL AND PETROLEUM STATISTICS DIGEST 2001–0234 WESTERN AUSTRALIA MINERAL AND PETROLEUM STATISTICS DIGEST 2001–02 35
Unlike potential improvements in the titanium dioxide
pigment market, demand for titanium metals remained
weak throughout 2001–02. AME Mineral Economics
reported that titanium metal production by Timet, the
world’s largest supplier of titanium metal products,
experienced falls in sales throughout 2001–02. The
fourth quarter of 2001–02 saw mill product sales
volumes for Timet drop 30% on the year and 21% on
the quarter, while melted products volumes reflected
a similar trend. The company subsequently reduced
production rates at its US sponge production facility and
took actions to reduce worldwide employment levels.
Expectations are that a difficult business environment
for titanium metal producers will persist in 2003. With
the commercial aerospace sector the major source
of demand for metal titanium products, the severe
downturn in the industry and the sluggish economy are
the primary reasons for the depressed titanium metals
market.
Western Australia exported heavy mineral sands to
the value of $724 million during 2001–02, totalling
85% of total sales in heavy mineral sands. In terms of
destination, the State’s heavy mineral sands are shipped
to a variety of countries throughout the globe, however,
at 23% of total exports, or $169 million, the US accounts
for the largest proportion. Collectively, European
customers comprise 37% of Western Australia’s total
heavy mineral sands exports, with the Netherlands (15%)
and the UK (11%) the next largest countries after the US
in terms of sales. North America alone is attributed with
33% of total world titanium dioxide consumption based
on 2001 data and therefore plays an important role in
world titanium feedstock markets.
Amongst the titanium feedstock group of minerals,
prices compared to the previous year were generally
up, albeit only marginally. In 2001–02 ilmenite and
rutile recorded rises of 3% and 4% respectively, with
ilmenite recording an average price of $155 per tonne
while rutile averaged $960 per tonne. Despite these
averages, titanium feedstock prices (especially rutile)
fluctuated considerably throughout 2001–02 reflecting
the uncertain and depressed global market for titanium
pigment and metals.
In terms of value, synthetic rutile, or upgraded ilmenite,
continued to dominate Western Australia’s mineral
sands industry constituting 44% of total value, despite
a fall of $35 million in 2001–02 to $374 million.
Rutile was also down on the last period, by 3% at
$107 million. Rutile formed just over 17% of the
total sales value for the heavy mineral sands sector in
Western Australia. Ilmenite sales value also dropped
dramatically, by 24% ($40 million) to $129 million.
While demand for pigment is expected to remain
steady, in the short to medium term the outlook for
HEAVY MINERAL SANDSValue by Quarter
170
180
190
200
210
220
230
240
250
Sep-00 Dec-00 Mar-01 Jun-01 Sep-01 Dec-01 Mar-02 Jun-02
$ million
Source: MPR Figure 3.28
HEAVY MINERAL SANDS PRICE INDEX
125
130
135
140
Jul-00 Jan-01 Jul-01 Jan-02
Source: WA Treasury
A$ Index (June 1990 = 100)
Figure 3.29
Jun-02
HEAVY MINERAL SANDS EXPORTSTOTAL VALUE $723.65 million
Japan9%
Malaysia4%
UK11%
USA23%
Saudi Arabia4%
Other6%
Netherlands15%
Taiwan6%
Spain4%
Europe11%
China7%
Source: MPR Figure 3.27
WESTERN AUSTRALIA MINERAL AND PETROLEUM STATISTICS DIGEST 2001–0234 WESTERN AUSTRALIA MINERAL AND PETROLEUM STATISTICS DIGEST 2001–02 35
the titanium feedstock group of minerals is mixed, with
high inventory levels continuing to leave the market
oversupplied relative to pigment demand. Macquarie
Research estimates average ilmenite prices to increase
by approximately $8 per tonne over the next two years,
averaging $150 per tonne by 2004 and remaining
at that level up to 2006. Rutile and upgraded rutile
however are expected to experience greater upward
price movement in the short to medium term with rutile
prices expected to jump from an average of US$458
per tonne in 2003 to over US$500 per tonne by 2006.
Shifts in the price of synthetic rutile are less pronounced
with an increase of US$5 per tonne expected for 2003,
increasing by another US$33 per tonne to just over
US$360 per tonne by 2006.
In 2001–02 Western Australian zircon sales amounted to
approximately 318,000 tonnes, valued at $219 million.
In 2001–02 zircon accounted for 26% of the total
sales value of the State’s heavy mineral sands industry.
While New South Wales, Victoria and Queensland also
produce zircon, Western Australia dominates national
production, accounting for 86% of the nation’s total.
Overall, Australia is the world’s largest zircon producer.
Iluka Resources, Cable Sands and the Tiwest Joint
Venture are the main producers of zircon. In addition
to its classification as a gemstone, zircon also has a
variety of industrial applications such as in glassmaking,
ceramics, electronics and specialty optical glasses
including television picture tube glass.
Zircon prices remained remarkably strong following
buoyant demand in China, averaging US$689 per tonne
during 2001–02, up 18% on the previous financial year.
According to Industrial Minerals Information Ltd
(UK), zircon demand is heavily linked to the ceramics
industry, accounting for approximately 55% of demand.
Europe is the most important market for zircon followed
closely by Asia including China, with China comprising
approximately 60% of Asian zircon demand. Chinese
ceramics production has boomed in recent years and is
expected to increase further in tandem with increased
demand for zircon in the production of picture tube
glass and zirconium metals production. China is now
estimated to account for more than 18% of the world’s
consumption of zircon. Demand in China has grown on
average at 12% per year over the last decade.
Garnet production in Western Australia during 2001–02
was undertaken wholly in the South West and totalled
102,276 tonnes. Meanwhile staurolite production is
now being produced in commerical quantities,
2,129 tonnes for 2001–02 by Tiwest at their Cooljarloo
operation.
Despite the sombre state of affairs for the duration of
2001–02 in the heavy mineral sands industry, with only
leucoxene and zircon recording increases in sales value,
the industry is experiencing a steady range of activity
with a number of new developments during 2001–02 in
Western Australia.
In terms of new mining activity, the commencement
of operation at the new $30-million Doral Dardanup
Mineral Sands Mine in the latter half of 2002 marked
a significant event in the industry. The project, which
includes a refurbishment of the dry processing plant
near Picton, is expected to continue for ten years
producing 120,000 tonnes per annum of titanium-
based minerals and 10,000 tonnes per annum of zircon.
Officially opening in October, the mine is the first
major greenfields mining project by a new player in the
region in recent years. Other developments included
the application by Cable Sands (WA) to re-mine the
titanium minerals ore body adjacent to D’Entrecasteaux
National Park at the Jangardup South Mineral Sands
Mine. The application is subject to environmental
approval.
Also, exploration by Magnetic Minerals in the Dongara
area has resulted in the discovery of significant mineral
sands resources. Located 35 km north of the Iluka
Resources Eneabba Mine, Magnetic is looking to
develop the resources under joint venture, acquisition
or merger arrangements.
However, contention continues to shroud the proposed
Ludlow Tuart Forest Cable Sands project. The project
would occupy 147 hectares or 4.3% of the Ludlow
Tuart Forest in the South West, between Bunbury and
Busselton and would process 7 million tonnes of ore
over 3 to 4 years. An assessment of the proposal by the
Environmental Protection Authority (EPA) was expected
in June 2002 however the volume of submissions
received by the EPA has caused the assessment of the
process to now be delayed until early 2003.
In expansion news, Millennium Chemicals announced
plans to expand the Kemerton Titanium Dioxide

WESTERN AUSTRALIA MINERAL AND PETROLEUM STATISTICS DIGEST 2001–0236 WESTERN AUSTRALIA MINERAL AND PETROLEUM STATISTICS DIGEST 2001–02 37
Pigment Plant. Millennium has valued the planned
expansion at $470 million, although further progress
on the proposal will depend upon market conditions.
Assuming the expansion takes place, production at
the plant will increase to 190,000 tonnes per annum.
In other expansions, Tiwest Joint Venture received
environmental approval for the expansion of its
Kwinana titanium dioxide pigment plant.
In other potential expansion developments, Iluka
Resources and Outokumpu-Lurgi Mettallurgie
announced the intention to develop the first synthetic
rutile plant based on a new process which allows
the production of synthetic rutile from a wider array
of ilmenite feedstocks. Termed “NewGen SR” this
new process allows for low-value ilmenite, such as
that found in the Murray Basin, to be upgraded into
premium synthetic rutile using a low-temperature
hydrogen-based reduction technique. The process
includes the removal of manganese, magnesium and
chromium. Iluka and Outokumpu have signed an
exclusive agreement to construct a new synthetic
rutile plant, which will incorporate NewGen SR. It is
hoped the new plant will be in production by 2006
with the joint venture currently devoting 12 months to
establishing the engineering requirements of the plant.
However, on the contractionary side, Iluka decided to
cease plans to expand its operations in Capel. Valued
at $50 million, the expansion would have increased
production levels by 50,000 tonnes per annum. The
expansion was to focus on the refurbishment of an old
kiln to bring it back into production. However the
age and condition of the plant, in conjunction with
the estimated cost of the refurbishment, deemed the
proposal unfeasible. Iluka’s preference is to increase
output at its existing southwest leaching plant by
undertaking a $2-million upgrade to be completed by
early 2003. The upgrade will facilitate extra synthetic
rutile production of around 12,000 tonnes per annum.
Iluka is also investigating the possibility of increasing
output and production efficiency through new
processing technologies such as NewGen SR described
above.
Meanwhile, research undertaken by CSIRO has centred
on the high costs of producing titanium arising from
inefficiencies in the standard production process.
Research has included the examination of five new
titanium technologies which should assist in reducing
production costs and increase the size of the titanium
market which globally currently stands around 70,000
tonnes per annum. The five technologies include:
• Electrowinning using a molten salt bath;
• Fluidised bed;
• Plasma powder processing;
• Plasma ingot processing; and
• Continuous spray processing.
The technologies aim to reduce the processing chain
with the ultimate aim being the production of titanium
metal directly from ilmenite. According to the CSIRO,
development of lower cost titanium process technology
to produce industrial grade titanium could open up new
markets to the titanium sector in transport, construction,
and chemical processing. In addition, titanium’s non-
corrosive properties make it especially suitable for the
maritime sector. As with the NewGen SR technology,
CSIRO processing research aims to assist with the
handling of resources from the Murray Darling Basin –
believed to be one of the richest mineral sands deposits
on Earth. The CSIRO suggests that the potential halving
Rest of Australia
Western Australia
HEAVY MINERAL SANDSVALUE OF PRODUCTION
Includes Ilmenite, Leucoxene, Upgraded Ilmenite, Rutile, Zircon and Monazite
200
400
600
800
1,000
1,200
1957 1962 1967 1972 1977 1982 1987 1992 1997 2001
$ million
Source: MPR and ABARE Figure 3.30
0
WESTERN AUSTRALIA MINERAL AND PETROLEUM STATISTICS DIGEST 2001–0236 WESTERN AUSTRALIA MINERAL AND PETROLEUM STATISTICS DIGEST 2001–02 37
of the cost of titanium production, combined with the
expansive resource available within the Murray Darling
Basin, could herald a new era for titanium within
Australia and the light metals group.
The heavy mineral sands industry within Australia
underwent moderate ownership shifts during 2001–02.
At a corporate level, the Tiwest Joint Venture underwent
a slight change of influence following Anglo American’s
strengthened position in the iron ore industry through
acquisition of a 10% stake in Kumba resources. Kumba
Resources owns almost 50% of Ticor, which in turn has
a 50% share in the Tiwest Joint Venture. Meanwhile,
in April of 2002, Japan’s Itochu Corporation and Tochu
Corporation acquired a 70% share in the Kemerton silica
sands project from Sons of Gwalia following Gwalia’s
divesture of non-core assets.
Iluka Resources also completed its takeover bid for
Basin Minerals in November of 2002. In doing so Iluka
became a significant player in the emerging Murray
Basin Mineral Sands province through the development
of the Douglas and KWR mines. The Murray Basin
straddles Victoria, New South Wales and South Australia
over an area of 300,000 sq km and at this stage is
believed to contain over 80 million tonnes of rutile,
zircon, ilmenite and leucoxene. Aside from Iluka,
these resources are predominantly controlled by BeMax
Resources NL (Gingko deposit), Southern Titanium NL
(Mindarie) and Murray Basin Titanium (Wemen and
Birthday Gift) — a joint venture between Sons of Gwalia
and RZM Pty Ltd. According to the New South Wales
Department of Mineral Resources, by early 2002, six
mines could be operating in the province, with Wemen
having commenced operation in 2001.
3.9 DiamondsIn contrast to last year’s fall in sales, the Western
Australian diamond industry recorded a small 1%
increase in sales volumes to 25.7 million carats in
2001–02. Diamond prices however, continued to fall
leading to a further downward slide in the value of sales,
by 20% to $489 million.
Nevertheless, Western Australia remains a prominent
diamond producer on a global scale with the Argyle
diamond mine accounting for approximately 22% of
world’s total mine production. Renewed interest in the
industry with increased exploration and investment also
suggests that the contribution of the diamond industry to
Western Australia will remain firm.
The world market for diamonds in 2001–02, in keeping
with global economic growth, remained sluggish. Key
diamond markets in Asia, the US and Europe remained
soft with US conditions in particular causing difficulty
for those involved in the diamond jewellery market.
A large proportion of Western Australia’s uncut
diamonds are exported to India and US demand
conditions have a significant flow-on effect for the
State’s industry. About half of the global trade in
gem quality diamonds is destined for the supply of
US customers and 35% of diamond exports from the
Indian cutting and polishing industry are destined for
the US. In 2001–02, the Indian diamond industry
experienced considerable negative growth with export
volumes falling on average 15% in both quarters for
the first half of 2001–02. The events of September 11
further contributed to the poor market conditions with
an additional downturn noted for the final months of
2001, although Christmas sales were unexpectedly high
compared with previous years.
Weak market conditions were reflected in poor sales by
the former London-based Central Selling Organisation
(CSO), now the De Beers-owned Diamond Trading
Company (DTC) which handles about two-thirds of the
world’s annual supply of rough diamonds by value.
Ashton Mining, the wholly owned subsidiary of Rio
Tinto and owner of the Argyle Diamond Mine, began
stockpiling production in late 2001 in an attempt to
limit supply and reduce the downward pressure on
prices evident in price cuts offered by De Beers during
the period.
Western Australia’s economic diamond resources
are based on very large, low gem quality diamonds
as extracted by the Argyle operation. Subsequently,
by value, Australia is ranked seventh in the world for
diamond production, yet produces the largest volume
of diamonds, accounting for almost 24% of world
volume. Only about 5% of Argyle diamonds are gem
quality, with 40% near gem quality and the remaining
55% industrial quality diamonds. This compares with
overall global production proportions comprising about
10% gem, 55% near gem quality and the remaining
35% industrial quality. Located near Kununurra, the
Argyle diamond mine traditionally accounts for about
WESTERN AUSTRALIA MINERAL AND PETROLEUM STATISTICS DIGEST 2001–0238 WESTERN AUSTRALIA MINERAL AND PETROLEUM STATISTICS DIGEST 2001–02 39
90% of Australia’s diamond production, however the
commencement of production at Western Australia’s
new Ellendale mine during 2001–02 marks the end
of Argyle’s 20-year role as the State’s sole diamond
producer. Higher gem quality diamonds are also
extracted in the Northern Territory at the Merlin mine.
In 2001–02, a highlight of the State’s diamond
industry was the opening of stage one of the new
Ellendale diamond mine near Broome in the Kimberley
region. The commencement of operations follows
the amendment of legislation to excise the Ellendale
Diamond Lease from the Diamond (Argyle Diamond
Mines Joint Venture) Agreement Act 1981-83,
facilitating the transfer of the tenement from its former
Argyle owners to Perth-based Kimberley Diamond
Company who were keen to develop the tenement.
The new lease extends over 117 sq km of the West
Kimberley and includes 13 diamondiferous pipes.
The commencement of mining operations at Ellendale
in May 2002 is expected to currently add 500,000
tonnes of ore per annum to the State’s ore processing
volume. However, in the long term, treatment rates
of between 2 and 4 million tonnes per annum are
expected. While the mine was officially opening
in September 2002, by July 2002 Ellendale already
produced 4,552 carats of gem quality diamonds.
Stage one of the Ellendale project is focused on the
Ellendale 9 Pipe comprising rich near-surface resources.
After 12 to 15 months, the project will shift its focus
to the near surface zone of Ellendale 4. For the first
quarter of 2002–03, the new operation is expected to
produce around 13,000 carats, increasing to 16,000
carats for the second quarter. Full annual production is
expected to be around 60,000 carats.
While India is experiencing a flurry of exploration
activity in the wake of the country’s new National
Minerals Policy, Western Australia’s Kimberley region is
experiencing its own renaissance. Renewed interest in
the area is evident in the opening of the Ellendale mine
as well as a series of new joint ventures and exploration
activities.
An agreement was announced in March 2002 between
Striker Resources NL and joint venture partner AKD
Limited to explore for diamonds at the Seppelt Range
diamond prospect in the Kimberley. The joint venture
has returned good initial results with the Seppelt 2
kimberlite pipe producing initial findings comprising
2.25 carats per tonne, a result, which potentially signifies
a world-class grade. Striker Resources is the largest
holder of ground in the north Kimberley, with tenements
covering an area of 9,000 sq km. Trial mining on Seppelt
1 and Seppelt 2 is expected to commence in early 2003.
Flinders Diamond Limited has indicated that it plans
to explore in an area 200 km southwest of the Argyle
Diamond mine known as Skeleton Flat. The company is
also hoping to open South Australia’s first diamond mine
either at its Springfield or Adelaide Hills projects.
In other more global developments, in 2001–02, the
United Nations regulatory initiative known as the
Kimberley Process gained considerable momentum.
The Process is designed to stem the trade of ‘conflict
diamonds’ — defined as those rough diamonds used
by rebel movements or their allies to finance weapons,
fuels and other material used to undermine legitimate
governments. This issue is particularly pertinent in
certain areas of Africa such as Angola, the Democratic
Republic of Congo and Sierra Leone where atrocities
against humanity have been funded by the illicit trade in
conflict diamonds. It is estimated that conflict diamonds
account for about 4% of the world diamond market.
The Kimberley Process includes the signing of the
Conflict Diamonds Treaty by all nations producing,
trading and manufacturing rough diamonds. Signatory
nations will be required not to accept imports from, nor
allow exports to, other nations that have not signed the
treaty. In addition an international certification scheme
comprising Kimberley Process Certificates (KPC’s) will
accompany all rough diamond shipments. In July 2002
the World Diamond Congress resolved to implement the
process, with signatory nations expected to sign the treaty
by the end of 2002.
At a state level, a new Western Australia Police Service
Unit, named the Diamond and Pearl Investigation Unit,
has been formed to focus on investigating crime and
identifying security issues specific to the diamond and
pearling industries. The Unit will specifically target
systematic and organised theft as well as offer support to
companies to resolve security problems.

WESTERN AUSTRALIA MINERAL AND PETROLEUM STATISTICS DIGEST 2001–0238 WESTERN AUSTRALIA MINERAL AND PETROLEUM STATISTICS DIGEST 2001–02 39
3.10 Base MetalsAnother casualty of lower world commodity prices
was the Western Australian base metals industry which
suffered a 21% drop in sales value to $338 million. The
most significant contributor to the fall in sales value
was zinc. The substantial fall in world zinc prices,
exacerbated by a 5% cut in zinc sale volumes combined
in 2001–02 to see the value of the State’s zinc industry
fall by 38% to $173 million.
In Western Australia, zinc is mined at two operations,
comprising Newmont Mining’s (through Murchison Zinc
Company) Golden Grove operation, 225 km east of
Geraldton and Western Metals’ Lennard Shelf operations,
40 km south of Fitzroy Crossing in the Kimberley.
Compared with 2000–01, zinc prices were 25% lower
in 2001–02, averaging US$791 per tonne. The global
economic downturn in 2001 and massive surpluses of
zinc production were the major causes for the price
decline. Thanks to cuts in mine production and a surge
of zinc concentrate imports by China, zinc prices looked
likely to have bottomed out in November 2001 when a
14-year low was recorded.
Copper sales on the other hand, at 58,000 tonnes, were
up by a substantial 35%. However, due to poor prices,
this translated to a smaller 14% increase in sales value to
$127 million. Overall, copper prices in 2001–02 were
15% lower than in 2000–01, with the average
in 2001–02 being US$1,517 per tonne compared to
US$1,784 per tonne in 2000–01.
The chief copper producers in Western Australia,
accounting for more than 80% of the State’s output are
Straits Resources’ Nifty project in the Pilbara which
produces cathode grade metal and the aforementioned
Murchison Zinc Golden Grove operation. Remaining
copper is sourced as by-product from a range of nickel
projects.
Like zinc, Western Australian lead production comes
from only two sources, namely Murchison Zinc’s
Golden Grove operation and Western Metals’ Lennard
Shelf operations. In 2001–02, total lead sale volumes
were down by 7,250 tonnes, or 9%. The average price
of lead in 2001–02 was US$474 per tonne, almost
unchanged from 2000–01. Weak physical demand has
been the chief culprit behind lacklustre lead prices and
a small depreciation in the Australian dollar over the
year was unable to negate the drop in sale volumes.
This translated to a 2% decrease in sales value in
2001–02 to $37 million. Over the medium to longer
term, lead demand from the lead-acid battery industry
is anticipated to rise on the back of a strengthening
world economy. Downward pressures from the supply
side are also likely to be alleviated owing to the lack
of committed new mine projects. Accordingly, it is
expected that there may be some light in the world lead
market for the years beyond 2002.
3.11 Other MineralsCoalWestern Australia has two coal producers, Wesfarmers
and Griffin. They are located in the southwest of
the State and all of the State’s coal supplies are sold
on the domestic market. The majority is used by
Western Power for electricity generation. The quantity
of coal sales were only marginally higher by1% in
2001–02 to reach 6.2 million tonnes. The value of
these sales was up by 2% to $258 million.
Salt In 2001–02, the quantity of salt sales increased by
4% to 8.6 million tonnes. Thanks to better prices
and the devaluation of local currency, the value of
Western Australian salt sales increased by 8% to a
record $251 million.
The State’s salt production was boosted during
2001–02 in no small part due to Onslow Salt
commencing production. The Onslow Salt project
began harvesting in April 2001 with first shipments
being made in the latter half of 2001. The Onslow salt
project is now the seventh solar salt field in Western
Australia. It is expected that Onslow will gradually
ramp-up to full production of 2.5 million tonnes per
annum by mid-2003.
Significantly, in July 2001, Dampier Salt purchased
Cargill’s Port Hedland salt operation. The Port Hedland
operation presently produces and exports around three
million tonnes of salt per annum and the acquisition
significantly expands Dampier Salt’s current production
capacity to make it the world’s largest salt exporter.
Dampier Salt’s production is exported, principally
to Asia, with its largest customers in the chemical
industry in Japan, South Korea, Taiwan and Indonesia.

WESTERN AUSTRALIA MINERAL AND PETROLEUM STATISTICS DIGEST 2001–0240 WESTERN AUSTRALIA MINERAL AND PETROLEUM STATISTICS DIGEST 2001–02 41
A proportion of output is used for food processing and
domestic consumption in Malaysia and the Philippines.
Dampier Salt, a majority-owned company of Rio Tinto,
originally established the Dampier salt field in 1972
and purchased the Lake MacLeod operation in 1978.
Dampier Salt also has a gypsum operation at Lake
MacLeod. Cargill Australia is wholly-owned by Cargill
Inc., a private company with significant salt interests in
North and South America.
TantalumDue to favourable sale prices and record sales volume
levels, in 2001–02 tantalum and spodumene sector’s
sales value increased by 36% to around $220 million.
Tantalum is a rare, grey-blue metal. It is chiefly
used in the electronics industry for manufacturing
capacitors, with the electronics industry accounting for
approximately 60% of total global demand. Another
fast growing application for tantalum is as an alloy in
the manufacture of turbine blades for power stations
and jet engines, as tantalum improves structural integrity
of the blades, enabling the turbines to operate at higher
temperatures.
Western Australia is the sole source of tantalum
production in Australia, with output of tantalum
concentrate (30% Ta2O5) chiefly emanating from Sons
of Gwalia’s (SOG) operations in Greenbushes and
Wodgina. Significantly, Greenbushes and Wodgina are
the world’s largest and second largest tantalum mines
respectively and the two mines together constitute
about half of the world’s defined tantalum resources.
All up, output from these operations currently accounts
for 45% of world supply.
Dramatic increases in tantalum sale volumes during
2001–02 were mainly attributable to expansion of
SOG’s operations. However, in addition, output also
came from a new producer, Haddington International
Resources.
Haddington commenced mining operations in May–July
2001 at Bald Hill, in the Eastern Goldfields region and
made its first shipment of concentrate in August 2001.
The company is also carrying out a feasibility study of
the Cattlin Creek deposit in the Ravensthorpe area.
The prospects are good for further growth in tantalum
output. In addition to the Haddington operation
commencing, the second half of 2002 also saw
Australasian Gold Mines NL commence mining
operations at Dalgaranga in the Murchison.
Strong growth in the international electronics industry
has led to a resurgence in demand for tantalum and
commensurately higher prices. Therefore, there
has been heightened interest in exploring for and
developing new tantalum mines. 2001 has already
witnessed the start up of a new operation with
Haddington.
CobaltThe growing nickel industry in Western Australia and
burgeoning prominence of nickel laterite projects has
seen the State exhibit a commensurately significant
increase in its output of cobalt as a nickel by-product.
Ten years ago the volume of the State’s cobalt sales was
less than 500 tonnes, valued at a little over $6 million.
In 2001–02 the volume was 4,512 tonnes, with a sales
value greater than $133 million. Compared with
2000–01, this represented an 8% increase in sales
volume, which was in keeping with the growing nickel
sales output.
However, cobalt prices averaged US$8.09 per pound
during the year, compared to US$14 per pound in
2000–01. This 42% drop in prices was primarily due to
sluggish world economic growth and the events of
September 11. This dramatic fall in prices translated to
the value of Western Australian cobalt sales dropping
by 24% in 2001–02.
The short run outlook for cobalt remains gloomy.
Although some positive signs indicate world economic
recovery has emerged, the pace of this recovery is
slower than anticipated. Consumer confidence in air
travel is still relatively low given the lingering worries
about terrorist attacks in the US. As a result, a total
recovery of the aerospace sector is still in doubt. Many
super alloy producers are expecting difficult times to
continue for the next few months. Consequently, cobalt
prices look likely to remain below US$8 per pound
in the near term. In line with expected higher output
levels, the improvement in world economic growth is
unlikely to be able to boost cobalt prices significantly
over the medium to longer term.
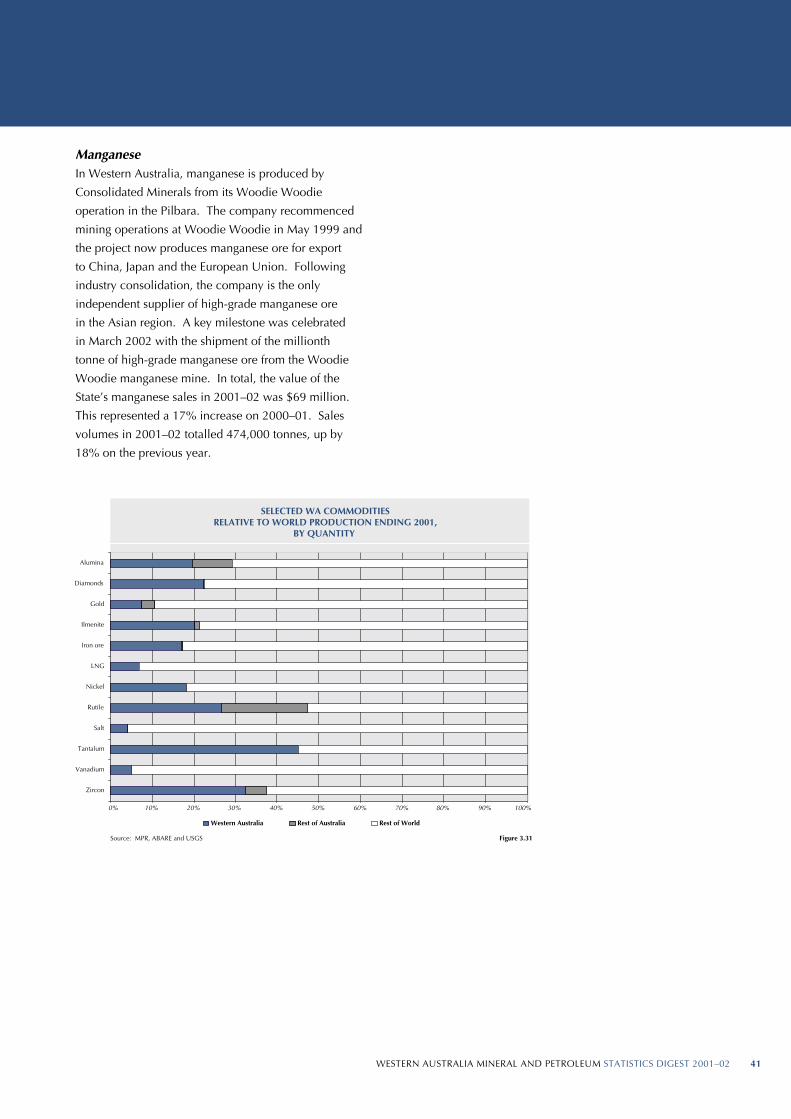
WESTERN AUSTRALIA MINERAL AND PETROLEUM STATISTICS DIGEST 2001–0240 WESTERN AUSTRALIA MINERAL AND PETROLEUM STATISTICS DIGEST 2001–02 41
SELECTED WA COMMODITIESRELATIVE TO WORLD PRODUCTION ENDING 2001,
BY QUANTITY
0% 10% 20% 30% 40% 50% 60% 70% 80% 90% 100%
Zircon
Vanadium
Tantalum
Salt
Rutile
Nickel
LNG
Iron ore
Ilmenite
Gold
Diamonds
Alumina
Western Australia Rest of Australia Rest of World
Figure 3.31Source: MPR, ABARE and USGS
ManganeseIn Western Australia, manganese is produced by
Consolidated Minerals from its Woodie Woodie
operation in the Pilbara. The company recommenced
mining operations at Woodie Woodie in May 1999 and
the project now produces manganese ore for export
to China, Japan and the European Union. Following
industry consolidation, the company is the only
independent supplier of high-grade manganese ore
in the Asian region. A key milestone was celebrated
in March 2002 with the shipment of the millionth
tonne of high-grade manganese ore from the Woodie
Woodie manganese mine. In total, the value of the
State’s manganese sales in 2001–02 was $69 million.
This represented a 17% increase on 2000–01. Sales
volumes in 2001–02 totalled 474,000 tonnes, up by
18% on the previous year.

WESTERN AUSTRALIA MINERAL AND PETROLEUM STATISTICS DIGEST 2001–0242 WESTERN AUSTRALIA MINERAL AND PETROLEUM STATISTICS DIGEST 2001–02 43
TABLE 1 QUANTITY AND VALUE OF MINERALS AND PETROLEUM
2000-2001 2001-2002
COMMODITY UNIT QUANTITY VALUE QUANTITY VALUE
ALUMINA t 10,479,429 3,600,668,963 10,856,507 3,584,378,494BASE METALS Copper Metal t 42,616 (r) 111,116,266 (r) 57,634 127,050,045 Lead Metal t 82,326 37,308,780 (r) 75,076 36,723,119 Zinc Metal t 236,089 280,239,658 223,669 173,815,927TOTAL BASE METALS 428,664,704 (r) 337,589,091
CHROMITE t 33,014 6,898,498 5,678 450,582CLAYS Attapulgite t 12,366 1,291,319 12,623 1,318,221 Clay Shale t 11,783 117,830 11,751 117,510 Fire Clay t 70,320 (r) 150,614 (r) 9,999 58,779 Kaolin t 440 45,508 400 42,243 Saponite t 1,273 91,582 1,679 114,216TOTAL CLAYS 1,696,853 (r) 1,650,969
COAL t 6,102,813 252,281,765 6,164,194 258,125,908CONSTRUCTION MATERIALS Aggregate t 284,164 2,776,441 650,749 5,631,178 Gravel t 161,947 1,059,089 351,451 1,293,087 Rock t 251,360 2,074,419 249,449 1,625,004 Sand t 1,174,861 (r) 5,874,215 (r) 1,523,462 6,856,634 Sandstone t 1,100 55,000 300 16,500TOTAL CONSTRUCTION MATERIALS 11,839,164 (r) 15,422,403
DIAMONDS ct 25,419,431 614,453,364 25,690,416 488,543,677
DIMENSION STONE Granite t 1,448 (r) 366,995 (r) 802 176,531 Marble t 131 48,640 95 31,980TOTAL DIMENSION STONE 415,635 (r) 208,511
GEM AND SEMI-PRECIOUS STONES kg 146,787 134,243 435,280 403,929
GOLD kg 201,205 (r) 3,245,063,559 (r) 184,998 (e) 3,279,499,524 (e)
GYPSUM t 947,380 (r) 18,470,170 (r) 1,343,995 25,652,962
HEAVY MINERAL SANDS Garnet t 111,637 n/a 102,276 n/a Ilmenite t 1,088,613 168,745,136 801,236 128,753,900 Upgraded Ilmenite (a) t 643,274 409,192,214 585,913 374,202,281 Leucoxene t 39,814 18,052,535 39,768 19,442,862 Rutile t 127,213 110,036,230 122,610 106,743,027 Staurolite t 192 37,407 2,129 332,509 Zircon t 343,080 198,837,333 317,770 218,836,980TOTAL HEAVY MINERAL SANDS 904,900,855 848,311,559
INDUSTRIAL PEGMATITE MINERALS Feldspar t 56,245 2,520,890 (r) 36,027 1,685,053IRON ORE Domestic t 6,646,444 207,408,487 7,248,189 234,109,266 Exported t 155,123,446 4,705,296,377 (r) 152,538,701 4,864,843,627TOTAL IRON ORE 161,769,890 4,912,704,864 (r) 159,786,890 5,098,952,893
LIMESAND-LIMESTONE-DOLOMITE Dolomite t 9,103 (r) 146,074 (r) 17,080 315,846
Limesand-Limestone t 3,825,671 (r) 15,740,387 (r) 2,892,454 14,379,958
TOTAL LIMESAND-LIMESTONE-DOLOMITE 15,886,461 (r) 14,695,804
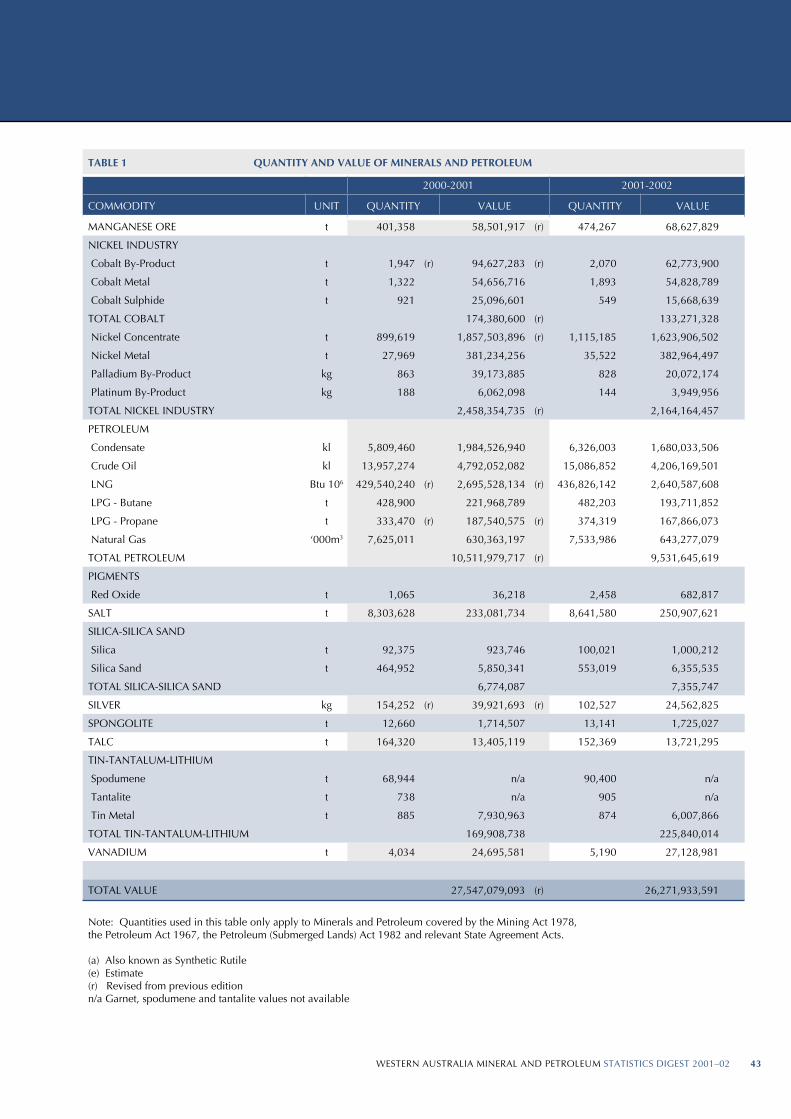
WESTERN AUSTRALIA MINERAL AND PETROLEUM STATISTICS DIGEST 2001–0242 WESTERN AUSTRALIA MINERAL AND PETROLEUM STATISTICS DIGEST 2001–02 43
TABLE 1 QUANTITY AND VALUE OF MINERALS AND PETROLEUM
2000-2001 2001-2002
COMMODITY UNIT QUANTITY VALUE QUANTITY VALUE
MANGANESE ORE t 401,358 58,501,917 (r) 474,267 68,627,829
NICKEL INDUSTRY
Cobalt By-Product t 1,947 (r) 94,627,283 (r) 2,070 62,773,900
Cobalt Metal t 1,322 54,656,716 1,893 54,828,789
Cobalt Sulphide t 921 25,096,601 549 15,668,639
TOTAL COBALT 174,380,600 (r) 133,271,328
Nickel Concentrate t 899,619 1,857,503,896 (r) 1,115,185 1,623,906,502
Nickel Metal t 27,969 381,234,256 35,522 382,964,497
Palladium By-Product kg 863 39,173,885 828 20,072,174
Platinum By-Product kg 188 6,062,098 144 3,949,956
TOTAL NICKEL INDUSTRY 2,458,354,735 (r) 2,164,164,457
PETROLEUM
Condensate kl 5,809,460 1,984,526,940 6,326,003 1,680,033,506
Crude Oil kl 13,957,274 4,792,052,082 15,086,852 4,206,169,501
LNG Btu 106 429,540,240 (r) 2,695,528,134 (r) 436,826,142 2,640,587,608
LPG - Butane t 428,900 221,968,789 482,203 193,711,852
LPG - Propane t 333,470 (r) 187,540,575 (r) 374,319 167,866,073
Natural Gas ‘000m3 7,625,011 630,363,197 7,533,986 643,277,079
TOTAL PETROLEUM 10,511,979,717 (r) 9,531,645,619
PIGMENTS
Red Oxide t 1,065 36,218 2,458 682,817
SALT t 8,303,628 233,081,734 8,641,580 250,907,621
SILICA-SILICA SAND
Silica t 92,375 923,746 100,021 1,000,212
Silica Sand t 464,952 5,850,341 553,019 6,355,535
TOTAL SILICA-SILICA SAND 6,774,087 7,355,747
SILVER kg 154,252 (r) 39,921,693 (r) 102,527 24,562,825
SPONGOLITE t 12,660 1,714,507 13,141 1,725,027
TALC t 164,320 13,405,119 152,369 13,721,295
TIN-TANTALUM-LITHIUM
Spodumene t 68,944 n/a 90,400 n/a
Tantalite t 738 n/a 905 n/a
Tin Metal t 885 7,930,963 874 6,007,866
TOTAL TIN-TANTALUM-LITHIUM 169,908,738 225,840,014
VANADIUM t 4,034 24,695,581 5,190 27,128,981
TOTAL VALUE 27,547,079,093 (r) 26,271,933,591
Note: Quantities used in this table only apply to Minerals and Petroleum covered by the Mining Act 1978, the Petroleum Act 1967, the Petroleum (Submerged Lands) Act 1982 and relevant State Agreement Acts.
(a) Also known as Synthetic Rutile(e) Estimate(r) Revised from previous editionn/a Garnet, spodumene and tantalite values not available

WESTERN AUSTRALIA MINERAL AND PETROLEUM STATISTICS DIGEST 2001–0244 WESTERN AUSTRALIA MINERAL AND PETROLEUM STATISTICS DIGEST 2001–02 45
TABLE 2 QUANTITY AND VALUE OF SELECTED MAJOR COMMODITIES
1992-93 1993-94 1994-95 1995-96 1996-97 1997-98 1998-99 1999-00 2000-01 2001–02
Unit Quantity Value $M Quantity Value $M Quantity Value $M Quantity Value $M Quantity Value $M Quantity Value $M Quantity Value $M Quantity Value $M Quantity Value $M Quantity Value $M
ALUMINA Mt 7.55 1,818.12 7.83 1,784.32 7.91 1,684.60 8.23 1,918.34 8.35 1,955.77 8.51 2,260.54 8.86 2,367.03 9.35 2,657.89 10.48 3,600.67 10.86 3,584.38
BASE METALS
Copper Metal kt 22.92 27.44 32.46 40.26 29.20 76.54 23.69 65.42 27.73 58.98 29.43 61.12 24.44 43.71 30.73 64.62 42.62 111.12 57.63 127.05
Lead Metal kt 22.30 6.65 21.11 4.98 21.10 9.20 21.28 12.64 13.49 6.09 27.00 10.45 51.55 17.25 64.47 20.24 82.33 37.31 75.08 36.72
Zinc Metal kt 127.96 104.11 136.39 79.54 132.85 95.84 113.49 75.32 88.37 75.12 124.00 117.11 194.90 170.73 232.59 251.01 236.01 280.24 223.67 173.82
TOTAL BASE METALS 138.20 124.78 181.58 153.39 140.19 188.68 231.69 335.87 428.67 337.59
COAL Mt 5.43 244.77 5.15 236.29 5.86 274.75 5.90 270.36 5.56 257.30 5.71 257.28 5.80 256.74 6.50 271.53 6.10 252.28 6.16 258.13
DIAMONDS M ct 24.83 519.98 28.86 476.75 23.93 480.03 33.52 525.21 52.52 395.79 42.48 537.87 51.23 610.44 50.98 703.67 25.42 614.45 25.69 488.54
GOLD tonnes 179.80 2,834.19 193.60 3,415.06 187.85 3,132.87 205.89 3,404.65 228.02 3,409.61 239.46 3,468.95 219.26 3,219.52 204.96 2,951.26 201.21 3,245.06 185.00 3,279.50
HEAVY MINERAL SANDS
Ilmenite Mt 0.99 81.66 1.07 92.32 0.99 89.65 1.10 111.18 1.10 117.28 1.31 149.14 1.32 158.59 1.16 151.66 1.10 168.75 0.80 128.75
Rutile kt 75.93 42.14 68.93 35.76 107.78 56.13 119.14 75.06 110.96 77.74 104.13 78.58 119.71 90.97 98.49 72.78 127.21 110.04 122.61 106.74
Upgraded Ilmenite (Synthetic Rutile) kt 396.00 184.67 402.00 185.84 490.00 228.29 517.00 252.56 545.00 270.48 688.00 355.79 475.54 275.23 552.51 324.65 643.27 409.19 585.91 374.20
Zircon kt 302.46 49.19 349.13 63.10 477.05 129.77 410.03 181.21 324.09 177.99 321.38 169.13 284.53 136.07 348.11 153.27 343.08 198.84 317.77 218.84
Other HMS 10.29 13.92 14.56 18.50 26.51 24.63 19.44 28.85 18.08 19.78
TOTAL HEAVY MINERAL SANDS 367.95 390.94 518.40 638.51 670.00 777.27 680.30 731.20 904.90 848.31
IRON ORE Mt 111.73 2,991.14 119.69 2,865.16 133.13 2,794.31 132.90 2,924.06 141.29 3,159.65 149.74 3,930.77 141.03 3,898.53 151.16 3,722.12 161.77 4,912.70 159.79 5,098.95
MANGANESE ORE kt 251.53 46.89 315.79 42.01 71.91 8.84 347.04 41.34 324.11 37.62 86.30 9.39 27.40 3.42 212.38 25.68 401.36 58.50 474.27 68.63
NICKEL kt 53.27 472.17 61.11 458.62 92.99 897.12 103.30 1,097.30 114.10 1,051.11 135.19 1,146.64 125.77 876.62 143.93 1,806.29 167.45 2,238.74 179.78 2,006.87
PETROLEUM
Condensate Gl 2.00 363.04 2.35 348.71 2.64 398.34 4.65 685.74 5.73 943.15 6.76 1,065.84 5.55 743.91 6.35 1,583.94 5.81 1,984.53 6.33 1,680.03
Crude oil Gl 4.54 855.69 5.33 815.33 9.90 1,559.65 9.65 1,535.67 10.47 1,915.93 9.85 1,567.16 9.16 1,189.64 12.05 3,144.77 13.96 4,792.05 15.09 4,206.17
LNG Btu 1012 254.47 1,025.06 296.36 1,015.68 356.11 1,262.51 379.79 1,350.92 370.50 1,528.77 379.54 1,591.94 391.90 1,434.42 393.61 1,971.06 429.54 2,695.53 436.83 2,640.59
LPG - Butane kt 0 0 0 0 0 0 100.24 22.71 209.69 59.67 376.09 90.47 388.69 90.62 443.58 190.90 428.90 221.97 482.20 193.71
LPG - Propane kt 0 0 0 0 0 0 87.02 19.73 185.74 55.66 263.26 61.26 259.21 57.63 334.57 145.94 333.47 187.54 374.32 167.87
Natural Gas Gm3 3.96 407.02 4.46 413.37 5.37 445.71 6.31 454.76 6.89 534.65 6.88 557.47 6.44 549.83 6.55 578.76 7.63 630.36 7.53 643.28
TOTAL PETROLEUM 2,650.81 2,593.09 3,666.21 4,069.53 5,037.83 4,934.14 4,066.65 7,615.37 10,511.98 9,531.65
SALT Mt 6.63 158.38 6.16 149.18 7.18 155.14 7.45 154.22 7.55 153.62 8.19 188.70 8.57 199.64 8.81 208.58 8.30 233.08 8.60 250.91
OTHER 105.14 119.60 164.52 192.44 192.18 234.85 245.00 315.52 546.05 518.47
TOTAL 12,347.74 12,655.80 13,958.37 15,389.35 16,460.67 17,935.08 16,655.58 21,344.98 27,547.08 26,271.93
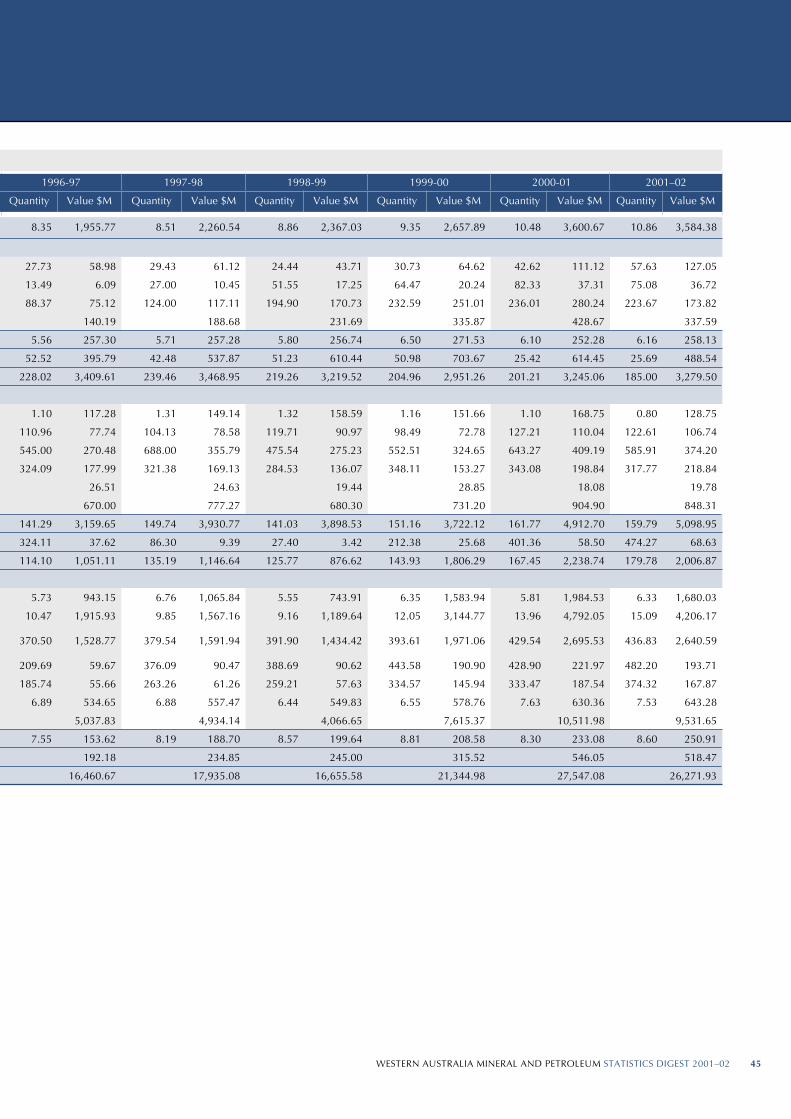

WESTERN AUSTRALIA MINERAL AND PETROLEUM STATISTICS DIGEST 2001–0246 WESTERN AUSTRALIA MINERAL AND PETROLEUM STATISTICS DIGEST 2001–02 47
TABLE 3 FINANCIAL YEAR 2001–02QUANTITY AND VALUE BY LOCAL GOVERNMENT AREA
COMMODITY LOCAL GOVT AUTHORITYQUANTITY(TONNES)
METALLICCONTENT
VALUERef (p. 62)
ALUMINA Boddington 3,104,023 1,075,827,778 Murray 5,474,167 1,770,529,032 Waroona 2,278,317 738,021,684
TOTAL ALUMINA 10,856,507 3,584,378,494 (c), (d)BASE METALS Cu tonnesCopper By-Product Coolgardie 7,193 11,289,784
Dundas 101 294,132 Ravensthorpe 202 580,461 Roebourne 3,036 8,791,176 Wiluna 269 768,146 Total 10,800 21,723,699 (a), (b)
Cu %Copper Concentrates Yalgoo 19.75 42,411,962 (a)
Cu tonnesCopper Cathode East Pilbara 23,308 62,914,384 (a)
Total Copper 127,050,045 (a), (b)Pb %
Lead Derby-West Kimberley 99,729 71.23 34,787,637 Yalgoo 13,811 29.27 1,935,482 Total 113,540 36,723,119 (a)
Zn %Zinc Yalgoo 170,197 40.64 53,104,607
Derby-West Kimberley 270,599 57.09 120,711,320
Total 440,796 173,815,927 (a)
TOTAL BASE METALS 337,589,091
Cr203%
CHROMITE Meekatharra 14,690 38.65 450,582 (a)
CLAY
Attapulgite Mullawa 12,623 1,318,221
Clay Shale Collie 11,751 117,510
Fire Clay Broome 2,350 49,600
Chittering 7,649 9,179 Total 9,999 58,779
Kaolin Bridgetown-Greenbushes 400 42,243
Saponite Coorow 1,679 114,216
TOTAL CLAY 36,452 1,650,969 (e)
COAL 6,164,194 258,125,908 (f)
CONSTRUCTION MATERIALSAggregate Broome 51,176 1,453,782
East Pilbara 4,050 22,713 Port Hedland Town 29,527 176,793 Roebourne 391,834 2,937,330 Wyndham-East Kimberley 174,162 1,040,560 Total 650,749 5,631,178
Gravel Broome 30,935 192,801
Collie 170,000 93,500
Coolgardie 38,507 226,992
Kalamunda 106,399 744,793
Wyndham-East Kimberley 5,610 35,001
Total 351,451 1,293,087
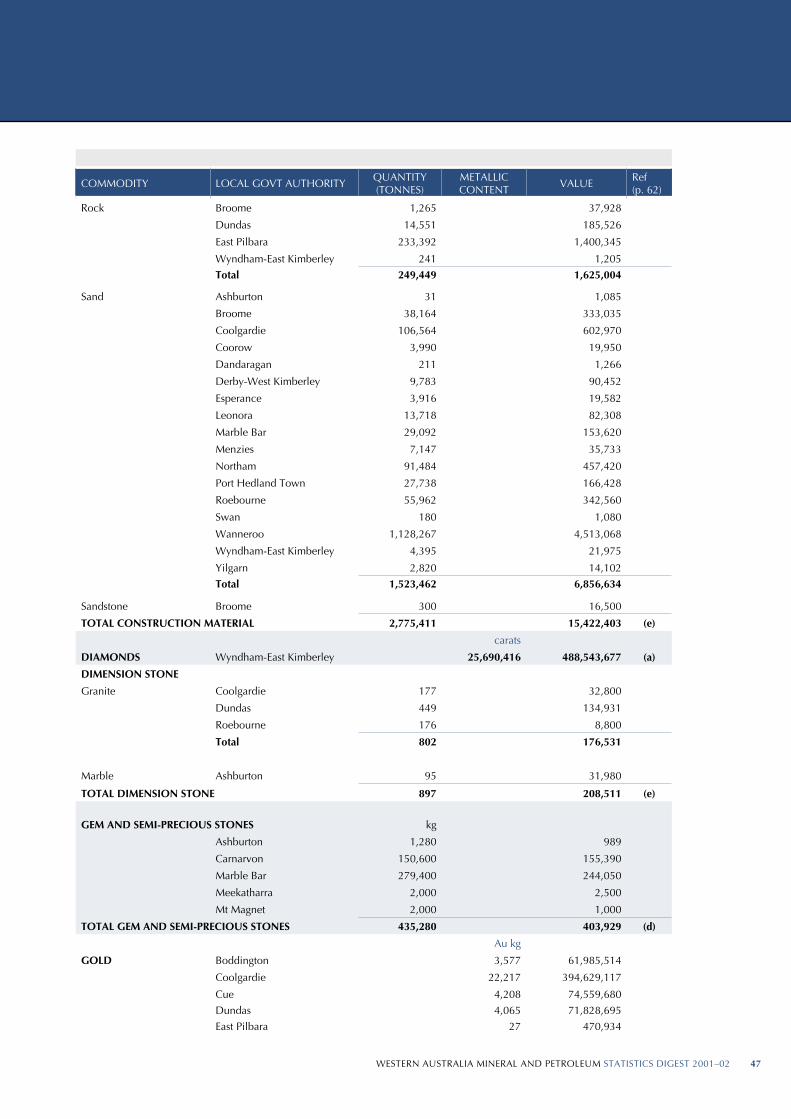
WESTERN AUSTRALIA MINERAL AND PETROLEUM STATISTICS DIGEST 2001–0246 WESTERN AUSTRALIA MINERAL AND PETROLEUM STATISTICS DIGEST 2001–02 47
COMMODITY LOCAL GOVT AUTHORITYQUANTITY(TONNES)
METALLICCONTENT
VALUERef (p. 62)
Rock Broome 1,265 37,928
Dundas 14,551 185,526
East Pilbara 233,392 1,400,345
Wyndham-East Kimberley 241 1,205
Total 249,449 1,625,004
Sand Ashburton 31 1,085
Broome 38,164 333,035
Coolgardie 106,564 602,970
Coorow 3,990 19,950
Dandaragan 211 1,266
Derby-West Kimberley 9,783 90,452
Esperance 3,916 19,582
Leonora 13,718 82,308
Marble Bar 29,092 153,620
Menzies 7,147 35,733
Northam 91,484 457,420
Port Hedland Town 27,738 166,428
Roebourne 55,962 342,560
Swan 180 1,080
Wanneroo 1,128,267 4,513,068
Wyndham-East Kimberley 4,395 21,975
Yilgarn 2,820 14,102
Total 1,523,462 6,856,634
Sandstone Broome 300 16,500
TOTAL CONSTRUCTION MATERIAL 2,775,411 15,422,403 (e)
carats
DIAMONDS Wyndham-East Kimberley 25,690,416 488,543,677 (a)
DIMENSION STONE
Granite Coolgardie 177 32,800
Dundas 449 134,931
Roebourne 176 8,800
Total 802 176,531
Marble Ashburton 95 31,980
TOTAL DIMENSION STONE 897 208,511 (e)
GEM AND SEMI-PRECIOUS STONES kg
Ashburton 1,280 989
Carnarvon 150,600 155,390
Marble Bar 279,400 244,050
Meekatharra 2,000 2,500
Mt Magnet 2,000 1,000
TOTAL GEM AND SEMI-PRECIOUS STONES 435,280 403,929 (d)
Au kg
GOLD Boddington 3,577 61,985,514
Coolgardie 22,217 394,629,117
Cue 4,208 74,559,680
Dundas 4,065 71,828,695
East Pilbara 27 470,934
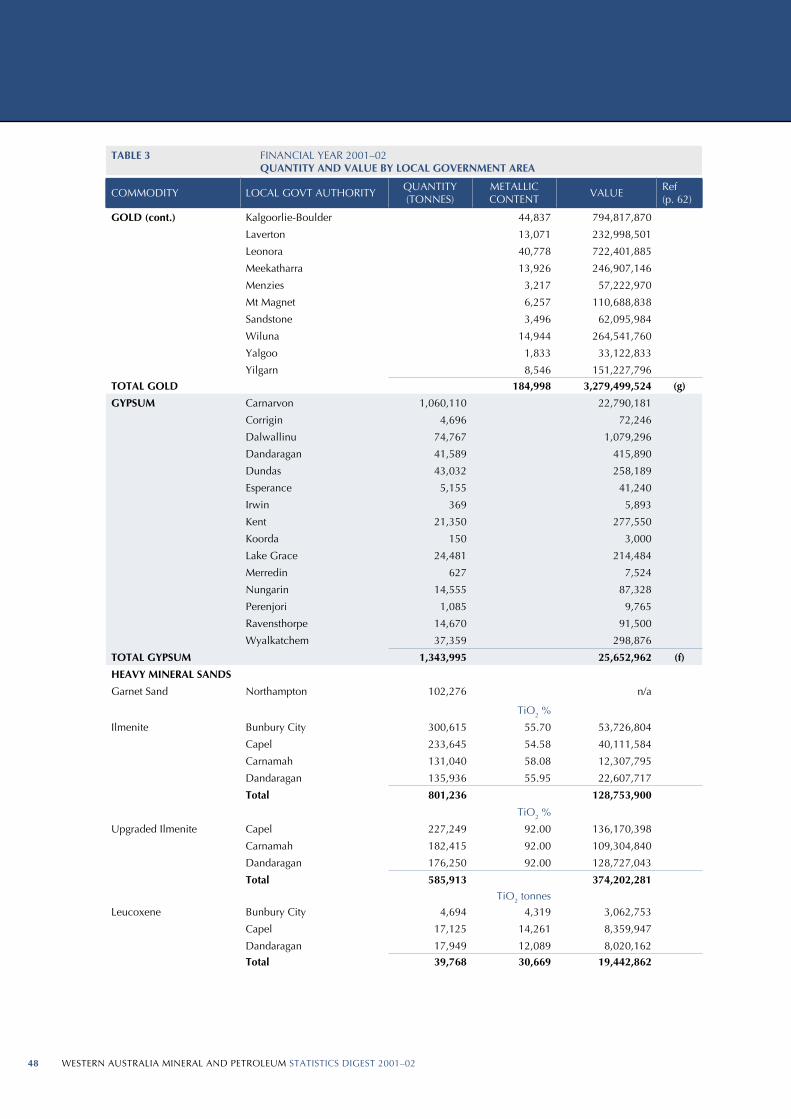
WESTERN AUSTRALIA MINERAL AND PETROLEUM STATISTICS DIGEST 2001–0248 WESTERN AUSTRALIA MINERAL AND PETROLEUM STATISTICS DIGEST 2001–02 49
TABLE 3 FINANCIAL YEAR 2001–02QUANTITY AND VALUE BY LOCAL GOVERNMENT AREA
COMMODITY LOCAL GOVT AUTHORITYQUANTITY(TONNES)
METALLICCONTENT
VALUERef (p. 62)
GOLD (cont.) Kalgoorlie-Boulder 44,837 794,817,870
Laverton 13,071 232,998,501
Leonora 40,778 722,401,885
Meekatharra 13,926 246,907,146
Menzies 3,217 57,222,970
Mt Magnet 6,257 110,688,838
Sandstone 3,496 62,095,984
Wiluna 14,944 264,541,760
Yalgoo 1,833 33,122,833
Yilgarn 8,546 151,227,796
TOTAL GOLD 184,998 3,279,499,524 (g)
GYPSUM Carnarvon 1,060,110 22,790,181
Corrigin 4,696 72,246
Dalwallinu 74,767 1,079,296
Dandaragan 41,589 415,890
Dundas 43,032 258,189
Esperance 5,155 41,240
Irwin 369 5,893
Kent 21,350 277,550
Koorda 150 3,000
Lake Grace 24,481 214,484
Merredin 627 7,524
Nungarin 14,555 87,328
Perenjori 1,085 9,765
Ravensthorpe 14,670 91,500
Wyalkatchem 37,359 298,876
TOTAL GYPSUM 1,343,995 25,652,962 (f)
HEAVY MINERAL SANDS
Garnet Sand Northampton 102,276 n/a
TiO2 %
Ilmenite Bunbury City 300,615 55.70 53,726,804
Capel 233,645 54.58 40,111,584
Carnamah 131,040 58.08 12,307,795
Dandaragan 135,936 55.95 22,607,717
Total 801,236 128,753,900
TiO2 %
Upgraded Ilmenite Capel 227,249 92.00 136,170,398
Carnamah 182,415 92.00 109,304,840
Dandaragan 176,250 92.00 128,727,043
Total 585,913 374,202,281
TiO2 tonnes
Leucoxene Bunbury City 4,694 4,319 3,062,753
Capel 17,125 14,261 8,359,947
Dandaragan 17,949 12,089 8,020,162
Total 39,768 30,669 19,442,862

WESTERN AUSTRALIA MINERAL AND PETROLEUM STATISTICS DIGEST 2001–0248 WESTERN AUSTRALIA MINERAL AND PETROLEUM STATISTICS DIGEST 2001–02 49
COMMODITY LOCAL GOVT AUTHORITYQUANTITY(TONNES)
METALLICCONTENT
VALUERef (p. 62)
HEAVY MINERAL SANDS (cont.) TiO2 tonnes
Rutile Bunbury City 4,328 4,049 3,801,320
Carnamah 91,803 86,409 80,446,637
Dandaragan 26,479 25,186 22,495,070
Total 122,610 115,644 106,743,027
Staurolite Dandaragan 2,129 332,509
ZrO2 tonnes
Zircon Bunbury City 32,307 20,999 19,489,857
Capel 59,522 38,689 40,026,465
Carnamah 145,633 94,662 99,794,235
Dandaragan 80,308 52,200 59,526,423
Total 317,770 206,550 218,836,980
TOTAL HEAVY MINERAL SANDS 2,350,417 858,540,920 (a)
INDUSTRIAL PEGMATITE MINERALS
Feldspar Marble Bar 34,184 1,645,325
Mukinbudin 1,843 39,728
Total 36,027 1,685,053 (e)
IRON ORE Fe%
Domestic Ore East Pilbara 7,248,189 63.19 234,109,266
Fe%
Exported Ore Ashburton 74,122,994 61.27 2,272,145,755
Derby-West Kimberley 507,793 65.87 17,293,157
East Pilbara 74,458,700 63.13 2,463,307,993
Yilgarn 3,449,214 61.11 112,096,722
Total 152,538,701 4,864,843,627
TOTAL IRON ORE 159,786,890 5,098,952,893 (a)
LIMESAND-LIMESTONE-DOLOMITE
Dolomite Lake Grace 7,315 146,300
Yilgarn 9,765 169,546
Total 17,080 315,846
Limesand-Limestone Broome 933 4,664
Carnamah 14,151 56,604
Cockburn 1,934,876 5,707,883
Coorow 17,375 86,875
Dandaragan 33,480 200,301
Dundas 216,315 3,244,725
Exmouth 1,127 6,009
Gingin 30,395 587,532
Irwin 176,449 505,614
Kwinana 7,267 29,961
Leonora 86,068 172,136
Manjimup 3,163 48,689
Shark Bay 805 112,627
Wanneroo 333,293 3,542,824
Wiluna 36,757 73,514
Total 2,892,454 14,379,958
TOTAL LIMESAND-LIMESTONE-DOLOMITE 2,909,534 14,695,804 (e)
Mn%
MANGANESE ORE East Pilbara 474,267 51.19 68,627,829 (a)

WESTERN AUSTRALIA MINERAL AND PETROLEUM STATISTICS DIGEST 2001–0250 WESTERN AUSTRALIA MINERAL AND PETROLEUM STATISTICS DIGEST 2001–02 51
TABLE 3 FINANCIAL YEAR 2001–02QUANTITY AND VALUE BY LOCAL GOVERNMENT AREA
COMMODITY LOCAL GOVT AUTHORITYQUANTITY(TONNES)
METALLICCONTENT
VALUERef (p. 62)
NICKEL INDUSTRY Co tonnes
Cobalt By-Product Coolgardie 1,328 38,933,428
Dundas 37 1,098,224
Kalgoorlie-Boulder 303 9,548,089
Ravensthorpe 42 1,364,266
Roebourne 243 8,137,688
Wiluna 118 3,692,205
Total 2,070 62,773,900
Cobalt Metal Kalgoorlie-Boulder 391 7,282,239
Laverton 1,502 47,546,550
Total 1,893 54,828,789
Cobalt Sulphide Kalgoorlie-Boulder 549 15,668,639
TOTAL COBALT 4,512 133,271,328 (a), (b)
Ni tonnes
Nickel Concentrates Coolgardie 295,594 18,231 199,300,232
Dundas 14,172 1,842 22,953,970
Kalgoorlie-Boulder 118,697 24,562 279,309,793
Leonora 320,405 38,215 431,559,909
Ravensthorpe 35,258 3,324 36,939,662
Roebourne 43,362 4,413 49,950,765
Wiluna 287,697 53,673 603,892,171
Total 1,115,185 144,260 1,623,906,502
Ni tonnes
Nickel Metal Kalgoorlie-Boulder 9,280 98,368,373
Laverton 26,242 284,596,124
Total 35,522 382,964,497
TOTAL NICKEL 179,782 2,006,870,999 (i)
Pd kg
Palladium By-Product Coolgardie 734 17,824,658
Roebourne 94 2,247,516
Total 828 20,072,174 (b)
Pt kg
Platinum By-Product Coolgardie 144 3,949,956 (b)
TOTAL NICKEL INDUSTRY 2,164,164,457
PETROLEUM Kilolitres
Condensate Ashburton 366,176 92,932,385
Carnamah 151 6,717
Irwin 990 240,385
Roebourne 5,958,686 1,586,854,019
Total 6,326,003 1,680,033,506
Kilolitres
Crude Oil Ashburton 3,615,822 1,115,825,694
Irwin 6,129 1,538,318
Roebourne 11,464,901 3,088,805,489
Total 15,086,852 4,206,169,501
Btu 106
LNG Roebourne 436,826,142 2,640,587,608
Tonnes
LPG - Butane Roebourne 482,203 193,711,852
Tonnes
LPG - Propane Roebourne 374,319 167,866,073

WESTERN AUSTRALIA MINERAL AND PETROLEUM STATISTICS DIGEST 2001–0250 WESTERN AUSTRALIA MINERAL AND PETROLEUM STATISTICS DIGEST 2001–02 51
COMMODITY LOCAL GOVT AUTHORITYQUANTITY(TONNES)
METALLICCONTENT
VALUERef (p. 62)
PETROLEUM (cont.)
‘000 m³
Natural Gas Ashburton 1,361,287 79,768,552
Carnamah 36,816 5,323,040
Irwin 139,560 16,208,654
Roebourne 5,996,323 541,976,833
Total 7,533,986 643,277,079
TOTAL PETROLEUM PRODUCTS 9,531,645,619 (d)
PIGMENTS
Red Oxide Cue 2,458 682,817 (a)
SALT Ashburton 836,130 22,852,000 (a)
Carnarvon 1,517,541 44,203,810 (a)
Esperance 10,094 405,086 (h)
Port Hedland Town 1,417,571 40,568,661 (a)
Roebourne 3,858,695 113,160,913 (a)
Shark Bay 891,744 24,093,611 (a)
Wyalkatchem 125 10,277 (h)
Yilgarn 109,680 5,613,263 (h)
TOTAL SALT 8,641,580 250,907,621
SILICA-SILICA SAND
Silica Moora 100,021 1,000,212
Silica Sand Albany 119,473 2,479,800
Coolgardie 100,101 245,995
Swan 333,445 3,629,740
Total 553,019 6,355,535
TOTAL SILICA-SILICA SAND 7,355,747 (a)
Ag kg
SILVER BY-PRODUCT Coolgardie 182 48,783 (a), (j)
Derby-West Kimberley 1,620 476,925 (a), (b)
Roebourne 9,142 2,475,727 (a), (j)
Statewide 26,440 6,662,549
Yalgoo 65,143 14,898,841 (a), (j)
TOTAL SILVER 102,527 24,562,825
SPONGOLITE Plantagenet 13,141 1,725,027 (h)
TALC Meekatharra 19,795 2,783,955
Three Springs 132,574 10,937,340
TOTAL TALC 152,369 13,721,295 (f)
TIN-TANTALUM-LITHIUM Li2O tonnes
Spodumene Bridgetown-Greenbushes 90,400 5,077 n/a
Tantalite Bridgetown-Greenbushes 857 n/a
Coolgardie 48 n/a
Total 905 n/a
Sn Tonnes
Tin Bridgetown-Greenbushes 874 6,007,866
TOTAL TIN-TANTALUM-LITHIUM 225,840,014 (a)
V2O5 tonnes
VANADIUM Mt Magnet 5,190 27,128,981 (f)
TOTAL VALUE 26,271,933,591

WESTERN AUSTRALIA MINERAL AND PETROLEUM STATISTICS DIGEST 2001–0252 WESTERN AUSTRALIA MINERAL AND PETROLEUM STATISTICS DIGEST 2001–02 53
TABLE 4 ROYALTY RECEIPTS 2000–01 AND 2001–02
COMMODITY 2000–01 Total $
2001–02 Total $
2001–02 Growth
$ %
ALUMINA 55,512,739 61,408,085 5,895,346 11
BASE METALS
Copper 2,756,502 4,504,871 1,748,369 63
Lead 1,415,710 1,851,352 435,642 31
Zinc 13,743,529 8,958,802 -4,784,727 (35)
TOTAL BASE METALS 17,915,741 15,315,025 -2,600,716 (15)
CHROMITE 295,110 61,079 -234,031 (79)
CLAYS 121,172 84,783 -36,389 (30)
COAL 13,360,949 13,493,003 132,054 1
CONSTRUCTION MATERIALS
Aggregate 89,606 170,470 80,864 90
Gravel 53,532 55,287 1,755 3
Rock 83,889 71,869 -12,020 (14)
Sand 465,630 464,150 -1,480 (0)
TOTAL CONSTRUCTION MATERIALS 692,657 761,776 69,119 10
DIAMONDS 88,054,636 62,636,372 -25,418,264 (29)
DIMENSION STONE 691 747 56 8
GEM AND SEMI-PRECIOUS STONES 13,054 10,220 -2,834 (22)
GOLD 65,638,722 79,808,781 14,170,059 22
GYPSUM 381,215 528,524 147,309 39
HEAVY MINERAL SANDS
Garnet 537,933 641,345 103,412 19
Ilmenite 9,685,771 9,319,310 -366,461 (4)
Leucoxene 753,408 630,073 -123,335 (16)
Rutile 5,005,295 4,712,566 -292,729 (6)
Zircon 8,816,131 10,563,318 1,747,187 20
Staurolite 1,656 13,829 12,173 735
TOTAL HEAVY MINERAL SANDS 24,800,195 25,880,441 1,080,246 4
INDUSTRIAL PEGMATITE MINERALS
Feldspar 82,115 125,540 43,425 53
IRON ORE 270,188,217 276,089,286 5,901,069 2
LIMESAND-LIMESTONE-DOLOMITE
Dolomite 880 3,447 2,567 292
Limesand-Limestone 1,419,328 1,843,617 424,289 30
TOTAL LIMESAND-LIMESTONE-DOLOMITE 1,420,208 1,847,064 426,856 30
MANGANESE 2,842,057 3,569,154 727,097 26
NICKEL
Cobalt By-Product 2,864,994 2,145,843 -719,151 (25)
Nickel 56,743,210 46,273,109 -10,470,101 (19)
Palladium By-Product 830,063 737,548 -92,515 (11)
Platinum By-Product 130,956 108,621 -22,335 (17)
Rhodium By-Product 4,577 1,546 -3,031 (66)
TOTAL NICKEL INDUSTRY 60,573,800 49,266,667 -11,307,133 (19)
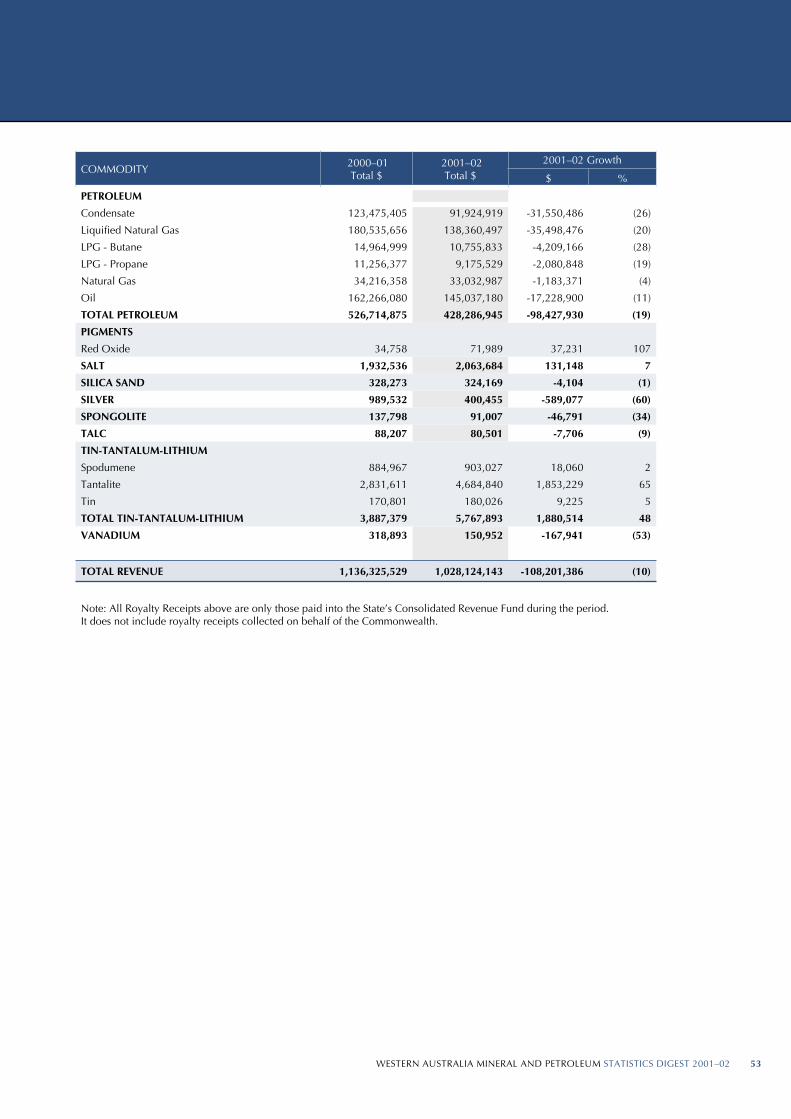
WESTERN AUSTRALIA MINERAL AND PETROLEUM STATISTICS DIGEST 2001–0252 WESTERN AUSTRALIA MINERAL AND PETROLEUM STATISTICS DIGEST 2001–02 53
COMMODITY 2000–01 Total $
2001–02 Total $
2001–02 Growth
$ %
PETROLEUM
Condensate 123,475,405 91,924,919 -31,550,486 (26)
Liquified Natural Gas 180,535,656 138,360,497 -35,498,476 (20)
LPG - Butane 14,964,999 10,755,833 -4,209,166 (28)
LPG - Propane 11,256,377 9,175,529 -2,080,848 (19)
Natural Gas 34,216,358 33,032,987 -1,183,371 (4)
Oil 162,266,080 145,037,180 -17,228,900 (11)
TOTAL PETROLEUM 526,714,875 428,286,945 -98,427,930 (19)
PIGMENTS
Red Oxide 34,758 71,989 37,231 107
SALT 1,932,536 2,063,684 131,148 7
SILICA SAND 328,273 324,169 -4,104 (1)
SILVER 989,532 400,455 -589,077 (60)
SPONGOLITE 137,798 91,007 -46,791 (34)
TALC 88,207 80,501 -7,706 (9)
TIN-TANTALUM-LITHIUM
Spodumene 884,967 903,027 18,060 2
Tantalite 2,831,611 4,684,840 1,853,229 65
Tin 170,801 180,026 9,225 5
TOTAL TIN-TANTALUM-LITHIUM 3,887,379 5,767,893 1,880,514 48
VANADIUM 318,893 150,952 -167,941 (53)
TOTAL REVENUE 1,136,325,529 1,028,124,143 -108,201,386 (10)
Note: All Royalty Receipts above are only those paid into the State’s Consolidated Revenue Fund during the period. It does not include royalty receipts collected on behalf of the Commonwealth.

WESTERN AUSTRALIA MINERAL AND PETROLEUM STATISTICS DIGEST 2001–0254 WESTERN AUSTRALIA MINERAL AND PETROLEUM STATISTICS DIGEST 2001–02 55
TABLE 5 AVERAGE NUMBER OF PERSONS EMPLOYED IN THE WA MINERAL AND PETROLEUM INDUSTRIES
MINERAL/Company Operating Site 2000–01 2001–02
ALUMINA
Australian Fused Materials Pty Ltd Rockingham Fused Alumina Plant 214 175
Alcoa World Alumina Australia Huntly 615 738
Jarrahdale 50 0
Kwinana Alumina Refinery 1,442 1,497
Pinjarra Refinery 1,426 1,435
Wagerup Alumina Refinery 929 980
Willowdale 253 314
Worsley Alumina Pty Ltd Worsley Tunnel Road 239 213
Worsley Refinery 1,251 1,262
TOTAL ALUMINA 6,419 6,614
BASE METALS
Normandy Mining Ltd Scuddles 324 303
Straits Resources Ltd Nifty 429 467
Western Metals Ltd Lennard Shelf 555 504
Various Other 9 4
TOTAL BASE METALS 1,317 1,278
COAL
Griffin Coal Mining Co. Pty Ltd Muja 313 284
Wesfarmers Coal Ltd Premier/WCL 384 378
TOTAL COAL 697 662
DIAMOND
Argyle Diamond Mines Pty Ltd Lake Argyle 956 1,060
GOLD
Agnew Gold Mining Company Pty Limited Emu 895 1,416
AngloGold Australia Ltd Sunrise Dam 404 660
Consolidated Gold Mines Limited Bannockburn 6 0
Australian Gold Resources Ltd Perth Mint 93 82
Barminco Pty Ltd Western Queen–Warda Warra 0 10
Barra Resources Ltd First Hit 0 14
Barrick Gold of Australia Limited Darlot 129 122
Lawlers 206 181
Plutonic 419 468
Big Bell Gold Operations Pty Ltd Big Bell Consolidated 409 479
Centaur Mining & Exploration Ltd Mt Pleasant 250 0
Central Norseman Gold Norseman 253 197
Croesus Mining NL Binduli 21 45
Mayday North 6 0
Hannan South 28 34
Davyhurst 43 97
Delta Gold NL Lady Ida Group 66 2
Kanowna Belle 344 332
Equigold NL Dalgaranga 67 15

WESTERN AUSTRALIA MINERAL AND PETROLEUM STATISTICS DIGEST 2001–0254 WESTERN AUSTRALIA MINERAL AND PETROLEUM STATISTICS DIGEST 2001–02 55
MINERAL/Company Operating Site 2000–01 2001–02
Gidgee Gold Pty Ltd Gidgee 91 92
Gindalbie Gold NL Minjar 0 49
Paddington Gold Pty Limited Paddington – Mt Pleasant 225 354
Normandy Mining Ltd Bronzewing – Mt McClure 247 423
Jundee–Nimary 594 511
Wiluna 276 308
Haoma Pty Ltd Normay 0 10
Hill 50 Gold NL Hill 50 – Mt Magnet 381 389
Kalgoorlie Consolidated Gold Mines Pty Ltd Golden Mile – SuperPit 1,141 1,294
King Solomon Mines Limited Gullewa 0 27
Kundana Gold Pty Ltd Kundana 291 256
LionOre Australia (Wildara) NL Thunderbox 0 38
Mines and Resources Australia Pty Ltd White Foil 0 48
New Hampton Goldfields Ltd Jubilee–New Hampton 222 207
Newcrest Mining Ltd Telfer 360 254
Nickelseekers Pty Limited Daisy-Milano 14 19
Perilya Mines NL Fortnum 50 0
Placer Dome Inc Granny Smith 497 571
Resolute Ltd Chalice 0 6
Higginsville Group 0 15
Sipa Resources International NL Mt Olympus 40 44
Sons of Gwalia NL Carosue Dam 197 223
Great Victoria Underground 11 1
Marvel Loch-Yilgarn Star 473 468
Sons of Gwalia 232 203
Tarmoola 358 327
South Kal Mines Pty Ltd New Celebration 138 152
St Barbara Mines Ltd Bluebird Group 224 314
St Ives Gold Mining Company Pty Limited Kambalda – St Ives 997 1,218
Troy Resources Ltd Mt Kemptz 42 52
Viceroy Resource Corporation Bounty 229 124
Worsley Alumina Pty Ltd Boddington 502 280
Other Various 17 27
TOTAL GOLD 10,593 12,458
HEAVY MINERAL SANDS
BHP Titanium Minerals Pty Ltd Beenup 31 33
Cable Sands Pty Ltd Bunbury 347 337
GMA Garnet Pty Ltd Narngulu Garnet Plant 24 31
Port Gregory – Hutt Laggoon 15 17
Hanwah Advanced Ceramics Australia Pty Ltd Rockingham Zirconia Plant 30 28
Iluka Resources Limited Capel 715 542
Eneabba 304 309
Narngulu Synthetic Rutile Plants 310 407
TiWest Pty Ltd Chandala–Muchea 251 207
Cooljarloo 281 291
TOTAL HEAVY MINERAL SANDS 2,308 2,202

WESTERN AUSTRALIA MINERAL AND PETROLEUM STATISTICS DIGEST 2001–0256 WESTERN AUSTRALIA MINERAL AND PETROLEUM STATISTICS DIGEST 2001–02 57
TABLE 5 AVERAGE NUMBER OF PERSONS EMPLOYED IN THE WA MINERAL AND PETROLEUM INDUSTRIES
MINERAL/Company Operating Site 2000–01 2001–02
IRON ORE
BHP Iron Ore (Goldsworthy) Ltd Finucane Island 211 265
Yarrie 213 190
BHP Iron Ore (Jimblebar) Ltd Jimblebar 109 113
BHP Iron Ore Ltd Mining Area C 0 20
Mt Newman Railway 357 365
Mt Whaleback 1,014 1,035
Nelson Point 641 756
Orebody 25 77 88
Port Hedland HBI Plant 1,089 885
Yandi 204 231
Hamersley Iron Pty Ltd Brockman No. 2 Detritals Group 193 91
Dampier Port Operations 995 756
HIsmelt–Kwinana 109 195
Marandoo 175 160
Paraburdoo–Channar 768 630
Hamersley Railway 393 289
Tom Price 1,049 939
Yandicoogina 216 223
West Angelas Rail 16 95
West Angelas Plant 108 191
West Angelas Port Facility 108 283
Portman Iron Ore Ltd Cockatoo Island 27 22
Koolyanobbing 50 106
Robe River Mining Co. Pty Ltd Cape Lambert 455 532
Pannawonica Deepdale 289 347
Robe River Railway 108 118
TOTAL IRON ORE 8,974 8,925
NICKEL
Anaconda Nickel Ltd Murrin Murrin 610 629
LionOre Australia (Nickel) Ltd Emily Ann 48 132
MacMahon Holdings Blair 58 5
OMG Cawse Pty Ltd Cawse 296 251
Outokumpu Mining Australia Pty Ltd Black Swan 259 270
Preston Resources Limited Bulong 287 303
Sir Samuel Mines NL Cosmos 73 70
Tectonic Resources NL Rav 8 102 62
Titan Resources NL Radio Hill 83 84
Western Mining Corporation Ltd Kalgoorlie Nickel Smelter 850 686
Kambalda 375 338
Kwinana Refinery 539 331
Leinster 911 873
Mt Keith 803 838
TOTAL NICKEL 5,294 4,872
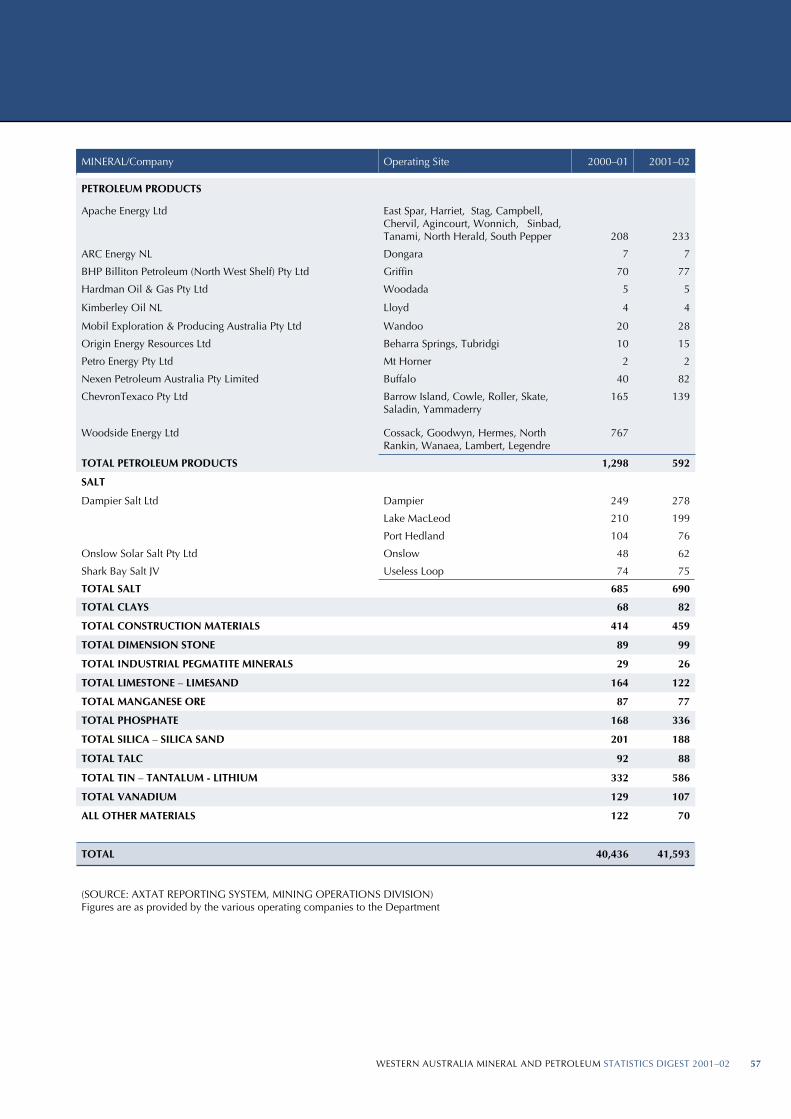
WESTERN AUSTRALIA MINERAL AND PETROLEUM STATISTICS DIGEST 2001–0256 WESTERN AUSTRALIA MINERAL AND PETROLEUM STATISTICS DIGEST 2001–02 57
MINERAL/Company Operating Site 2000–01 2001–02
PETROLEUM PRODUCTS
Apache Energy Ltd East Spar, Harriet, Stag, Campbell, Chervil, Agincourt, Wonnich, Sinbad, Tanami, North Herald, South Pepper 208 233
ARC Energy NL Dongara 7 7
BHP Billiton Petroleum (North West Shelf) Pty Ltd Griffin 70 77
Hardman Oil & Gas Pty Ltd Woodada 5 5
Kimberley Oil NL Lloyd 4 4
Mobil Exploration & Producing Australia Pty Ltd Wandoo 20 28
Origin Energy Resources Ltd Beharra Springs, Tubridgi 10 15
Petro Energy Pty Ltd Mt Horner 2 2
Nexen Petroleum Australia Pty Limited Buffalo 40 82
ChevronTexaco Pty Ltd Barrow Island, Cowle, Roller, Skate, Saladin, Yammaderry
165 139
Woodside Energy Ltd Cossack, Goodwyn, Hermes, North Rankin, Wanaea, Lambert, Legendre
767
TOTAL PETROLEUM PRODUCTS 1,298 592
SALT
Dampier Salt Ltd Dampier 249 278
Lake MacLeod 210 199
Port Hedland 104 76
Onslow Solar Salt Pty Ltd Onslow 48 62
Shark Bay Salt JV Useless Loop 74 75
TOTAL SALT 685 690
TOTAL CLAYS 68 82
TOTAL CONSTRUCTION MATERIALS 414 459
TOTAL DIMENSION STONE 89 99
TOTAL INDUSTRIAL PEGMATITE MINERALS 29 26
TOTAL LIMESTONE – LIMESAND 164 122
TOTAL MANGANESE ORE 87 77
TOTAL PHOSPHATE 168 336
TOTAL SILICA – SILICA SAND 201 188
TOTAL TALC 92 88
TOTAL TIN – TANTALUM - LITHIUM 332 586
TOTAL VANADIUM 129 107
ALL OTHER MATERIALS 122 70
TOTAL 40,436 41,593
(SOURCE: AXTAT REPORTING SYSTEM, MINING OPERATIONS DIVISION)Figures are as provided by the various operating companies to the Department
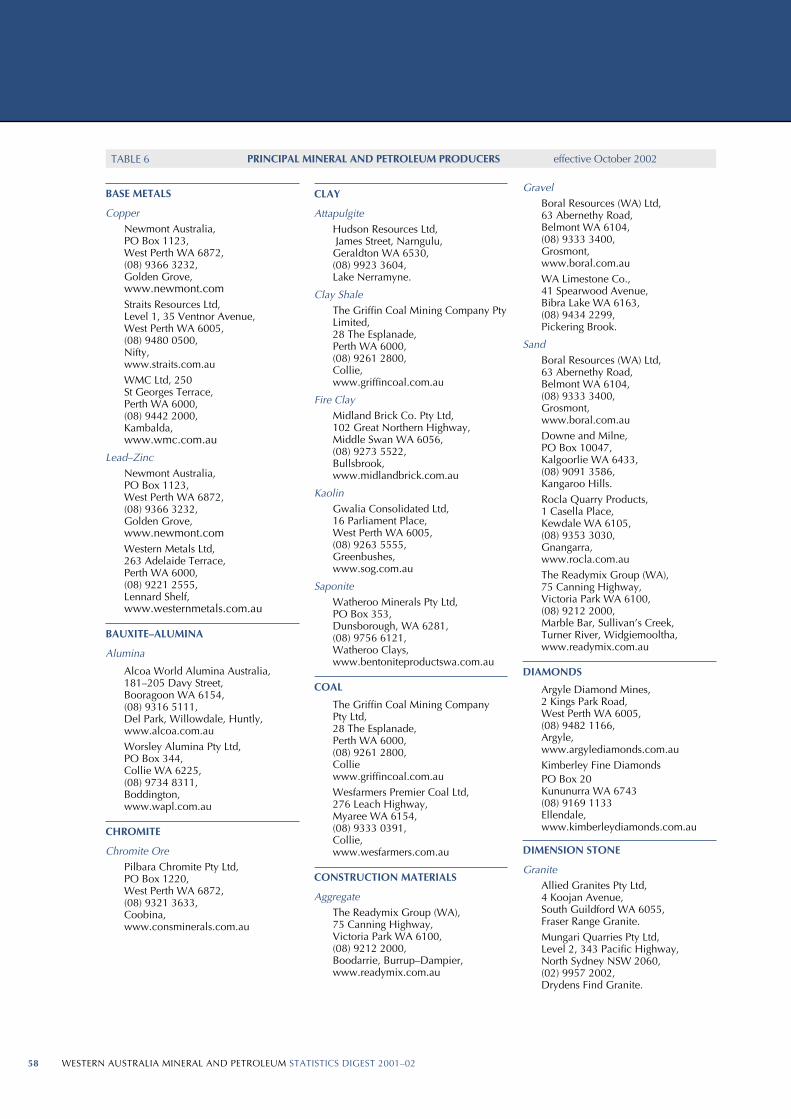
WESTERN AUSTRALIA MINERAL AND PETROLEUM STATISTICS DIGEST 2001–0258 WESTERN AUSTRALIA MINERAL AND PETROLEUM STATISTICS DIGEST 2001–02 59
BASE METALS
CopperNewmont Australia, PO Box 1123,West Perth WA 6872, (08) 9366 3232, Golden Grove,www.newmont.comStraits Resources Ltd, Level 1, 35 Ventnor Avenue, West Perth WA 6005, (08) 9480 0500, Nifty, www.straits.com.auWMC Ltd, 250 St Georges Terrace, Perth WA 6000, (08) 9442 2000, Kambalda, www.wmc.com.au
Lead–ZincNewmont Australia, PO Box 1123, West Perth WA 6872, (08) 9366 3232, Golden Grove,www.newmont.comWestern Metals Ltd, 263 Adelaide Terrace, Perth WA 6000, (08) 9221 2555, Lennard Shelf,www.westernmetals.com.au
BAUXITE–ALUMINA
Alumina
Alcoa World Alumina Australia, 181–205 Davy Street, Booragoon WA 6154, (08) 9316 5111,Del Park, Willowdale, Huntly, www.alcoa.com.auWorsley Alumina Pty Ltd, PO Box 344, Collie WA 6225, (08) 9734 8311, Boddington, www.wapl.com.au
CHROMITE
Chromite OrePilbara Chromite Pty Ltd, PO Box 1220, West Perth WA 6872, (08) 9321 3633, Coobina, www.consminerals.com.au
CLAY
AttapulgiteHudson Resources Ltd, James Street, Narngulu, Geraldton WA 6530, (08) 9923 3604, Lake Nerramyne.
Clay ShaleThe Griffin Coal Mining Company Pty Limited, 28 The Esplanade, Perth WA 6000, (08) 9261 2800, Collie,www.griffincoal.com.au
Fire ClayMidland Brick Co. Pty Ltd, 102 Great Northern Highway, Middle Swan WA 6056, (08) 9273 5522, Bullsbrook, www.midlandbrick.com.au
KaolinGwalia Consolidated Ltd, 16 Parliament Place, West Perth WA 6005, (08) 9263 5555, Greenbushes, www.sog.com.au
SaponiteWatheroo Minerals Pty Ltd, PO Box 353, Dunsborough, WA 6281, (08) 9756 6121, Watheroo Clays,www.bentoniteproductswa.com.au
COAL
The Griffin Coal Mining Company Pty Ltd, 28 The Esplanade, Perth WA 6000, (08) 9261 2800, Colliewww.griffincoal.com.au Wesfarmers Premier Coal Ltd, 276 Leach Highway, Myaree WA 6154, (08) 9333 0391, Collie,www.wesfarmers.com.au
CONSTRUCTION MATERIALS
AggregateThe Readymix Group (WA), 75 Canning Highway, Victoria Park WA 6100, (08) 9212 2000, Boodarrie, Burrup–Dampier, www.readymix.com.au
GravelBoral Resources (WA) Ltd, 63 Abernethy Road, Belmont WA 6104, (08) 9333 3400, Grosmont, www.boral.com.auWA Limestone Co., 41 Spearwood Avenue, Bibra Lake WA 6163, (08) 9434 2299, Pickering Brook.
SandBoral Resources (WA) Ltd, 63 Abernethy Road, Belmont WA 6104, (08) 9333 3400, Grosmont, www.boral.com.au Downe and Milne, PO Box 10047,Kalgoorlie WA 6433, (08) 9091 3586, Kangaroo Hills.Rocla Quarry Products, 1 Casella Place, Kewdale WA 6105, (08) 9353 3030, Gnangarra, www.rocla.com.au The Readymix Group (WA), 75 Canning Highway, Victoria Park WA 6100, (08) 9212 2000, Marble Bar, Sullivan’s Creek, Turner River, Widgiemooltha, www.readymix.com.au
DIAMONDS
Argyle Diamond Mines, 2 Kings Park Road, West Perth WA 6005, (08) 9482 1166,Argyle, www.argylediamonds.com.au Kimberley Fine DiamondsPO Box 20Kununurra WA 6743(08) 9169 1133Ellendale, www.kimberleydiamonds.com.au
DIMENSION STONE
GraniteAllied Granites Pty Ltd, 4 Koojan Avenue, South Guildford WA 6055, Fraser Range Granite.Mungari Quarries Pty Ltd, Level 2, 343 Pacific Highway, North Sydney NSW 2060, (02) 9957 2002, Drydens Find Granite.
TABLE 6 PRINCIPAL MINERAL AND PETROLEUM PRODUCERS effective October 2002

WESTERN AUSTRALIA MINERAL AND PETROLEUM STATISTICS DIGEST 2001–0258 WESTERN AUSTRALIA MINERAL AND PETROLEUM STATISTICS DIGEST 2001–02 59
FELDSPAR
Unimin Australia Ltd, 26–28 Tomlinson Road, Welshpool WA 6106, (08) 9362 1411, Pippingarra, Mukinbudin, www.unimin.com.au
GOLD
Abelle Limited, 35 Ventnor Avenue, West Perth WA 6005, (08) 9485 1476, Gidgee, www.abelle.com.au Agnew Gold Mining Co Pty Ltd, PMB 10, Leinster WA 6437, (08) 9088 3847, Agnew, www.goldfields.co.za AngloGold Australia Ltd, Level 13, 44 St Georges Terrace, Perth WA 6000, (08) 9425 4600, Sunrise Dam, www.anglogold.comAurionGold Limited, PO Box 322, Victoria Park WA 6979, (08) 9442 8100, Golden Feather, Kanowna Belle, Kundana East, Mt Pleasant, Paddington, White Foil, www.auriongold.com.au Croesus Mining NL, 39 Porter Street, Kalgoorlie WA 6430, (08) 9091 2222, Binduli, Central Norseman, Davyhurst, www.croesus.com.au Gidgee Gold Mine, PO Box 685, West Perth WA 6872, (08) 9485 1476, Gidgee.Gindalbi Gold NL, PO Box 512, West Perth WA 6872, (08) 9481 2232, Minjar.Harmony Gold (Australia) Pty Ltd, 10 Ord Street, West Perth WA 6005, (08) 9211 3100, Big Bell, Jubilee, New Celebration, Mt Magnet, www.harmony.co.za Barrick Gold of Australia Limited, 2 Mill Street, Perth WA 6000, (08) 9212 5777, Darlot, Lawlers, Plutonic, www.barrick.com
Kalgoorlie Consolidated Gold Mines Pty Ltd, Private Bag 27, Kalgoorlie WA 6433, (08) 9022 1100, Golden Mile, www.kalgold.com.au Menzies Gold Ltd, 122 Kewdale Road, Kewdale WA 6105, (08) 9353 7200, King Solomon, www.menziesgold.com.au Mines and Resources Australia Pty Ltd, 256 Adelaide Terrace, Perth WA 6000, (08) 9202 1100, White Foil, www.cogema.fr Newmont Australia, 100 Hutt Street, Adelaide SA 5000, (08) 8303 1700, Bronzewing-Mt McClure, Jundee, Nimary, Wiluna, www.newmont.com Placer (Granny Smith) Pty Ltd, PO Box 33, Laverton WA 6440, (08) 9088 2217,Granny Smith, www.placerdome.com Sipa Resources International NL, 87 Colin Steet,West Perth WA 6005, (08) 9481 6259,
Paraburdoo–Mt Olympus, www.sipa.com.au Sons of Gwalia Ltd, 16 Parliament Place, West Perth WA 6005, (08) 9263 5555, Bullfinch, Carosue Dam, Marvel Loch – Southern Cross, Sons of Gwalia, Tarmoola, www.sog.com.au St Barbara Mines Ltd, Level 2, 16 Ord Street, West Perth WA 6005 (08) 9476 5555, Meekatharra. www.stbarbara.com.au St Ives Gold Mining Co Pty Ltd, c/- Kambalda Post Office, Kambalda WA 6442, (08) 9088 1111, St Ives, www.goldfields.co.za Troy Resources NL, 44 Ord Street, West Perth WA 6005, (08) 9481 1277, Bulchina – Mt Klemptz, www.try.com.au
Worsley Alumina Pty Ltd, PO Box 48, Boddington WA 6390, (08) 9883 8260, Boddington, www.wapl.com.au
GYPSUM
Cockburn Cement Ltd, Russell Road, East Munster WA 6166, (08) 9411 1000, Lake Hillman.CSR Limited, 21 Sheffield Road, Welshpool WA 6106, (08) 9365 1686, Jurien Bay North.Dampier Salt (Operations) Pty Ltd, 152 St Georges Terrace, Perth WA 6000, (08) 9327 2257, Lake MacLeod, www.dampiersalt.com.au Gypsum Industries, 7 Armstrong Road, Applecross WA 6153, (08) 9364 4951, Lake Cowcowing.
HEAVY MINERAL SANDS
Garnet SandGMA Garnet Pty Ltd, PO Box 188, Geraldton WA 6531, (08) 9923 3644, Port Gregory, www.gmagarnet.com
Ilmenite, Leucoxene, Rutile and Zircon Cable Sands (WA) Pty Ltd, PO Box 133, Bunbury WA 6231, (08) 9721 0200, Jangardup, Sandalwood, Yarloop, www.cablesands,com.au Iluka Resources Ltd, 5th Floor, 553 Hay Street, Perth WA 6000, (08) 9221 7611, Capel, Eneabba, Yoganup, Stratham, www.iluka.com TiWest Pty Ltd, 1 Brodie-Hall Drive, Bentley WA 6102, (08) 9365 1333, Cooljarloo, www.tiwest.com.au
TABLE 6 PRINCIPAL MINERAL AND PETROLEUM PRODUCERS effective October 2002
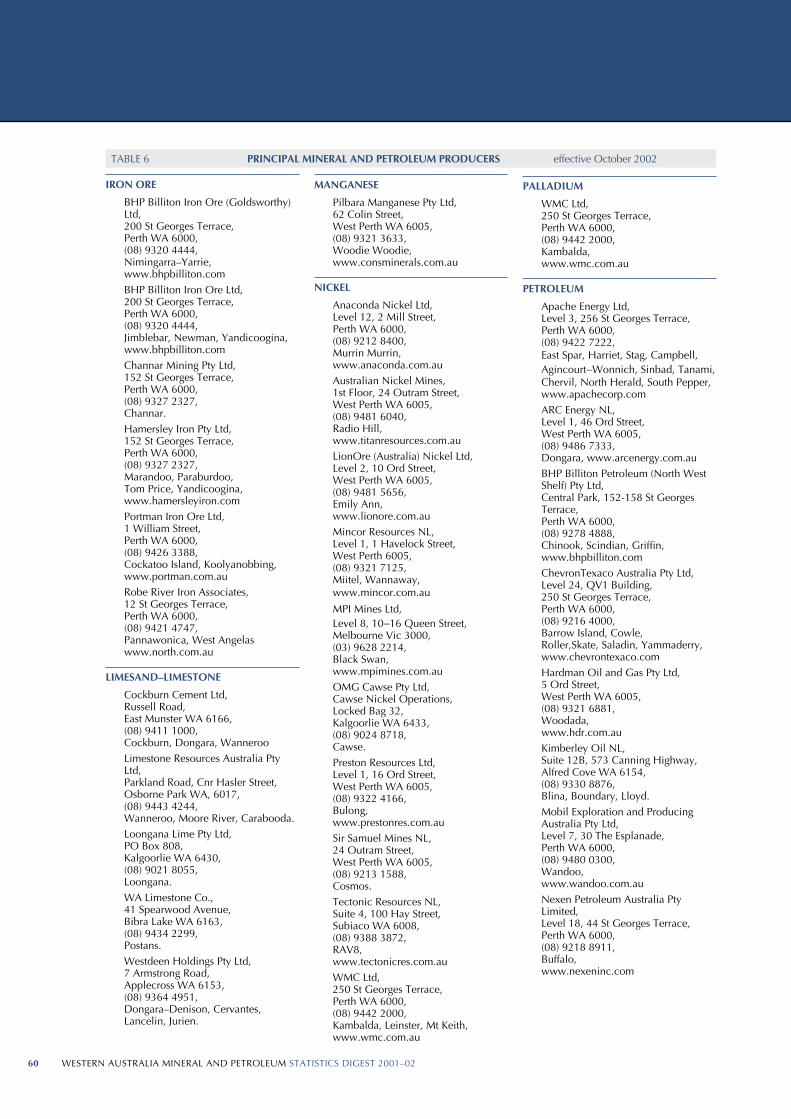
WESTERN AUSTRALIA MINERAL AND PETROLEUM STATISTICS DIGEST 2001–0260 WESTERN AUSTRALIA MINERAL AND PETROLEUM STATISTICS DIGEST 2001–02 61
IRON ORE
BHP Billiton Iron Ore (Goldsworthy) Ltd, 200 St Georges Terrace, Perth WA 6000, (08) 9320 4444, Nimingarra–Yarrie, www.bhpbilliton.comBHP Billiton Iron Ore Ltd, 200 St Georges Terrace, Perth WA 6000, (08) 9320 4444, Jimblebar, Newman, Yandicoogina, www.bhpbilliton.com Channar Mining Pty Ltd, 152 St Georges Terrace, Perth WA 6000, (08) 9327 2327, Channar.Hamersley Iron Pty Ltd, 152 St Georges Terrace, Perth WA 6000, (08) 9327 2327, Marandoo, Paraburdoo, Tom Price, Yandicoogina, www.hamersleyiron.com Portman Iron Ore Ltd, 1 William Street, Perth WA 6000, (08) 9426 3388, Cockatoo Island, Koolyanobbing, www.portman.com.au Robe River Iron Associates, 12 St Georges Terrace, Perth WA 6000, (08) 9421 4747, Pannawonica, West Angelas www.north.com.au
LIMESAND–LIMESTONE
Cockburn Cement Ltd, Russell Road, East Munster WA 6166, (08) 9411 1000, Cockburn, Dongara, WannerooLimestone Resources Australia Pty Ltd, Parkland Road, Cnr Hasler Street, Osborne Park WA, 6017, (08) 9443 4244, Wanneroo, Moore River, Carabooda.Loongana Lime Pty Ltd, PO Box 808, Kalgoorlie WA 6430, (08) 9021 8055, Loongana.WA Limestone Co., 41 Spearwood Avenue, Bibra Lake WA 6163, (08) 9434 2299, Postans.Westdeen Holdings Pty Ltd, 7 Armstrong Road, Applecross WA 6153, (08) 9364 4951, Dongara–Denison, Cervantes, Lancelin, Jurien.
MANGANESE
Pilbara Manganese Pty Ltd, 62 Colin Street, West Perth WA 6005, (08) 9321 3633, Woodie Woodie, www.consminerals.com.au
NICKEL
Anaconda Nickel Ltd, Level 12, 2 Mill Street, Perth WA 6000, (08) 9212 8400, Murrin Murrin, www.anaconda.com.au Australian Nickel Mines, 1st Floor, 24 Outram Street, West Perth WA 6005, (08) 9481 6040, Radio Hill, www.titanresources.com.au LionOre (Australia) Nickel Ltd, Level 2, 10 Ord Street, West Perth WA 6005, (08) 9481 5656, Emily Ann, www.lionore.com.au Mincor Resources NL, Level 1, 1 Havelock Street, West Perth 6005, (08) 9321 7125, Miitel, Wannaway, www.mincor.com.au
MPI Mines Ltd, Level 8, 10–16 Queen Street, Melbourne Vic 3000, (03) 9628 2214, Black Swan, www.mpimines.com.au OMG Cawse Pty Ltd, Cawse Nickel Operations, Locked Bag 32, Kalgoorlie WA 6433, (08) 9024 8718, Cawse. Preston Resources Ltd, Level 1, 16 Ord Street, West Perth WA 6005, (08) 9322 4166, Bulong, www.prestonres.com.au Sir Samuel Mines NL, 24 Outram Street, West Perth WA 6005, (08) 9213 1588, Cosmos.Tectonic Resources NL, Suite 4, 100 Hay Street, Subiaco WA 6008, (08) 9388 3872, RAV8, www.tectonicres.com.au WMC Ltd, 250 St Georges Terrace, Perth WA 6000, (08) 9442 2000, Kambalda, Leinster, Mt Keith, www.wmc.com.au
PALLADIUM
WMC Ltd, 250 St Georges Terrace, Perth WA 6000, (08) 9442 2000,Kambalda, www.wmc.com.au
PETROLEUM
Apache Energy Ltd, Level 3, 256 St Georges Terrace, Perth WA 6000, (08) 9422 7222, East Spar, Harriet, Stag, Campbell, Agincourt–Wonnich, Sinbad, Tanami, Chervil, North Herald, South Pepper, www.apachecorp.com ARC Energy NL, Level 1, 46 Ord Street, West Perth WA 6005, (08) 9486 7333, Dongara, www.arcenergy.com.auBHP Billiton Petroleum (North West Shelf) Pty Ltd, Central Park, 152-158 St Georges Terrace, Perth WA 6000, (08) 9278 4888, Chinook, Scindian, Griffin, www.bhpbilliton.comChevronTexaco Australia Pty Ltd, Level 24, QV1 Building, 250 St Georges Terrace, Perth WA 6000, (08) 9216 4000, Barrow Island, Cowle, Roller,Skate, Saladin, Yammaderry, www.chevrontexaco.com Hardman Oil and Gas Pty Ltd, 5 Ord Street, West Perth WA 6005, (08) 9321 6881, Woodada, www.hdr.com.au Kimberley Oil NL, Suite 12B, 573 Canning Highway, Alfred Cove WA 6154, (08) 9330 8876, Blina, Boundary, Lloyd.Mobil Exploration and Producing Australia Pty Ltd, Level 7, 30 The Esplanade, Perth WA 6000, (08) 9480 0300, Wandoo, www.wandoo.com.au Nexen Petroleum Australia Pty Limited, Level 18, 44 St Georges Terrace, Perth WA 6000, (08) 9218 8911, Buffalo, www.nexeninc.com
TABLE 6 PRINCIPAL MINERAL AND PETROLEUM PRODUCERS effective October 2002
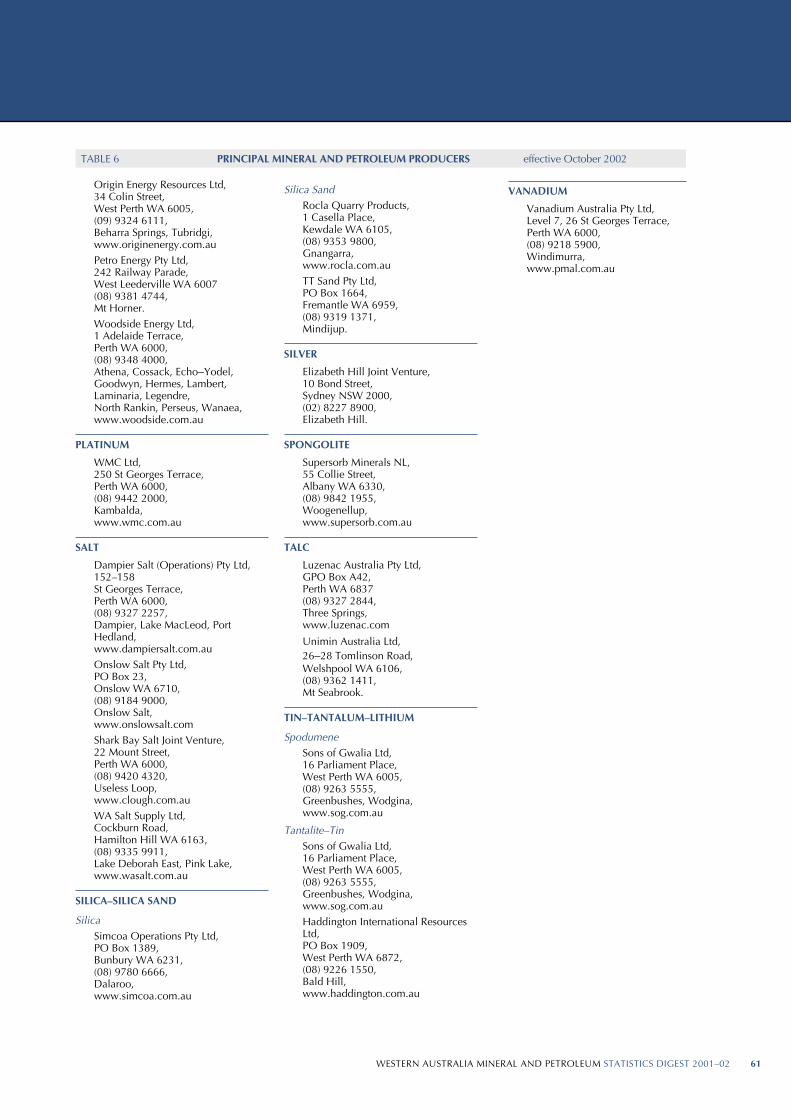
WESTERN AUSTRALIA MINERAL AND PETROLEUM STATISTICS DIGEST 2001–0260 WESTERN AUSTRALIA MINERAL AND PETROLEUM STATISTICS DIGEST 2001–02 61
Origin Energy Resources Ltd, 34 Colin Street, West Perth WA 6005, (09) 9324 6111, Beharra Springs, Tubridgi, www.originenergy.com.auPetro Energy Pty Ltd, 242 Railway Parade, West Leederville WA 6007 (08) 9381 4744, Mt Horner.Woodside Energy Ltd, 1 Adelaide Terrace, Perth WA 6000, (08) 9348 4000, Athena, Cossack, Echo–Yodel, Goodwyn, Hermes, Lambert, Laminaria, Legendre, North Rankin, Perseus, Wanaea, www.woodside.com.au
PLATINUM
WMC Ltd, 250 St Georges Terrace, Perth WA 6000, (08) 9442 2000, Kambalda, www.wmc.com.au
SALT
Dampier Salt (Operations) Pty Ltd, 152–158 St Georges Terrace, Perth WA 6000, (08) 9327 2257, Dampier, Lake MacLeod, Port Hedland, www.dampiersalt.com.au Onslow Salt Pty Ltd, PO Box 23, Onslow WA 6710, (08) 9184 9000, Onslow Salt, www.onslowsalt.com Shark Bay Salt Joint Venture, 22 Mount Street, Perth WA 6000, (08) 9420 4320, Useless Loop, www.clough.com.au WA Salt Supply Ltd, Cockburn Road, Hamilton Hill WA 6163, (08) 9335 9911, Lake Deborah East, Pink Lake, www.wasalt.com.au
SILICA–SILICA SAND
SilicaSimcoa Operations Pty Ltd, PO Box 1389, Bunbury WA 6231, (08) 9780 6666, Dalaroo, www.simcoa.com.au
TABLE 6 PRINCIPAL MINERAL AND PETROLEUM PRODUCERS effective October 2002
Silica SandRocla Quarry Products, 1 Casella Place, Kewdale WA 6105, (08) 9353 9800, Gnangarra, www.rocla.com.au TT Sand Pty Ltd, PO Box 1664, Fremantle WA 6959, (08) 9319 1371, Mindijup.
SILVER
Elizabeth Hill Joint Venture, 10 Bond Street, Sydney NSW 2000, (02) 8227 8900, Elizabeth Hill.
SPONGOLITE
Supersorb Minerals NL, 55 Collie Street, Albany WA 6330, (08) 9842 1955, Woogenellup, www.supersorb.com.au
TALC
Luzenac Australia Pty Ltd, GPO Box A42, Perth WA 6837 (08) 9327 2844, Three Springs, www.luzenac.com
Unimin Australia Ltd, 26–28 Tomlinson Road, Welshpool WA 6106, (08) 9362 1411, Mt Seabrook.
TIN–TANTALUM–LITHIUM
SpodumeneSons of Gwalia Ltd, 16 Parliament Place, West Perth WA 6005, (08) 9263 5555, Greenbushes, Wodgina, www.sog.com.au
Tantalite–TinSons of Gwalia Ltd, 16 Parliament Place, West Perth WA 6005, (08) 9263 5555, Greenbushes, Wodgina, www.sog.com.auHaddington International Resources Ltd, PO Box 1909, West Perth WA 6872, (08) 9226 1550, Bald Hill, www.haddington.com.au
VANADIUM
Vanadium Australia Pty Ltd, Level 7, 26 St Georges Terrace, Perth WA 6000, (08) 9218 5900, Windimurra,www.pmal.com.au
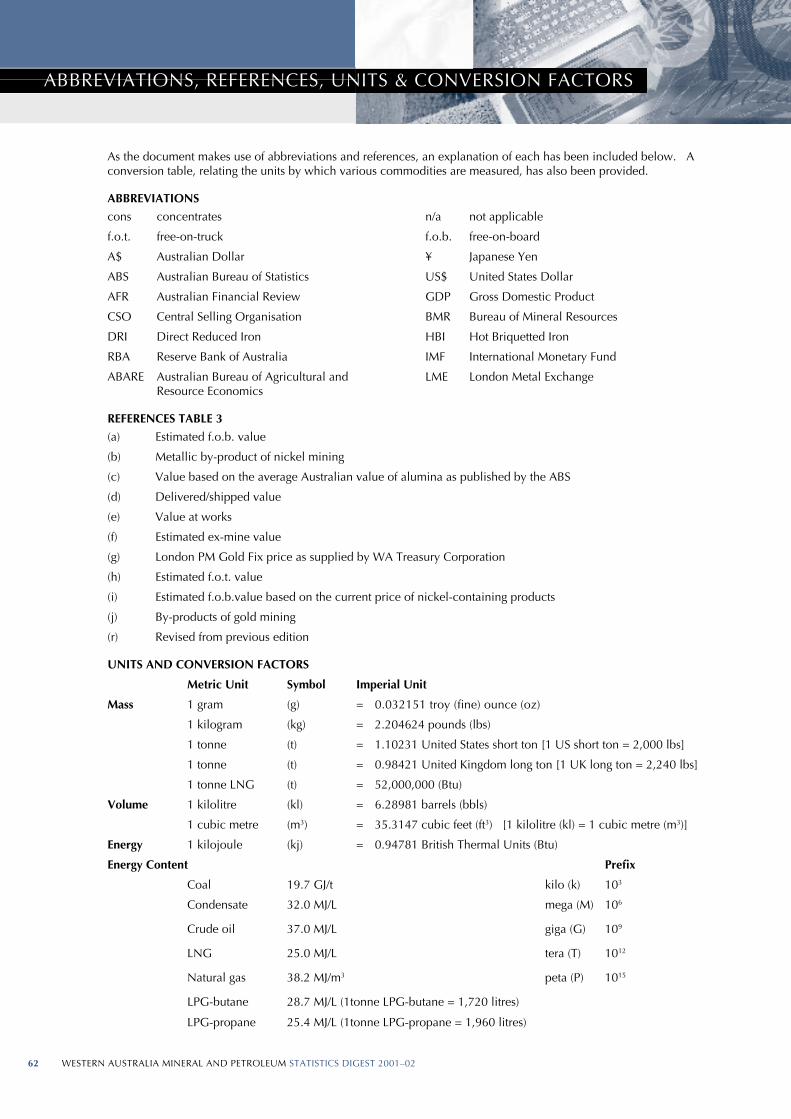
WESTERN AUSTRALIA MINERAL AND PETROLEUM STATISTICS DIGEST 2001–0262 WESTERN AUSTRALIA MINERAL AND PETROLEUM STATISTICS DIGEST 2001–02 63
ABBREVIATIONS, REFERENCES, UNITS & CONVERSION FACTORS
As the document makes use of abbreviations and references, an explanation of each has been included below. A conversion table, relating the units by which various commodities are measured, has also been provided.
ABBREVIATIONS
cons concentrates n/a not applicable
f.o.t. free-on-truck f.o.b. free-on-board
A$ Australian Dollar ¥ Japanese Yen
ABS Australian Bureau of Statistics US$ United States Dollar
AFR Australian Financial Review GDP Gross Domestic Product
CSO Central Selling Organisation BMR Bureau of Mineral Resources
DRI Direct Reduced Iron HBI Hot Briquetted Iron
RBA Reserve Bank of Australia IMF International Monetary Fund
ABARE Australian Bureau of Agricultural and LME London Metal Exchange Resource Economics
REFERENCES TABLE 3
(a) Estimated f.o.b. value
(b) Metallic by-product of nickel mining
(c) Value based on the average Australian value of alumina as published by the ABS
(d) Delivered/shipped value
(e) Value at works
(f) Estimated ex-mine value
(g) London PM Gold Fix price as supplied by WA Treasury Corporation
(h) Estimated f.o.t. value
(i) Estimated f.o.b.value based on the current price of nickel-containing products
(j) By-products of gold mining
(r) Revised from previous edition
UNITS AND CONVERSION FACTORS
Metric Unit Symbol Imperial Unit
Mass 1 gram (g) = 0.032151 troy (fi ne) ounce (oz)
1 kilogram (kg) = 2.204624 pounds (lbs)
1 tonne (t) = 1.10231 United States short ton [1 US short ton = 2,000 lbs]
1 tonne (t) = 0.98421 United Kingdom long ton [1 UK long ton = 2,240 lbs]
1 tonne LNG (t) = 52,000,000 (Btu)
Volume 1 kilolitre (kl) = 6.28981 barrels (bbls)
1 cubic metre (m3) = 35.3147 cubic feet (ft3) [1 kilolitre (kl) = 1 cubic metre (m3)]
Energy 1 kilojoule (kj) = 0.94781 British Thermal Units (Btu)
Energy Content Prefi x
Coal 19.7 GJ/t kilo (k) 103
Condensate 32.0 MJ/L mega (M) 106
Crude oil 37.0 MJ/L giga (G) 109
LNG 25.0 MJ/L tera (T) 1012
Natural gas 38.2 MJ/m3 peta (P) 1015
LPG-butane 28.7 MJ/L (1tonne LPG-butane = 1,720 litres)
LPG-propane 25.4 MJ/L (1tonne LPG-propane = 1,960 litres)

WESTERN AUSTRALIA MINERAL AND PETROLEUM STATISTICS DIGEST 2001–0262 WESTERN AUSTRALIA MINERAL AND PETROLEUM STATISTICS DIGEST 2001–02 63
DATA SOURCES
DATA SOURCES
Quantities for minerals and petroleum in this publication are collected by the Department’s Royalty Branch and are
based on information provided by the producers in royalty and production returns. The quantities specifi ed relate to
either mine production or sales as listed below for each commodity.
Mine Production
Clays
Coal
Construction Materials
Dimension Stone
Gypsum
Limesand -Limestone -Dolomite
Silica - Silica Sand
Talc
Sales
Alumina
Base Metals (Copper, Lead and Zinc)
Chromite
Diamonds
Gem and Semi-Precious Stones
Gold
Heavy Mineral Sands
Industrial Pegmatite Minerals
Iron Ore
Manganese
Nickel Industry (Nickel, Cobalt, Platinum and Palladium)
Petroleum
Pigments
Salt
Silver
Spongolite
Tin -Tantalum - Lithium
Vanadium
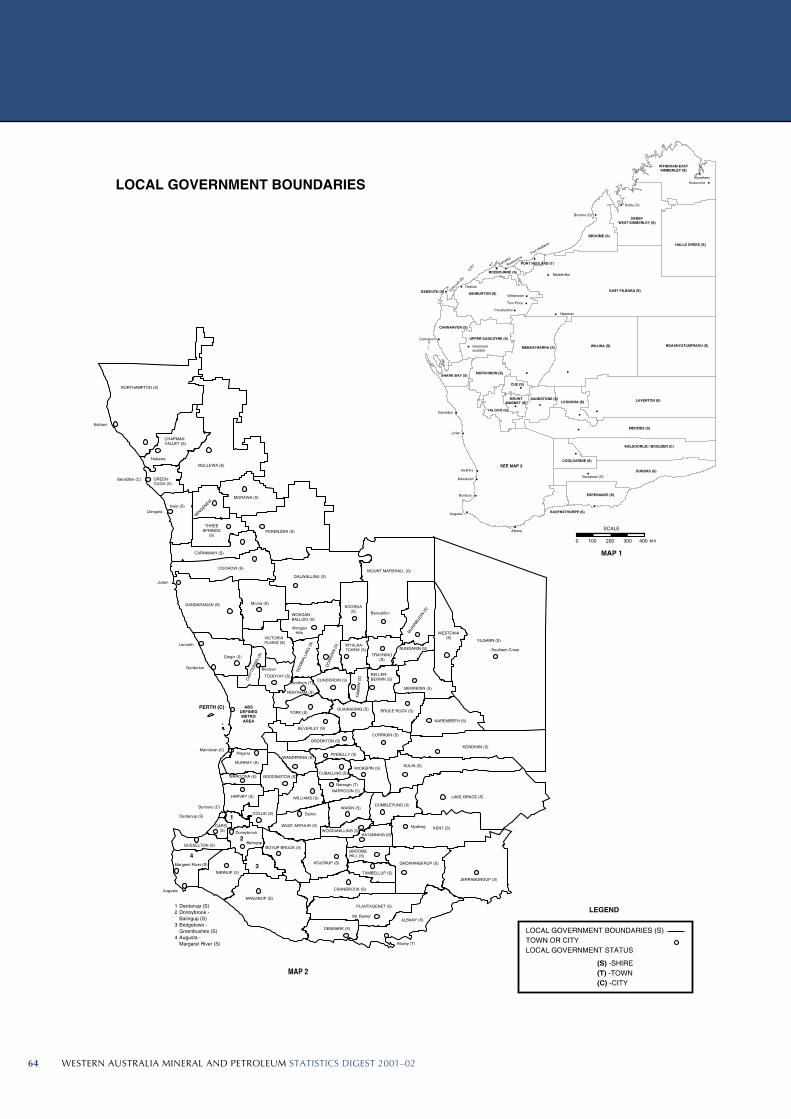
WESTERN AUSTRALIA MINERAL AND PETROLEUM STATISTICS DIGEST 2001–0264 WESTERN AUSTRALIA MINERAL AND PETROLEUM STATISTICS DIGEST 2001–02 65

WESTERN AUSTRALIA MINERAL AND PETROLEUM STATISTICS DIGEST 2001–0264 WESTERN AUSTRALIA MINERAL AND PETROLEUM STATISTICS DIGEST 2001–02 65
Argyle
Cockatoo Island
NiftyWodgina
Plutonic
Port Hedland
Radio Hill
PannawonicaSaladin
Griffin
Tom Price–Paraburdoo
ChannarParaburdoo
Newman
Yandicoogina
Roller/Skate
WandooStag
Barrow Island
Harriet
HermesNorth Rankin
East Spar Dampier
GoodwynCossack
Useless Loop
Bluebird Wiluna
Big Bell GidgeeMt Keith
Leinster DarlotLawlers
Dalgaranga
Jundee–Nimary
Agnew
Tarmoola
Sons of GwaliaGranny SmithPort Gregory
Dongara
Woodada Eneabba
Three Springs
Cooljarloo
WillowdaleBoddington
Greenbushes
Bounty
JangardupYoganupCapel
Boddington–HedgesDel Park Huntly
Collie/GriffinCollie/Wesfarmers
Yarrie
Koolyanobbing
MAJOR MINERAL AND PETROLEUM PROJECTSIN WESTERN AUSTRALIA
Wanaea
Sunrise Dam
Beharra Springs
Tubridgi
15.10.02
200 km
Murrin Murrin
Woodie Woodie
Lake MacLeod GypsumLake MacLeod Salt
v
v
Vanadium
Bronzewing-Mt McClureCosmos
RAV8
Woogenellup
Base metalsBauxite–AluminaCoalDiamondsGoldHeavy Mineral SandsGypsumIron Ore
ManganeseNickelPetroleumSaltSpongoliteTalcTin–Tantalum–Lithium
s
s
Lambert
DJF112b
Legendre
Mt Pleasant
Kundana
JubileeKambalda
Paddington
Central Norseman
Kanowna Belle
Golden MileNew Celebration
St Ives
Cawse
Bulong
Carosue Dam
Blair
Davyhurst
Black Swan
Lennard Shelf
Marvel Loch–Southern Cross
Hill 50–Mt Magnet
Sandalwood
Miitel
Onslow Salt
Bald Hill
Lady Ida
Golden GroveWindimurra
Minjar
Riverina
BinduliWhite Foil
West Angelas
Emily Ann
Athena
Echo/Yodel
SEEENLARGEMENT
Mt Pleasant
Kundana
JubileeKambalda
Paddington
Central Norseman
Kanowna Belle
Golden MileNew Celebration
St Ives
Cawse
Bulong
Carosue Dam
Blair
Davyhurst
50 km
Black Swan
MiitelBald Hill
Lady Ida
BinduliWhite Foil
Emily Ann
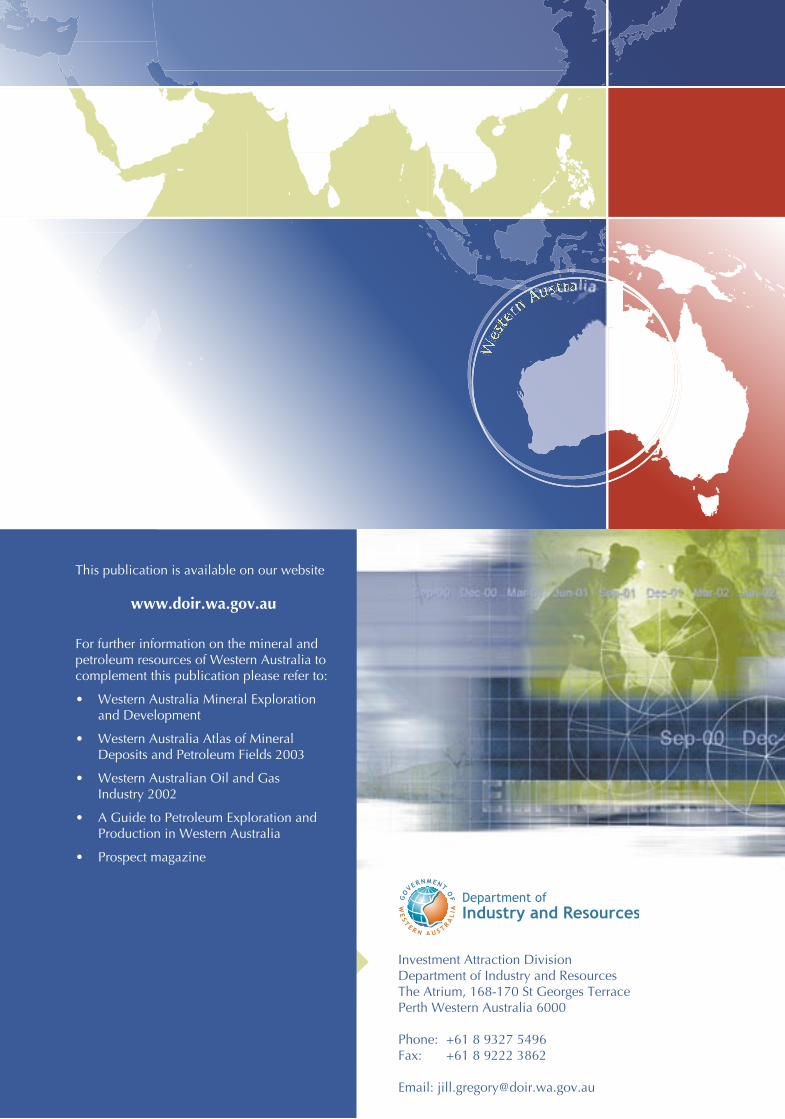
Wes
te
rnAustr li
Wes
te
rnAustrali
Investment Attraction DivisionDepartment of Industry and ResourcesThe Atrium, 168-170 St Georges TerracePerth Western Australia 6000
Phone: +61 8 9327 5496Fax: +61 8 9222 3862
Email: [email protected]
This publication is available on our website
www.doir.wa.gov.au
For further information on the mineral and petroleum resources of Western Australia to complement this publication please refer to:
• Western Australia Mineral Exploration and Development
• Western Australia Atlas of Mineral Deposits and Petroleum Fields 2003
• Western Australian Oil and Gas Industry 2002
• A Guide to Petroleum Exploration and Production in Western Australia
• Prospect magazine
ssssttttttttrr iiAAAAAAuussuussssssttrraaaaaa
Mineral and PetroleumStatistics Digest
2001-02
Top Related